highlights - philippine statistics authorityrsso02.psa.gov.ph/sites/default/files/sr 2018-17... ·...
TRANSCRIPT

HIGHLIGHTS
The Cagayan Valley livestock and poultry production estimates
decreased by 3.71 and 0.41 percent, respectively in the
First Semester of 2018 compared to same period
of last year.
LIVESTOCK
The total volume of livestock production in January to June 2018 was estimated at 47,158 metric tons. This was 3.71 percent lower than the 2017 production of 48,973 metric tons. Carabao, Cattle and Swine production posted negative growth this year at 5.44 percent, 4.13 percent and 3.60 percent, respectively. These three animals contributed in the reduction of the 2018 production by 1,869 metric tons. On the other hand, goat production expanded by 7.14 percent.
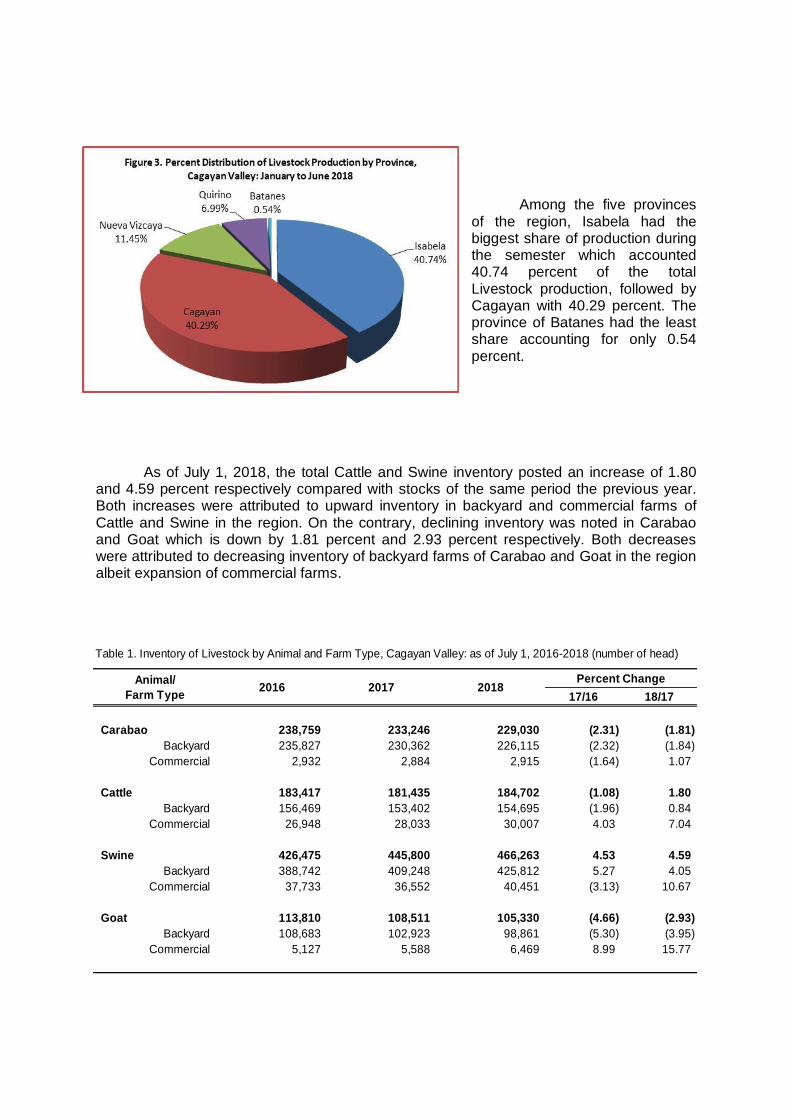
Among the five provinces
of the region, Isabela had the biggest share of production during the semester which accounted 40.74 percent of the total Livestock production, followed by Cagayan with 40.29 percent. The province of Batanes had the least share accounting for only 0.54 percent.
As of July 1, 2018, the total Cattle and Swine inventory posted an increase of 1.80 and 4.59 percent respectively compared with stocks of the same period the previous year. Both increases were attributed to upward inventory in backyard and commercial farms of Cattle and Swine in the region. On the contrary, declining inventory was noted in Carabao and Goat which is down by 1.81 percent and 2.93 percent respectively. Both decreases were attributed to decreasing inventory of backyard farms of Carabao and Goat in the region albeit expansion of commercial farms.
Table 1. Inventory of Livestock by Animal and Farm Type, Cagayan Valley: as of July 1, 2016-2018 (number of head)
17/16 18/17
Carabao 238,759 233,246 229,030 (2.31) (1.81)
Backyard 235,827 230,362 226,115 (2.32) (1.84)
Commercial 2,932 2,884 2,915 (1.64) 1.07
Cattle 183,417 181,435 184,702 (1.08) 1.80
Backyard 156,469 153,402 154,695 (1.96) 0.84
Commercial 26,948 28,033 30,007 4.03 7.04
Swine 426,475 445,800 466,263 4.53 4.59
Backyard 388,742 409,248 425,812 5.27 4.05
Commercial 37,733 36,552 40,451 (3.13) 10.67
Goat 113,810 108,511 105,330 (4.66) (2.93)
Backyard 108,683 102,923 98,861 (5.30) (3.95)
Commercial 5,127 5,588 6,469 8.99 15.77
Animal/
Farm Type
Percent Change201820172016

Table 2. Inventory of Poultry by Animal and Farm Type, Cagayan Valley: as of July 1, 2016-2018 (number of bird)
17/16 18/17
Chicken 8,737,262 8,064,050 7,331,477 (7.71) (9.08)
Native/Improved 4,029,809 4,563,418 5,143,270 13.24 12.71
Layer 600,076 724,930 806,938 20.81 11.31
Broiler 4,107,377 2,775,702 1,381,269 (32.42) (50.24)
Duck 1,134,262 1,143,440 1,165,146 0.81 1.90
Backyard 1,001,987 1,024,905 1,059,984 2.29 3.42
Commercial 132,275 118,535 105,162 (10.39) (11.28)
Animal/
Farm Type2016 2017 2018
Percent Change
POULTRY The total volume of poultry production in Cagayan Valley for the first semester of 2018 dropped by 159 metric tons as compared to same period of last year. The negative growth in poultry output was significant in chicken production which is short by 592 metric tons or 1.99 percent lower than what was attained in 2017 registered at
29,688 metric tons. Duck Egg production also pulled down poultry output by 144 metric tons or 8.57 percent behind the 2017 production of 1,680 metric tons. Positive output in Duck and Chicken Egg was not enough to overturn the total poultry production as it gained only 115 metric tons for Duck and 462 metric tons for Chicken Egg.
Across provinces, the province of Isabela is the top contributor in terms of poultry production during the period with a share of 59.07 percent. Meanwhile, Batanes is the least contributor accounting for only 0.13 percent to the total poultry production output of the region.
As of July 1, 2018, total chicken inventory in the region reduced by 9.08 percent. Specifically, the reduced inventory was notable in broiler and duck commercial farms at 50.24 percent and 11.28 percent respectively – Broiler farms shrunk by 1,394,433 birds while duck commercial farms dropped by 13,733 birds. The decrease in inventory of these two farms was too big to overcome by the increase in inventory of Native/Improved Chicken (12.71 percent or 579,852 birds), Layer farms (11.31 percent or 82,008 birds) and Duck backyard farms (3.42 percent or 35,079 birds).

Table 3. Inventory of Livestock by Animal, Farm Type and Province, Cagayan Valley: as of July 1, 2016-2018 (number of head)
17/16 18/17
Carabao 238,759 233,246 229,030 (2.31) (1.81)
Backyard 235,827 230,362 226,115 (2.32) (1.84)
Batanes 3,088 3,254 3,404 5.38 4.61
Cagayan 92,143 91,356 92,356 (0.85) 1.09
Isabela 96,559 91,848 85,624 (4.88) (6.78)
Nueva Vizcaya 22,309 22,874 23,864 2.53 4.33
Quirino 21,728 21,030 20,867 (3.21) (0.78)
Commercial 2,932 2,884 2,915 (1.64) 1.07
Batanes .. .. ..
Cagayan 1,680 1,665 1,738 (0.89) 4.38
Isabela 1,151 1,108 1,044 (3.74) (5.78)
Nueva Vizcaya 68 77 95 13.24 23.38
Quirino 33 34 38 3.03 11.76
Cattle 183,417 181,435 184,702 (1.08) 1.80
Backyard 156,469 153,402 154,695 (1.96) 0.84
Batanes 5,345 5,604 5,801 4.85 3.52
Cagayan 21,868 20,391 19,613 (6.75) (3.82)
Isabela 101,021 101,387 104,372 0.36 2.94
Nueva Vizcaya 15,667 14,601 13,737 (6.80) (5.92)
Quirino 12,568 11,419 11,172 (9.14) (2.16)
Commercial 26,948 28,033 30,007 4.03 7.04
Batanes 1,504 1,546 1,561 2.79 0.97
Cagayan 5,947 5,606 5,319 (5.73) (5.12)
Isabela 14,100 15,401 17,368 9.23 12.77
Nueva Vizcaya 4,873 4,923 4,987 1.03 1.30
Quirino 524 557 772 6.30 38.60
Swine 426,475 445,800 466,263 4.53 4.59
Backyard 388,742 409,248 425,812 5.27 4.05
Batanes 3,331 3,623 3,273 8.77 (9.66)
Cagayan 204,459 231,401 238,795 13.18 3.20
Isabela 110,962 106,571 113,243 (3.96) 6.26
Nueva Vizcaya 44,440 42,824 42,009 (3.64) (1.90)
Quirino 25,550 24,829 28,492 (2.82) 14.75
Commercial 37,733 36,552 40,451 (3.13) 10.67
Batanes 157 35 63 (77.71) 80.00
Cagayan 6,088 6,123 6,376 0.57 4.13
Isabela 21,201 19,344 19,420 (8.76) 0.39
Nueva Vizcaya 6,464 5,843 5,339 (9.61) (8.63)
Quirino 3,823 5,207 9,253 36.20 77.70
Goat 113,810 108,511 105,330 (4.66) (2.93)
Backyard 108,683 102,923 98,861 (5.30) (3.95)
Batanes 2,615 2,579 2,640 (1.38) 2.37
Cagayan 42,295 41,855 40,446 (1.04) (3.37)
Isabela 35,079 30,787 28,214 (12.24) (8.36)
Nueva Vizcaya 16,628 15,851 15,521 (4.67) (2.08)
Quirino 12,066 11,851 12,040 (1.78) 1.59
Commercial 5,127 5,588 6,469 8.99 15.77
Batanes 1,293 1,231 1,485 (4.80) 20.63
Cagayan 2,165 2,432 2,845 12.33 16.98
Isabela 936 1,205 1,561 28.74 29.54
Nueva Vizcaya 480 465 390 (3.13) (16.13)
Quirino 253 255 188 0.79 (26.27)
.. Data not available
Animal/
Farm Type2016 2017 2018
Percent Change

Table 4. Inventory of Poultry by Animal, Farm Type and Province, Cagayan Valley: as of July 1, 2016-2018 (number of bird)
17/16 18/17
Chicken 8,737,262 8,064,050 7,331,477 (7.71) (9.08)
Native/Improved 4,029,809 4,563,418 5,143,270 13.24 12.71
Batanes 6,235 6,074 4,527 (2.58) (25.47)
Cagayan 1,798,129 2,005,993 2,496,462 11.56 24.45
Isabela 1,118,757 1,346,756 1,376,974 20.38 2.24
Nueva Vizcaya 588,812 621,257 624,208 5.51 0.48
Quirino 517,876 583,338 641,099 12.64 9.90
Layer 600,076 724,930 806,938 20.81 11.31
Batanes 2,044 6,900 7,500 237.57 8.70
Cagayan 34,969 42,929 78,234 22.76 82.24
Isabela 425,467 547,507 588,304 28.68 7.45
Nueva Vizcaya 35,500 37,894 33,000 6.74 (12.91)
Quirino 102,096 89,700 99,900 (12.14) 11.37
Broiler 4,107,377 2,775,702 1,381,269 (32.42) (50.24)
Batanes 58 228 .. 293.10
Cagayan 399,933 246,280 214,937 (38.42) (12.73)
Isabela 3,325,920 2,215,060 1,101,752 (33.40) (50.26)
Nueva Vizcaya 332,600 260,344 .. (21.72)
Quirino 48,866 53,790 64,580 10.08 20.06
Duck 2,136,249 2,168,345 2,225,130 1.50 2.62
Backyard 1,001,987 1,024,905 1,059,984 2.29 3.42
Batanes 467 421 428 (9.85) 1.66
Cagayan 285,658 308,769 318,671 8.09 3.21
Isabela 477,644 470,624 479,977 (1.47) 1.99
Nueva Vizcaya 165,718 169,998 176,561 2.58 3.86
Quirino 72,500 75,093 84,347 3.58 12.32
Commercial 132,275 118,535 105,162 (10.39) (11.28)
Batanes .. .. ..
Cagayan 103,362 92,604 79,739 (10.41) (13.89)
Isabela 28,913 23,931 25,423 (17.23) 6.23
Nueva Vizcaya .. 2,000 ..
Quirino .. .. ..
.. Data not available
Animal/
Farm Type2016 2017 2018
Percent Change

The Livestock and Poultry Situationer presents the performance situation in terms of inventory of carabao, cattle, swine, goat, chicken and duck; and volume of production including chicken and duck eggs. Moreover, data for this special release were collected by the Philippine Statistics Authority (PSA) though the two (2) major surveys, namely: a) The Backyard Livestock and Poultry Survey (BLPS) which conducted quarterly covers one (1) of the four (4) replicate samples of the Palay and Corn Production Survey (PCPS), and b) The Commercial Livestock and Poultry (CLPS), also conducted quarterly covers 29 swine farms, 5 layer farms and 20 broiler commercial farms and contract growers as of July 1, 2018.
Another survey that supplements the data requirements of the Livestock and Poultry sector is the Survey of Slaughterhouses and Poultry Dressing Plants (SSHDP). This is done monthly and utilizes administrative data from Locally Registered Meat Establishments (LRMEs) in the province which is in coordination with the Provincial Veterinary Office (PVO) and Meat Inspectors (MIs).
DEFINITION OF TERMS
Production - Refers to the volume of indigenous (locally-raised) animals disposed for slaughter which include animals exported or shipped-out for slaughter (in “head” and in “liveweight equivalent”).
Livestock – farm animals kept or raised for consumption, work or leisure. In general, poultry is separated as a distinct group of farm animals. For purposes of census and surveys, livestock covers only those that are tended and raised by an operator.
Poultry - a collective term for all domesticated avian for the purpose of food consumption or, the carcass of such avian dressed/processed for human consumption.
Animal Inventory (also, Animal Population) – the number of domesticated animals in head present in the farm at specific reference date.
Source: Special Release File, PSA-Central Office
MARILYN T. ESTRADA Regional Director /GMB/MLP