municipal wastewater treatment in … · thirteenth international water technology conference, iwtc...
TRANSCRIPT

Thirteenth International Water Technology Conference, IWTC 13 2009, Hurghada, Egypt
675
MUNICIPAL WASTEWATER TREATMENT IN DEVELOPING
COUNTRIES COMPARABLE ALTERNATIVE ANAEROBIC
COST-EFFECTIVE SYSTEMS
Walid Abdel-Halim1*, Waseem El-Sayed2, Hisham S. A. Halim3, and K.-H. Rosenwinkel4
1 Housing and Building National Research Center (HBNRC), Egypt 2 Master student at Cairo University, Faculty of Engineering, Environmental
Engineering Department, Egypt 3 Faculty of Engineering, Cairo University, Egypt 4 Institute of Water Quality and Waste Management, Hannover University, Germany
*E-mail: [email protected] ABSTRACT In this study, The process performance of the Upflow Anaerobic Sludge Blanket “UASB” reactor and Fixed Bed Reactor “FBR” were investigated in a pilot plants scale to treat medium strength municipal wastewater at different variable process operating parameters such as Temperature, Organic Loading Rate OLR, Sludge Loading Rate SLR, and Hydraulic Retention Time HRT, as well as the flow patterns of the FBR”up- flow, down-flow”. The main aims of this study can be summarized as follow:
Determination and evaluation of the process performance parameters for both of UASB and FBR under different hydraulic, organic, and physical operation parameters.
Comparison between the operation results obtained from the both of UASB and FBR.
Propose some prospective methods of construction of both of UASB reactor and FBR to be competitive as a low cost technology for the developing countries. The inflow and outflow wastewater concentration characteristics (COD, BOD, TSS, VFA, pH, etc….) were measured and the removal efficiencies were calculated and they can be summarized as follow: For the UASB Reactor: The COD Removal efficiencies are: CODhom/hom: 73.3, 65.3, 63.9, and 59.9% at temperatures 37, 30, 20, and 14°C, while the CODfilt/filt: 70.8, 60.6, 50.8 and 46.6% as well as CODhom/filt: 82.9, 75.5, 68.4, and 54.8 for the same temperatures respectively. TSS removal efficiencies are: 62.1, 69.9, 81.3, and 72.7% for temperatures 37, 30, 20, and 14°C. The average obtained specific CH4 gas production was ca. 220-255 l CH4/kg CODhomrem Volatile Fatty Acids (VFA) in the outlet doesn’t exceed than

Thirteenth International Water Technology Conference, IWTC 13 2009, Hurghada, Egypt 676
81.6 mg/l along the whole operating time “avg. 47.66 mg/l”. Also pH is ranged between 7.4 and 7.8. BOD removal efficiency is 71.7 - 42 % for the temperature 37-14°C. While TKN and Total P are 23.4 - 8.8 % and 3.6 - 3.4 % for 37 - 14°C respectively. Sludge bioactivity is ranged between 0.1 and 0.3 along the overall operating time. Also the excess sludge indicates a very good status of pellets and thus good process stability. For FBR Reactor: TSS removal efficiency ranged between 73 to 92%; BOD removal efficiency was 45 to 85%; COD removal efficiency was 35 to 82%; VSS removal was between 69 to 87%; and the production ranged between 3.0 to 6.0 l/day. CH4 concentration was observed as 62 to 67%.Sludge Production: The rate of sludge production was investigated and found to be 20-30 mg per l of wastewater treated. The average temperature ranged between 20 to 30°C .Average influent and effluent pH values: 6.80 /7.20 and 6.70/7.0, respectively. Keywords: Anaerobic Systems, Municipal Wastewater, UASB, Fixed Bed Reactor
FBR, Domestic Sewage, Developing Countries. INTRODUCTION General Anaerobic digestion has considered as a promising method for the treatment of high, medium and low concentration wastewaters, due to the economy of the process, and the low generation of surplus sludge as well as winning of the biogas as an alternative source of energy. Developing countries occupy regions where the climate is warm most of the time. Even in subtropical areas, low temperatures don’t persist for long periods. This is the main factor that makes the use of anaerobic technology applicable and less expensive in those countries (E. Foresti 2001). Different anaerobic technologies have been applied to the treatment of domestic wastewater. Demonstration of anaerobic technology for wastewater Pre-treatment Answering to the high priority request concerning the sustainability criteria of the wastewater treatment technology, the anaerobic wastewater treatment should be regarded as the core method of a sustainable wastewater management strategy due to its benefits and enormous potentials such as: Little (if any) use of mineral resources and energy; Enabling production of resources / energy from wastes; Pairing high efficiency with long term of lives; Applicable at any place and at any scale; Plain in construction, operation and maintenance. Moreover, although conventional aerobic treatment systems generally provide excellent treatment efficiency, they do not fully meet the criteria needed for a sustainable wastewater management strategy (Lettinga, 1995, 2001).
Benefits and drawbacks of anaerobic municipal wastewater treatment Based on the past experiences and learned lessons in the municipal wastewater treatment, the anaerobic technology proved a very good performance and efficiencies

Thirteenth International Water Technology Conference, IWTC 13 2009, Hurghada, Egypt
677
due to its positive advantages against aerobic ones. The main advantages and drawbacks of the anaerobic municipal wastewater treatment systems are shown in Table 1.
Table 1: Advantages and drawbacks of anaerobic municipal wastewater treatment systems (Lettinga, 2001; Foresti, 2001; Zeeman and Lettinga 1999; Jim Field, 2002)
Advantages Drawbacks 1. Economy of the process, a substantial
saving in operational costs as no energy is required for aeration as well as low investment costs of construction and maintenance.
2. Positive instead of negative energy balance, on the contrary energy is produced in the form of methane gas, which can be utilized for heating and electricity production.
3. High performance, the process can handle high hydraulic and organic loading rates. Thus, the applied technologies are rather compact and reduce the volume of post treatment stages.
4. Simplicity, the technologies are simple in construction, operation, monitoring, and maintenance, consequently they are cost-effective technologies.
5. Flexibility and sustainability, the systems can be applied everywhere and at any scale and working with high treatment efficiencies.
6. Low generation of surplus sludge, the excess sludge production is very low. Additionally, the sludge is well stabilized and easily dewatered due to high solids retention time. Hence, lower secondary costs for sludge handling
7. Possibility of nutrients recovery, the valuable nutrients (N, P and K) is conserved which give high potential for crop irrigation and aquaculture when re-using the anaerobically treated wastewater in agriculture irrigation purposes.
8. Feasibility, the anaerobic technology is feasible for a wide range of waste and wastewaters whether complex in composition, very low or very high strength as well as at low and high temperatures.
1. Need for post treatment, in some cases to comply with the effluent standards, a simple/poor post treatment is necessary.
2. Little available experiences, some-times especially with the full-scale application at low and or moderate temperatures.
3. Solubility of biogas, significant amount of produced biogas dissolved in water and remains in the effluent especially for low strength wastewater.
4. Non utilized methane, produced methane during anaerobic municipal wastewater treatment is often not utilized for energy generation.
Thirteenth International Water Technology Conference, IWTC 13 2009, Hurghada, Egypt 678
Simplified concept of anaerobic wastewater treatment for re-use in Developing Countries
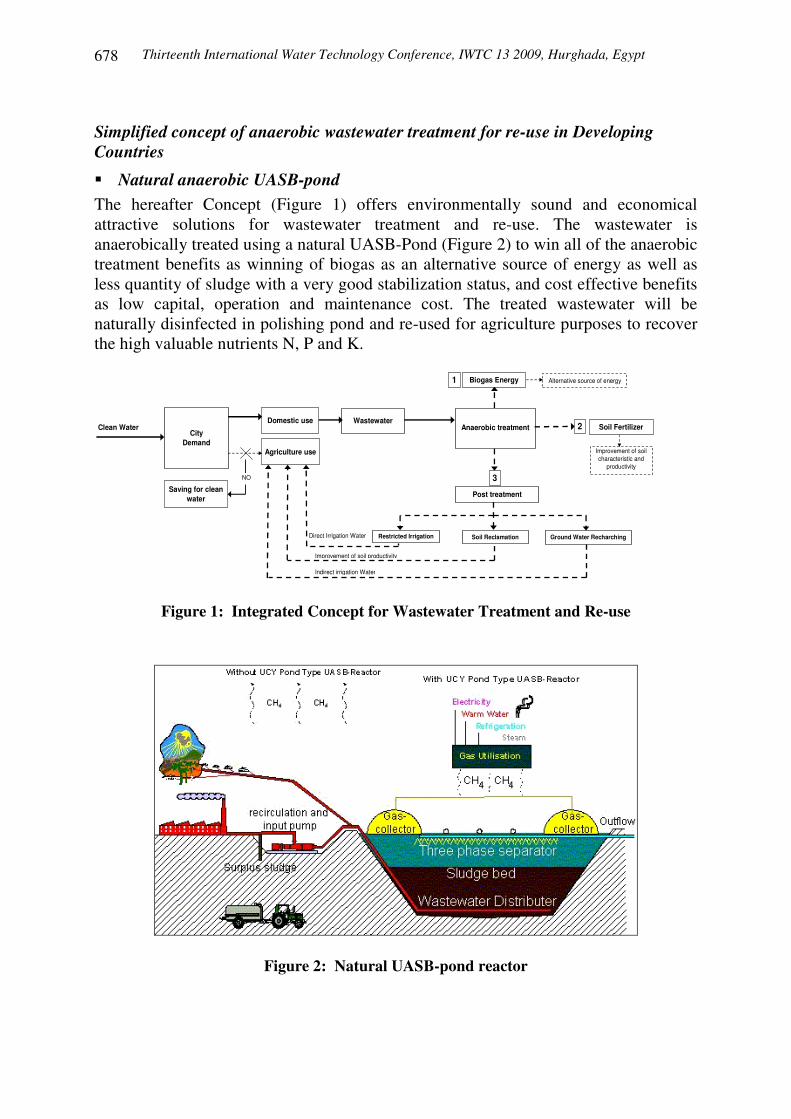
� Natural anaerobic UASB-pond The hereafter Concept (Figure 1) offers environmentally sound and economical attractive solutions for wastewater treatment and re-use. The wastewater is anaerobically treated using a natural UASB-Pond (Figure 2) to win all of the anaerobic treatment benefits as winning of biogas as an alternative source of energy as well as less quantity of sludge with a very good stabilization status, and cost effective benefits as low capital, operation and maintenance cost. The treated wastewater will be naturally disinfected in polishing pond and re-used for agriculture purposes to recover the high valuable nutrients N, P and K.
CityDemand
WastewaterAnaerobic treatment
Post treatment
Restricted Irrigation Soil Reclamation Ground Water Recharching
Clean WaterDomestic use
Agriculture use
Saving for clean water
NO
Biogas Energy1
Soil Fertilizer2
3
Improvement of soil characteristic and
productivity
Direct Irrigation Water
Improvement of soil productivity
Indirect irrigation Water
Alternative source of energy
Figure 1: Integrated Concept for Wastewater Treatment and Re-use
Figure 2: Natural UASB-pond reactor

Thirteenth International Water Technology Conference, IWTC 13 2009, Hurghada, Egypt
679
The main aim of the Concept is the treatment of municipal wastewater and sustainable re-use for natural eco-systems maintaining by the development of a low cost technology in developing countries. The illustrated diagram describes the main Concept that the clean water is entering to the city for the domestic use only but the agriculture use will be by using of the treated wastewater produced from this Concept. Also Concept produces not only a water resource for irrigation but also produces an alternative sources of energy in form of biogas to be converted to heat or electricity to save the usual energy resources, also it produces a good stabilized sludge which can be used as a fertilizer to enrich and improve the soil characteristics. The treated wastewater will be used as a source of nutrients for soil, i.e. recovery of these nutrients will be done to use them in soil reclamation. Because of the limited financial resources, there is a definite need for a cost-effective appropriate technology for sewage treatment system. The UASB reactor technology may be mostly attractive option for sewage treatment for developing countries, because it can be used at small or large scale, in technically simple, lower cost. In developing countries such as India and Colombia the UASB was executed in full scale to treat the municipal wastewater. Performance of UASB-Pond reactor: The results from the used UASB pond in the tropical conditions a reduction in BOD up to (80-90) %. The UASB pond technology is feasible in an urban developing world context because of its high organic removal efficiency, simplicity, low-cost, low capital and maintenance costs. Typically UASB ponds have low sludge production (0.02-0.2 kg/kg COD removed) and low energy needs. The biogas yield will be about 60-75 % CH4 and 20-30% CO2, and then it will be a good, feasible renewable energy source to be used at a low cost concept. Construction, O&M, and monitoring costs of treatment and disposal with this Concept= (143-218) �/m3 or (29-44) �/P.E. RESEARCH APPROACH AND METHODOLOGY UASB Pilot Plant: As illustrated in Figure 3, a pilot plant was built in the research hall of the Institute of Water Quality and Waste Management in Herrenhausen WWTP in Hannover, Germany. It consists of 12.5 litters Plexiglas UASB reactor (11 cm internal diameter, and 127 cm height) provided with inlet and re-circulation pumps and tubes. The UASB was inoculated with a fresh collected granular sludge “Pellets” from similar existing reactor and receives a medium strength pre-settled
Figure 3: UASB reactor pilot plant

Thirteenth International Water Technology Conference, IWTC 13 2009, Hurghada, Egypt 680
wastewater (avg. 400-600 mg/l CODhom) comes directly from the primary sedimentation tank of Herrenhausen WWTP. The reactor was designed and started-up according to the design parameters and start-up procedures obtained from the results of anaerobic batch tests, which had performed (acc. to the German procedure and guidelines of ATV-IG5.1 and VDI- 4630) to determine the most effective Hydraulic Retention Time HRT (6hrs), Sludge Loading Rate SLR (0.2- 0.3 kg COD/kg VS. d), Sludge bioactivity (0.15 -0.25 kg CODrem./kg VS.d), and sludge activation procedure (8-12 hrs at 35±2°C), as well as the expected biogas quantity and quality incl. the specific CH4-Gas production (200 to 255 l CH4/ kg CODrem.). The pilot plant was run for 138 days to investigate the process performance such as: Removal efficiencies of CODfilt., CODhom, CODss, VFA, BOD, TSS, TKN, and P.; Biogas quantity and quality incl. average and specific CH4 production; Sludge bio-activity, total and specific excess sludge production and characteristics, under the different operating temperatures from 37 to 14°C at upflow velocities ranged between 0.6 at start-up and fixed to 0.8 m/hr at operation stages. FBR Pilot Plant: As illustrated in Figure 4, a pilot plant was built at Zenein WWTP in Cairo, Egypt. It consists of 16 liter PVC cylinder reactor (15 cm internal diameter and 1 m height) packed with flexible plastic media (plastic corrugated tubes, avg. length 3 cm and 16 mm in diameter). The media occupies 10 l of the total volume of the reactor and has a support surface area 1.6 m2 with specific surface area 160 m2/m3. The reactor was seeded with digested sewage sludge from sludge digester (one third of reactor volume is sludge and two thirds is wastewater) and started-up for 4 weeks without receiving any new wastewater, only circulation was done and the biogas production was observed as indication of methanogenic activity and start of anaerobic conversion process. Therefore the reactor received a pre-settled wastewater (avg. 150-300 mg/l CODhom). The pilot plant was tested under several operating parameters such as: Flow patterns: up-flow and down-flow; Hydraulic Retention Time: for HRTs 6, 12, 24, 30 hrs; Temperature: 20-30 °C; for 73 days to investigate the process performance such as: Removal efficiencies of CODhom, BOD, TSS, VSS.; Biogas production, quantity and quality; Sludge production and characteristics.
Figure 4: FBR - Pilot Plant

Thirteenth International Water Technology Conference, IWTC 13 2009, Hurghada, Egypt
681
RESULTS AND DISCUSSION UASB Pilot Plant The steady state phase was determined and decided based on fixed range of COD removal efficiencies correlated with a very low concentration of VFA in the effluent as well as pH values around the neutral value, which indicate that the microbiological process in reactor is stable without any risk on the process; therefore, the start of steady state conditions in this research is defined. Process performance The process performance was measured by monitoring the influent and effluent concentrations of COD, TSS, VSS, BOD, VFA, pH of the wastewater as well as sludge characteristics in the reactor and biogas produced (quantity and quality) along the three runs of operation: Run (1): temperature 37-32°C; Run (2): temperature 30-22°C; Run (3): temperature 20-14°C. a. COD Removal Total, filtered, and soluble COD concentrations were measured for the influent and effluent wastewater of the UASB reactor as well as suspended and colloidal COD concentrations were determined. The removal efficiencies of different COD were calculated at the different operation runs at different operation temperatures from 37 to 14°C. Run (1) for 37-32°C; Run (2) for 30-22°C and Run (3) for 20-14°C. Figure 5 shows the variation of influent and effluent total and filtered COD (CODt and CODf) concentration along operation time for the different operation runs. The total COD concentrations were ranged between 336 and 689 mg/L along the different three runs with average values of 553, 422, 521, and 513 mg/L at temperatures 37, 30, 20, and 14°C respectively. It is obvious that the fluctuation of the influent total COD concentration to the reactor is slightly high especially between run 1 and 2. The influent filtered COD concentrations were ranged between 223 and 433 mg/L with average values of 345, 298, 329, and 270 mg/L at temperatures 37, 30, 20, and 14°C respectively. The fluctuation of filtered COD can also be considered to be high. Based on influent and effluent COD concentrations, the COD removal efficiency was determined for the total and filtered COD along operation time for the different runs. Figure 6 displays the total and filtered COD removal efficiency for different runs.

Thirteenth International Water Technology Conference, IWTC 13 2009, Hurghada, Egypt 682
0
50
100
150
200
250
300
350
400
450
500
550
600
650
700
1 6 11 16 21 26 31 36 41 46 51 56 61 66 71 76 81 86 91 96 101 106 111 116 121 126
Time (days)
CO
D C
once
ntra
tion
(mg/
L)
Influent CODt Influent CODf Effluent CODt Effluent CODf
Run (1): T= 37 - 32 °C Run (2): T= 30 - 22 °C Run (3): T= 20 - 14 °C
Figure 5: Variation of influent and effluent total and filtered COD concentrations during steady state phase for UASB
0
10
20
30
40
50
60
70
80
90
100
1 6 11 16 21 26 31 36 41 46 51 56 61 66 71 76 81 86 91 96 101 106 111 116 121 126
Time (days)
CO
D R
emov
al e
ffici
ency
( %
)
CODt Removal % CODf Removal %
Run (1): T= 37 - 32 °C Run (2): T= 30 - 22 °C Run (3): T= 20 - 14 °C
Figure 6: COD Removal efficiencies along operation time during steady state phase for UASB
Thirteenth International Water Technology Conference, IWTC 13 2009, Hurghada, Egypt
683
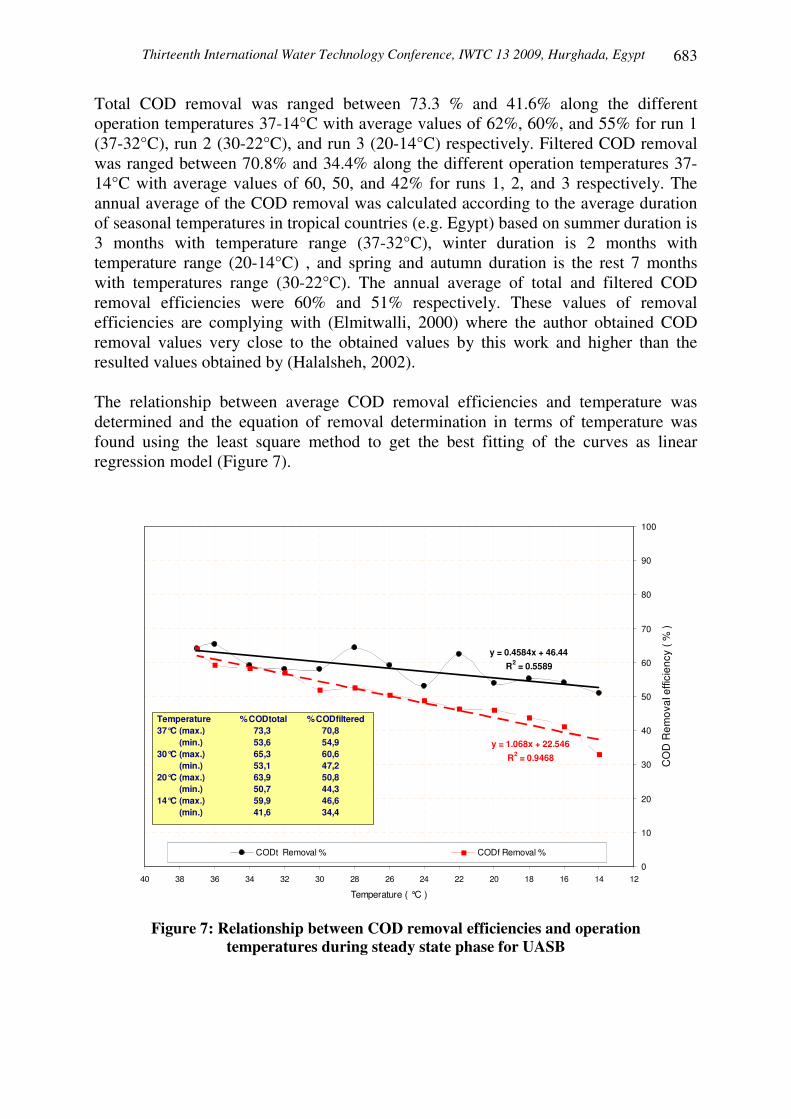
Total COD removal was ranged between 73.3 % and 41.6% along the different operation temperatures 37-14°C with average values of 62%, 60%, and 55% for run 1 (37-32°C), run 2 (30-22°C), and run 3 (20-14°C) respectively. Filtered COD removal was ranged between 70.8% and 34.4% along the different operation temperatures 37-14°C with average values of 60, 50, and 42% for runs 1, 2, and 3 respectively. The annual average of the COD removal was calculated according to the average duration of seasonal temperatures in tropical countries (e.g. Egypt) based on summer duration is 3 months with temperature range (37-32°C), winter duration is 2 months with temperature range (20-14°C) , and spring and autumn duration is the rest 7 months with temperatures range (30-22°C). The annual average of total and filtered COD removal efficiencies were 60% and 51% respectively. These values of removal efficiencies are complying with (Elmitwalli, 2000) where the author obtained COD removal values very close to the obtained values by this work and higher than the resulted values obtained by (Halalsheh, 2002). The relationship between average COD removal efficiencies and temperature was determined and the equation of removal determination in terms of temperature was found using the least square method to get the best fitting of the curves as linear regression model (Figure 7).
y = 0.4584x + 46.44R2 = 0.5589
y = 1.068x + 22.546R2 = 0.9468
0
10
20
30
40
50
60
70
80
90
100
121416182022242628303234363840
Temperature ( °C )
CO
D R
emov
al e
ffici
ency
( %
)
CODt Removal % CODf Removal %
Temperature %CODtotal %CODfiltered 37°C (max.) 73,3 70,8 (min.) 53,6 54,9 30°C (max.) 65,3 60,6 (min.) 53,1 47,2 20°C (max.) 63,9 50,8 (min.) 50,7 44,3 14°C (max.) 59,9 46,6 (min.) 41,6 34,4
Figure 7: Relationship between COD removal efficiencies and operation temperatures during steady state phase for UASB

Thirteenth International Water Technology Conference, IWTC 13 2009, Hurghada, Egypt 684
It was found that both total and filtered COD removal efficiency were decreasing with the decreasing of the operation temperatures. The difference between the total COD and filtered COD removal efficiency was increased with the decreased of the temperature. This means that filtered COD removal efficiency is much more sensitive influenced by the temperature change than the total COD removal efficiency, which is obvious clear by the steep slope of the filtered COD fitted linear curve and the increase of the value of R2 from 0.5589 for the total COD to 0.9468 for the filtered COD, where the increase of the R2-value means a strong direct correlation between filtered COD removal efficiency and the temperature value. The relationship between influent total influent COD concentration and removed COD was determined (Figure 8). It was found from Figure 8 that a linear correlation between influent COD concentration and removed COD (R2=0.8104). From this relation it can be seen that for every increase in influent COD concentration there will be a proportional increase in the COD removed along different operation temperatures, which in turns means good ability and activity of the reactor to overcome the increase of influent COD without failure or overloading chock.
y = 0.7782x - 90.651R2 = 0.8104
100
150
200
250
300
350
400
450
500
550
600
300 400 500 600 700
Influent total COD (mg/L)
CO
Dre
mov
ed (m
g/L)
Run (1): T= 37 - 32 °C Run (2): T= 30 - 22 °C Run (3): T= 20 - 14 °C
Figure 8: Relationship between influent and removed COD concentrations at different operation temperatures during steady state phase for UASB
Average soluble, colloidal and suspended COD removal efficiencies were calculated for the different operation temperatures and compared to those efficiencies of filtered and total COD. Figure 9 shows the average removal efficiencies of soluble, colloidal, filtered, suspended and total COD against the operation temperatures (37-14°C).

Thirteenth International Water Technology Conference, IWTC 13 2009, Hurghada, Egypt
685
It was found that average soluble COD removal efficiencies were ranged between 66% and 47% for operation temperatures 37-14°C and was decreased proportionally to the decrease of temperature with average values of 62.7%, 56.4%, and 50.5% at the average seasonal temperature of summer, spring and autumn, and winter periods respectively and of 57% at the total annual average. The colloidal COD removal efficiencies were ranged between 62% and 19% for operation temperatures 37-14°C and were decreased proportionally to the decrease of temperature with average values of 55.8%, 41.4%, and 29.6% at the average seasonal temperature of summer, spring and autumn, and winter periods respectively and of 43.1% at the total annual average.
0
20
40
60
80
100
37363432302826242220181614
Temperature ( °C )
Ave
rage
CO
D R
emov
al (%
)
Total COD Filtered COD Suspended COD
Colloidal COD Soluble COD
Figure 9: COD-fractional removal efficiencies along different operation
temperatures during steady state phase The suspended COD removal efficiencies were ranged between 60% and 81% for operation temperatures 37-14°C with average values of 65.2%, 74.1%, and 74% at the average seasonal temperature of summer, spring and autumn, and winter periods respectively and of 71.9% at the total annual average. It was noticed that the removal efficiency of suspended COD was slightly increased with the lower temperatures especially starting form 26 to 14°C. The reason may be

Thirteenth International Water Technology Conference, IWTC 13 2009, Hurghada, Egypt 686
returned to the accumulation of solids in the reactor, affecting the removal efficiency of suspended COD. A comparison of COD removal efficiencies at different seasonal temperatures and at the total annual temperature was done (Figure 10). It was found that the total annual of COD fractional removal efficiencies 60%, 51.2%, 57%, 71.9% and 43.1% for total, filtered, soluble, suspended and colloidal COD respectively. Compared to similar literature studies, it was found that these averages having well complying values.
Figure 10: Fractional COD-Removal efficiencies at different seasonal temperature ranges compared to the total annual COD-Removal efficiencies
b. pH-monitoring Figure 11 shows the pH ranges of the influent and effluent wastewater of the UASB reactor. This parameter varied consistency in the influent during the all operation runs. The influent pH range was 7.15-8.18 and effluent pH was 7.18-7.65. The small reduction observed in the UASB effluent is normal for anaerobic reactors treating municipal wastewater. It was found also that all effluent pH values are above the neutral limit (7.0), which indicates a good status of the reactor and no acidification problems had happened.
0
20
40
60
80
Summer period T= (37-32°C)
Spring&Autumn period T=(30-22°C)
Winter period T= (20-14°C)
Total annual average T= 26.6°C
CO
D R
emov
al e
ffici
ency
(%)
Total COD
Filtered COD
Soluble COD
Colloidal COD
Suspended COD

Thirteenth International Water Technology Conference, IWTC 13 2009, Hurghada, Egypt
687
6.00
6.50
7.00
7.50
8.00
8.50
9.00
1 6 11 16 21 26 31 36 41 46 51 56 61 66 71 76 81 86 91 96 101 106 111 116 121 126
Time (days)
pH
Inflow pH Outflow pH
Run (1): T= 37 - 32 °C Run (2): T= 30 - 22 °C Run (3): T= 20 - 14 °C
Figure 11: Influent and effluent pH-values of the UASB reactor
c. VFA-monitoring The monitoring of volatile fatty acids (organic acide) is one of the most important parameter for the UASB reactor control during steady state phase because VFA is considered as indicator of the process competence of COD conversion to methane. The increase of VFA concentration means that part of COD is converted by hydrolysis, acidification phases and not converted completely by methanogensis phase to methane but still in form of VFA. This means that high VFA concentration indicates a non-completed methanogenic conversion of COD to methane. Also if the concentration of VFA highly increased, the pH-value decreased to the acidic phase, which in turns inhibits the process and the reactor operation will be failed. Figure 12 shows the variation of influent and effluent VFA concentrations of the UASB reactor. It was found that the influent VFA-values ranged between 23.6 and 91.6 mg/L and the effluent values between 30.3 and 81.7 mg/L with average influent values of 52.29, 38.94, and 59.58 mg/L for run 1, 2, and 3 respectively and average effluent values of 45.03, 42.99, and 53.34 mg/L for the same runs.

Thirteenth International Water Technology Conference, IWTC 13 2009, Hurghada, Egypt 688
Removal Efficiency comparison for all runs (TSS)
01020304050607080
3 6 9 12 15
Time (day)
R.E
val
ue (%
)
Run 1/1
Run 2/1
Run 3/1
10
20
30
40
50
60
70
80
90
100
1 6 11 16 21 26 31 36 41 46 51 56 61 66 71 76 81 86 91 96 101 106 111 116 121 126
Time (days)
VFA
(mg/
L)
Inflow VFA Outflow VFA
Run (1): T= 37 - 32 °C Run (2): T= 30 - 22 °C Run (3): T= 20 - 14 °C
Figure 12: Variation of influent and effluent VFA-values of UASB reactor
It was also found that the max values of the effluent VFA are small (less than 100 mg/L) with an average of 47.12 mg/L along the different operation temperatures during different operation runs. FBR Pilot Plant: For Group 1 - Run 1/1: OLR= 3.2 kg COD/m3.d - Run 2/1: OLR= 2.5 kg COD/m3.d - Run 3/1: OLR= 2.0 kg COD/m3.d Average Removal Efficiencies (%) TSS : 60, 69 and 71%, respectively. VSS : 65, 74 and 77%, respectively. BOD : 69, 78 and 80%, respectively. COD : 64, 73 and 76%, respectively.

Thirteenth International Water Technology Conference, IWTC 13 2009, Hurghada, Egypt
689
Removal Efficiency comparison for all runs (BOD)
0
20
40
60
80
100
3 6 9 12 15
Time (day)
R.E
val
ue (%
)
Run 1/1
Run 2/1
Run 3/1
Removal Efficiency comparison for all runs (TSS)
01020304050607080
3 6 9 12 15
Time (day)
R.E
val
ue (%
)
Run 1/3
Run 2/3
Run 3/3
Removal Efficiency comparison for all runs (COD)
0
20
40
60
80
100
3 6 9 12 15
Time (day)
R.E
val
ue (%
)Run 1/2
Run 2/2
Run 3/2
Gas Production
0
10
20
30
40
50
60
70
80
90
1 4 7 10 13 16 19 22 25 28 31 34 37 40 43 Days
Gas
Pro
duct
ion,
mL
For Group 2 - Run 1/2: Down Flow/Down Flow pattern - Run 2/2: Down Flow/Up Flow pattern - Run 2/2: UP Flow/Up Flow pattern Average Removal Efficiencies (%) TSS : 64, 70 and 76%, respectively. VSS : 70, 75 and 80%, respectively. BOD : 78, 83 and 88%, respectively. COD : 71, 77 and 82%, respectively. For Group 3 - Run 1/3: Down Flow/Down Flow pattern - Run 2/3: Down Flow/Up Flow pattern - Run 3/3: UP Flow/Up Flow pattern Average Removal Efficiencies (%) TSS : 55, 62 and 65%, respectively. VSS : 59, 66 and 70%, respectively. BOD : 60, 67 and 69%, respectively. COD : 57, 62 and 65%, respectively. CONCLUSIONS The study showed two different anaerobic treatment systems for the municipal wastewater; UASB and FBR systems, which have significant abilities to achieve promising treatment efficiencies for the different temperatures from 37 to 15°C. Also the both systems have the ability to produce biogas with reasonable quantity and quality can to be used for energy generation. Also the study provided some prospective methods of construction of the both of UASB and FBR.

Thirteenth International Water Technology Conference, IWTC 13 2009, Hurghada, Egypt 690
The obtained results proved that fixed bed anaerobic reactor is an efficient wastewater treatment system, simple in operation, and needs low cost investment. The system was able to reduce the pollutant concentration to a limit which is suitable for discharging the treated effluent to agricultural drains according to law 48 for year 1982. However, in order to avoid the risk of inconsistent effluent characteristics, it is recommended to have a polishing unit such as sand filter or following the system with a land application module to enhance and ensure the treated effluent quality. The Results from UASB process performance evaluation under steady state conditions showed that the average total COD removal efficiencies were 62%, 60%, and 55% for the temperature ranges 37-32°C, 30-22°C, and 20-14°C respectively with total annual average 60% (based on: 37-32°C as summer period for 3 months; 30-22°C as spring and autumn period for 7 months; 20-14°C as winter period for 2 months). The max CODt removal was 73.3% at 37°C and the min was 41.6% at 14°C. During steady state phase, effluent pH-values were around neutral value (7.18-7.65) and average effluent VFA concentration value was 47.12 mg/L. The low effluent concentrations of VFA together with the positive variation of alkalinity observed by stale alkaline pH values confirmed that there was no risk of process acidification at any experimental run at different operation temperatures 37-14°C. Total suspended solids removal efficiencies were 58.49%, 69.39%, and 57.28% for the temperature ranges 37-32°C, 30-22°C, and 20-14°C respectively. The linear regression of TSS and VSS against operation temperatures concluded that their removal efficiencies decreased with temperature decrease although the up-flow velocity was kept constant at 0.80 m/h during steady state phase. The reason of that may be returned to step-wise accumulation of solids and excess sludge in the reactor, which act as a screen obstructed the movement of solids and retain them in the reactor. BOD removal efficiencies were 72%, 60.2%, and 49.5% for the temperature ranges 37-32°C, 30-22°C, and 20-14°C respectively and the total annual average was 61.3%. The average methane gas production was 3.18, 3.22, 2.89 L/d for the temperature ranges 37-32°C, 30-22°C, and 20-14°C respectively. The specific CH4-gas production averages were: 242, 206, and 202 L CH4/kg CODremoved; 154, 121, 111 L CH4/kg CODin ; 81, 58, 57 L CH4/m
3 influent wastewater for the temperature ranges 37-32°C, 30-22°C, and 20-14°C respectively. The overall results of the UASB reactor pilot plant indicate that the treated wastewater can be used for irrigation purposes after a simplified post treatment process because of its valuable contents of nutrients (N, P). Although the pathogenic indictors were not measured during the steady state operation phase, the effluent BOD, TSS values were used to evaluate the quality of treated wastewater. It is recommended that natural polishing pond, facultative/aerobic ponds, or sand filtration can be used for post treatment of the UASB effluent wastewater at low cost. For irrigation rate, the nitrogen

Thirteenth International Water Technology Conference, IWTC 13 2009, Hurghada, Egypt
691
load must be considered. Normally if there is no nitrogen elimination, the irrigation rate with treated wastewater must be 200 mm/year hectare. REFERENCES ATV, DVWK (DWA) IG 5.1 (2004). Anaerobe Testverfahren zu Abbaubarkeit,
Hemmung und Aktivität " 5. Arbeitbericht der Arbeitsgruppe. (Anaerobe Verfahren zur Behandlung von Industriewässern), German Association for Water, Wastewater and Waste, Germany.
ATV-DWVK, Merkblatt 363 (2002). Aufbereitung und Verwendung von Biogasen.
Banik, G.C. and Boruff, C.B. (1996). ASBR treatment of dilute wastewater at psychrophilic treatment. The 69th annual Water Environmental Federation Conference, Chicago, USA.
Elmitwalli, T.A. (2000). Anaerobic treatment of domestic sewage at low temperature. Ph.D. thesis, Wageningen University. Wageningen, The Netherlands.
Elmitwalli, T.A. et al. (2003). “Treatment of domestic sewage at low temperature in a two-anaerobic step system followed by a trickling filter.” Wat. Sci. Technol. 48: 199-206.
Foresti, E. (2001). Anaerobic treatment of domestic sewage: established technologies and prospectives. 9th International Symposium on Anaerobic Digestion, Antwerpen, Belgium.
Forster, C.F. and Wase, D.A. (1983). “Anaerobic treatment of dilute wastewater using an upflow sludge blanket reactor.” Environmental Pollution (Series A) 31: 57-66.
GTZ/TBW (1998). Promotion of anaerobic technology for the treatment of municipal and industrial sewage and wastes, Supraregional sector project, Final report, GTZ/TBW, Eschborn, Frankfurt, Germany.
Hobson, P.N. et al. (1981). Methane production from Aricultural and domestic wastes, Applied Science publishers Ltd, London, UK.
Horan, N.J. (1993). Biological wastewater Treatment systems. John Wiley & Sons. Chichester, England.
Hulshof Pol, L.W. and Lettinga, G. (1986). “New technologies for anaerobic wastewater treatment.” Water Sci. Tech. 18(12): 41-53.
Lettinga, G. and Hulshoff Pol, L.W. (1986). “Advanced reactor design, operation and economy.” Water Sci. Tech. 18: 99-108.
Lettinga, G. and Hulshoff Pol, L.W. (1991). “UASB-Process Design for Various types of wastewaters.” Water Sci. Tech. 24: 87-107.
Lettinga, G. and Hulshoff Pol, L.W. (1992). Basic aspects of anaerobic wastewater treatment technology. Anaerobic reactor technology. International course on anaerobic wastewater treatment, Wageningen University, the Netherlands.

Thirteenth International Water Technology Conference, IWTC 13 2009, Hurghada, Egypt 692
Sayed, S.K.I. (1987). Anaerobic treatment of slaughthouse wastewater using the UASB process. Ph.D. thesis, Department of Water Pollution control, Agricultural University of Wageningen, Wageningen, the Netherlands.
Pavlostathis, S.G. and Giraldo-Gomez, E. (1991). “Kinetics of anaerobic treatment.” Water Sci. Tech. 24(8): 35-59.
Pavlostathis, S.G. and Giraldo-Gomez, E. (1991). “Kinetics of anaerobic treatment: A critical review.” Crit. Rev. Environ. Control 21: 411-490.
Pesta, G. (2004). “Anaeobe Reinigung von Abwässern-Alternative Entsorgungskonzepte zur Erzeugung und Verwertung von Biogas.” Getränkeindustrie 2: 31-33.