murdoch research repositoryresearchrepository.murdoch.edu.au/id/eprint/14614/1/performance_of... ·...
TRANSCRIPT

MURDOCH RESEARCH REPOSITORY
This is the author’s final version of the work, as accepted for publication following peer review but without the publisher’s layout or pagination.
The definitive version is available at https://www.novapublishers.com/catalog/product_info.php?products_id=40078
McHenry, M.P. (2013) Technical, economic, and mitigation performance of small-scale (≤1 kWe) hydroelectric and photovoltaic water pumping systems relative to network
electricity in rural areas in the southwest of Western Australia. In: Poullikka, A., (ed.) Renewable energy: economics, emerging
technologies and global practices. Nova Science Publishers, Hauppauge, New York, pp. 247-266.
http://researchrepository.murdoch.edu.au/14614/
Copyright: © Nova Science Publishers
It is posted here for your personal use. No further distribution is permitted.

Chapter
TECHNICAL, ECONOMIC, AND MITIGATION PERFORMANCE OF SMALL-SCALE (≤1 kWe)
HYDROELECTRIC AND PHOTOVOLTAIC WATER PUMPING SYSTEMS RELATIVE TO NETWORK
ELECTRICITY IN RURAL AREAS IN THE SOUTHWEST OF WESTERN AUSTRALIA.
Mark P McHenry* School of Engineering and Energy, Murdoch University, Western Australia
ABSTRACT This work describes rural hydroelectric and photovoltaic (PV) water pumping systems technical performance simulations and economic and greenhouse gas mitigation modelling research. The pico-hydroelectric (for electricity service provision) and PV water pumping (for stock water supply) simulations were selected for a detailed analysis due to their high sensitivity to water resource availability in rural areas. Both observed and projected changes in rainfall and runoff in the in the predominantly agricultural southwest (SW) of Western Australia (WA) will heavily influence land, water, and energy supply decision-making at all levels, including landholders. The hydroelectric systems are also contrasted against similar technical alternatives in the region (≤3 kWe grid-connected PV and wind turbine systems). The results suggest the technical performance of small-scale grid-connected (≤1 kWe) hydroelectric systems have the higher technical potential of all the small-scale grid-connected technical alternatives over the short-to-medium term, despite current drying conditions in the SW of WA. Similarly, the small-scale stand-alone PV water pumping system could not compete against grid-connected electricity when a connection was available, although the systems would be an effective market adaptation and market mitigation measure to supply stock water in most
* Corresponding Author address Murdoch University, 90 South St Murdoch, Western Australia, 6150.
Email: [email protected]
Mark P. McHenry 2
cases. This is due to stock watering requirements being generally off-grid, and a stand-alone PV pumping system NPV would likely be greater than a grid-connected pumping system that requires electricity network extension. Furthermore, a farm water supply pipe network extension may be economically less attractive than a stand-alone PV pumping system, although this would require further analysis of water resource quality and availability at the water point, and would require cost comparisons between the PV option and the costs associated with extension of the pipe network, including the actual pipe gauge costs, the pipe network extension distance, and whether the pipe was buried or otherwise (etc). However, all of the renewable energy systems were expensive adaptation and mitigation options and were unable to compete with the low cost of network electricity when a connection is available in terms of the NPV against 2010 market prices, subsidies, and costs.
Keywords: Hydroelectric; photovoltaic; water pumping; agriculture; rural.
INTRODUCTION This analysis was developed to clarify both the seasonal hydrological resource
availability and performance and cost of small-scale water-related renewable energy systems in the SW of WA relative to network electricity supply. The Australian continent has relatively few large rivers, low topographical relief, yet despite few remaining opportunities for large-scale hydroelectric generation, small-scale opportunities still exist [1]. The variability of rainfall is the principal climatic factor that determines agricultural management in Australia [2]. Rainfall capture, storage, and transport has long been a major limitation to economic development in WA, particularly in agriculture. At the regional scale in the SW of WA, the variability of rainfall and runoff is a major factor in both small-scale hydroelectric generation and water demand, particularly in periods of low rainfall (November-April). Observed changes in summer rainfall since 1950 show extensive drying in the region [3], with around half of the reduction in observed rainfall from 1958-1975 to 1976-2003 due to a reduction in the number of troughs [4]. Winter rainfall in the SW has decreased substantially since 1950, and decreased abruptly in the mid 1970s by around 15-20%. The largest observed decrease is from March to July, while August to October rainfall has increased slightly [5]. Concerningly, rainfall flow into Perth’s dams has dropped by about 50% since the mid 1970s from the 1911-74 long-term average [6]. As the SW of WA is less affected by El Niño/Southern Oscillation Index (ENSO/SOI) than the rest of Australia [7], the decrease in rainfall in the SW of WA is believed to be a combination of increased greenhouse gas concentrations, natural climate variability, and land-use change [5].
The increasing trends in atmospheric pressure in mid winter correlate with the rainfall regime changes in the region [5]. Compounding observed rainfall changes are the associations of Australian droughts with increasing records of mean daily maximum temperatures and evaporation [8]. The IPCCs 2007 4AR included a large-scale global projection of relative changes in rainfall runoff by the end of the 21st century representing the median values of 12 climate models using the SRES (Special Report on Emission Scenarios) A1B scenario. In this projection, the SW of WA saw a 90% model agreement on a reduction in runoff, with the median reduction value of between 20 and 40% of 1980-1999 runoff levels [9]. A similar 4AR multi-model (based on the SRES A1B scenario) projection of changes of SW rainfall for the period 2090-2099 relative to 1980-1999, showed a model agreement of close to 90% in a projected rainfall decrease for December to February of between 20% and 10%, and more than 90% model agreement of a decrease of between 30% and 20% for June to August [9]. In a summary of the ranges of uncertainty for rainfall changes simulated by 15

Technical, economic, and mitigation performance of small-scale hydroelectric… 3
climate models for the IPCC’s 4AR, the annual average rainfall is projected to decrease 3 to 22% by 2030 in the extreme SW, and, 0 to 22% in the rest of the SW, and 0 to 15% for southern coastal regions of the SW of WA. By 2070 these rainfall change model simulation uncertainties projected annual average decreases of between 7 to 70% to occur in the extreme SW, zero to 70% in the rest of the SW, and zero to 45% for southern coastal regions [10].
While noting the magnitude, spatial, and temporal uncertainties in projections such as these, climatic changes are expected to further exacerbate observed stresses on water security from population growth, economic growth, land-use change, and also electricity generation [9, 11, 12]. Therefore, scenario information is increasingly being developed at a finer geographical and temporal resolution and been applied to the SRES storylines, producing new regional scenarios of socio-economic conditions, land use and land cover, atmospheric composition, climate and sea level [13]. In the rural sector, while long-term projections will necessarily guide long-term agricultural planning, they are of debatable applicability for short-to-medium term small-scale investments such as small-scale grid-connected hydroelectric and stand-alone PV water pumping systems. This is particularly so when current agricultural land and water decision-making is sensitive to existing climatic and rainfall variability [14, 15]. Australia has the highest inter-annual natural rainfall variability of all the continents, and the principal cause of this natural variability is ENSO/SOI [2]. As the ENSO/SOI is coupled to the annual cycle, the increased use of such variability indicators can increase the predictability of the season and thus decrease seasonal farm managerial uncertainties [7]. As periodic dry years are a normal part of the Australian climate regime [16], historical farm management plans have generally taken this variability into account with a number of strategies (de-stocking, delayed re-stocking, feed storage strategies, among many others) [17]. Land and water management inter-relationships are dependent on local conditions and management options, and long-term systematic assessments and comparisons of appropriate scale mitigation and adaptation options are useful to local agricultural decision-makers [15]. However, the greater use of inter and intra-annual climatic variability indicators will advance the risk management by the inclusion of both seasonal indicators and long-term water resource projection characteristics, and associated investments [7, 18].
SIMULATION & MODEL INPUT DATA, SCENARIOS, & ASSUMPTIONS
Agricultural lands in the SW of WA are generally supplied with electricity from the single largest electricity network in WA, the South West Interconnected System (SWIS). The small-scale hydroelectric and PV water pumping systems were simulated to operate in parallel with SWIS connection to a standard two phase rural distribution line (230-240V, 32A), displacing network electricity of an average rural homestead load, and water pumping load for a single paddock, respectively. Technical simulations used HOMER version 2.68 beta using a 15 minute interval comparison of electricity demand and electricity generation and flows through each component of the system [19]. As a complete annual time series for a homestead or water pumping electricity demand was unavailable in the region, the homestead load was generated in HOMER using a combination of appliance energy audit, 10 day real-time consumption monitoring, and three years of historical electricity billing data. The audit, monitoring and billing data revealed significant inter-year and intra-day load fluctuation and thus HOMER’s day-to-day and time-step-to-time-step variability was set at 50% and 250%, respectively to reflect all expected loads. The load data generated a maximum peak load on a 15 minute basis of around 10.1 kW, and a 12 kWh day-1 scaled average demand, which were consistent with parallel operational electricity demands based on the energy audit appliance and the billing data. The high day-to-day energy demand variability was selected to reflect the high irregularity of rural tasks that persist through weekends, and seasonal changes. The PV water pumping output

Mark P. McHenry 4
was designed to provide maximum water demand (in hot summer condition, December to March) for around 250 dry (no lambs) adult sheep grazing pasture.
The hydrological resource was generated by the author as an iterative combination of intermittent site monitoring of local river systems and rainfall data (both informal measurements and government streamflow gauging sites). This available river hydrological resource and stock water requirements were used as broadly representative for the high-rainfall (>800 mm) coastal region in the SW of WA. The annual average available water flow rate was scaled to 10 L s-1. The input data shown in Table 1 includes the hydrological resource, daily solar radiation on a horizontal plane, clearness index, and air temperature input data. The solar and temperature data was derived from a Bureau of Meteorology (BOM) SW station at Albany Airport, station no.009741, 69 m above sea level, and was transformed in the RETScreen (version 4) climate database with NASA’s Surface Meteorology and Solar Energy Dataset [20]. The simulated site’s annual average clearness index is 0.512, the annual average horizontal plane solar radiation received is 4.323 kWh m-2 day-1 with an annual average temperature of 15.4 oC.
Table 1. Generated monthly mean available hydrological flows used for the pico-hydroelectric simulations, and the monthly solar resource and temperature inputs. (The annual average flow
of 10.3 L s-1 was scaled in the HOMER model to 10 L s-1).
Month J F M A M J J A S O N D
H2O Flow (L s-1) 0.5 0.1 0.1 0.5 10.0 20.0 25.0 25.0 20.0 13.0 7.0 2.0
Clearness Index 0.57 0.53 0.50 0.46 0.46 0.47 0.48 0.48 0.49 0.50 0.50 0.51
Rad. (kWh m-2 day-1) 6.83 5.18 4.56 3.19 2.42 2.08 2.28 3.00 4.03 5.14 5.83 6.780
Av. Ambient Temp. (oC) 19.4 19.8 18.8 16.6 14.3 12.4 11.6 11.6 12.6 13.9 15.7 17.9
An economic model was developed in a simple and clear spreadsheet to incorporate all unique attributes of the various renewable energy technology simulations, policies, emission calculations, and market prices (2010) of capital and operational costs, all projected over a 15 year project lifetime. Each system model involved a number of assumptions detailed in each respective scenario, and a real discount rate of 8%. The SWIS network tariff used in each model was the government-owned electricity retailer, Synergy’s 2010 Home Business Plan (K1) tariff (AUD 0.3823 day-1 supply charge and AUD0.2083 kWh-1 residences consuming less than 20 kWh day-1 over the billing period), which is tailored for rural consumers with a homestead and all shed loads consuming electricity off a single electricity meter [21]. A ‘Renewable Energy Buyback Scheme’ (REBS) was available at the time for exported renewable energy grid-connected systems on the SWIS of capacity between 500 W and 5 kW, calculated on the net total over the billing period at a rate of AUD0.07 kWh-1. Whilst Synergy’s REBS values exported renewable electricity at around one-third of the price of the equivalent import price to be eligible for REBS, the consumer must be on the A1 (a flat residential) or SmartPower (a time of use variable) tariff, and thus residences on the K1 tariff are ineligible. There were around 13,000 K1 customers in 2009 [22], and none were able to access the premium WA feed-in tariff (FiT) when it was available (1 Aug 2010 to 1 Aug 2011), or the benefits of the REBS.
Technical, economic, and mitigation performance of small-scale hydroelectric… 5
A 400 W GRID-CONNECTED HYDROELECTRIC SYSTEM TECHNICAL
SIMULATION RESULTS The homestead load profile and total consumption were used in the simulation of an
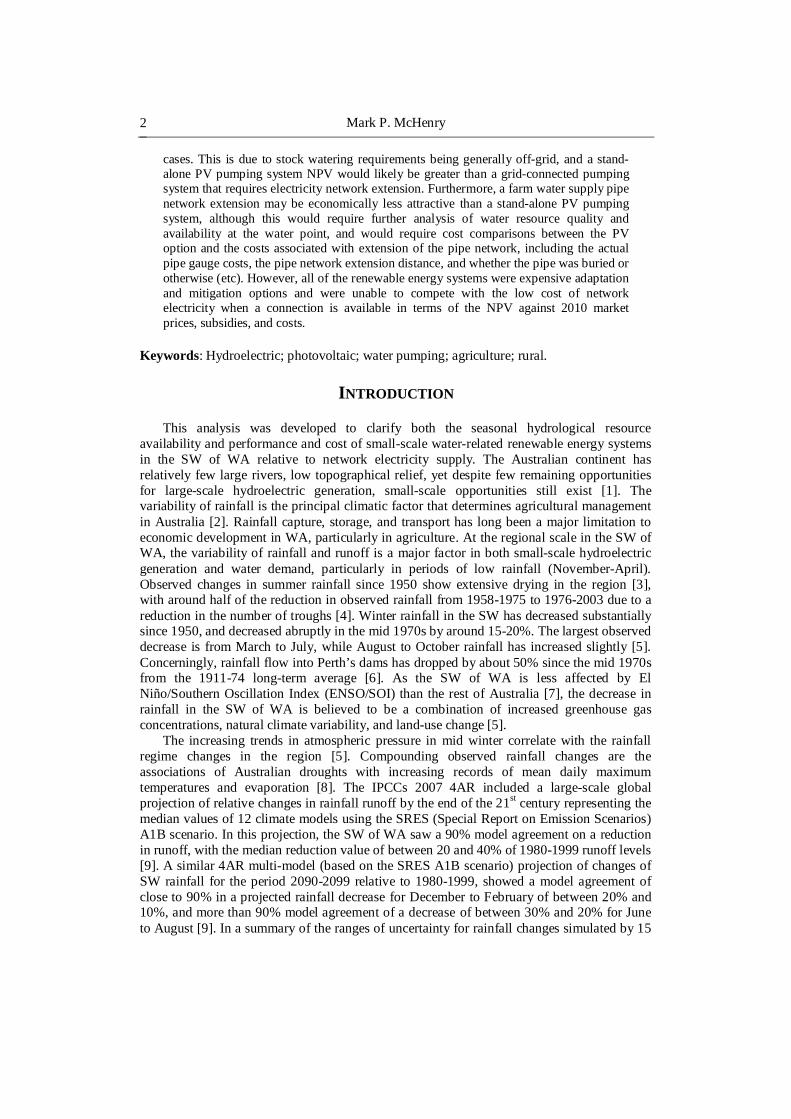
efficient pico-hydroelectric reaction turbine installed on a low gross head (2.5 m), with a inlet pipe loss of 12% to operate at a maximum 400 W DC. The simulated DC hydroelectric generator was connected to an over-specification 1.1 kW grid-connected inverter, supplying the homestead load in parallel with the SWIS network. The system schematic of the simulated system is shown in Fig 1. The HOMER power curve equivalent to the 400 W hydroelectric turbine was developed from a range of available efficient pico-hydroelectric turbines of similar nominal outputs. The average turbine efficiency selected for the simulation was 65%, with an inverter efficiency of 95%.
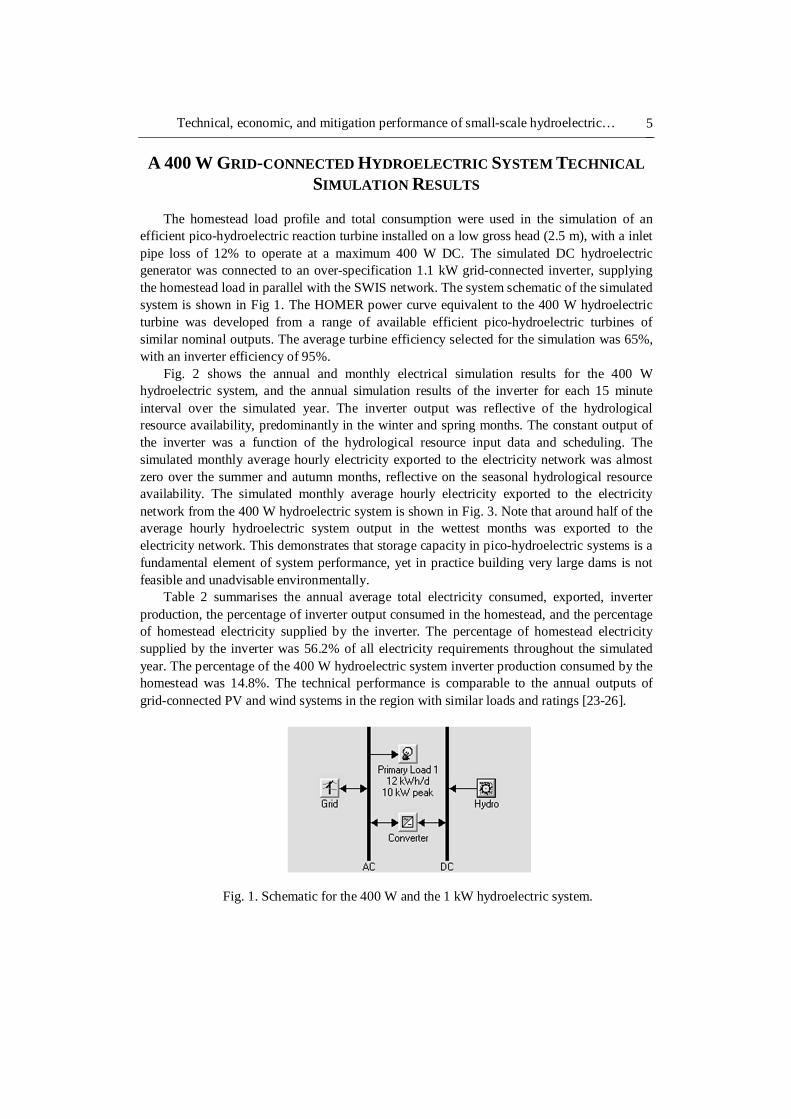
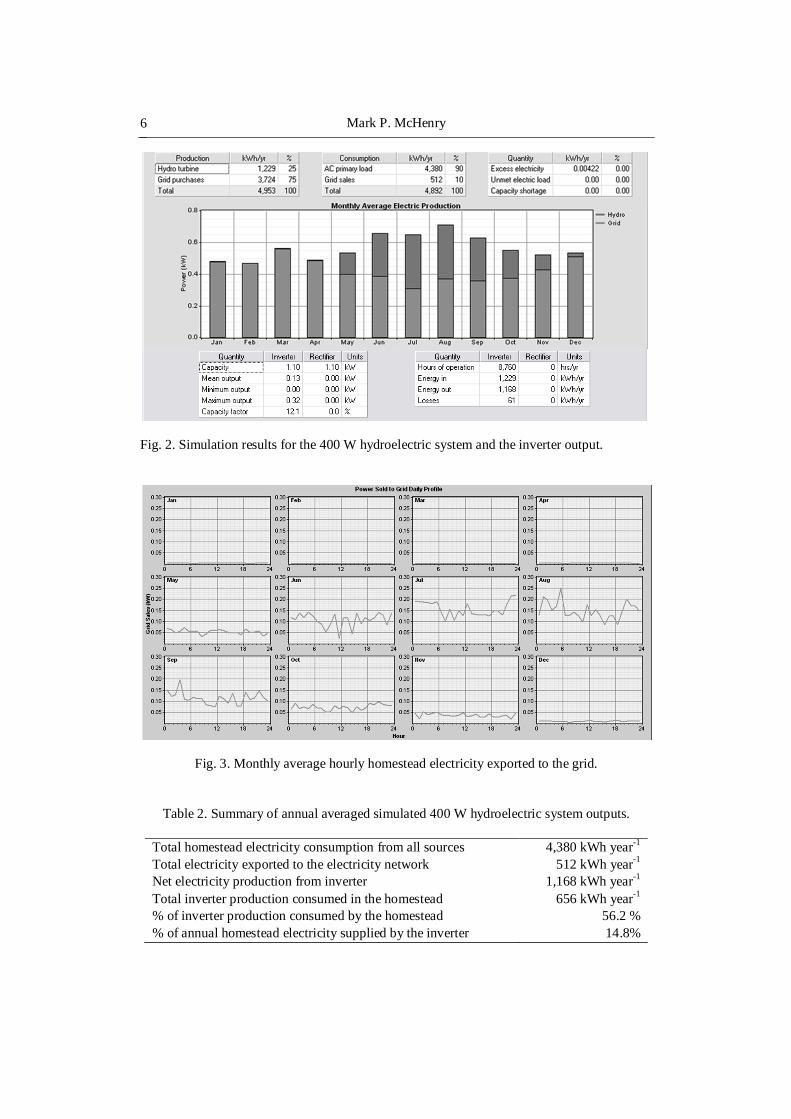
Fig. 2 shows the annual and monthly electrical simulation results for the 400 W hydroelectric system, and the annual simulation results of the inverter for each 15 minute interval over the simulated year. The inverter output was reflective of the hydrological resource availability, predominantly in the winter and spring months. The constant output of the inverter was a function of the hydrological resource input data and scheduling. The simulated monthly average hourly electricity exported to the electricity network was almost zero over the summer and autumn months, reflective on the seasonal hydrological resource availability. The simulated monthly average hourly electricity exported to the electricity network from the 400 W hydroelectric system is shown in Fig. 3. Note that around half of the average hourly hydroelectric system output in the wettest months was exported to the electricity network. This demonstrates that storage capacity in pico-hydroelectric systems is a fundamental element of system performance, yet in practice building very large dams is not feasible and unadvisable environmentally.
Table 2 summarises the annual average total electricity consumed, exported, inverter production, the percentage of inverter output consumed in the homestead, and the percentage of homestead electricity supplied by the inverter. The percentage of homestead electricity supplied by the inverter was 56.2% of all electricity requirements throughout the simulated year. The percentage of the 400 W hydroelectric system inverter production consumed by the homestead was 14.8%. The technical performance is comparable to the annual outputs of grid-connected PV and wind systems in the region with similar loads and ratings [23-26].
Fig. 1. Schematic for the 400 W and the 1 kW hydroelectric system.
Mark P. McHenry 6
Fig. 2. Simulation results for the 400 W hydroelectric system and the inverter output.
Fig. 3. Monthly average hourly homestead electricity exported to the grid.
Table 2. Summary of annual averaged simulated 400 W hydroelectric system outputs.
Total homestead electricity consumption from all sources 4,380 kWh year-1 Total electricity exported to the electricity network 512 kWh year-1 Net electricity production from inverter 1,168 kWh year-1 Total inverter production consumed in the homestead 656 kWh year-1 % of inverter production consumed by the homestead 56.2 % % of annual homestead electricity supplied by the inverter 14.8%

Technical, economic, and mitigation performance of small-scale hydroelectric… 7
ECONOMIC & MITIGATION RESULTS & DISCUSSION The market prices for the 400 W hydroelectric system were based on a 2010 average
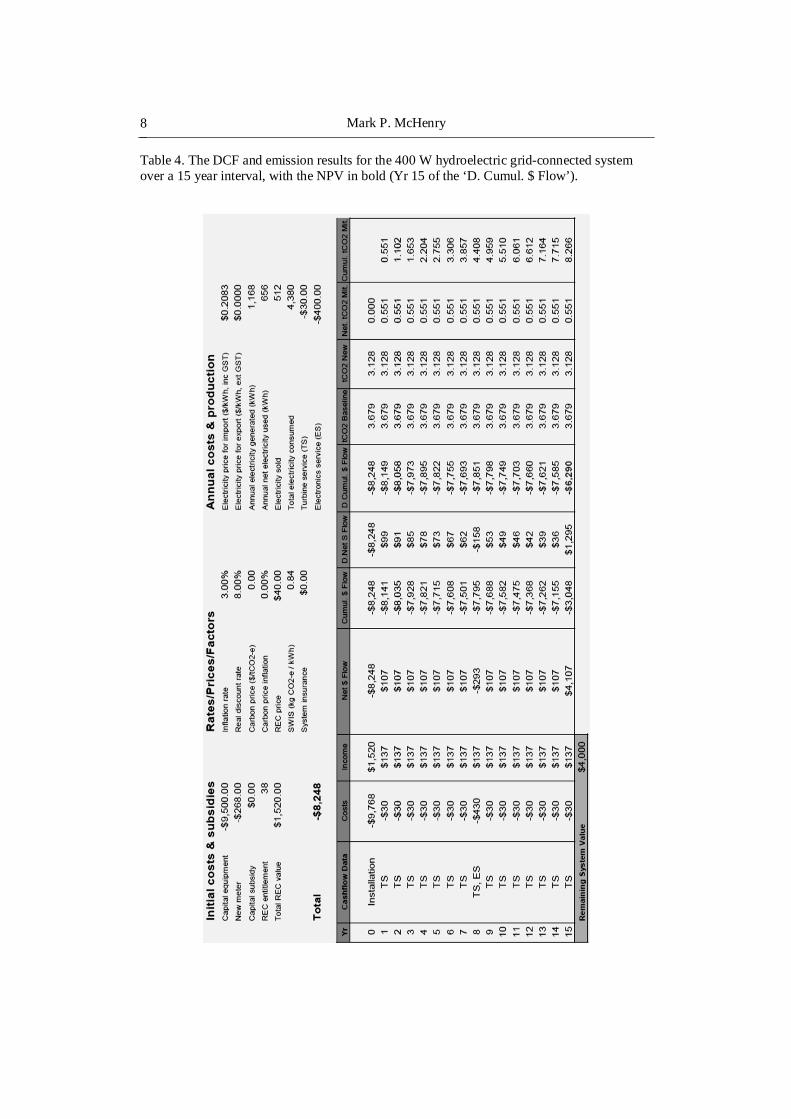
market value for the K1 tariff, as shown in Table 4. The model assumes a zero economic value for electricity exports onto the network from the existing REBS ineligibility of K1 tariff customers. The capital cost of the 400 W hydroelectric system was chosen to reflect an average quality commercially available hydroelectric turbine and enabling equipment (including installation) to meet Australian Standards. The dam construction and cabling to the homestead was not included in the model. The hydroelectric system models does not explicitly include replacement of runners and nozzles, however, the model does include annual costs for general maintenance. The model also includes a capital subsidy based on the Renewable Energy Certificate (REC). One REC is equivalent to 1 MWh of clean energy generated by a Clean Energy Council accredited renewable energy generator. Small-scale renewable energy rebate structures are prone to periodic amendments under various guises, yet often remain related to RECs each system is deemed to produce, which are created and sold by consumers who own the generators to Clean Energy Council accredited system installers who onsell the RECs which effectively minimises owner’s capital costs. This research included the 2010 Solar Credit Scheme subsidy where small PV, wind, or hydroelectric systems are entitled to a numer of deemed RECs of a fixed value (AUD40.00 each) for both stand-alone and grid-connected power systems [27]. The total REC entitlement for the 400 W system was 38 over the maximum deeming period of five years. The simulation ignores the value of the total REC entitlement after the period as no installation period multiplier was published post 30 June 2015. The mitigation potential of each system was based on the assumption that electricity exported onto the network does not displace conventional supply, while the direct inverter-supplied load in the homestead would, based on the 2009 (scope 2) SWIS emission factor (0.84 kgCO2-e kWh-1). This factor was assumed to remain constant over the 15 years. The author notes that this is likely an overestimate as the factor has decreased in recent years, and in practice a large number of aggregated small-scale systems will need to influence large-scale generator scheduling to reduce SWIS emissions.
Table 4 shows that the life-cycle market adaptation potential for the 400 W hydroelectric system did not recoup the initial investment, although the market mitigation potential of the system was 8.266 tCO2-e over the 15 year interval. For each tCO2-e of mitigation, a cost of almost AUD761 was borne by the system owner. While noting many uncertainties and assumptions, the 400 W hydroelectric grid-connected system was not a commercially attractive option with a NPV of almost AUD-6,500 over the 15 years. The relatively small market mitigation potential offered by the 400 W hydroelectric system investment was not an economically attractive mitigation measure. This was comparable to the market adaptation potential (NPV) and market mitigation potential of both the 1 kW PV and 1 kW wind turbine grid-connected systems (Table 3).
Table 3. A comparison between the 1 kW wind, 1 kW PV, and 400 W hydroelectric grid-
connected system’s total market adaptation potential (NPV) and market mitigation potential over the 15 year investment cycle. Source: [23-25].
1 kW PV 1 kW wind 400 W hydro
NPV AUD-6,436 AUD-5,416 AUD-6,290
Mitigation (tCO2-e) 9.513 8.467 8.266
Mitigation cost (AUD tCO2-e-1 ) 677 640 761
Mark P. McHenry 8
Table 4. The DCF and emission results for the 400 W hydroelectric grid-connected system over a 15 year interval, with the NPV in bold (Yr 15 of the ‘D. Cumul. $ Flow’).

Technical, economic, and mitigation performance of small-scale hydroelectric… 9
A 1 KW GRID-CONNECTED HYDROELECTRIC SYSTEM TECHNICAL
SIMULATION RESULTS The same homestead load profile and total consumption was used in a simulation of a
nominal 1 kW DC high-efficiency pico-hydroelectric impulse turbine installed on a medium gross head (6.5 m), with an inlet pipe loss of 12%. The simulated DC hydroelectric system enabling components were identical to the pico-hydroelectric system designed to operate at a maximum of 400 W, although the increased head supports an alternative pico-hydroelectric turbine technology rated up to a maximum of 1 kW in this scenario. The hydroelectric turbine was connected to the same 1.1 kW grid-connected inverter as the 400 W hydroelectric system, and the 1 kW PV and wind systems. The inverter supplied the homestead load in parallel with the SWIS electricity network. The system schematic of the simulated system is identical to Fig.1.
Fig. 4 shows the annual and monthly electrical simulation results for the 1 kW hydroelectric system, and the annual simulation results of the inverter for each 15 minute interval over the simulated year. The simulated monthly average hourly electricity exported to the electricity network from the 1 kW hydroelectric system is shown in Fig. 5. In a similar manner to the 400 W hydroelectric system, around half of the average hourly hydroelectric system output in the wetter months was exported to the electricity network for the 1 kW system. Table 5 summarises the annual average total electricity consumed, exported, inverter production, the percentage of inverter output consumed in the homestead, and the percentage of homestead electricity supplied by the inverter. The percentage of homestead electricity supplied by the inverter was 43.7%, and the percentage of inverter production consumed by the homestead was 30.3%. This output data was relatively consistent with both the 3 kW PV and the 3 kW wind rated systems simulated in the region [23-25]. However, the major difference was the larger percentage of electricity produced by the system that was consumed in the homestead in the winter and spring months. This was primarily due to the lower nominal rating of the hydroelectric system which was more matched to the homestead load over wetter months, and resulted in a reduced percentage of exported electricity.
Fig. 4. Simulation results for the 1 kW hydroelectric system and the inverter output.

Mark P. McHenry 10
Fig. 5. Monthly average hourly homestead electricity exported to the grid.
Table 5. Summary of annual average simulated 1 kW hydroelectric system outputs.
Total homestead electricity consumption from all sources 4,380 kWh year-1
Total electricity exported to the electricity network 1,709 kWh year-1
Net electricity production from inverter 3,035 kWh year-1
Total inverter production consumed in the homestead 1,326 kWh year-1
% of inverter production consumed by the homestead 43.7 %
% of annual homestead electricity supplied by the inverter 30.3%
ECONOMIC & MITIGATION MODEL RESULTS & DISCUSSION
Market prices for the 1 kW hydroelectric system were identical to the 400 W
hydroelectric system adaptation and mitigation simulation. The only change in capital costs was the additional capital cost of a longer intake (AUD500), and the larger rebate from the REC entitlement. The total REC entitlement for the system is 95 over the maximum deeming period of five years. In a similar manner to the wind systems and the 400 W hydroelectric system, the simulation ignores the value of the total REC entitlement after the initial period as no installation period multiplier was published for after 30 June 2015. Table 6 shows that the life-cycle market adaptation potential for the 1 kW hydroelectric system did not recoup the initial investment. Table 7 summarises the current market adaptation and market mitigation potentials of the system, with cost of AUD198 per tCO2-e borne by the system owner.
Technical, economic, and mitigation performance of small-scale hydroelectric… 11
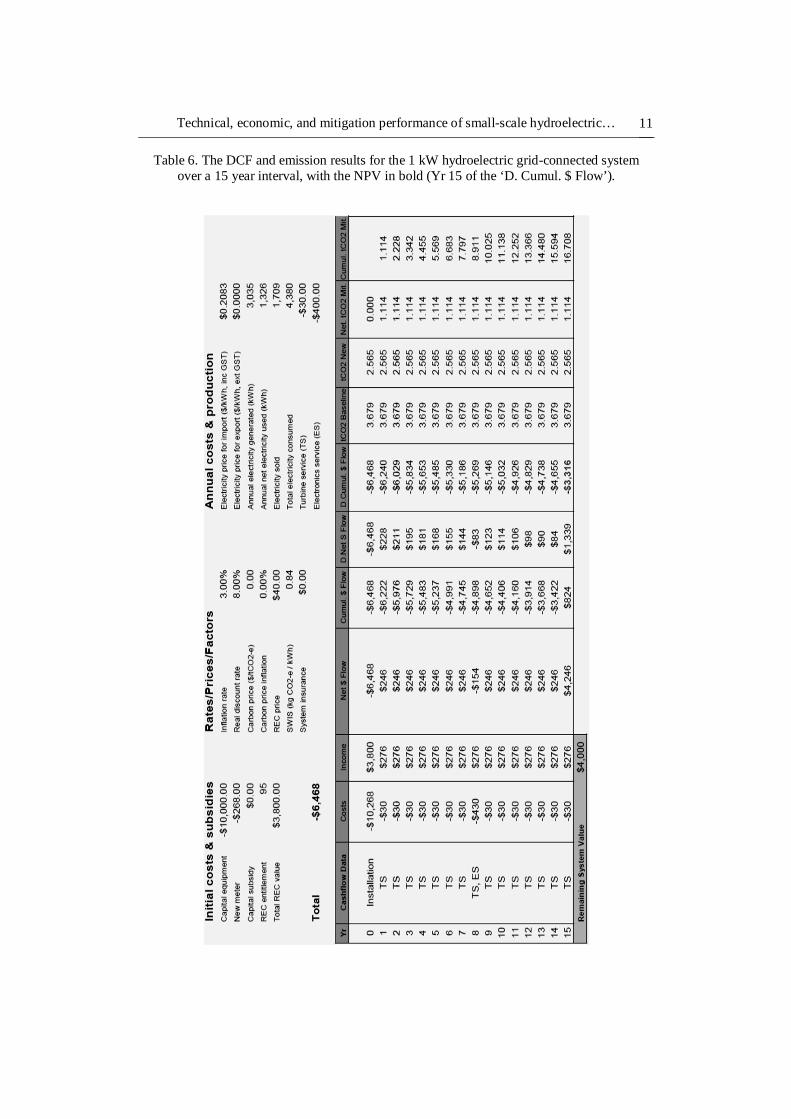
Table 6. The DCF and emission results for the 1 kW hydroelectric grid-connected system over a 15 year interval, with the NPV in bold (Yr 15 of the ‘D. Cumul. $ Flow’).

Mark P. McHenry 12
Table 7. A comparison between the 3 kW wind, 3 kW PV, and 1 kW hydroelectric grid-connected system’s total market adaptation potential (NPV) and market mitigation potential
over the 15 year investment cycle. Source: [23-25].
3 kW PV 3 kW wind 1 kW hydro
NPV AUD-15,015 AUD-13,387 AUD-3,316
Mitigation (tCO2-e) 20.954 17.728 16.708
Mitigation cost (AUD tCO2-e-1 ) 716 755 198
While again noting many uncertainties and assumptions, the 1 kW hydroelectric grid-
connected system was not a commercially attractive option with a NPV of around AUD-3,300 over the 15 years. The market mitigation potential of the system was 16.708 tCO2-e over the 15 year interval, which was less than the comparable 3 kW PV and 3 kW wind systems in the region [23-25]. In a similar manner to the 3 kW PV and wind systems, the relatively small market mitigation potential offered by the 1 kW hydroelectric system was not an economically attractive mitigation measure. For comparison, the author has undertaken a re-modelling of the 1 kW hydroelectric system with the following assumptions:
• the RECs-related capital subsidy remains the same; • the 1 kW hydroelectric system outputs and homestead load profiles remain identical; • electricity import prices remain identical over the period; • carbon prices remain as zero; • the K1 tariff is now eligible for Synergy’s REBS (AUD0.07 kWh-1), akin to the
SmartPower/A1 tariffs, and; • an additional WA State Government FiT of AUD0.40 kWh-1 (net) is available on the
K1 tariff for the first 10 years. This creates a real value of AUD0.47 kWh-1 for exported electricity in the first ten years, and a real value of AUD0.07 kWh-1 after the first ten years.
The results of the new modeled scenario are shown in Table 8. The NPV of the 1 kW
hydroelectric system with a FiT was an attractive investment from the perspective of the owner at AUD2,074 over the 15 year model, with a strong influence of the 10 year FiT, with a distinct downturn in cashflow after year 10. Based on the new scenario assumptions the 1 kW hydroelectric system has both a positive market mitigation potential of 16.708 tCO2-e, and a positive market adaptation potential of AUD2,074. The positive market adaptation potential (or a negative abatement cost) of AUD124 tCO2
-1 was an attractive investment to both adapt to electricity price increases and reduce any carbon liability of a private investor. However, the author points out that the unsubsidised system (excluding the capital SGU rebate and the FiT) would result in a NPV of AUD-7,116 for the private owner (Table 9).

Technical, economic, and mitigation performance of small-scale hydroelectric… 13
Table 8. The DCF and emission results for the 1 kW hydroelectric grid-connected system with a 10-year AUD0.47 kWh-1 FiT for exported electricity, and standard Synergy REBS
values after the 10 year period. The NPV is in bold (Yr 15 of the ‘D. Cumul. $ Flow’).

Mark P. McHenry 14
Table 9. The DCF and emission results for the 1 kW hydroelectric grid-connected system, minus any government subsidy or FiT mechanism over a 15 year interval, with the NPV in
bold (Yr 15 of the ‘D. Cumul. $ Flow’).
Technical, economic, and mitigation performance of small-scale hydroelectric… 15
A 120 W PV STAND-ALONE 60 W WATER PUMPING SYSTEM There are an estimated 1000 PV water pumping systems in WA alone [28]. The primary
reason that WA agriculturalists are installing PV water pumping systems is to improve the reliability of stock water supplies, particularly reducing the need for windmill pumping and associated annual servicing requirements [29]. Water pumping systems are the most common renewable energy system in agricultural regions of WA [28]. However, most water pumping systems are small in terms of rated output and are used when the electricity network, or owner constructed reticulated water supply systems are uneconomic or unavailable. This feasibility study compares the economics between a small (60 W) water pumping system for stock watering using a 120 W PV array, relative to SWIS network grid-connected pump of identical capacity. The small 60 W pump was designed to provide 1000 L day-1 in winter and also 1500 L day-1 for stock-watering in summer at a total dynamic head of 16 m.
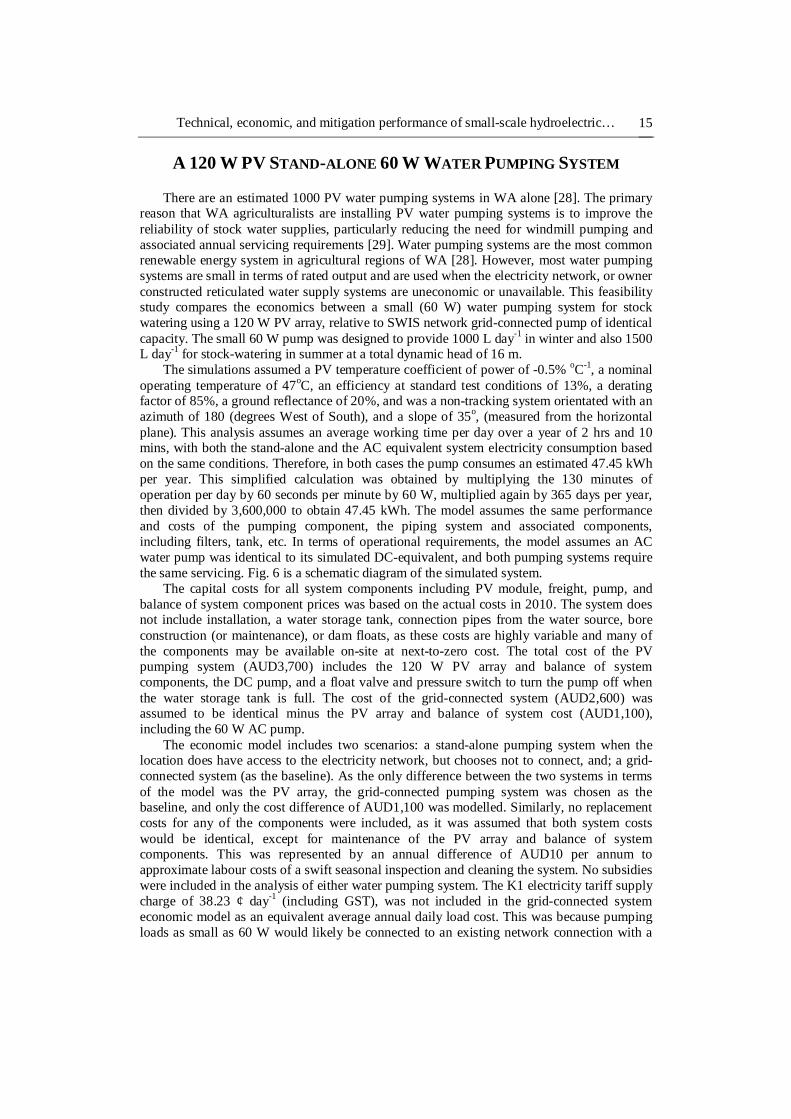
The simulations assumed a PV temperature coefficient of power of -0.5% oC-1, a nominal operating temperature of 47oC, an efficiency at standard test conditions of 13%, a derating factor of 85%, a ground reflectance of 20%, and was a non-tracking system orientated with an azimuth of 180 (degrees West of South), and a slope of 35o, (measured from the horizontal plane). This analysis assumes an average working time per day over a year of 2 hrs and 10 mins, with both the stand-alone and the AC equivalent system electricity consumption based on the same conditions. Therefore, in both cases the pump consumes an estimated 47.45 kWh per year. This simplified calculation was obtained by multiplying the 130 minutes of operation per day by 60 seconds per minute by 60 W, multiplied again by 365 days per year, then divided by 3,600,000 to obtain 47.45 kWh. The model assumes the same performance and costs of the pumping component, the piping system and associated components, including filters, tank, etc. In terms of operational requirements, the model assumes an AC water pump was identical to its simulated DC-equivalent, and both pumping systems require the same servicing. Fig. 6 is a schematic diagram of the simulated system.
The capital costs for all system components including PV module, freight, pump, and balance of system component prices was based on the actual costs in 2010. The system does not include installation, a water storage tank, connection pipes from the water source, bore construction (or maintenance), or dam floats, as these costs are highly variable and many of the components may be available on-site at next-to-zero cost. The total cost of the PV pumping system (AUD3,700) includes the 120 W PV array and balance of system components, the DC pump, and a float valve and pressure switch to turn the pump off when the water storage tank is full. The cost of the grid-connected system (AUD2,600) was assumed to be identical minus the PV array and balance of system cost (AUD1,100), including the 60 W AC pump.
The economic model includes two scenarios: a stand-alone pumping system when the location does have access to the electricity network, but chooses not to connect, and; a grid-connected system (as the baseline). As the only difference between the two systems in terms of the model was the PV array, the grid-connected pumping system was chosen as the baseline, and only the cost difference of AUD1,100 was modelled. Similarly, no replacement costs for any of the components were included, as it was assumed that both system costs would be identical, except for maintenance of the PV array and balance of system components. This was represented by an annual difference of AUD10 per annum to approximate labour costs of a swift seasonal inspection and cleaning the system. No subsidies were included in the analysis of either water pumping system. The K1 electricity tariff supply charge of 38.23 ¢ day-1 (including GST), was not included in the grid-connected system economic model as an equivalent average annual daily load cost. This was because pumping loads as small as 60 W would likely be connected to an existing network connection with a
Mark P. McHenry 16
much greater load demand to render the supply charge component negligible, and only a unit charge of AUD0.2083 kWh-1 was included.
Fig. 6. PV pumping system schematic.
TECHNICAL SIMULATION, ADAPTATION & MITIGATION RESULTS &
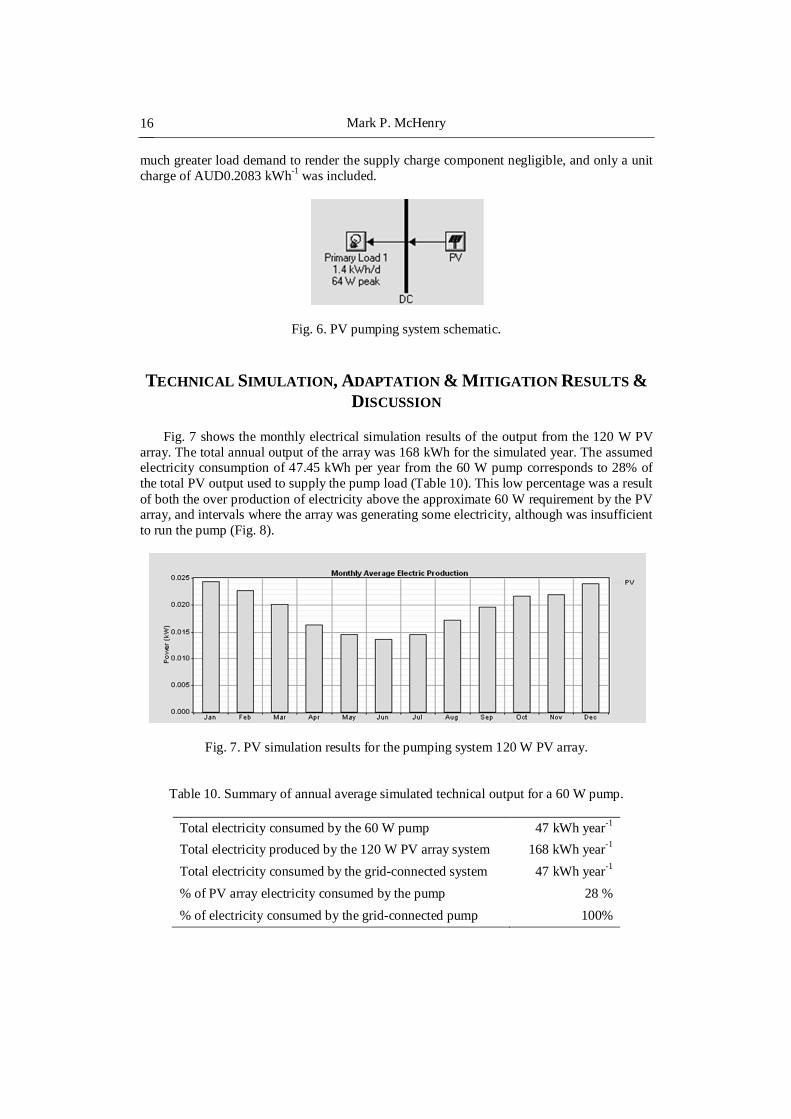
DISCUSSION Fig. 7 shows the monthly electrical simulation results of the output from the 120 W PV
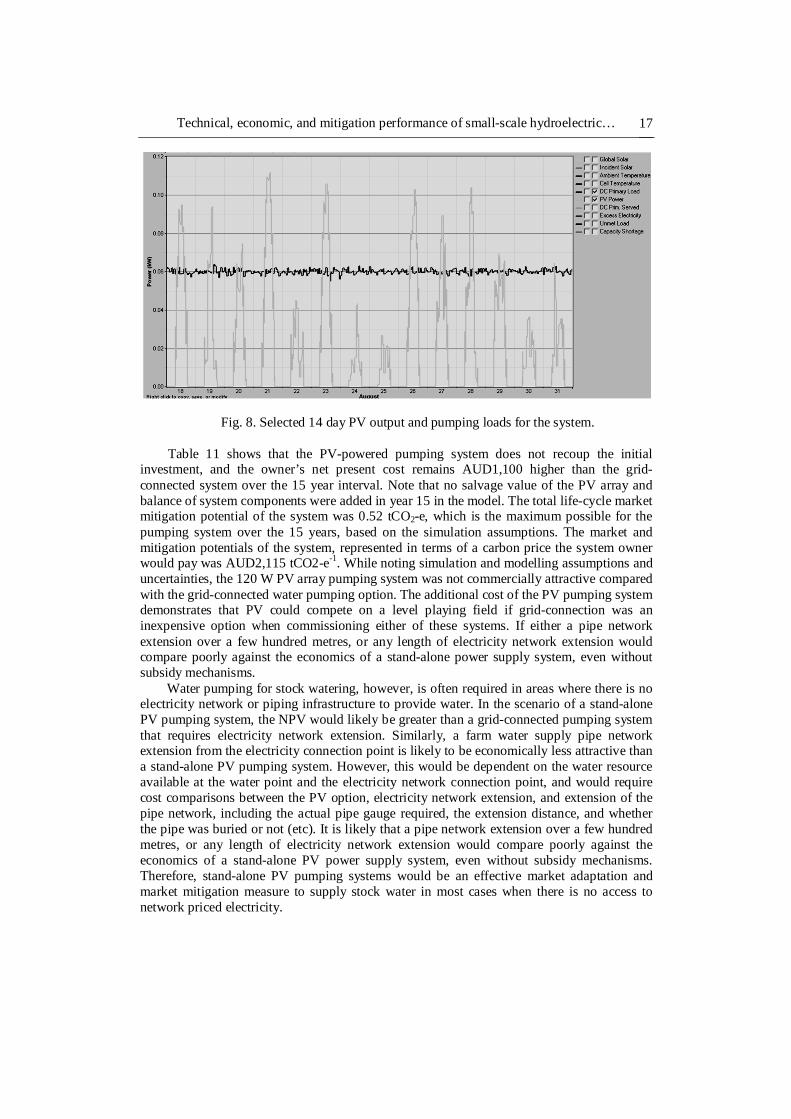
array. The total annual output of the array was 168 kWh for the simulated year. The assumed electricity consumption of 47.45 kWh per year from the 60 W pump corresponds to 28% of the total PV output used to supply the pump load (Table 10). This low percentage was a result of both the over production of electricity above the approximate 60 W requirement by the PV array, and intervals where the array was generating some electricity, although was insufficient to run the pump (Fig. 8).
Fig. 7. PV simulation results for the pumping system 120 W PV array.
Table 10. Summary of annual average simulated technical output for a 60 W pump.
Total electricity consumed by the 60 W pump 47 kWh year-1
Total electricity produced by the 120 W PV array system 168 kWh year-1
Total electricity consumed by the grid-connected system 47 kWh year-1
% of PV array electricity consumed by the pump 28 %
% of electricity consumed by the grid-connected pump 100%
Technical, economic, and mitigation performance of small-scale hydroelectric… 17
Fig. 8. Selected 14 day PV output and pumping loads for the system.
Table 11 shows that the PV-powered pumping system does not recoup the initial investment, and the owner’s net present cost remains AUD1,100 higher than the grid-connected system over the 15 year interval. Note that no salvage value of the PV array and balance of system components were added in year 15 in the model. The total life-cycle market mitigation potential of the system was 0.52 tCO2-e, which is the maximum possible for the pumping system over the 15 years, based on the simulation assumptions. The market and mitigation potentials of the system, represented in terms of a carbon price the system owner would pay was AUD2,115 tCO2-e-1. While noting simulation and modelling assumptions and uncertainties, the 120 W PV array pumping system was not commercially attractive compared with the grid-connected water pumping option. The additional cost of the PV pumping system demonstrates that PV could compete on a level playing field if grid-connection was an inexpensive option when commissioning either of these systems. If either a pipe network extension over a few hundred metres, or any length of electricity network extension would compare poorly against the economics of a stand-alone power supply system, even without subsidy mechanisms.
Water pumping for stock watering, however, is often required in areas where there is no electricity network or piping infrastructure to provide water. In the scenario of a stand-alone PV pumping system, the NPV would likely be greater than a grid-connected pumping system that requires electricity network extension. Similarly, a farm water supply pipe network extension from the electricity connection point is likely to be economically less attractive than a stand-alone PV pumping system. However, this would be dependent on the water resource available at the water point and the electricity network connection point, and would require cost comparisons between the PV option, electricity network extension, and extension of the pipe network, including the actual pipe gauge required, the extension distance, and whether the pipe was buried or not (etc). It is likely that a pipe network extension over a few hundred metres, or any length of electricity network extension would compare poorly against the economics of a stand-alone PV power supply system, even without subsidy mechanisms. Therefore, stand-alone PV pumping systems would be an effective market adaptation and market mitigation measure to supply stock water in most cases when there is no access to network priced electricity.

Mark P. McHenry 18
Table 11. The DCF and emission results for the 60 W PV stand-alone water pumping system over the 15 year interval. The NPV is in bold (Yr 15 of the ‘D. Cumul. $ Flow’).
Technical, economic, and mitigation performance of small-scale hydroelectric… 19
CONCLUSION The results suggest the technical performance of small-scale grid-connected (≤1 kWe)
hydroelectric systems have the higher technical potential than many comparable small-scale grid-connected technical alternatives over the short-to-medium term in the region, despite current drying conditions in the SW of WA. However, the limited number of areas that are allowed to be converted into even very small hydroelectric intake dams limit this type of technology considerably in WA. Conversely, whilst the small-scale stand-alone PV water pumping system could not compete against grid-connected electricity when a connection was available, the technology is an effective market adaptation and market mitigation measure to supply stock water in practice. This is because stock watering requirements are generally off-grid, and a stand-alone PV pumping system NPV would likely be greater than a grid-connected pumping system that requires electricity network extension. This work demonstrates that the local considerations and external factors to technologies, costs, and any available subsidies are overshadowed by practical concerns in rural areas. Nonetheless, all of the renewable energy systems assessed were expensive adaptation and mitigation options when competing with the currently low cost of network electricity service provision when a suitable connection is available (in terms of the discounted net present cost against 2010 system market prices and subsidies).
REFERENCES
[1] Harries, D., McHenry, M., Jennings, P., Thomas, C., (2006). Hydro, tidal and wave energy in Australia. Int. J. Environ. Stud. 63(6), 803-814.
[2] Risbey, J., Kandlikar, M., Dowlatabadi, H., Graetz, D., (1999). Scale, context, and decision making in agricultural adaptation to climate variability and change. Mitig. Adapt. Strat. Global Change. 4, 137-165.
[3] Whetton, P.H., McInnes, K.L., Jones, R.N., Hennessy, K.J., Suppiah, R., Page, C.M., Bathols, J., Durack, P.J., (2005). Australian climate change projections for impact assessment and policy application: A review. in CSIRO Marine and Atmospheric Research, CSIRO.
[4] Hope, P.K., Drosdowsky, W., Nicholls, N., (2006). Shifts in the synoptic systems influencing southwest Western Australia. Clim. Dynam. 26, 751-764.
[5] Australian Greenhouse Office. (2007). Detecting, understanding & attributing climate change, Department of the Environment and Water Resources, Editor. 2007, Australian Greenhouse Office.
[6] Power, S., Sadler, B., Nicholls, N., (2005). The influence of climate science on water management in Western Australia: Lessons for climate scientists. B. Am. Meteorol. Soc. June 2005.
[7] Nicholls, N., (1991). The El Nino / Southern Oscillation and Australian vegetation. Plant Ecol. 91, 23-36.
[8] Nicholls, N., (2004). The changing nature of Australian droughts. Climatic Change. 63, 323-336.
[9] Intergovernmental Panel on Climate Change. (2007). Longer Report. In: Climate Change 2007: Synthesis Report. in Intergovernmental Panel on Climate Change Fourth Assessment Report. Cambridge, United Kingdom: Cambridge University Press.
[10] Suppiah, R., Hennessy, K.J., Whetton, P.H., McInnes, K., Macadam, I., Bathols, J., Ricketts, J., Page, C.M., (2007). Australian climate change projections derived from
Mark P. McHenry 20
simulations performed for the IPCC 4th Assessment Report. Aust. Meteorol. Mag. 131, 131-152.
[11] Hightower, M., (2009). Energy and water issues and challenges - completing the energy sustainability puzzle, in REUSE 09. 2009, Sandia National Laboratories, New Mexico, USA: Brisbane, Australia.
[12] U.S. Department of Energy. (2006). Energy demands on water resources: report to Congress on the interdependency of energy and water. http://www.ssandia.gov/energy-water/docs/121-RptToCongress-EWwEIAcomments-FINAL.pdf.
[13] Carter, T.R., Jones, R.N., Lu, X., Bhadwal, S., Conde, C., Mearns, L.O., O'Neill, B.C., Rounsevell, M.D.A., Zurek, M.B., (2007). New assessment methods and the characterisation of future conditions. in Climate Change 2007: Impacts, Adaptation and Vulnerability. Contribution of Working Group II to the Fourth Assessment Report of the Intergovernmental Panel on Climate Change. Cambridge, United Kingdom: Cambridge University Press.
[14] Barker, T., Bashmakov, I., Alharthi, A., Amann, M., Cifuentes, L., Drexhage, J., Duan, M., Edenhofer, O., Flannery, B., Grubb, M., Hoogwijk, M., Ibitoye, F.I., Jepma, C.J., Pizer, W.A., Yamaji, K., (2007). 2007: Mitigation from a cross-sectoral perspective. in In Climate Change 2007: Mitigation. Contribution of Working Group III to the Fourth Assessment Report of the Intergovernmental Panel on Climate Change. Cambridge, United Kingdom and New York, USA: Cambridge University Press.
[15] Klein, R.J.T., Huq, S., Denton, F., Downing, T.E., Richels, R.G., Robinson, J.B., Toth, F.L., (2007). Interrelationships between adaptation and mitigation. in Climate Change 2007: Impacts, Adaptation and Vulnerability. Contribution of Working Group II to the Fourth Assessment Report of the Intergovernmental Panel on Climate Change. Cambridge, United Kingdom: Cambridge University Press.
[16] Cullen, L.E., Grierson, P.F., (2009). Multi-decadal scale variability in autumn-winter rainfall in south-western Australia since 1655 AD as reconstructed from tree rings of Callitris columellaris. Clim. Dynam. 33(2-3), 433-444.
[17] Harle, K.J., Howden, S.M., Hunt, L.P., Dunlop, M., (2007). The potential impact of climate change on the Australian wool industry by 2030. Agr. Syst. 93, 61-89.
[18] Kirono, D.G.C., Chiew, F.H.S., Kent, D.M., (2010). Identification of best predictors for forecasting seasonal rainfall and runnoff in Australia Hydrol. Process. 24(10), 1237-1247.
[19] HOMER Energy LLC. (2010). HOMER Version 2.68 beta. 2010. [20] Department of Natural Resources Canada. (2010). RETScreen Version 4. 2010. [21] Synergy. (2010). Tariff prices. 2010, 27 October www.synergy.net.au. [22] Office of Energy. (2009). Electricity retail market review. Final recommendations report
review of electricity tariff arrangements. Office of Energy report to the Minister for Energy. Perth: Government of Western Australia.
[23] McHenry, M.P., (2012). A technical, economic, and greenhouse gas emission analysis of a homestead-scale grid-connected and stand-alone photovoltaic and diesel systems, against electricity network extension. Renew. Energ. 38, 126-135.
[24] McHenry, M.P., (2012). Small-scale (≤6 kWe) stand-alone and grid-connected photovoltaic, wind, hydroelectric, biodiesel, and wood gasification system’s simulated technical, economic, and mitigation analyses for rural regions in Western Australia. Renew. Energ. 38, 195-205.
[25] McHenry, M.P., (2012). Are small-scale grid-connected photovoltaic systems a cost-effective policy for lowering electricity bills and reducing carbon emissions? A technical, economic, and carbon emission analysis. Energ. Policy. 45, 64-72.
[26] McHenry, M.P., (2011). Integrating climate change mitigation and adaptation: Refining theory for a mathematical framework to quantify private and public cost-effectiveness, and carbon emissions for energy and development projects. Renew. Energ. 36(4), 1166-1176.

Technical, economic, and mitigation performance of small-scale hydroelectric… 21
[27] Office of the Renewable Energy Regulator. (2010). Website. 2010, 19 August www.orer.gov.au.
[28] McHenry, M.P., (2009). Remote area power supply system technologies in Western Australia: New developments in 30 years of slow progress. Renew. Energ. 34, 1348-1353.
[29] McHenry, M.P., (2009). Why are remote Western Australians installing renewable energy technologies in stand-alone power supply systems? Renew. Energ. 34, 1252-1256.