muskrat falls project - ce-06 rev. 1 (public) page 1 of 30 transient stability is the main focus of...
TRANSCRIPT

Muskrat Falls Project - CE-06 Rev. 1 (Public) Page 1 of 30

Newfoundland and Labrador Hydro - Lower Churchill Project
DC1020 - HVdc System Integration StudyMulti-Terminal HVdc Link PSSE Stability Model
Volume 4 - Final Report - May 2008
PRH325967.10045, Rev. 0, Page i
Table of Contents
Executive Summary
1. Introduction ......................................................................................................................................... 1-1
1.1 Objectives................................................................................................................................... 1-1 1.2 Procedure ................................................................................................................................... 1-1
2. PSSE Model – HVdc Configurations ..................................................................................................... 2-1
3. PSCAD and PSSE Model Descriptions .................................................................................................. 3-1
4. Validation Testing – Description of Test Systems and Contingencies ................................................... 4-1
4.1 Equivalent Test System................................................................................................................ 4-1 4.2 Reduced PSSE Model Test System ............................................................................................... 4-1 4.3 Contingencies ............................................................................................................................. 4-2
5. Validation Testing – Comparison of PSSE and PSCAD Models ............................................................. 5-1
5.1 Results – Equivalent Test System ................................................................................................. 5-2 5.2 Results – Reduced PSSE Model Test Systems............................................................................... 5-2
6. Model Use Instructions for End User ................................................................................................... 6-1
6.1 Model Files Delivered................................................................................................................. 6-1 6.2 Notes for First Time Model Use................................................................................................... 6-1 6.3 IPLAN Program to Move to a New HVdc Loadflow Operating Point ........................................... 6-2 6.4 Dynamic Model User – Settable Parameters – CONs and ICONs................................................ 6-4
6.4.1 CONs................................................................................................................................ 6-4 6.4.2 ICONs............................................................................................................................... 6-5
6.5 Simulating a Power Ramp ........................................................................................................... 6-5 6.6 Simulating a Permanent Block of One Pole ................................................................................. 6-6
References Appendices
Appendix A – Diagram of Equivalent Test System
Appendix B – Lower Churchill HVdc PSSE Model Datasheet
Appendix C – Validation Test Results – Equivalent Source Model
Appendix D – Validation Test Results – BC1-DC1
Appendix E – Validation Test Results – BC2-DC3
Appendix F – Validation Test Results – BC8-DC8
Appendix G – Validation Test Results – BC1-DC7
Muskrat Falls Project - CE-06 Rev. 1 (Public) Page 2 of 30

Newfoundland and Labrador Hydro - Lower Churchill Project
DC1020 - HVdc System Integration StudyMulti-Terminal HVdc Link PSSE Stability Model
Volume 4 - Final Report - May 2008
PRH325967.10045, Rev. 0, Page ii
Executive Summary
A custom user-written two-timestep PSSE transient stability model representing the Lower Churchill multi-terminal HVdc link has been developed for use in future PSSE studies. The model represents the dynamics of the HVdc overhead lines and cables, and includes simplified fast HVdc closed-loop controls that are directly based on the controls used in the PSCAD electromagnetic transients model.
PSSE model validation was performed against the same PSCAD model as was used in the WTO DC1020 transient stability studies. Validation testing showed excellent correlation between the PSSE and PSCAD dynamic performance for most faults during various powerflow and HVdc configurations. Any differences in results can be attributed to inherent differences between the three-phase switching solution used in an electromagnetic transient program, such as PSCAD, and the positive-sequence phasor-based solution of transient stability software, such as PSSE. Validation testing provided excellent comparability within the degree possible between two such different types of models.
The PSSE multi-terminal HVdc model was programmed to be capable of operating in bipolar or monopolar modes for the following HVdc configurations:
1. 3-terminal: Gull Island – rectifier, Soldiers Pond – inverter, Salisbury – inverter
2. 2-terminal: Soldiers Pond – rectifier, Salisbury – inverter
3. 2-terminal: Salisbury – rectifier, Soldiers Pond – inverter
Validation testing was performed on various powerflows to demonstrate the PSSE model performance of all three of the HVdc configurations listed above.
The validation testing was performed using the PSCAD version 4.2.1 software package and the PSSE version 30.2 software package.
Instructions on how to use the model are contained in the last section of this report.
Muskrat Falls Project - CE-06 Rev. 1 (Public) Page 3 of 30

Newfoundland and Labrador Hydro - Lower Churchill Project
DC1020 - HVdc System Integration StudyMulti-Terminal HVdc Link PSSE Stability Model
Volume 4 - Final Report - May 2008
PRH325967.10045, Rev. 0, Page 1-1
1. Introduction This report provides end-user instructions and validates the custom PSSE transient stability model of the multi-terminal high voltage direct current (“HVdc”) link that was developed specifically for the Lower Churchill Project for work task order (“WTO”) DC1020. This report discusses the results of the validation testing that was performed against the same PSCAD model that was developed and used for the transient-stability studies portion of WTO DC1020.
The multi-terminal HVdc PSSE stability model represents the three-terminal HVdc bipole connecting Gull Island (Station A) in Labrador, Soldiers Pond (Station B) in Newfoundland Island and Salisbury (Station C) in New Brunswick.
The standard PSSE library contains only a response-type model for a multi-terminal HVdc link. This response-type model does not include any of the DC line/cable dynamics, nor does it model any of the HVdc closed-loop controls. Such a model also requires that one of the inverters be operated in voltage-control mode, which is not consistent with the control scheme used by the PSCAD model in the transient stability analysis. Therefore, a custom model of the multi-terminal HVdc link was developed for use in future PSSE studies to represent the response of the multi-terminal HVdc system more accurately. This custom model is based on a two-timestep algorithm that allows for detailed controls and for HVdc overhead line and cable dynamics to be represented while still ensuring numerical stability. For more detailed information on response-type models compared to the two-timestep model, please refer to [1].
Validation testing was performed using the PSCAD version 4.2.1 software package and the PSSE version 30.2 software package.
1.1 Objectives
The objectives of the PSSE multi-terminal HVdc stability model development are to:
1. Develop a custom PSSE stability model of the multi-terminal HVdc link using simplified controls that are based on the PSCAD model used in the transient stability studies of WTO DC1020.
2. Develop a PSSE IPLAN program to provide a simple method for the end user to set up a desired powerflow on the HVdc link in the PSSE loadflow program so that the model will initialize properly for use with the custom PSSE stability model.
3. Validate the PSSE stability model against the PSCAD model for various loadflows and contingencies.
1.2 Procedure
The PSSE model was developed using the following procedure:
1. Create simplified controls based on the detailed PSCAD model for inclusion with the PSSE model.
2. Write the Fortran code to represent the multi-terminal HVdc overhead lines and cables and the DC controls for use in PSSE.
Muskrat Falls Project - CE-06 Rev. 1 (Public) Page 4 of 30

Newfoundland and Labrador Hydro - Lower Churchill Project
DC1020 - HVdc System Integration StudyMulti-Terminal HVdc Link PSSE Stability Model
Volume 4 - Final Report - May 2008
PRH325967.10045, Rev. 0, Page 1-2
3. Validate the PSSE model by comparing dynamic performance of the PSSE model to the PSCAD model for various contingencies during various powerflow scenarios.
4. Provide instructions for the end user to implement and use the custom PSSE model.
Muskrat Falls Project - CE-06 Rev. 1 (Public) Page 5 of 30

Newfoundland and Labrador Hydro - Lower Churchill Project
DC1020 - HVdc System Integration StudyMulti-Terminal HVdc Link PSSE Stability Model
Volume 4 - Final Report - May 2008
PRH325967.10045, Rev. 0, Page 2-1
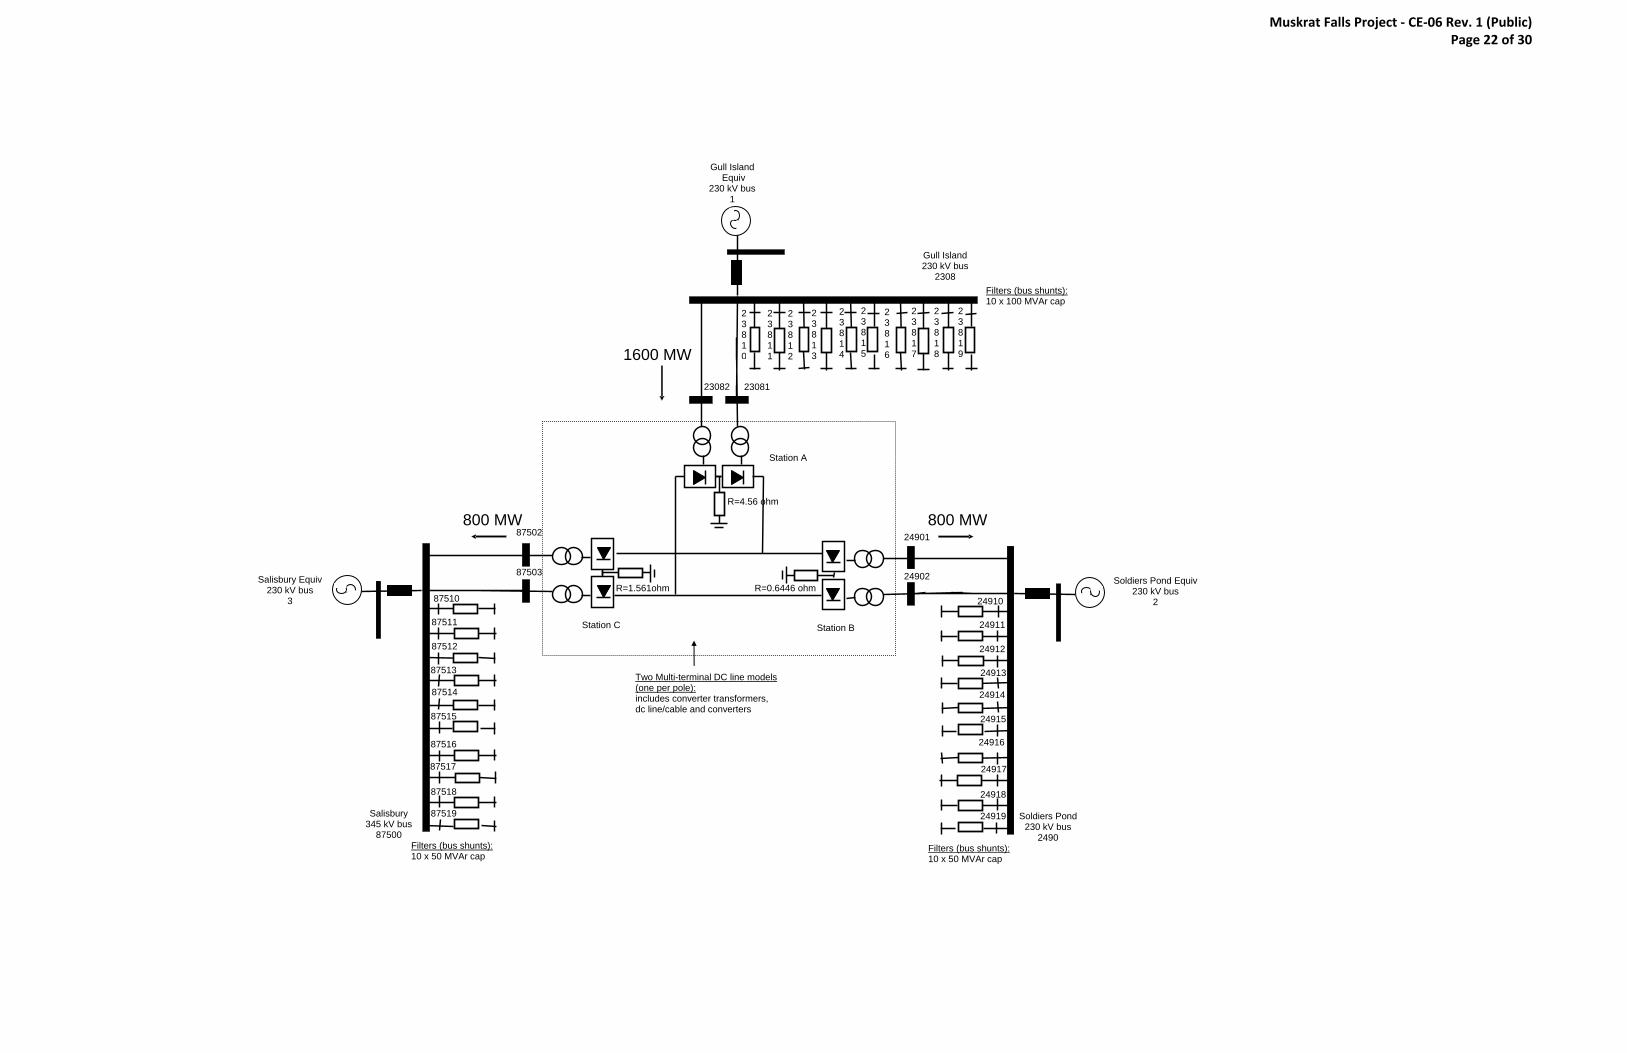
2. PSSE Model – HVdc Configurations The loadflow portion of the Lower Churchill multi-terminal HVdc model is set up using two PSSE multi-terminal DC line models (one for each pole of the bipole) and a series of filter shunt branches connected to the three existing system buses that will become the commutating buses of the HVdc link, namely Gull Island 230 kV bus, Soldiers Pond 230 kV bus, and Salisbury 345 kV bus. Appendix A shows this setup in an equivalent voltage-source test system, along with the PSSE bus numbers used in this test system.
As the electrode lines and ground resistances are of no impact in bipolar mode, ground resistances of each electrode and each electrode line are modeled only if the HVdc link is operating in monopolar mode. A provided IPLAN program (LCPDC.irf, as described in Section 6 herein) can be used to set up the desired HVdc configuration and powerflow, and will automatically insert the appropriate ground resistance and electrode line parameter values into the HVdc model if the user chooses to operate in monopolar mode.
The IPLAN program takes the zero impedance branches that connect each filter to the commutating bus in or out of service as needed.
The PSSE multi-terminal HVdc dynamic model was programmed to be capable of operating in bipolar or monopolar modes for the following HVdc configurations:
1. 3-terminal: Gull Island – rectifier, Soldiers Pond – inverter, Salisbury – inverter
2. 2-terminal: Soldiers Pond – rectifier, Salisbury – inverter
3. 2-terminal: Salisbury – rectifier, Soldiers Pond – inverter
Please note that the PSSE model has been programmed only to model monopolar operation in which all three terminals are operating in monopolar mode, i.e. an entire pole is out-of-service. Mixed mode operation where two terminals operate bipolar and the third terminal operates monopolar is not currently supported within the model.
While in reality it will be possible to operate any of the three terminals as rectifier or inverter, it was not possible to include all of the combinations of configurations in the PSSE model due to time constraints. The three HVdc configurations that are included in the PSSE model were chosen because they demonstrate the feasibility and worst case configurations of the multi-terminal link. Gull Island as inverter was not included as it is assumed this would be the least likely mode of operation of the Lower Churchill HVdc link.
Muskrat Falls Project - CE-06 Rev. 1 (Public) Page 6 of 30

Newfoundland and Labrador Hydro - Lower Churchill Project
DC1020 - HVdc System Integration StudyMulti-Terminal HVdc Link PSSE Stability Model
Volume 4 - Final Report - May 2008
PRH325967.10045, Rev. 0, Page 3-1
3. PSCAD and PSSE Model Descriptions This report compares results from two different models:
• PSSE Transient Stability Lower Churchill HVdc Model
• PSCAD (Electromagnetic Transient) Lower Churchill HVdc Model
PSSE Transient Stability is the main focus of this report. The PSSE transient stability solution is a fundamental frequency phasor-based solution, and does not represent switching harmonics or individual phase quantities. A typical timestep used in PSSE simulation is a half-cycle, or 8.33 ms, which is large relative to that used in PSCAD simulations. Accordingly, the user-written model alone is run at a smaller internal timestep in order to maintain numerical stability due to the small integration timesteps of the HVdc current, voltage, and gamma controllers, and to the differential equations associated with the line and cable capacitances and inductances. Since the PSSE model is a phasor-based solution and does not represent individual thyristors, commutation failures cannot be modeled accurately. In order to represent the response to a commutation failure of the HVdc link, the inverter is forced into “bypass” mode if the inverter extinction angle gamma falls below a certain internal model setpoint. This setpoint represents the minimum extinction angle below which the converter is assumed to fail commutation.
The PSCAD model is the actual project model used in the transient stability studies for WTO DC1020. It represents the details of all of the converter controls, including the DC converter current, voltage, and gamma controllers along with low level valve firing controls to produce firing pulses used to turn individual thyristors on and off. Filtering functions for signal measurement and conditioning are used to remove the harmonics generated by the converter. This model is the more accurate of the two, since it represents all parts of the control system and does not make any approximations. In electromagnetic transient simulation, network equations are solved at a series of discrete intervals (timesteps). A typical timestep used in a PSCAD simulation is 50 μs.
More accurate than the PSSE Transient Stability model, the PSCAD model includes all of the low-level firing controls, as well as the non-linear aspects of the electrical grid (such as transformer saturation). The application and removal of the fault are also point-on-wave dependent in the PSCAD solution (i.e. the fault can be applied at a peak voltage or at a zero point), which can affect the initial control response. The controls in the PSCAD model also respond to certain events, such as the detection of commutation failures and the sensing of individual phase voltages, which cannot be represented in the PSSE model. As such, more accurate results are expected with the PSCAD model. Transient stability programs, such as PSSE, produce only positive-sequence voltages.
Muskrat Falls Project - CE-06 Rev. 1 (Public) Page 7 of 30

Newfoundland and Labrador Hydro - Lower Churchill Project
DC1020 - HVdc System Integration StudyMulti-Terminal HVdc Link PSSE Stability Model
Volume 4 - Final Report - May 2008
PRH325967.10045, Rev. 0, Page 4-1
4. Validation Testing – Description of Test Systems and Contingencies 4.1 Equivalent Test System
Validation of the PSSE model was first performed using an equivalent test system as shown in Appendix A. A test system with simple ac equivalents representing short-circuit levels of 8694 MVA at Gull Island (Station A), 2994 MVA at Soldiers Pond (Station B) and MVA at Salisbury (Station C) were used. The Gull Island terminal was operated in a bipolar configuration as the rectifier, supplying rated power to the Soldiers Pond and Salisbury terminals, both operating as inverters.
For all dynamic simulations, loads were modeled with the real power portion as constant current loads and with the reactive power portion as constant impedance loads.
The frequency controller at Soldiers Pond was enabled for all simulations.
4.2 Reduced PSSE Model Test System
Validation testing was then performed using the reduced Newfoundland Island and Labrador ac systems PSSE model, the same model representation as was used to perform the transient stability studies in PSCAD. The New Brunswick ac system remained as an equivalent voltage source.
In each of the three possible HVdc configurations that can be simulated with the PSSE model (as described in Section 3) it is possible to run any of them in bipolar or monopolar operation, resulting in a total of six possible HVdc configurations. Monopolar operation was only tested on the three-terminal HVdc configuration as it can be assumed that this validation testing can be extended to both of the two-terminal configurations.
The two two-terminal HVdc configurations, one in which Soldiers Pond is the rectifier and the other in which Salisbury is the rectifier, were tested in bipolar operation using powerflow cases BC8-DC8 and BC1-DC7 respectively.
In order to test the four HVDC configurations described above, the following powerflows were used for validation testing (please refer to the report for the Transient Stability Studies of WTO DC1020 [2] for detailed descriptions of the powerflow cases):
BC1-DC1 - Rated bipolar operation with Gull Island as rectifier and Soldiers Pond and Salisbury as inverters (3-terminal) BC2-DC3 - Monopolar operation with Gull Island as rectifier and Soldiers Pond at 1.5 pu and Salisbury at 1.1 pu overload as inverters (3-terminal) BC8-DC8 - Bipolar operation with Soldiers Pond as rectifier supplying 175 MW to Salisbury (2-terminal) BC1-DC7 - Bipolar operation with Salisbury as rectifier supplying rated power to Soldiers Pond (2-terminal)
Muskrat Falls Project - CE-06 Rev. 1 (Public) Page 8 of 30

Newfoundland and Labrador Hydro - Lower Churchill Project
DC1020 - HVdc System Integration StudyMulti-Terminal HVdc Link PSSE Stability Model
Volume 4 - Final Report - May 2008
PRH325967.10045, Rev. 0, Page 4-2
4.3 Contingencies
The test cases that were simulated are listed in Table 1. Results for all cases comparing the PSCAD model and PSSE model are provided in Appendices 3-7. The PSSE model validation tests were run with the default PSSE timestep of 8.33 ms.
Table 1 Test Case Descriptions
Test No.
Contingency No. [2]
Power Flow Case
Power Flow Description Test Description
T1.1 n/a EQUIV DC Voltage Reference Step at Station A. 1.0 pu -> 0.95 pu -> 1.0 pu
T1.2 n/a EQUIV DC Current Reference Step at Station B. 1.0 pu -> 0.95 pu -> 1.0 pu
T1.3 n/a EQUIV DC Current Reference Step at Station C. 1.0 pu -> 0.95 pu -> 1.0 pu
T1.4 n/a EQUIV 3PF at Station A to 0% voltage for 100 ms. No equipment tripping.
T1.5 n/a EQUIV 3PF at Station B to 0% voltage for 100 ms. No equipment tripping.
T1.6 n/a EQUIV 3PF at Station C to 0% voltage for 100 ms. No equipment tripping.
T1.7 n/a EQUIV 3PF at Station A to 50% voltage for 100 ms. No equipment tripping.
T1.8 n/a EQUIV 3PF at Station B to 50% voltage for 100 ms. No equipment tripping.
T1.9 n/a EQUIV 3PF at Station C to 50% voltage for 100 ms. No equipment tripping.
T1.10 n/a EQUIV 3PF at Station A to 90% voltage for 100 ms. No equipment tripping.
T1.11 n/a EQUIV 3PF at Station B to 90% voltage for 100 ms. No equipment tripping.
T1.12 n/a EQUIV
Equivalent Voltage Source System representing BC1-DC1. [See Appendix C]
3PF at Station C to 90% voltage for 100 ms. No equipment tripping.
T2.1 C15 BC1-DC1 3PF at Station B to 0% voltage for 100 ms. No equipment tripping.
T2.2 C60 BC1-DC1 3PF at Station A to 0% voltage for 100 ms. No equipment tripping.
T2.3 C70 BC1-DC1 3PF at Station C to 0% voltage for 100 ms. No equipment tripping.
T2.4 C17 BC1-DC1 3PF at Bay d’Espoir 230 kV bus. Trip Bay d’Espoir – Pipers Hole line and refinery load.
T2.5 C18 BC1-DC1 3PF at Pipers Hole 230 kV bus. Trip Pipers Hole – Sunnyside line.
T2.6 C19 BC1-DC1 3PF at Sunnyside 230 kV bus. Trip Sunnyside – Western Avalon line.
T2.7 C20 BC1-DC1 3PF at Western Avalon 230 kV bus. Trip Western Avalon – Soldiers Pond line.
T2.8 C21 BC1-DC1 3PF at Soldiers Pond 230 kV bus. Trip Soldiers Pond – Hardwoods line.
T2.9 C22 BC1-DC1
Bipolar three-terminal operation. Gull Island rectifier Soldiers Pond inverter – 1.0 pu Salisbury inverter – 1.0 pu 2016 winter peak Newfoundland Island load (1600 MW) [See Appendix D]
3PF at Oxen Pond 230 kV bus. Trip Oxen Pond – Soldiers Pond line.
Muskrat Falls Project - CE-06 Rev. 1 (Public) Page 9 of 30

Newfoundland and Labrador Hydro - Lower Churchill Project
DC1020 - HVdc System Integration StudyMulti-Terminal HVdc Link PSSE Stability Model
Volume 4 - Final Report - May 2008
PRH325967.10045, Rev. 0, Page 4-3
Test No.
Contingency No. [2]
Power Flow Case
Power Flow Description Test Description
T2.10 C23 BC1-DC1 3PF at Holyrood 230 kV bus. Trip Holyrood – Soldiers Pond line.
T2.11 C72 BC1-DC1 3PF at Pipers Hole 230 kV bus. Trip Pipers Hole – Bay d’Espoir line.
T2.12 C26 BC1-DC1 3PF at Pipers Hole 230 kV bus. Trip Pipers Hole synchronous condenser.
T2.13 C28 BC1-DC1 3PF at Soldiers Pond converter transformer 230 kV Trip converter transformer and Pole 2.
T3.1 C15 BC2-DC3 3PF at Station B to 0% voltage for 100 ms. No equipment tripping.
T3.2 C60 BC2-DC3 3PF at Station A to 0% voltage for 100 ms. No equipment tripping.
T3.3 C70 BC2-DC3 3PF at Station C to 0% voltage for 100 ms. No equipment tripping.
T3.4 C17 BC2-DC3 3PF at Bay d’Espoir 230 kV bus. Trip Bay d’Espoir – Pipers Hole line and refinery load.
T3.5 C19 BC2-DC3
Monopolar 3-terminal operation. Gull Island rectifier Soldiers Pond inverter – 1.5 pu overload Salisbury inverter – 1.1 pu overload Future winter peak Newfoundland Island load (1800MW) [See Appendix E]
3PF at Sunnyside 230 kV bus. Trip Sunnyside – Western Avalon line.
T4.1 C15 BC8-DC8 3PF at Station B to 0% voltage for 100 ms. No equipment tripping.
T4.2 C70 BC8-DC8 3PF at Station C to 0% voltage for 100 ms. No equipment tripping.
T4.3 C17 BC8-DC8 3PF at Bay d’Espoir 230 kV bus. Trip Bay d’Espoir – Pipers Hole line and refinery load.
T4.4 C19 BC8-DC8
Bipolar 2-terminal operation. Gull Island OFF Soldiers Pond rectifier Salisbury inverter – 175 MW Summer night Newfoundland Island load (625 MW) [See Appendix F]
3PF at Sunnyside 230 kV bus. Trip Sunnyside – Western Avalon line.
T5.1 C15 BC1-DC7 3PF at Station B to 0% voltage for 100 ms. No equipment tripping.
T5.2 C70 BC1-DC7 3PF at Station C to 0% voltage for 100 ms. No equipment tripping.
T5.3 C26 BC1-DC7
Bipolar 2-terminal operation. Gull Island OFF Soldiers Pond inverter – 1.0 pu Salisbury rectifier 2016 winter peak Newfoundland Island load (1600 MW) [See Appendix G]
3PF at Pipers Hole 230 kV bus. Trip Pipers Hole synchronous condenser.
Muskrat Falls Project - CE-06 Rev. 1 (Public) Page 10 of 30

Newfoundland and Labrador Hydro - Lower Churchill Project
DC1020 - HVdc System Integration StudyMulti-Terminal HVdc Link PSSE Stability Model
Volume 4 - Final Report - May 2008
PRH325967.10045, Rev. 0, Page 5-1
5. Validation Testing – Comparison of PSSE and PSCAD Models The steady-state and dynamic performance of the PSSE model compares very well to the PSCAD model. Despite inherent differences between the models the comparability of results between the two models is excellent, and correlations are within the degree of accuracy possible given that PSCAD and PSSE use different main program solution methods.
The PSSE Transient Stability model compares very well to the PSCAD model; however, there are some slight differences evident in some cases. The controls for the converter are not represented in full detail in the PSSE model, and a simplified control system has been assumed to be sufficiently accurate and practical for the purposes of transient stability modeling.
Since the PSSE model is a phasor-based solution and does not represent individual thyristors, commutation failures cannot be modeled accurately. In order to represent the response of the HVdc link to a commutation failure, the inverter is forced into “bypass” mode if the inverter firing angle gamma falls below a certain internal model setpoint. Therefore, disturbances that result in a commutation failure in PSCAD may look slightly different in PSSE.
Another inherent difference between the PSCAD and PSSE models is the measurement of the voltages and real and reactive powerflows in these models. The PSCAD method of determining an RMS quantity uses instantaneous three-phase inputs; whereas in PSSE the RMS value is calculated directly.
The measurement of frequency is also different between the PSCAD and PSSE models. In the PSCAD model, the frequency measurement is based on a real-world algorithm in which instantaneous bus voltages are processed via an industry-accepted method used for measuring frequency. In the PSSE model, the frequency measurement is simply taken as the derivative of the bus angle. Due to fast changes in the current injected from the PSSE model, it was seen for certain faults in PSSE that numerical spikes in frequency were possible depending on the fault location. In order to remove or lessen these spikes in frequency, the time constant for the frequency filter used in PSSE was set to 100ms instead of the default 33.3ms. For the two-terminal mode of operation in which Salisbury is operating as the rectifier sending power to Soldiers Pond, frequency spikes at Salisbury that were caused by disturbances in the Newfoundland Island system that resulted in a commutation failure at Soldiers Pond require the frequency filter time constant to be set even higher, up to 200ms. The frequency filter is used to remove numerical issues associated with the PSSE frequency measurement. The time constant for this filter can be modified using the ALTR -> Solution Parameters command in the PSSE dynamics program.
To summarize, the most important issue is that the PSSE model injects the correct currents such that the real and reactive powers at the AC buses – and especially the AC bus voltages – look as close to those of the PSCAD model as possible. The AC bus voltage responses between PSCAD to PSSE compare very well. The upcoming section discusses the test results in more detail.
Muskrat Falls Project - CE-06 Rev. 1 (Public) Page 11 of 30

Newfoundland and Labrador Hydro - Lower Churchill Project
DC1020 - HVdc System Integration StudyMulti-Terminal HVdc Link PSSE Stability Model
Volume 4 - Final Report - May 2008
PRH325967.10045, Rev. 0, Page 5-2
5.1 Results – Equivalent Test System
PSSE results for the validation testing performed on the equivalent test system provide a good comparison with PSCAD.
Some differences are notable in a few cases, particularly the 50% faults in which the HVdc system is on the verge of switching control modes on fault recovery. In some of the PSCAD cases this control mode switching occurs; whereas the PSSE model does not quite switch control modes. It is important to note that control mode switchover can have a noticeable impact on the overall response of the converter. Therefore, responses of the two models look slightly different.
In addition, some slight differences can be seen in current reference responses during fault cases. This is due to the fact that these current references are non-linear functions that are very dependent on the DC-voltage responses (due to voltage-dependent current limits). Any slight difference in DC-voltage response will cause a difference in DC current order.
Despite slight differences as described above, the overall trend of the responses between PSCAD and PSSE are very similar, and become nearly identical by several hundred milliseconds after fault clearing.
Please note that the PSCAD AC voltages are RMS measurements that have a smoothing time constant of 20ms, whereas the PSSE AC voltages are not smoothed, with the exception of the ac voltage measurements on the commutating buses that are coming from measurements inside the custom PSSE HVdc model; these three PSSE AC commutating bus voltages have a smoothing time constant of 8ms which is still not the same as PSCAD. Therefore the ac voltages look slightly different especially on fault application and clearing.
Results for the equivalent test system are provided in Appendix C.
5.2 Results – Reduced PSSE Model Test Systems
Results for the validation testing performed on the reduced PSSE model test systems provide a good comparison with PSCAD as well.
The same comments can be made for these cases as was described for the equivalent test system in Section 5.1.
In addition to these comments, it should be noted that the 300 MVAR synchronous condensers modeled at Pipers Hole and Soldiers Pond do not model the same exciters in PSSE and PSCAD. The PSCAD model includes a more detailed and better exciter model, which was not available in the PSSE library. Therefore, the differences in responses of the synchronous condensers in PSCAD and PSSE are sometimes cause for slight differences in voltage and reactive power quantities in the Newfoundland Island ac system, particularly for faults near to the synchronous condensers.
Also is should be noted that good correlation was seen between the frequency responses of the PSSE and PSCAD models, except during faults. This is because the PSCAD frequency measurement stops
Muskrat Falls Project - CE-06 Rev. 1 (Public) Page 12 of 30

Newfoundland and Labrador Hydro - Lower Churchill Project
DC1020 - HVdc System Integration StudyMulti-Terminal HVdc Link PSSE Stability Model
Volume 4 - Final Report - May 2008
PRH325967.10045, Rev. 0, Page 5-3
measuring during a fault whereas the PSSE model does not, therefore the frequency response during a fault cannot be fairly compared between the two models.
Results for the reduced PSSE model test systems are provided in Appendices D-G.
Please note that for the BC8-DC8 cases in which the Soldiers Pond terminal is exporting to the Salisbury terminal, the transient stability studies determined that the worst case Bay d’Espoir-Pipers Hole fault (contingency 17) requires a fast runback of the HVdc in order to maintain ac system stability on the Newfoundland Island. The custom PSSE model does not include this runback scheme and so this contingency is not shown in the validation testing.
Muskrat Falls Project - CE-06 Rev. 1 (Public) Page 13 of 30

Newfoundland and Labrador Hydro - Lower Churchill Project
DC1020 - HVdc System Integration StudyMulti-Terminal HVdc Link PSSE Stability Model
Volume 4 - Final Report - May 2008
PRH325967.10045, Rev. 0, Page 6-1
6. Model Use Instructions for End User 6.1 Model Files Delivered
The following files were delivered in electronic format. All testing was performed on Windows XP platform, PSSE Version 30.2.
CLCPDC.obj Lower Churchill HVdc dynamic controls and line/cable model compiled code
LCP_HVDC.dyr HVdc model dynamic data input file
LCP_HVDC.raw Powerflow raw data file corresponding to BC1-DC1 powerflow case, 1600 MW Gull Island rectifier, 800 MW Soldiers Pond Inverter, 800 MW Salisbury inverter (rated)
LCPDC.ipl IPLAN program code for user to set up a valid powerflow operating point for the Lower Churchill HVdc link
LCPDC.irf Compiled IPLAN program
LCP_input.dat Input text file containing commutating bus and filter bus numbers, required by IPLAN program.
Test-System.raw* Equivalent test system powerflow data file corresponding to powerflow BC1- DC1
Test-System.dyr Equivalent test system dynamic data file corresponding to powerflow BC1-DC1
*If other test systems representing different HVdc powerflows are required, the provided IPLAN program can be used on the test system powerflow case provided to move to a different operation point. Please see Section 6.3 herein, describing the IPLAN program.
6.2 Notes for First Time Model Use
Prior to performing a dynamic simulation with the Lower Churchill HVdc link in PSSE, the following steps must be taken:
1. The HVdc link and associated equipment must be added to the existing large system loadflow SAV case, as shown in the provided LCP_HVdc.raw file. PLEASE NOTE: The bus numbers associated with the rectifier and inverter commutating buses, the filter buses, and the DC line numbers associated with both HVdc poles can be changed to whatever new bus/line numbers are desired; however, the DYR file must then be changed to match the loadflow configuration (step 3, below). The filters are connected to the ac commutating buses through zero impedance branches and are represented as bus shunts. All circuit IDs for these zero impedance branches should be “1”.
Muskrat Falls Project - CE-06 Rev. 1 (Public) Page 14 of 30

Newfoundland and Labrador Hydro - Lower Churchill Project
DC1020 - HVdc System Integration StudyMulti-Terminal HVdc Link PSSE Stability Model
Volume 4 - Final Report - May 2008
PRH325967.10045, Rev. 0, Page 6-2
2. The provided HVdc controls and line/cable dynamics model file, titled “CLCPDC.obj”, must be placed with other model object files.
3. The contents of the provided dynamic data file, titled “LCP_HVDC.dyr”, must be added into the existing large system SNP snapshot file. PLEASE NOTE: The bus numbers associated with the rectifier and inverter commutating buses as well as the filter buses must be changed to match the loadflow configuration.
6.3 IPLAN Program to Move to a New HVdc Loadflow Operating Point
Once the model has been added to a powerflow case (as described in Section 7.2), the provided IPLAN program, LCPDC.irf, should be used to automatically set up the desired operating point of the HVdc link in the powerflow case.
The IPLAN program contains all of the filter-switching logic. It also ensures that a minimum number of filters are in service for harmonic performance requirements. The PSSE network solution will automatically determine the converter transformer tap-changer setpoints based on the firing angle limits as set in the provided loadflow HVdc data.
Before running the IPLAN program the user must ensure the text file titled “LCP_input.dat” contains the PSSE bus numbers of the commutating buses and the filter buses. An example text file has been included in the model files with bus numbers matching those used in the test system. These numbers should be modified to match the actual loadflow case being used.
The user will be asked to provide the following inputs to the IPLAN program:
-------------------------
1. Whether the HVdc link is to be operated in bipolar or monopolar mode.
-------------------------
SELECT THE NUMBER OF POLES IN OPERATION (NORMAL MODE IS BIPOLAR OPERATION):
1 = MONOPOLAR OPERATION
2 = BIPOLAR OPERATION
(IF MONOPOLAR OPERATION IS SELECTED, THEN THE NEGATIVE POLE WILL BE BLOCKED)
2. The user is allowed to select from the following HVdc configurations. The PSSE model is
programmed to operate in one of only three configurations.
------------------------- SELECT FROM THE FOLLOWING THREE HVdc CONFIGURATIONS (NORMAL CONFIGURATION IS NO 1): CONFIG NO GULL ISLAND SOLDIERS POND SALISBURY 1 RECTIFIER INVERTER INVERTER 2 BLOCKED RECTIFIER INVERTER 3 BLOCKED INVERTER RECTIFIER ENTER CONFIG NO?(1,2,3)
Muskrat Falls Project - CE-06 Rev. 1 (Public) Page 15 of 30

Newfoundland and Labrador Hydro - Lower Churchill Project
DC1020 - HVdc System Integration StudyMulti-Terminal HVdc Link PSSE Stability Model
Volume 4 - Final Report - May 2008
PRH325967.10045, Rev. 0, Page 6-3
3. Depending on the HVdc configuration selected in Step 2 above, the user will be asked first if they
would like to change the inverter power order, and, if so, what the desired power order is on a per-pole basis. The rated power at both Soldiers Pond and Salisbury during bipolar operation is 400 MW per pole. During monopolar operation the continuous overload rating at Soldier Pond is 1.5 pu and at Salisbury is 1.1 pu. Soldiers Pond can also operate at 2 pu overload for 10 minutes.
---------------------------
CURRENT SOLDIERS POND POWER ORDER (PER POLE) = 399.6(MW) CURRENT SOLDIERS POND INVERTER DC CURRENT MAGNITUDE = 888.0(A) CURRENT MAGNITUDE OF DC POWER INFEED AT SOLDIERS POND (PER POLE) = 384.8(MW) CHANGE IT?(y/n) y ENTER SOLDIERS POND INVERTER OUTPUT POWER (MAGNITUDE OF SCHEDULED POWER IN MW, PER POLE) 300.0 MW
------------------------- CURRENT SALISBURY POWER ORDER (PER POLE) = 399.6(MW) CURRENT SALISBURY INVERTER DC CURRENT MAGNITUDE = 888.0(A) CURRENT MAGNITUDE OF DC POWER INFEED AT SALISBURY (PER POLE) = 381.3(MW) CHANGE IT?(y/n) n
-------------------------
4. Then the IPLAN will solve the powerflow using the PSSE activity FDNS (fast decoupled Newton solution) with input from the user as to the options for the solution.
------------------------- SETTING INITIAL FILTER STATUS ENTER OPTIONS FOR FDNS POWERFLOW SOLUTION TAP CODE IS 0 TO LOCK, 1 FOR STEPPING, 2 FOR DIRECT AREA INT CODE IS 0 TO DISABLE, 1 FOR TIE LINES ONLY, 2 FOR TIE LINES AND LOADS ENTER: [TAP] , [AREA INT] , [1 FOR PHASE] , [1 TO FLAT] , [1 TO LOCK] , [1 TO LOCK ] [CODE] [ CODE ] [ SHIFTERS ] [ START ] [D.C. TAPS] [SWCH SHNTS] 1 , , 1 , , ,
5. Then the IPLAN will output a powerflow summary of the HVdc operating point and filter statues, and indicate whether or not the powerflow solution reached convergence.
POWERFLOW SOLUTION REACHED CONVERGENCE TOLERANCE ------------------------- GULL ISLAND FILTER ADJUSTMENT REACTIVE POWERFLOW ABSORBED BY CONVERTER = 723.4 (MVAR) REACTIVE POWERFLOW SUPPLIED BY FILTERS = 820.2 (MVAR) REACTIVE POWER EXCHANGE WITH THE AC SYSTEM = 96.8 (MVAR) NO CHANGE FOR FILTER STATUS ------------------------- SOLDIERS POND FILTER ADJUSTMENT REACTIVE POWERFLOW ABSORBED BY CONVERTER = 445.7 (MVAR) REACTIVE POWERFLOW SUPPLIED BY FILTERS = 423.0 (MVAR) REACTIVE POWER EXCHANGE WITH THE AC SYSTEM = -22.6 (MVAR)
Muskrat Falls Project - CE-06 Rev. 1 (Public) Page 16 of 30

Newfoundland and Labrador Hydro - Lower Churchill Project
DC1020 - HVdc System Integration StudyMulti-Terminal HVdc Link PSSE Stability Model
Volume 4 - Final Report - May 2008
PRH325967.10045, Rev. 0, Page 6-4
NO CHANGE FOR FILTER STATUS ------------------------- SALISBURY FILTER ADJUSTMENT REACTIVE POWERFLOW ABSORBED BY CONVERTER = 451.0 (MVAR) REACTIVE POWERFLOW SUPPLIED BY FILTERS = 394.3 (MVAR) REACTIVE POWER EXCHANGE WITH THE AC SYSTEM = -56.7 (MVAR) NO CHANGE FOR FILTER STATUS
-------------------------
------------------------------------------------------------ | FINAL FILTER STATUS: | ------------------------------------------------------------ |FILTER NO | GULL ISLAND | SOLDIERS POND | SALISBURY | ------------------------------------------------------------ | 0 | 1 | 1 | 1 | | 1 | 1 | 1 | 1 | | 2 | 1 | 1 | 1 | | 3 | 1 | 1 | 1 | | 4 | 1 | 1 | 1 | | 5 | 1 | 1 | 1 | | 6 | 1 | 1 | 1 | | 7 | 1 | 1 | 1 | | 8 | 0 | 0 | 0 | | 9 | 0 | 0 | 0 | ------------------------------------------------------------ ------------------------------------------------------------ | POWERFLOW SUMMARY: | ------------------------------------------------------------ |ACTIVE POWER | 779.6(MW) | 385.0(MW) | 363.2(MW) | |REACTIVE POWER*| 96.8(MVAR)| -22.6(MVAR) | -56.7(MVAR)| | DC CURRENT | 1732.4(A) | 888.0(A) | 844.4(A) | | DC VOLTAGE | 450.0(kV) | 433.6(kV) | 430.1(kV) | ------------------------------------------------------------ * EXCHANGE WITH AC SYSTEM -------------------------
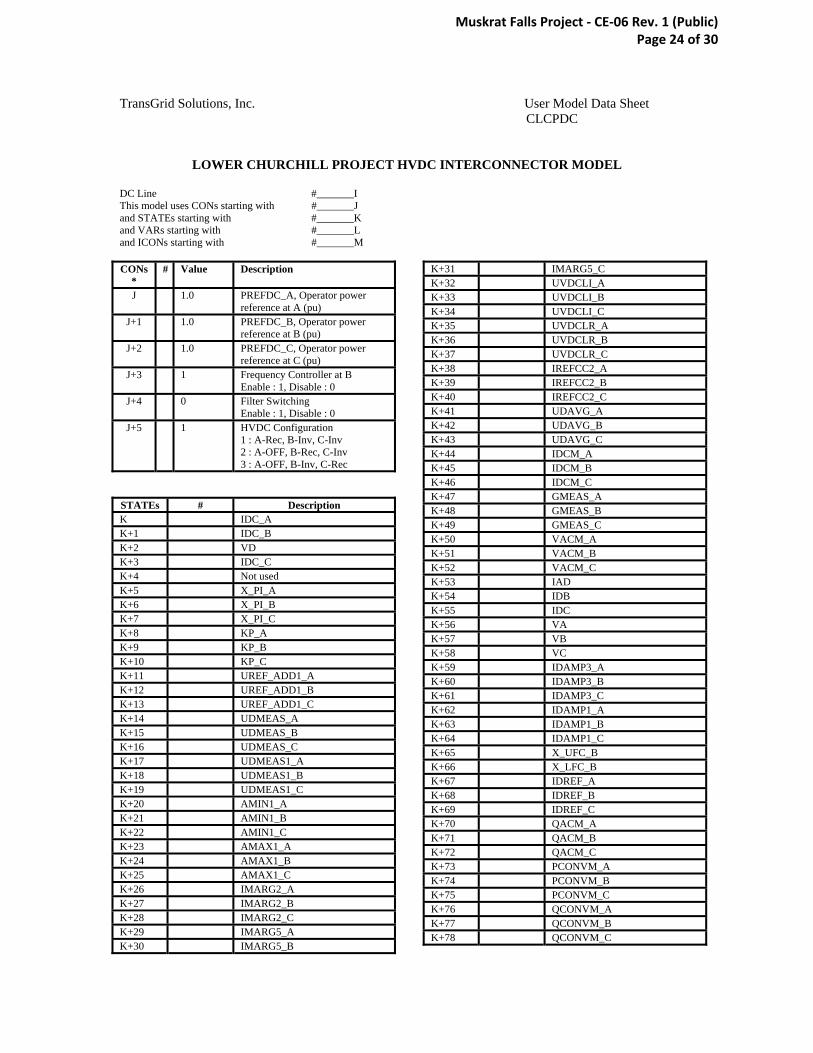
6.4 Dynamic Model User – Settable Parameters – CONs and ICONs
The model data sheet is contained in Appendix B. The CONs (real constants) and ICONs (integer constants) are described below.
6.4.1 CONs
PREFDC_A (J): Power reference at Gull Island (Station A) (pu). The dynamic model will automatically initialize this CON to match the steady-state conditions of the loadflow case. This CON can be used dynamically to change the DC power reference, but should be changed only if Station A is operating as the inverter. However the PSSE model is not programmed to model Gull Island as an inverter in any of the HVdc configurations included in the PSSE model, therefore this CON should not be changed. The filter-switching logic is included in the dynamic model; however, tap-changer control is not included (due to the very slow action of tap-changer control). Therefore, the simulation should be accurate to
Muskrat Falls Project - CE-06 Rev. 1 (Public) Page 17 of 30

Newfoundland and Labrador Hydro - Lower Churchill Project
DC1020 - HVdc System Integration StudyMulti-Terminal HVdc Link PSSE Stability Model
Volume 4 - Final Report - May 2008
PRH325967.10045, Rev. 0, Page 6-5
approximately 10 seconds, at which time tap changers would begin to act. The dynamic model should therefore not be used to move to a new steady-state operating point.
PREFDC_B (J+1): Power reference at Soldiers Pond (Station B) (pu). The dynamic model will automatically initialize this CON to match the steady-state conditions of the loadflow case. This CON can be used dynamically to change the DC power reference but should be changed only if Station B is operating as an inverter, i.e. only in HVdc configurations 1 and 3 [see Section 6.3 (2)]. The filter-switching logic is included in the dynamic model; however, tap-changer control is not included (due to the very slow action of tap-changer control). Therefore, the simulation should be accurate to approximately 10 seconds, at which time tap changers would begin to act. The dynamic model should therefore not be used to move to a new steady-state operating point.
PREFDC_C (J+2): Power reference at Salisbury (Station C) (pu). The dynamic model will automatically initialize this CON to match the steady-state conditions of the loadflow case. This CON can be used dynamically to change the DC power reference but should be changed only if Station C is operating as an inverter, i.e. only in HVdc configurations 1 and 2 [see Section 6.3 (2)]. The filter-switching logic is included in the dynamic model; however, tap-changer control is not included (due to the very slow action of tap-changer control). Therefore, the simulation should be accurate to approximately 10 seconds, at which time tap changers would begin to act. The dynamic model should therefore not be used to move to a new steady-state operating point.
Frequency Controller at B (J+3): 1 enables the frequency controller at Soldiers Pond (Station B); 0 disables it. Default 1.
Filter Switching (J+4): 1 enables the filter switching; 0 disables it. Default 0. Filter switching was only enabled during validation testing when performing the power order ramping tests. Filter switching was disabled during fault testing.
HVdc Configuration (J+5): Default 1. 1. 3-terminal: Gull Island – rectifier, Soldiers Pond – inverter, Salisbury – inverter 2. 2-terminal: Soldiers Pond – rectifier, Salisbury – inverter 3. 2-terminal: Salisbury – rectifier, Soldiers Pond – inverter
6.4.2 ICONs
Please fill in the bus numbers as appropriate as described in the model data sheet contained in Appendix C.
*Please note the user is responsible to ensure the CONs and ICONs of the dynamic model match the loadflow setup [see Section 6.2].
6.5 Simulating a Power Ramp
In order to simulate a change in power reference at one or both inverters (depending on the HVdc configuration being studied), during the dynamic simulation the user must change the appropriate CON
Muskrat Falls Project - CE-06 Rev. 1 (Public) Page 18 of 30

Newfoundland and Labrador Hydro - Lower Churchill Project
DC1020 - HVdc System Integration StudyMulti-Terminal HVdc Link PSSE Stability Model
Volume 4 - Final Report - May 2008
PRH325967.10045, Rev. 0, Page 6-6
to the desired per unit value: CON (J+1) for Soldiers Pond as inverter, and CON (J+2) for Salisbury as inverter. The CON associated with the rectifier power reference should not be changed; the CON should be changed only at the inverter ends.
It is also important to note that the inverter power references should be changed for both DC lines (poles) to be the same value. The custom model has not been programmed to operate with unbalanced bipolar operation. The ground currents, and hence HVdc losses, will be incorrect if the user attempts to operate the HVdc link in this manner.
6.6 Simulating a Permanent Block of One Pole
In order to simulate a permanent block of one of the HVdc poles, the user must change the control mode of the SECOND* multi-terminal DC line loadflow model to “blocked” or “0” during a dynamic simulation. The dynamic model will then automatically perform a permanent DC block of this line. Please note that the PSSE model is not intended for simulating a restart from a DC block. If the DC line is blocked, the model assumes it is a permanent block. If Soldiers Pond is an inverter, the model will automatically go to the 2 pu monopolar operation; if Salisbury is an inverter, the model will automatically go to the 1.1 pu monopolar operation.
*It is very important that it is the second of the two multi-terminal DC lines that is blocked, as the custom PSSE dynamic model requires this to be so.
Muskrat Falls Project - CE-06 Rev. 1 (Public) Page 19 of 30

Newfoundland and Labrador Hydro - Lower Churchill Project
DC1020 - HVdc System Integration StudyMulti-Terminal HVdc Link PSSE Stability Model
Volume 4 - Final Report - May 2008
PRH325967.10045, Rev. 0, Page 1
References
1. R.M. Brandt, U.D. Annakkage, D.P. Brandt, N. Kshatriya, “Validation of a Two-Time Step HVDC Transient Stability Model including Detailed HVDC Controls and DC Line L/R Dynamics,” Conference Proceedings, IEEE Power Engineering Society General Meeting, Montreal, Canada, June 2006.
2. Newfoundland and Labrador Hydo Lower Churchill Project, “DC1020 – HVDC System Integration Study – Transient Stability Studies Report”.
Muskrat Falls Project - CE-06 Rev. 1 (Public) Page 20 of 30

Newfoundland and Labrador Hydro - Lower Churchill Project
DC1020 - HVdc System Integration StudyMulti-Terminal HVdc Link PSSE Stability Model
Volume 4 - Final Report - May 2008
PRH325967.10045, Rev. 0, Page A-1
Appendix A Diagram of Equivalent Test System
Muskrat Falls Project - CE-06 Rev. 1 (Public) Page 21 of 30
Salisbury Equiv 230 kV bus
3
1600 MW
Two Multi-terminal DC line models (one per pole): includes converter transformers, dc line/cable and converters
Station C
87515
87514
87513
87512
87511
87510
Salisbury 345 kV bus
87500 Filters (bus shunts): 10 x 50 MVAr cap
87519
87518
87517
87516
Station B
24915
24914
24913
24912
24911
24910
Soldiers Pond230 kV bus
2490
Soldiers Pond Equiv 230 kV bus
2
Filters (bus shunts): 10 x 50 MVAr cap
24919
24918
24917
Station A
23815
23814
23813
23812
23811
23810
Gull Island 230 kV bus
2308
Gull Island Equiv
230 kV bus 1
Filters (bus shunts): 10 x 100 MVAr cap
23819
23818
23817
800 MW 800 MW
23816
R=0.6446 ohmR=1.561ohm
R=4.56 ohm
24916
23081 23082
24901
24902
87502
87503
Muskrat Falls Project - CE-06 Rev. 1 (Public) Page 22 of 30

Newfoundland and Labrador Hydro - Lower Churchill Project
DC1020 - HVdc System Integration StudyMulti-Terminal HVdc Link PSSE Stability Model
Volume 4 - Final Report - May 2008
PRH325967.10045, Rev. 0, Page B-1
Appendix B Lower Churchill HVdc PSSE Model Datasheet
Muskrat Falls Project - CE-06 Rev. 1 (Public) Page 23 of 30
TransGrid Solutions, Inc. User Model Data Sheet CLCPDC
LOWER CHURCHILL PROJECT HVDC INTERCONNECTOR MODEL DC Line #_______I This model uses CONs starting with #_______J and STATEs starting with #_______K and VARs starting with #_______L and ICONs starting with #_______M CONs
* # Value Description
J 1.0 PREFDC_A, Operator power reference at A (pu)
J+1 1.0 PREFDC_B, Operator power reference at B (pu)
J+2 1.0 PREFDC_C, Operator power reference at C (pu)
J+3 1 Frequency Controller at B Enable : 1, Disable : 0
J+4 0 Filter Switching Enable : 1, Disable : 0
J+5 1 HVDC Configuration 1 : A-Rec, B-Inv, C-Inv 2 : A-OFF, B-Rec, C-Inv 3 : A-OFF, B-Inv, C-Rec
STATEs # Description K IDC_A K+1 IDC_B K+2 VD K+3 IDC_C K+4 Not used K+5 X_PI_A K+6 X_PI_B K+7 X_PI_C K+8 KP_A K+9 KP_B K+10 KP_C K+11 UREF_ADD1_A K+12 UREF_ADD1_B K+13 UREF_ADD1_C K+14 UDMEAS_A K+15 UDMEAS_B K+16 UDMEAS_C K+17 UDMEAS1_A K+18 UDMEAS1_B K+19 UDMEAS1_C K+20 AMIN1_A K+21 AMIN1_B K+22 AMIN1_C K+23 AMAX1_A K+24 AMAX1_B K+25 AMAX1_C K+26 IMARG2_A K+27 IMARG2_B K+28 IMARG2_C K+29 IMARG5_A K+30 IMARG5_B
K+31 IMARG5_C K+32 UVDCLI_A K+33 UVDCLI_B K+34 UVDCLI_C K+35 UVDCLR_A K+36 UVDCLR_B K+37 UVDCLR_C K+38 IREFCC2_A K+39 IREFCC2_B K+40 IREFCC2_C K+41 UDAVG_A K+42 UDAVG_B K+43 UDAVG_C K+44 IDCM_A K+45 IDCM_B K+46 IDCM_C K+47 GMEAS_A K+48 GMEAS_B K+49 GMEAS_C K+50 VACM_A K+51 VACM_B K+52 VACM_C K+53 IAD K+54 IDB K+55 IDC K+56 VA K+57 VB K+58 VC K+59 IDAMP3_A K+60 IDAMP3_B K+61 IDAMP3_C K+62 IDAMP1_A K+63 IDAMP1_B K+64 IDAMP1_C K+65 X_UFC_B K+66 X_LFC_B K+67 IDREF_A K+68 IDREF_B K+69 IDREF_C K+70 QACM_A K+71 QACM_B K+72 QACM_C K+73 PCONVM_A K+74 PCONVM_B K+75 PCONVM_C K+76 QCONVM_A K+77 QCONVM_B K+78 QCONVM_C
Muskrat Falls Project - CE-06 Rev. 1 (Public) Page 24 of 30

K+79 Not used
VARs # Description L PAC_A
L+1 PAC_B L+2 PAC_C L+3 QAC_A L+4 QAC_B L+5 QAC_C L+6 IDC_A L+7 IDC_B L+8 IDC_C L+9 VDC_A L+10 VDC_B L+11 VDC_C L+12 ALFA_A L+13 ALFA_B L+14 ALFA_C L+15 FA_A L+16 FA_B L+17 FA_C L+18 VAC_A L+19 VAC_B L+20 VAC_C L+21 PI_INPUT_A L+22 PI_INPUT_B L+23 PI_INPUT_C L+24 PI_OUT_A L+25 PI_OUT_B L+26 PI_OUT_C L+27 TN_A L+28 TN_B L+29 TN_C L+30 PI_MAX_A L+31 PI_MAX_B L+32 PI_MAX_C L+33 PI_MIN_A L+34 PI_MIN_B L+35 PI_MIN_C L+36 KP1_A L+37 KP1_B L+38 KP1_C L+39 AMIN_A L+40 AMIN_B L+41 AMIN_C L+42 AMAX_A L+43 AMAX_B L+44 AMAX_C L+45 ACUV_TIMER_A L+46 ACUV_TIMER_B L+47 ACUV_TIMER_C L+48 AMAX_SWITCH_A L+49 AMAX_SWITCH_B L+50 AMAX_SWITCH_C
L+51 ID0_TIMER_A L+52 ID0_TIMER_B L+53 ID0_TIMER_C L+54 ID0_TIMER1_A L+55 ID0_TIMER1_B L+56 ID0_TIMER1_C L+57 HIGH_ALFA_A L+58 HIGH_ALFA_B L+59 HIGH_ALFA_C L+60 ALFA_TIMER_A L+61 ALFA_TIMER_B L+62 ALFA_TIMER_C L+63 UDMEAS_TIMER_A L+64 UDMEAS_TIMER_B L+65 UDMEAS_TIMER_C L+66 TNSWITCH_A L+67 TNSWITCH_B L+68 TNSWITCH_C L+69 UDR_ERR_A L+70 UDR_ERR_B L+71 UDR_ERR_C L+72 UREF_ADD2_A L+73 UREF_ADD2_B L+74 UREF_ADD2_C L+75 ID01_TIMER_A L+76 ID01_TIMER_B L+77 ID01_TIMER_C L+78 UDI_ERR_A L+79 UDI_ERR_B L+80 UDI_ERR_C L+81 GERR_A L+82 GERR_B L+83 GERR_C L+84 ID_ERR_A L+85 ID_ERR_B L+86 ID_ERR_C L+87 PI_CMODE_A L+88 PI_CMODE_B L+89 PI_CMODE_C L+90 IREFCC_A L+91 IREFCC_B L+92 IREFCC_C L+93 UVDCL_A L+94 UVDCL_B L+95 UVDCL_C L+96 UVDCLR7_A L+97 UVDCLR7_B L+98 UVDCLR7_C L+99 UVDCLR7_PREV_A
L+100 UVDCLR7_PREV_B L+101 UVDCLR7_PREV_C L+102 UVDCLR8_TIMER_A L+103 UVDCLR8_TIMER_B L+104 UVDCLR8_TIMER_C
Muskrat Falls Project - CE-06 Rev. 1 (Public) Page 25 of 30

L+105 UVDCLR7_TIMER_A L+106 UVDCLR7_TIMER_B L+107 UVDCLR7_TIMER_C L+108 UVDCLR10_TIMER_A L+109 UVDCLR10_TIMER_B L+110 UVDCLR10_TIMER_C L+111 UVDCLR10_A L+112 UVDCLR10_B L+113 UVDCLR10_C L+114 IREF_TC4_A L+115 IREF_TC4_B L+116 IREF_TC4_C
L+117 IREF_TC4_TIMER_A L+118 IREF_TC4_TIMER_B L+119 IREF_TC4_TIMER_C L+120 IREF_TC7_TIMER_A L+121 IREF_TC7_TIMER_B L+122 IREF_TC7_TIMER_C L+123 IREF_A L+124 IREF_B L+125 IREF_C L+126 UREF_A L+127 UREF_B L+128 UREF_C L+129 IMARG_A L+130 IMARG_B L+131 IMARG_C L+132 IMARG1_A L+133 IMARG1_B L+134 IMARG1_C L+135 IMARG4_A L+136 IMARG4_B L+137 IMARG4_C L+138 IREFDC_A L+139 IREFDC_B L+140 IREFDC_C L+141 UDREF_A L+142 UDREF_B L+143 UDREF_C L+144 ACUV_A L+145 ACUV_B L+146 ACUV_C L+147 ID0_A L+148 ID0_B L+149 ID0_C L+150 UDREC_A L+151 UDREC_B L+152 UDREC_C L+153 IREF_TC8_A L+154 IREF_TC8_B L+155 IREF_TC8_C L+156 IREF_CC1_A L+157 IREF_CC1_B L+158 IREF_CC1_C
L+159 GAMMA_A L+160 GAMMA_B L+161 GAMMA_C L+162 ACUV_TIMER1_A L+163 ACUV_TIMER1_B L+164 ACUV_TIMER1_C L+165 UDMEAS_HIGH_A L+166 UDMEAS_HIGH_B L+167 UDMEAS_HIGH_C L+168 REAL IA_INJ L+169 REAL IB_INJ L+170 REAL IC_INJ L+171 IMAG IA_INJ L+172 IMAG IB_INJ L+173 IMAG IC_INJ L+174 CHECK_A L+175 CHECK_B L+176 CHECK_C
L+177 Not used L+178 DCMODE_PREV L+179 INV_RECOV_C L+180 INV_TIMER_A L+181 INV_TIMER_B
L+182 INV_TIMER_C L+183 INVBYP_A L+184 INVBYP_B L+185 INVBYP_C L+186 Not used L+187 Not used L+188 Not used L+189 IDAMP2_A L+190 IDAMP2_B L+191 IDAMP2_C L+192 IDAMP_A L+193 IDAMP_B L+194 IDAMP_C L+195 LFC_OUT_B L+196 UFC_IN_B L+197 UFC_OUT_B L+198 SEVERE_FAULT_C L+199 SEVERE_FAULT_B L+200 UDRECBP_A L+201 UDRECBP_B L+202 UDRECBP_C L+203 PREF_A L+204 PREF_B L+205 PREF_C L+206 ACUV_TIMER2_A L+207 ACUV_TIMER2_B L+208 ACUV_TIMER2_C L+209 QACUP_A L+210 QACUP_B L+211 QACUP_C L+212 QACUP_PREV_A
Muskrat Falls Project - CE-06 Rev. 1 (Public) Page 26 of 30

L+213 QACUP_PREV_B L+214 QACUP_PREV_C L+215 QACUP_TIMER_A L+216 QACUP_TIMER_B L+217 QACUP_TIMER_C L+218 QACDOWN_A L+219 QACDOWN_B L+220 QACDOWN_C L+221 QACDOWN_PREV_A L+222 QACDOWN_PREV_B L+223 QACDOWN_PREV_C L+224 QACDOWN_TIMER_A L+225 QACDOWN_TIMER_B L+226 QACDOWN_TIMER_C L+227 CTR_A L+228 CTR_B L+229 CTR_C L+230 LFC_OUT_B L+231 QEXCH_A L+232 QEXCH_B L+233 QEXCH_C L+234 IREFAA_B L+235 FCONT2_B L+236 UFC_OUT_B L+237 LFC_OUT_B L+238 IREFPU_A L+239 IREFPU_B L+240 IREFPU_C L+241 QAC_PREV_C L+242 HOLD_QAC_B L+243 QAC_PREV_B L+244 HOLD_QAC_A L+245 QAC_PREV_A L+246 HOLD_QAC_C L+247 QACDOWN_TIMER1_A L+248 QACDOWN_TIMER1_B L+249 QACDOWN_TIMER1_C L+250 250 to 299 – 20ms TIME DELAY A L+299 250 to 299 – 20ms TIME DELAY A L+300 300 to 349 – 20ms TIME DELAY B L+349 300 to 349 – 20ms TIME DELAY B L+350 350 to 399 – 20ms TIME DELAY C L+400 350 to 399 – 20ms TIME DELAY C
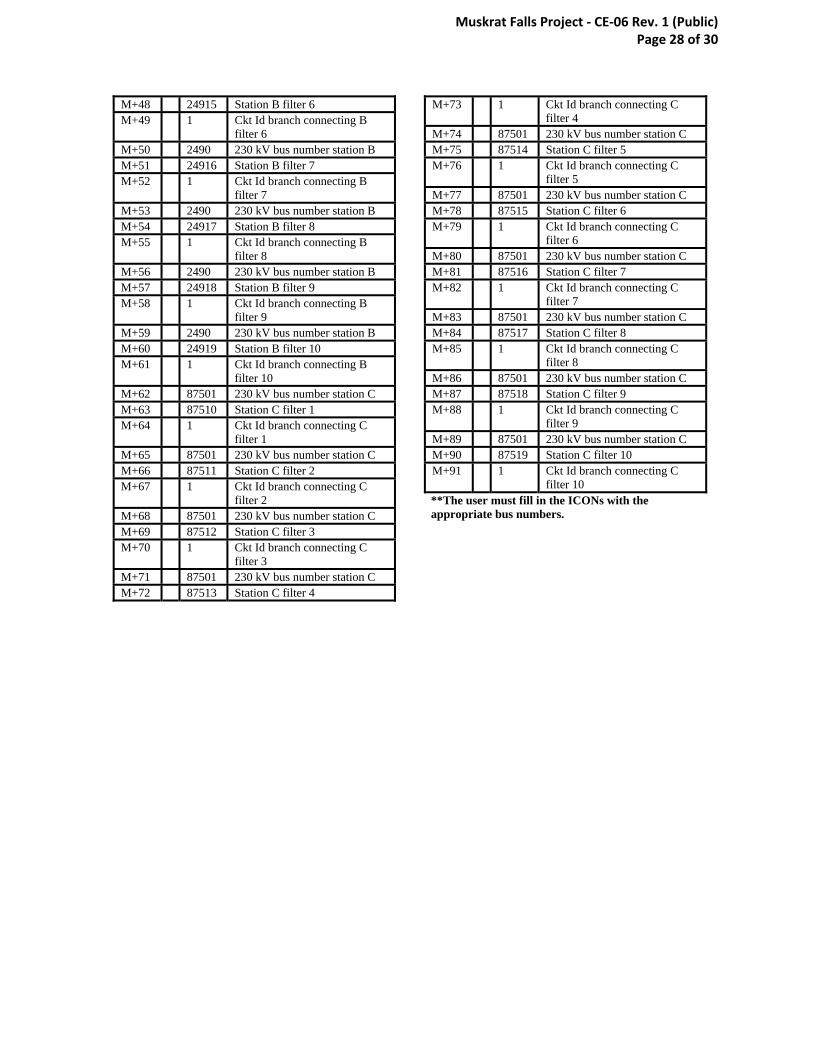
ICONs
** # Value Description
M 1 DC line number of Pole 1 M+1 2 DC line number of Pole 2 M+2 2308 230 kV bus number station A M+3 23010 Station A filter 1 M+4 1 Ckt Id branch connecting A
filter 1 M+5 2308 230 kV bus number station A
M+6 23011 Station A filter 2 M+7 1 Ckt Id branch connecting A
filter 2 M+8 2308 230 kV bus number station A M+9 23012 Station A filter 3 M+10 1 Ckt Id branch connecting A
filter 3 M+11 2308 230 kV bus number station A M+12 23013 Station A filter 4 M+13 1 Ckt Id branch connecting A
filter 4 M+14 2308 230 kV bus number station A M+15 23014 Station A filter 5 M+16 1 Ckt Id branch connecting A
filter 5 M+17 2308 230 kV bus number station A M+18 23015 Station A filter 6 M+19 1 Ckt Id branch connecting A
filter 6 M+20 2308 230 kV bus number station A M+21 23016 Station A filter 7 M+22 1 Ckt Id branch connecting A
filter 7 M+23 2308 230 kV bus number station A M+24 23017 Station A filter 8 M+25 1 Ckt Id branch connecting A
filter 8 M+26 2308 230 kV bus number station A M+27 23018 Station A filter 9 M+28 1 Ckt Id branch connecting A
filter 9 M+29 2308 230 kV bus number station A M+30 23019 Station A filter 10 M+31 1 Ckt Id branch connecting A
filter 10 M+32 2490 230 kV bus number station B M+33 24910 Station B filter 1 M+34 1 Ckt Id branch connecting B
filter 1 M+35 2490 230 kV bus number station B M+36 24911 Station B filter 2 M+37 1 Ckt Id branch connecting B
filter 2 M+38 2490 230 kV bus number station B M+39 24912 Station B filter 3 M+40 1 Ckt Id branch connecting B
filter 3 M+41 2490 230 kV bus number station B M+42 24913 Station B filter 4 M+43 1 Ckt Id branch connecting B
filter 4 M+44 2490 230 kV bus number station B M+45 24914 Station B filter 5 M+46 1 Ckt Id branch connecting B
filter 5 M+47 2490 230 kV bus number station B
Muskrat Falls Project - CE-06 Rev. 1 (Public) Page 27 of 30
M+48 24915 Station B filter 6 M+49 1 Ckt Id branch connecting B
filter 6 M+50 2490 230 kV bus number station B M+51 24916 Station B filter 7 M+52 1 Ckt Id branch connecting B
filter 7 M+53 2490 230 kV bus number station B M+54 24917 Station B filter 8 M+55 1 Ckt Id branch connecting B
filter 8 M+56 2490 230 kV bus number station B M+57 24918 Station B filter 9 M+58 1 Ckt Id branch connecting B
filter 9 M+59 2490 230 kV bus number station B M+60 24919 Station B filter 10 M+61 1 Ckt Id branch connecting B
filter 10 M+62 87501 230 kV bus number station C M+63 87510 Station C filter 1 M+64 1 Ckt Id branch connecting C
filter 1 M+65 87501 230 kV bus number station C M+66 87511 Station C filter 2 M+67 1 Ckt Id branch connecting C
filter 2 M+68 87501 230 kV bus number station C M+69 87512 Station C filter 3 M+70 1 Ckt Id branch connecting C
filter 3 M+71 87501 230 kV bus number station C M+72 87513 Station C filter 4
M+73 1 Ckt Id branch connecting C filter 4
M+74 87501 230 kV bus number station C M+75 87514 Station C filter 5 M+76 1 Ckt Id branch connecting C
filter 5 M+77 87501 230 kV bus number station C M+78 87515 Station C filter 6 M+79 1 Ckt Id branch connecting C
filter 6 M+80 87501 230 kV bus number station C M+81 87516 Station C filter 7 M+82 1 Ckt Id branch connecting C
filter 7 M+83 87501 230 kV bus number station C M+84 87517 Station C filter 8 M+85 1 Ckt Id branch connecting C
filter 8 M+86 87501 230 kV bus number station C M+87 87518 Station C filter 9 M+88 1 Ckt Id branch connecting C
filter 9 M+89 87501 230 kV bus number station C M+90 87519 Station C filter 10 M+91 1 Ckt Id branch connecting C
filter 10 **The user must fill in the ICONs with the appropriate bus numbers.
Muskrat Falls Project - CE-06 Rev. 1 (Public) Page 28 of 30

1 'USRMDL' 0 'CLCPDC' 7 1 92 6 80 400 1 2 2308 23010 1 2308 23011 1 2308 23012 1 2308 23013 1 2308 23014 1 2308 23015 1 2308 23016 1 2308 23017 1 2308 23018 1 2308 23019 1 2490 24910 1 2490 24911 1 2490 24912 1 2490 24913 1 2490 24914 1 2490 24915 1 2490 24916 1 2490 24917 1 2490 24918 1 2490 24919 1 87501 87510 1 87501 87511 1 87501 87512 1 87501 87513 1 87501 87514 1 87501 87515 1 87501 87516 1 87501 87517 1 87501 87518 1 87501 87519 1 0 0 0 0 0 0 0 0 1.00000 1.00000 1.00000 1.00000 0.00000 0.00000 1.00000 0.00000 0.00000 0.00000/ *CON(J), CON(J+1) and CON(J+2) are automatically initialized by the model to match the loadflow conditions. The other CONs should be set by the user. Please see Section 7.4 for more details.
Muskrat Falls Project - CE-06 Rev. 1 (Public) Page 29 of 30

Newfoundland and Labrador Hydro - Lower Churchill Project
DC1020 - HVdc System Integration StudyMulti-Terminal HVdc Link PSSE Stability Model
Volume 4 - Final Report - May 2008
PRH325967.10045, Rev. 0, Page C-1
Appendix C
Validation Test Results – Equivalent Source Model
Muskrat Falls Project - CE-06 Rev. 1 (Public) Page 30 of 30