managing voltage/stability constraints at pjm · managing voltage/stability constraints at pjm...
TRANSCRIPT

PJM©2012 1
Managing Voltage/stability Constraints at PJM
(FERC RTO/ISO Meeting on future market design and
software enhancements)
Simon Tam
Manager, Transmission Operations
PJM Interconnection
April 25, 2012
www.pjm.com

PJM©2012 2
Transmission Operations Manual (M-03) Stability Criteria
• PJM RTO established stability limits for preventing electrical
separation of a generating unit or a portion of the PJM RTO.
• PJM recognizes three types of stability:
– Steady State (voltage) Stability - A gradual slow change to generation that is
balanced by load.
– Transient Stability - The ability of a generating unit or a group of generating
units to maintain synchronism following a relatively severe and sudden system
disturbance. The first few cycles are the most critical time period.
– Dynamic Stability - The ability of a generating unit or a group of generating
units to damp oscillations caused by relatively minor disturbances through the
action of properly tuned control systems.
• PJM will operate the facilities that are under PJM operational
control such that the PJM system will maintain stability
following any single facility malfunction or failure.

PJM©2012
Today’s operation/markets
www.pjm.com

PJM©2012 4
PJM Voltage monitoring and control
• PJM operation utilizes the PJM EMS System to perform real-time
contingency analysis as the primary operator decision tool to
determine when and where reactive resources should be committed.
• PJM models reactive interfaces to address potential system-wide
voltage problems due to power transfers.
– Reactive Interfaces ensure sufficient wide-area reactive reserves to permit
transfers.
• PJM EMS analyzes 8 IROL reactive interfaces every 4 minutes.
– Transfer Limit Calculation (TLC) is used to calculate real-time transfer limits to
prevent voltage stability problems.
– Voltage Stability Analysis (VSA) is a tool to augment the current voltage
stability analysis functions

PJM©2012 5
Reactive Transfer Limit / Thermal Rating Reportable IROL Violation
Eastern Reactive Transfer Interface Flow exceeds Last Convergent Case Limit for 30 minutes (Tv)
Central Reactive Transfer Interface Flow exceeds Last Convergent Case Limit for 30 minutes (Tv)
5004/5005 Reactive Transfer Interface Flow exceeds Last Convergent Case Limit for 30 minutes (Tv)
Western Reactive Transfer Interface Flow exceeds Last Convergent Case Limit for 30 minutes (Tv)
AP South Reactive Transfer Interface Flow exceeds Last Convergent Case Limit for 30 minutes (Tv)
Bedington – Black Oak Reactive
Transfer Interface
Flow exceeds Last Convergent Case Limit for 30 minutes (Tv)
AEP-DOM Reactive Transfer Interface Flow exceeds Last Convergent Case Limit for 30 Minutes (Tv)
Cleveland Reactive Transfer Interface Flow exceeds Last Convergent Case Limit for 30 Minutes (Tv)
Kammer 765/500kV Transformer
Thermal Rating
Post-contingency Simulated Flows exceed the Load Dump
Limit for 30 Minutes (Tv)
Belmont #5 765/500 kV Transformer
Thermal Rating
Post-contingency Simulated Flows exceed the Load Dump
Limit for 30 Minutes (Tv)
PJM IROL Facilities
Out of the 10 IROL Facilities, 8 of them are Reactive Transfer Interfaces

PJM©2012 6
PJM Voltage monitoring and control
• PJM EMS model contains 14,500 buses, 13,000 lines and 6,500
transformers. PJM Security Analysis (SA) evaluates approximately
5,000 contingencies and monitors post-contingency voltages on
about 3,000 buses every one minute.
– PJM EMS analyzes actual and post-contingency high/low
voltages
– PJM EMS analyzes post-contingency voltage drops
• PJM dispatch utilizes the PJM Security Constrained Economic
Dispatch (SCED) system to assist operators in making cost-effective
decisions to control projected constraints and Reactive Interfaces.
• PJM Real-Time Market uses the same SCED reactive interface
constraints in calculating the real-time LMP.
PJM©2012 7
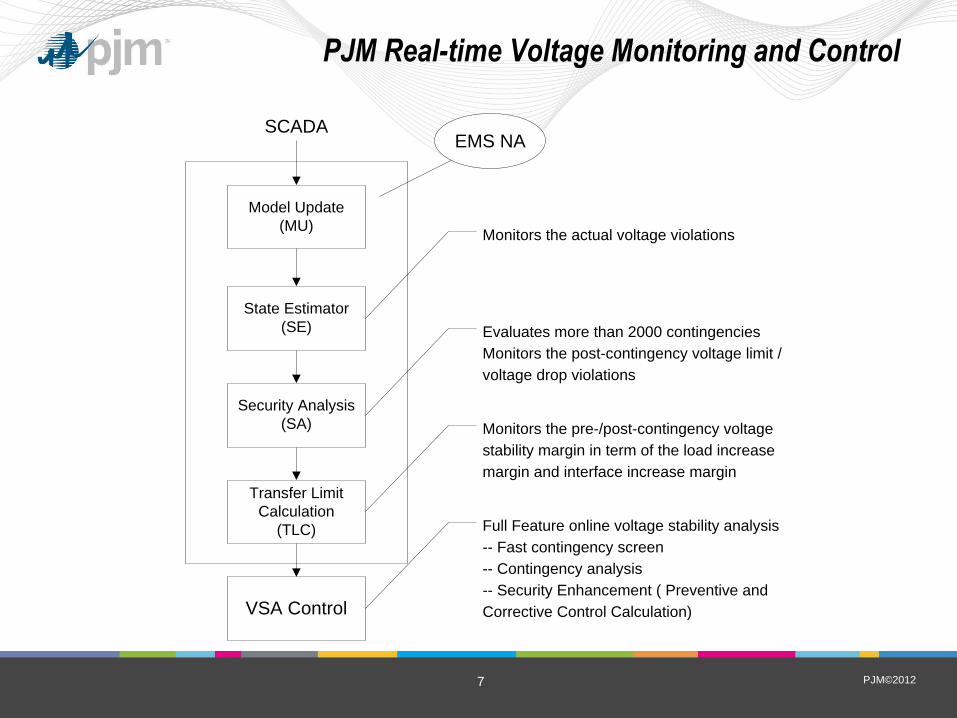
PJM Real-time Voltage Monitoring and Control
Model Update
(MU)
State Estimator
(SE)
Security Analysis
(SA)
Transfer Limit
Calculation
(TLC)
VSA Control
EMS NASCADA
Monitors the actual voltage violations
Evaluates more than 2000 contingencies
Monitors the post-contingency voltage limit /
voltage drop violations
Monitors the pre-/post-contingency voltage
stability margin in term of the load increase
margin and interface increase margin
Full Feature online voltage stability analysis
-- Fast contingency screen
-- Contingency analysis
-- Security Enhancement ( Preventive and
Corrective Control Calculation)

PJM©2012 8
Transfer Limit Calculation (TLC)
TLC Application
Determines the maximum pre- and post-contingency MW transfer
interface flow under the of constraints of
Voltage stability (collapse)
Voltage drop limits
Voltage low limits
C -Collapse
S -Stable Equilibrium
U -Unstable
M -Margin

PJM©2012
Reactive Transfer Interface Limit Diagram
0
1
2
3
4
5
6
7
8
9
10
6100 6200 6300 6400 6500 6600 6700 6800 6900
Transfer MW
Vol
tage
Dro
p %
5% VOLTAGE DROP POINT : 6728 MW LAST SOLUTION POINT: 6787 MW
SAFETY MARGIN : 200 MW
TRANSFER LEVEL WITH MARGIN : 6787 - 200 = 6587 MW
Transfer MW 6150 6247 6334 6426 6489 6606 6666 6702 6722 6736 6745 6756 6768 6780 6787
Volt. Drop (%) 1.5 2 2.3 2.6 3.1 3.4 4.1 4.6 4.8 5.3 5.6 6 6.6 7.5 8.7
6587 MW
3.3 %
200 MW
9

PJM©2012 10
Voltage Stability Analysis (VSA)
VSA is a tool that will be used to augment the function of TLC by
providing control suggestions in three categories:
– Non cost control
• Switch on/off capacitors and reactors. (VSA does not know what
capacitors are available)
• Adjust LTC and PAR tap positions.
• Adjust generator var output.
– Off cost control (VSA does not consider cost)
• Redispatch generator MW output.
– Load shedding
• Provide load shedding suggestion based on buses and TOs.

PJM©2012 11
VSA Control Target
The objective of VSA control calculation is to find the most efficient way to increase the collapse (load) margin.
Example: Increase Load Margin Interface: East
Limiting Contingency: Salem 1 GEN
Pre-Control Load Margin: 1863 MW
VSA Control Solution:
Increase BRANDONS 24.0 kV
Voltage Setting: 24.2 kV24.7 kV
Post-Control Load Margin: 1883 MW
Load Margin
(IMPORT)
Import (Load Margin)
V
Pre-Control
Post-Control
P-V Curve
1.0
0.95
1863 LoadP
LM

PJM©2012 12
6:00 pm
12:00 noon
12:00 - 4:00 pm
Day-ahead market is closed
for evaluation by PJM
4:00 - 6:00 pm Re-bidding period
Throughout Operating Day PJM continually re-evaluates and sends out
individual generation schedule
updates, as required
Up to 12:00 noon PJM receives bids and offers for
energy next Operating Day
midnight
4:00 pm
Reactive Transfer Constraints in Day-Ahead Market
Reliability Engineer
Input
RE provides projected
Reactive Interface
Limits (Peak and
Valley) and forecasted
constraints
RE commits additional
Generation based on
Forecasted constraints
Reliability Engineer
Input

PJM©2012 13
Local interfaces and thermal surrogates
• In additional to the system-wide reactive transfer interfaces, PJM
also models the following (when possible) for local voltage problems :
1. Local interface – when a complete circle can be drawn around the load
pocket where the voltage problem is observed.
2. Thermal surrogate – when the raise-help generation of the thermal surrogate
constraint is identical to the MW generation necessary to provide voltage
support. There should be no lower-help generation for the thermal surrogate.
• The objective is to provide the correct LMP signals for the voltage
support actions in the Real-Time Market and the DA Market when
appropriate.

PJM©2012 14
Maintaining Voltage Schedules
• Default voltage schedules for generators
– TO can provide a different voltage schedule
• TO and/or PJM can direct generator to deviate from voltage schedule
based on system conditions
• PJM can direct the switching of reactive control devices to maintain
voltages as system conditions dictate.
• Only PJM can direct a generator to adjust voltage schedule if such
adjustment impacts the units MW output

PJM©2012 15
Generation Performance Monitor (GPM)
• Track MW/MVAR Generation Performance (MW phase II)
• Provide real-time visualization to PJM, Transmission Owner, MOC, and Generators.
• Enhance real-time coordination between PJM, TO, and GO.
• Provide feedback loop to enhance quality of real-time data.
- 1 ½% of schedule
+ 1 ½% of scheudle
Vio
latio
n T
rig
ge
rT
ime
0
Tim
e -
30
Tim
e -
40
Vio
latio
n E
nd
30 Minute Rolling Average
Actual Voltage
Cu
rre
nt T
ime
Tim
e X
Data Collection / Storage Window
Tim
e X
+1
0
Voltage vs Violation Graph
& Data Collection

PJM©2012 16
Generation Performance Monitor (GPM)
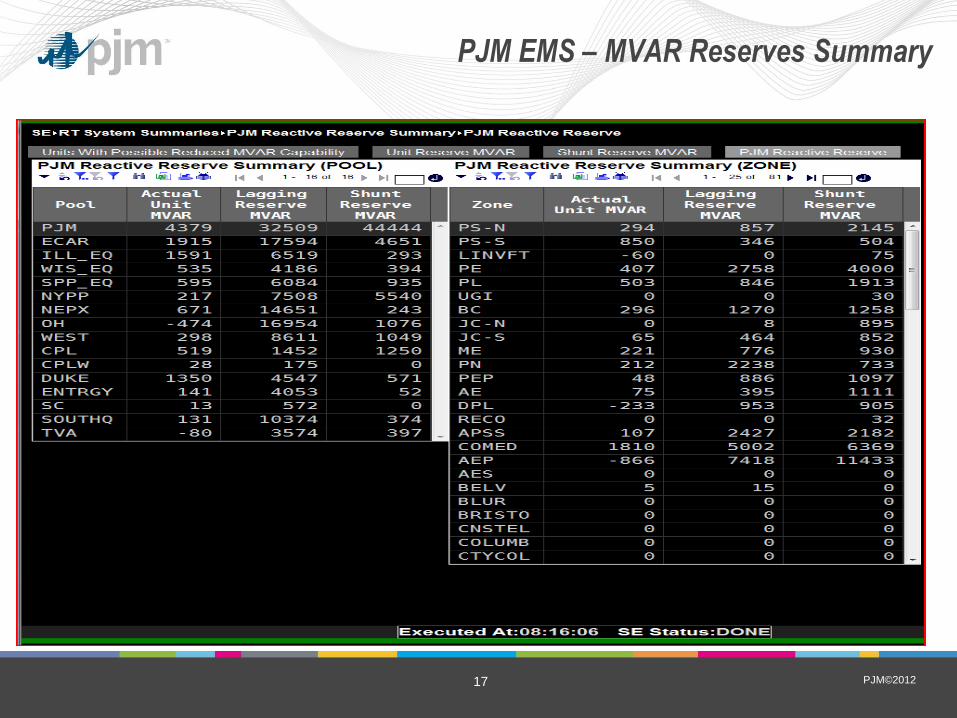
PJM©2012 17
PJM EMS – MVAR Reserves Summary

PJM©2012 18
PJM Transient /Dynamic stability concerns
• 17 transient/dynamic stability areas are identified.
• Most of them are transient stability concerns related to generating
units.
• There is one transient stability driven interface: Northeast PA (NEPA)
Transfer (Export) interface. – The interface encircles a group of generation in northeast PA. No N-1 stability
issue when all facilities are in service.
– Based on generation and transmission facilities out of service, NEPA transfer export limit is adjusted. Loss of rotational inertia and voltage support reduces system stability.
– Unit/Facility subtractors are pre-calculated from off-line planning model.
– If it is active in real-time, NEPA interface will impact the Real-Time Market. It
can also be included in the Day-Ahead Market.

PJM©2012
Future Enhancement Opportunities
www.pjm.com
1. Transient Stability Analysis & Control (TSA)
2. Optimal Dynamic Voltage Control System (AVC)
3. Transmission outage analysis automation

PJM©2012 20
Transient Stability Analysis & Control (TSA)
• Monitor and determine transient stability of the PJM system
subject to 3000 pre-defined contingencies.
• Compute stability limits by using real time data input and real
time network models.
Replace the current computation process which uses the tables
generated by off-line planning model years ago.
• Provide recommended transient stability control measures
required to prevent the system from losing transient stability
for potentially unstable system condition and/or
contingencies

PJM©2012 21
Real time model:
• Real time network model (14,500 bus) and State Estimation solution
• Operation dynamic generator models (2600 generators)
• Contingency models (Each contingency contains common fault and
switching events (circuit tripping, generator tripping, shunt switching,
etc.))
Real input data (Interface with PJM EMS):
• SE solution with network model in PSSE format
• Dynamic data for each generator
• Contingency data
• Three Phase Fault
• Unbalanced Fault (forming Seq. network models on-line)
• Stability limit data
Transient Stability Analysis & Control (TSA)

PJM©2012 22
• Completed Stability Areas Study with the following TOs: PSEG: Artificial Island Stability Benchmarking Analysis
Internal and External Model Impact
DOM: Dom’s Stability Areas Study
PPL: Initial NEPA Interface Study
ComEd Reviewing currently
• Validation of TSA software Compared with the PSSE transient program by using same cases
The simulation results of TSA and PSSE were same
• Validation of TSA models (Real time network model, Dynamic generator models
and contingency models) TSA results were consistent with Planning Studies
Impact of Using PJM EMS or MMWG Internal Model is negligible
Impact of Using PJM EMS or MMWG External Model is negligible
• Target TSA real-time implementation in 4th Quarter of 2012.
Transient Stability Analysis & Control (TSA)

PJM©2012 23
Current approach of determination of the voltage schedule in
PJM system:
1. Each TO determines their own area voltage schedule based
on their Power Study and experiences. If TO has no voltage
schedule for the area, PJM offer a default voltage schedule.
2. This approach lacks of system-wide coordination to
determine PJM system voltage schedule.
3. Potentially, area voltages may not follow the schedules very
well and lead to unexpected flow of reactive power.
Optimal Dynamic Voltage Control System (AVC)

PJM©2012 24
The Proposed Solution will:
1. Determine voltage schedule and mvar control system-wide
2. Combine optimization and traditional approach (rule based)
3. Achieve the objective of minimum of system loss, or maximum
of MW transfer
4. Improve system voltage profile, real time security and
reliability.
5. Enhance the transfer interface utilization and reduce
congestion cost. Provide positive impacts to both Real-time
and Day-Ahead Markets.
Optimal Dynamic Voltage Control System (AVC)
PJM©2012 25
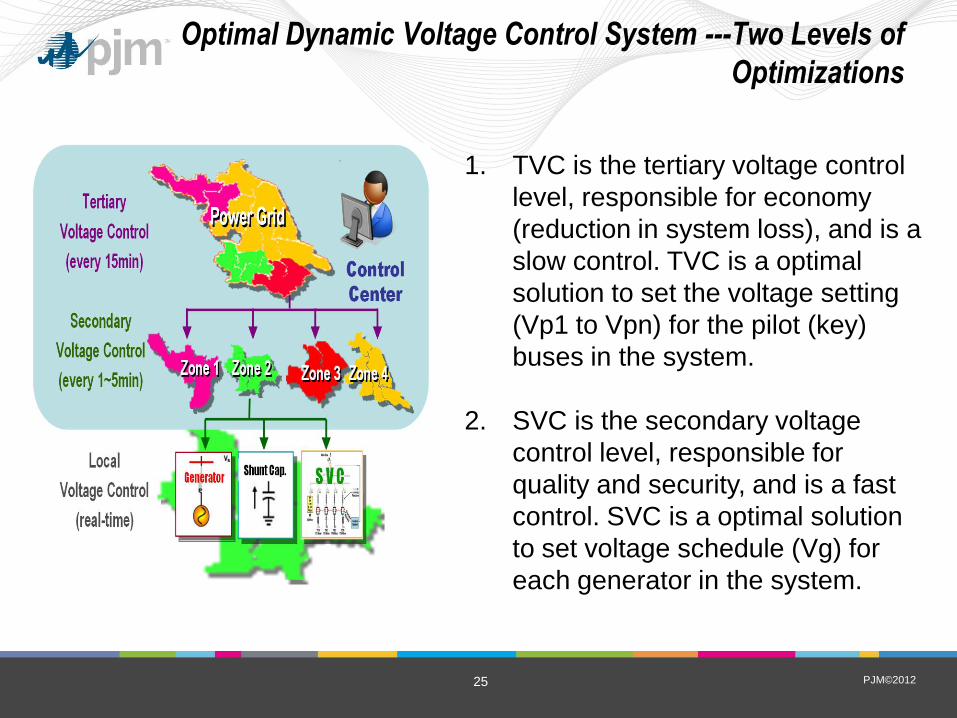
Optimal Dynamic Voltage Control System ---Two Levels of
Optimizations
1. TVC is the tertiary voltage control
level, responsible for economy
(reduction in system loss), and is a
slow control. TVC is a optimal
solution to set the voltage setting
(Vp1 to Vpn) for the pilot (key)
buses in the system.
2. SVC is the secondary voltage
control level, responsible for
quality and security, and is a fast
control. SVC is a optimal solution
to set voltage schedule (Vg) for
each generator in the system.

PJM©2012 26
1. Average reduction of transmission system loss: 1.0688 %
• For the example of Monday, 21MW, Save energy about 184
million kWh/year
• If electricity rate is $0.08/kWh, Save money: $ 14.7
million/year
2. Average increase of system MVAR reserve: about 1 %
Optimal Dynamic Voltage Control System (AVC)
PJM has completed the proof of concept evaluation of AVC. The
next step will be sending the AVC voltage schedules to TOs
through GPM for their evaluation.

PJM©2012 27
Transmission outage analysis automation
• Currently the transmission outage analysis team/Reliability
Engineer studies the next-day transmission outages for two
specific hours. Thus, only two sets of projected reactive
transfer limits are provided to the DA Market Operator.
• Valley set : to be used during the midnight hours
• Peak set : to be used for all other hours.
• There is an on-going outage analysis automation effort
which will enable the team to perform transmission outages
for multiple hours of the day.
• More sets of projected reactive transfer limits can be
made available to the DA Market. Potentially, there can
be 24 hourly sets for the DA Market.

PJM©2012 28
Questions
www.pjm.com

PJM©2012
Appendix

PJM©2012 30
Voltage Operating Criteria

PJM©2012 31
Voltage Operating Limits

PJM©2012 32
• Switch capacitors in/out of service
• Switch reactors out/in to service
• Adjust output of Static Var Compensators
• Adjust generator excitation
• Adjust transformer tap position
• Switch lines or cables out of service
– Pre-studied for high voltage control
Non-cost Responses to Voltage Violations

PJM©2012 33
• Curtail Non-firm transactions NOT willing to
pay congestion prior to redispatch of
generation
• Redispatch generation
• Dispatch synchronous condensers
• Initiate ALL Emergency Procedures EXCEPT
Load Shed
– Including Manual Load Dump Warning
Off-cost Responses to Voltage Violations

PJM©2012 34
• Determine if load shedding is required – All other control actions have been exhausted
– Under emergency low or load dump low voltage limit on an
actual basis or Reactive Transfer Limit to avoid voltage collapse
– Under load dump low voltage limit or voltage drop violation limit
on contingency basis if analysis indicates potential for voltage
collapse
• Determine amount of load shed necessary
• Shed load proportional among Native Load
customers, Network customers and firm point-point
service
Load Shedding Response to Voltage Violations

PJM©2012 35
Stability Procedures from M-03
PJM Transient/Dynamic Stability Procedures

PJM©2012 36
Stability Procedures from M-03
PJM Transient/Dynamic Stability Procedures

PJM©2012 37
Generation Performance Monitor (GPM)