my bar graph tells a story - eugene school district · pdf file · 2015-02-17my bar...
TRANSCRIPT
Sue McMillen and Beth McMillen investigations
My bar graph tells a story
Connecting stories to qualitative co- ordinate graphs has been suggested as an effective instructional strategy (Blubaugh
and Emmons 1999; Maus 2005; NCTM 2000). Even students who are able to create bar graphs may struggle to correctly interpret them. Giving children opportunities to work with qualitative graphs can help them develop the skills to inter-pret, describe, and compare information from a graph even without the availability of numeric labels. This investigation addresses the Data Analysis and Probability Standard (NCTM 2000) and explores the value of connecting stories with qualitative bar graph instruction, which too often focuses on only counting, tallying, and creating bar graphs.
Eighteen students in a diverse second-grade class at the Days Park Bilingual Early Childhood Center in Buffalo, New York, could construct bar graphs by counting and tallying objects, but they had no experience with qualitative graphs. They explored properties of both quan-titative bar graphs (i.e., graphs with numeric labels) and qualitative bar graphs (i.e., those without numeric labels) by creating and iden-tifying “mystery” bar graphs. Their culminating activities of matching graphs to nursery rhymes, songs, and stories entailed an additional two days.
Investigation objectivesBy the end of their exploration, students should be able to demonstrate the following skills:
descriptive statements about bar graphs.
that different bar graphs may share the same mathematical features.
and label qualitative graphs in a meaningful way.
qualitative graphs with contexts of nursery rhymes, songs, and stories.
Materials
Lesson 1 (day 1)Each student needs the following items:
of 5 connected Unifix® cubes (at least 1 blue, 1 green, and 1 yellow stack)
1
Lesson 2 (days 2–3) Each student needs the following items:
of 5 connected Unifix cubes (at least 1 blue, 1 green, 1 yellow, and 1 red stack)
cube graph (see )(see full-sized versions )
(several copies)
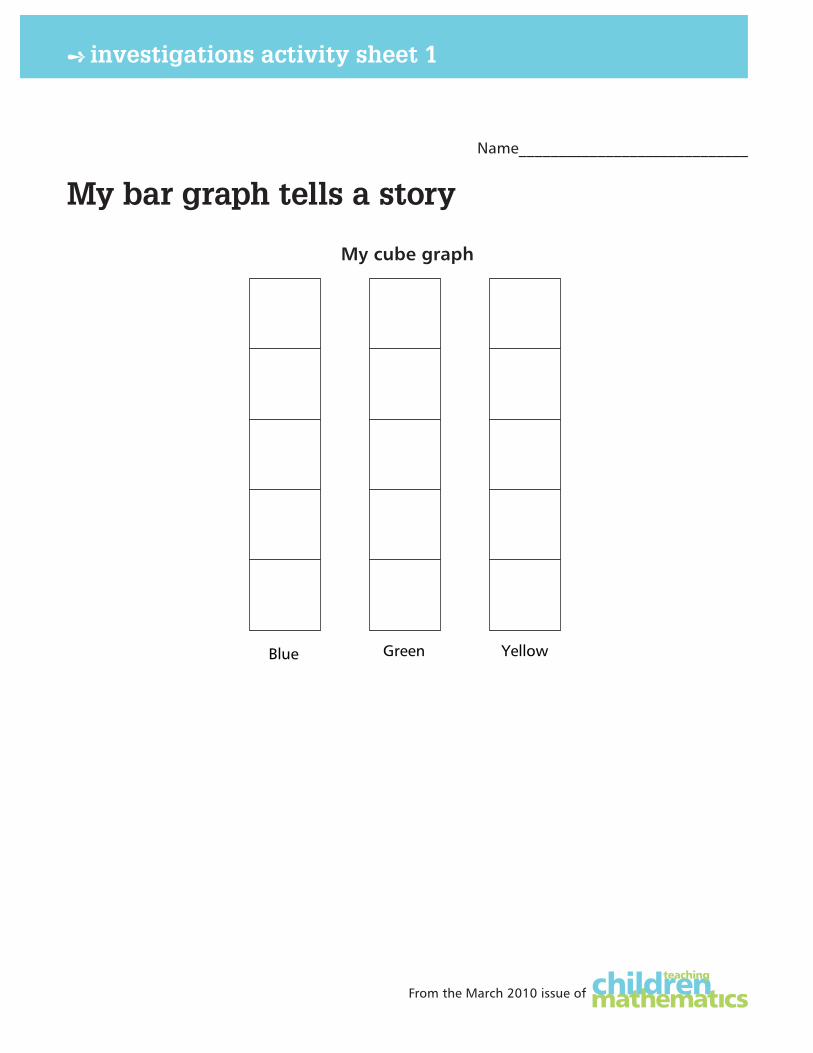
Lesson 1 investigationOn the first day, students investigate and gain experience with bar graphs that are not labeled with numbers. To begin, give each student three stacks of five connected Unifix cubes (one blue stack, one green, and one yellow) and a copy of
. Ask students to choose some cubes, set the rest aside, and then use crayons to create a bar graph of their selected cubes on the activity sheet.
430 teaching children mathematics www.nctm.org
RICA
RDO
INFA
NTE
ALV
ARE
Z/IS
TOCK
PHO
TO.C
OM
Copyright © 2010 The National Council of Teachers of Mathematics, Inc. www.nctm.org. All rights reserved.This material may not be copied or distributed electronically or in any other format without written permission from NCTM.
www.nctm.org March 2010 431
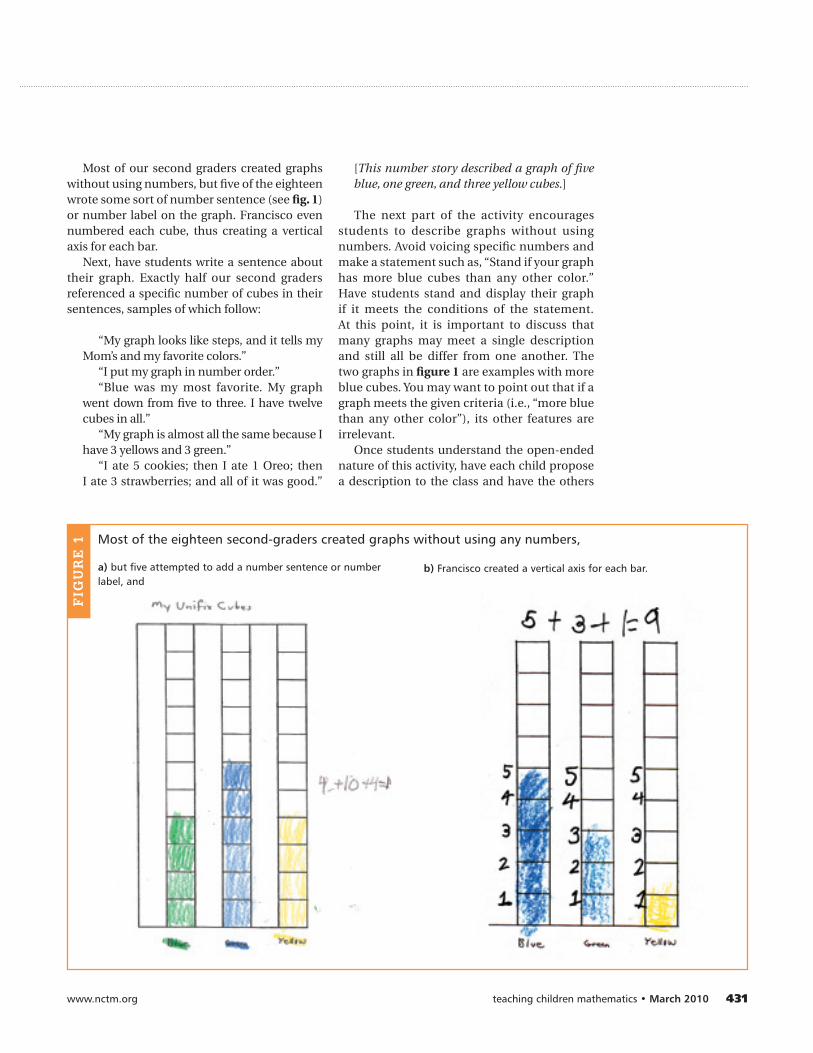
Most of our second graders created graphs without using numbers, but five of the eighteen wrote some sort of number sentence (see ) or number label on the graph. Francisco even numbered each cube, thus creating a vertical axis for each bar.
Next, have students write a sentence about their graph. Exactly half our second graders referenced a specific number of cubes in their sentences, samples of which follow:
“My graph looks like steps, and it tells my Mom’s and my favorite colors.”
“I put my graph in number order.”“Blue was my most favorite. My graph
went down from five to three. I have twelve cubes in all.”
“My graph is almost all the same because I have 3 yellows and 3 green.”
“I ate 5 cookies; then I ate 1 Oreo; then I ate 3 strawberries; and all of it was good.”
Most of the eighteen second-graders created graphs without using any numbers,
FIG
UR
E 1
a) but five attempted to add a number sentence or number label, and
b) Francisco created a vertical axis for each bar.
[This number story described a graph of five blue, one green, and three yellow cubes.]
The next part of the activity encourages students to describe graphs without using numbers. Avoid voicing specific numbers and make a statement such as, “Stand if your graph has more blue cubes than any other color.” Have students stand and display their graph if it meets the conditions of the statement. At this point, it is important to discuss that many graphs may meet a single description and still all be differ from one another. The two graphs in are examples with more blue cubes. You may want to point out that if a graph meets the given criteria (i.e., “more blue than any other color”), its other features are irrelevant.
Once students understand the open-ended nature of this activity, have each child propose a description to the class and have the others
432 teaching children mathematics www.nctm.org
investigations
These descriptions presented several opportu-nities for rich discussions about mathematical language. For example, when “more than twelve altogether” was posed, Wandalee asked if she should stand up because she had exactly twelve cubes in her graph. Her classmates referred to a word wall, named some examples of “more than” and “not more than,” and then—on their own—agreed that she should not stand up.
A startled silence ensued when Destiny pre-sented “no cubes” as her description. After some false starts and thinking time, there was a rush as all the students quickly sat down. Many began laughing. When they were asked what a graph with no cubes looks like, they correctly identi-fied it as both an empty graph and a graph with zero cubes for each color.
Lesson 2 investigationThe next activities focus on interpreting qualita-tive graphs and determining number values that they could reasonably represent. Give each stu-dent four stacks of five connected Unifix cubes (one blue stack, one green, one yellow, and one red) and a fresh copy of .
Begin by describing one or more features of a bar graph, such as, “There are fewer green cubes than yellow cubes.” Have students use their cubes to create a graph matching your descrip-tion by laying selected cubes on top of the activ-ity sheet. Ask several students to share their graph and explain how they matched the given criteria. Emphasize that many different graphs can correctly match the given description.
Continue the activity by having some students pose criteria and others respond by creating graphs that match. Najya’s description of “zero blue, five green, and zero yellow” drew giggles, but the entire class correctly displayed only five green cubes.
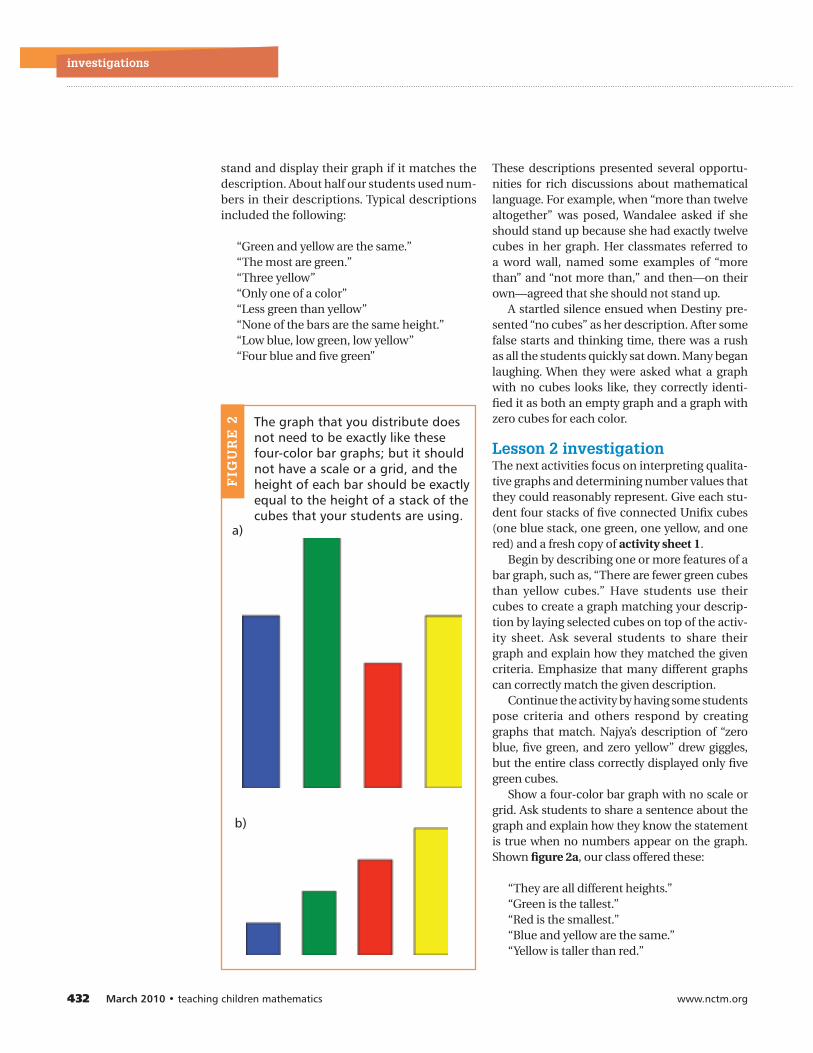
Show a four-color bar graph with no scale or grid. Ask students to share a sentence about the graph and explain how they know the statement is true when no numbers appear on the graph. Shown , our class offered these:
“They are all different heights.”“Green is the tallest.”“Red is the smallest.”“Blue and yellow are the same.”“Yellow is taller than red.”
The graph that you distribute does not need to be exactly like these four-color bar graphs; but it should not have a scale or a grid, and the height of each bar should be exactly equal to the height of a stack of the cubes that your students are using.
FIG
UR
E 2
a)
b)
stand and display their graph if it matches the description. About half our students used num-bers in their descriptions. Typical descriptions included the following:
“Green and yellow are the same.”“The most are green.”“Three yellow”“Only one of a color”“Less green than yellow”“None of the bars are the same height.”“Low blue, low green, low yellow”“Four blue and five green”
www.nctm.org March 2010 433
When prompted, students correctly expressed their ideas in language that showed they rec-ognized that each bar in the graph represented a specific number of cubes. For example, the fourth comment above was clarified as, “There are the same number of blues and yellows.” However, even after repeating this process with ten different graphs, most students con-tinued to use language describing the bars’ visual appearance (such as taller, smaller, and shortest), rather than language referring to the number of cubes (such as more than, less than, or fewest).
The graph in led to a productive mathematical discussion when—for the first time—a student described the graph in terms of specific numbers that could be the bar heights, responding, “One, two, three, four.”
We asked if the graph could represent other numbers, and Gianni offered, “Ten, twenty, thirty, forty.” Although the class was quite flu-ent in counting by twos and by fives, no one offered any other possible numeric values for the graph. To push their thinking, we asked if the bar heights could be one, twenty, twenty-one, and fifty. The class quickly agreed that could not be correct because “they would have to be the same,” meaning the increase from bar to bar is constant, so the increase in numbers would also have to be constant.
Give each student a copy of a four-color bar graph that you have created. The graph does not need to be exactly like either of the samples in , but the height of each bar should be exactly equal to the height of a stack of the type of cubes that your students are using.
We asked students how they could deter-mine the number of cubes for each color if there were no numbers, and they quickly sug-gested using their cubes to measure. Almost all of them measured a bar’s height with only the corresponding color of cube. That is, they measured the blue bar with only blue cubes. Not surprisingly, about two-thirds of the class was stumped with the yellow bar on one of our handouts, because it was ten cubes tall and they had only five yellow cubes. A series of increasingly specific scaffolding prompts (Can you think of a way to see how tall this is? Are the different colors of cubes the same size? Do you have to measure with yellow only?) gave all stu-dents the opportunity to successfully develop a
strategy to measure the yellow bar. Some used the yellow stack of five cubes, made a mark, and then used the yellow stack again to measure the remainder of the bar. Others used the yel-low stack and then measured the rest of the bar with cubes of a different color.
Give your students a copy of ,and ask them to create and color their own mys-tery cube graph without numbers. Emphasize these two points:
1. Make the height of each bar equal an exact number of cubes because you will use your cubes to measure the heights.
2. Do not write any numbers on the graph or you will spoil the mystery.
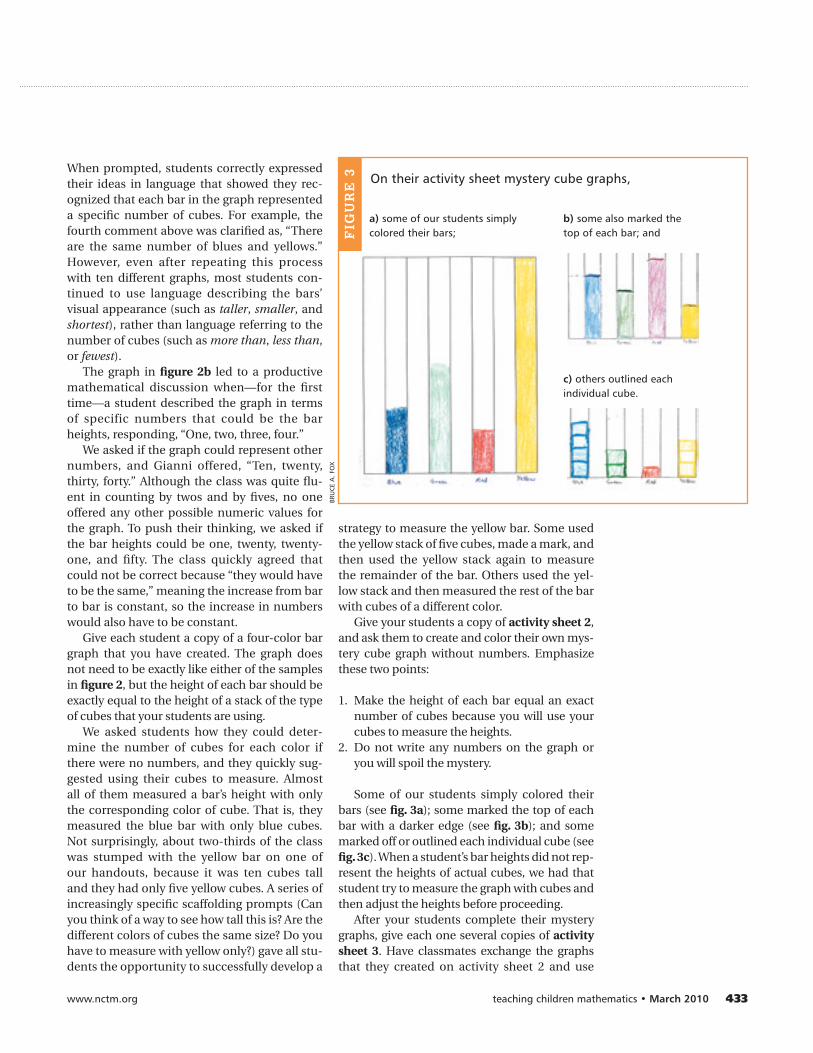
Some of our students simply colored their bars (see ); some marked the top of each bar with a darker edge (see ); and some marked off or outlined each individual cube (see
). When a student’s bar heights did not rep-resent the heights of actual cubes, we had that student try to measure the graph with cubes and then adjust the heights before proceeding.
After your students complete their mystery graphs, give each one several copies of
. Have classmates exchange the graphs that they created on activity sheet 2 and use
On their activity sheet mystery cube graphs,
FIG
UR
E 3
a) some of our students simply colored their bars;
b) some also marked the top of each bar; and
c) others outlined each individual cube.
BRU
CE A
. FO
X
434 teaching children mathematics www.nctm.org
investigations
cubes to determine how many cubes each bar on the graph represents. They can use one copy of activity sheet 3 to record their findings for each mystery graph that they measure. Our students stayed engaged in this activity and determined almost all the heights correctly, even for bars taller than five cubes. We noticed that some students continued to measure bars using only the corresponding color of cube, but others began to think more abstractly and use the same stack for all the bars, regardless of color.
After the second graders at Days Park Bilin-gual Early Childhood Center had explored prop-erties of both quantitative and qualitative bar graphs and had created and identified “mystery” bar graphs, their culminating activities were to match graphs to nursery rhymes, songs, and sto-ries. Lesson 3 entails an additional two days.
accompany the online version of this article at .
Lesson 3 (days 4 and 5)Each student needs the following items:
versions of unlabeled graphs (see , , , 7, 8, 9, ) of your choice of qualitative bar graphs
and corresponding stories, songs, or poems nursery rhymes (optional)
Lesson 3 investigationHave students read and sing nursery rhymes, poems, songs, and books; match them to quali-tative bar graphs; and label and title the graphs appropriately. For example, on the board we displayed a large version of the graph in fig
. Students began by reading the following version of the nursery rhyme “Baa, Baa, Black Sheep”:
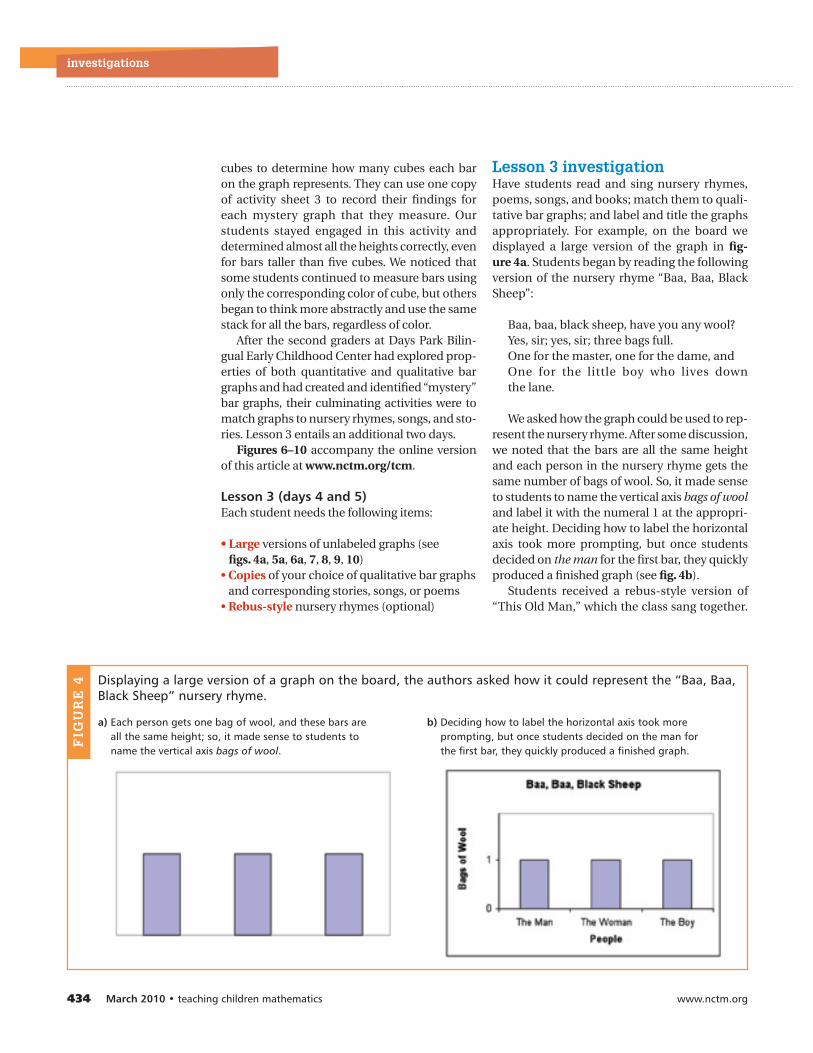
Baa, baa, black sheep, have you any wool? Yes, sir; yes, sir; three bags full. One for the master, one for the dame, and One for the little boy who lives down the lane.
We asked how the graph could be used to rep-resent the nursery rhyme. After some discussion, we noted that the bars are all the same height and each person in the nursery rhyme gets the same number of bags of wool. So, it made sense to students to name the vertical axis bags of wool and label it with the numeral 1 at the appropri-ate height. Deciding how to label the horizontal axis took more prompting, but once students decided on the man for the first bar, they quickly produced a finished graph (see ).
Students received a rebus-style version of “This Old Man,” which the class sang together.
Displaying a large version of a graph on the board, the authors asked how it could represent the “Baa, Baa, Black Sheep” nursery rhyme.
FIG
UR
E 4
a) Each person gets one bag of wool, and these bars are all the same height; so, it made sense to students to name the vertical axis bags of wool.
b) Deciding how to label the horizontal axis took more prompting, but once students decided on the man for the first bar, they quickly produced a finished graph.

www.nctm.org March 2010 435
We displayed three more oversized graphs on the board (see ; see ). When asked which of the three could match “This Old Man,” students immediately choose correctly. They quickly named the graph and labeled the bars. However, they again had difficulty titling the axes. After much discussion, they named the x-axis as things playing (referring to the object that the old man plays in that verse) and the y-axis as number he is playing (i.e., the verse number).
The class ended this part of the lesson by singing from rebus-style versions of “Five Little Speckled Frogs” and “Five Little Ducks” and then identifying and completing both graphs (see ).
The youngsters spent the remainder of the investigation working in groups, reading books and poems, matching them to qualitative graphs, and completing the graph informa-tion. Although these are qualitative graphs, it is important that the relationships among the bar heights is accurate. For example, if one bar is five units and the next is ten, the second bar must be twice as high as the first.
Typical counting stories, songs, and poems, such as “The Twelve Days of Christmas,” increase by ones (see ), but many others increase by other units, decrease, both
increase and decrease, or change units dur-ing the story (see 8, 9, and ). In almost all cases, after our students chose the graph to represent a particular story, they also created a numbered vertical axis to help them correctly complete the labeling.
Beyond the lesson This investigation focuses primarily on using qualitative graphs to deepen students’ under-standing of bar graphs. However, in addition to developing such mathematical language as less, more, fewer, and so on, our students also made many connections to literature and reading comprehension.
To extend the investigation even further or challenge more advanced learners, have stu-dents read or write a story or poem and then create a corresponding bar graph.
ReflectionsOverall, our students were both engaged and successful throughout this investigation. Rich mathematical discussions occurred during the five days because of the open-ended nature of many of the activities, which required students to constantly explain and question.
Allowing students to create their own descrip-tive sentences not only resulted in sentences of
The class was asked which of three graphs displayed on the board could match “This Old Man.”
FIG
UR
E 5
a) Students immediately chose the correct graph “because it is the only one going up” (i.e., increasing).
b) They quickly named the graph and labeled the bars but had difficulty titling the axes until they agreed on the first label.
436 teaching children mathematics www.nctm.org
varying degrees of sophistication that prompted further discussions but also allowed students at all levels to succeed. As the week progressed, we noticed that the children began to move fluidly between qualitative and quantitative graphs. In particular, many of them benefited from having a “real” context from a song, a story, or a poem. They often referred to the context in their discussions of the bar graphs or to explain their reasoning.
Finally, our experience suggests that math-ematical investigations using stories, poems, and songs can also contribute to improving reading comprehension and attention to detail, as well as strengthening the connection between reading and mathematics.
REFERENCES Blubaugh, William L., and Kristin Emmons. “Graph-
ing for All Students.” Mathematics Teacher 92 (April 1999): 323–26, 332–34.
Enchanted Learning. Rebus Rhymes. 2009. www.enchantedlearning.com/Rhymes.html.
Maus, John W. “Every Story Tells a Picture.” Math-ematics Teaching in the Middle School 10 (April 2005): 375–79.
Murphy, Stuart J. Leaping Lizards. New York: Harper Collins, 2005.
National Council of Teachers of Mathematics (NCTM). Principles and Standards for School Mathematics. Reston, VA: NCTM, 2000.
O’Donnell, Elizabeth Lee. The Twelve Days of
Name_____________________________
From the March 2010 issue of
My bar graph tells a story
investigations activity sheet 1
My cube graph
Blue Green Yellow
Name_____________________________
My bar graph tells a story
From the March 2010 issue of
investigations activity sheet 3
Find the number of cubes for the graph drawn by
Blue: Green:
Red: Yellow:
Solve the mystery graphs
Name_____________________________
From the March 2010 issue of
My bar graph tells a story
investigations activity sheet 2
My mystery cube graph
Blue Green YellowRed
Figures 6–10 and full-sized students’ activity sheets accompany the online version of this
article at www.nctm.org/tcm.
Summer. New York: Morrow Junior Books, 1991.Pinczes, Elinor J. Arctic Fives Arrive. New York:
Scholastic, 1996.Sayre, April Pulley, and Jeff Sayre. One Is a Snail, Ten Is
a Crab. Cambridge, MA: Candlewick Press, 2003.
Sue McMillen, [email protected], teaches math and math education courses at Buffalo State College in New York. She also provides content-based professional development to in-service teachers. Beth McMillen, [email protected], teaches second grade at the Samuel S. Gaines Academy in Ft. Pierce, Florida. The “investigations” department is edited by LouAnn H. Lovin, [email protected], and Ann Wallace, [email protected], who teach mathematics methods and content courses to prospective and in-service classroom teachers at James Madison University in Harrisonburg, Virginia. Articles highlight classroom-tested multilesson units that help students develop conceptual understanding of math topics. Teachers may reproduce this material for use with their own students without requesting permission from NCTM. Submit manuscripts appropriate for “investigations” by access-ing http://tcm.msubmit.net. Limit manuscripts to 3000 words, excluding two reproducible pages of activities. Find detailed submission guidelines for all departments at www.nctm.org/tcmdepartments.


investigations appendix
teaching children mathematics www.nctm.org
The unfinished graphs below are almost identical.
FIG
UR
E 6
FIG
UR
E 7
a) “Five Little Ducks” “Five Little Speckled Frogs”
b) Students explained clearly how they knew which of the two graphs went with which song: “The five little ducks came back at the end, but the speckled frogs did not.”
My bar graph tells a story
Students were intrigued that the same graph matches both the “Twelve Days of Christmas” song and the Twelve Days of Summer book (O’Donnell 1991). They wondered if they could “sing the book” and were excited to discover that the book’s text matches the music.
FIGURE 7
investigations appendix
teaching children mathematics www.nctm.org
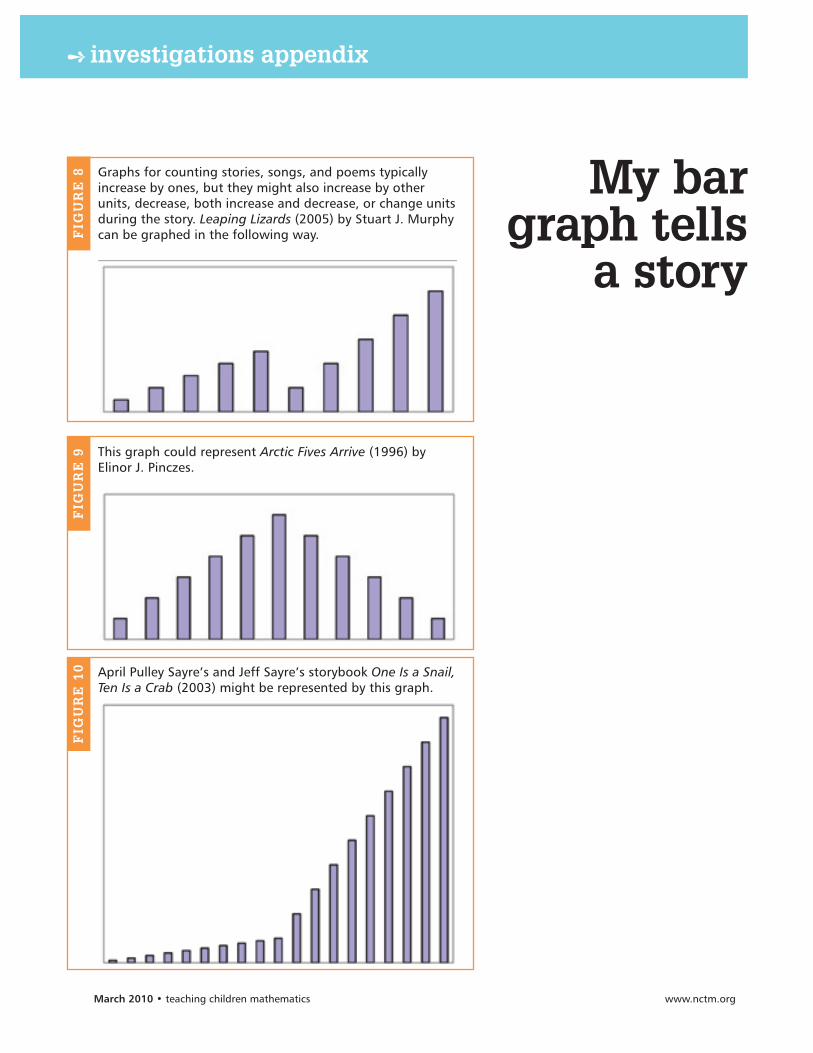
Graphs for counting stories, songs, and poems typically increase by ones, but they might also increase by other units, decrease, both increase and decrease, or change units during the story. Leaping Lizards (2005) by Stuart J. Murphy can be graphed in the following way.F
IGU
RE
8
This graph could represent Arctic Fives Arrive (1996) by Elinor J. Pinczes.
FIG
UR
E 9
April Pulley Sayre’s and Jeff Sayre’s storybook One Is a Snail, Ten Is a Crab (2003) might be represented by this graph.
FIG
UR
E 1
0
My bar graph tells
a story
Name_____________________________
From the March 2010 issue of
My bar graph tells a story
investigations activity sheet 1
My cube graph
Blue Green Yellow

Name_____________________________
From the March 2010 issue of
My bar graph tells a story
investigations activity sheet 2
My mystery cube graph
Blue Green YellowRed

Name_____________________________
My bar graph tells a story
From the March 2010 issue of
investigations activity sheet 3
Find the number of cubes for the graph drawn by
Blue: Green:
Red: Yellow:
Solve the mystery graphs