“my home. my springs.” campaign final post-survey results · “my home. my springs.”...
TRANSCRIPT
Page 1 of 108
“My Home. My Springs.” Campaign
Final Post-Survey Results
District Project Manager: Robin Grantham
This report represents data collected
between July 1 and 31, 2017
Submitted to the District on September 1, 2017 by
Dr. Tait Martin
Chief Research Officer + Managing Partner Maggie Brandenburg
Behavior Change Strategist

Page 2 of 108
Table of Contents
Executive Summary ................................................................................................................. 3 Introduction & Background .............................................................................................................. 3 Project Goals .................................................................................................................................... 3 Methods of Data Collection and Analysis .......................................................................................... 3 Survey Sample Description .................................................................................................................. 4 Key Findings: Health of the Springs .................................................................................................. 4 Key Findings: Southwest Florida Water Management District ........................................................... 6 Key Findings: Springs Advertising .................................................................................................... 6 Recommendations ............................................................................................................................ 7
Health of the Springs ............................................................................................................... 8 Springs Restorations ....................................................................................................................... 24 Behaviors to Learn About Springs in Their Area ............................................................................. 26
Perceptions of the Southwest Florida Water Management District ........................................ 32
Springs Advertising Recall & Evolution ................................................................................. 61 2017 “My Home. My Springs.” Campaign Collateral Examples ........................................................ 62
Sample Radio Scripts .......................................................................................................................... 62 Sample Billboard ................................................................................................................................. 62 Sample Bill Insert ................................................................................................................................ 63 Sample Social Media Posts ................................................................................................................. 63
Springs Advertising Recall .............................................................................................................. 66 The Evolution of the “My Home. My Springs.” Campaign ............................................................... 82
Survey Sample Description .................................................................................................... 92 Online Media Use ........................................................................................................................... 93 Demographics ................................................................................................................................. 99
Appendix ............................................................................................................................. 103
Page 3 of 108
Executive Summary
Introduction & Background
This study reviews the 2017 “My Home. My Springs.” campaign posttest conducted by The Taproot Agency
with individuals residing in the northern part of the Southwest Florida Water Management District (District),
specifically the residents from Citrus County, Hernando County and the District’s portion of Marion County.
The survey is intended to measure campaign recall and behavioral intention related to the springs in Citrus,
Hernando and Marion counties, perceptions of the District and unaided recall of springs advertising messages.
Project Goals
The District conducted this research to identify the behaviors, knowledge, attitude and opinions of residents
within the District, specifically in Citrus, Hernando and Marion counties, regarding springs.
The District intends to use the completed research to:
1) Design and refine messages and educational programs that are more likely to result in an educated
public, specifically focusing on springs;
2) Design messages and educational programs that are likely to lead to the conservation and protection of
regional water resources, specifically focusing on springs;
3) Assist in evaluating “My Home. My Springs.” campaign success; and
4) Track the public’s perception of the District.
Methods of Data Collection and Analysis
From July 1 to 31, 2017, Taproot conducted telephone interviews with 1,153 adult residents of the study area in
Citrus County (n=384), Hernando County (n=384) and the District’s portion of Marion County (n=384). Each
county’s sample resulted in a theoretical margin of error of +/-5% at the 95% confidence level. The overall
margin of error for the entire sample is +/-3% at the 95% confidence level.
Throughout the report, Taproot focused on the previous year’s total numbers for comparison purposes and
statistically analyzed the differences between the counties, allowing us to provide actionable recommendations
that could potentially affect the next iteration of the “My Home. My Springs.” campaign.
The reader will notice that the phrase “Statistically Different” will accompany some of the tables in this report.
Taproot used the Pearson’s Chi Square test to determine differences between counties. The Chi Square allows
the researcher to determine if a distribution of categorical variables (Likert-type measures) is different from one
another. We use the Chi Square test to understand if two or more groups (in this case, counties) are statistically

Page 4 of 108
different from each other. When the phrase “Statistically Different” is noted under a graph, it means that the
groups are statistically different from one another. If there is no statistic, one can assume the groups are
statistically the same.
This report includes graphs of every question fielded in the pretest and total number comparisons from previous
years, when applicable. Taproot provides a brief introduction to each section of the report with pertinent
information gleaned from the results and will include other commentary, as needed, near the corresponding
graph.
Survey Sample Description
The typical person participating in this survey can be described as:
More likely to be female, consistent with population data
Making between $25,000 and $74,999 annually
Living in Florida full-time
Likely between “35 to 64 years old”
Living more than five miles away from a water body
Visiting websites often, especially Weather.com, YouTube.com and Facebook.com
These characteristics are similar to the most recent Florida census.
Key Findings: Health of the Springs
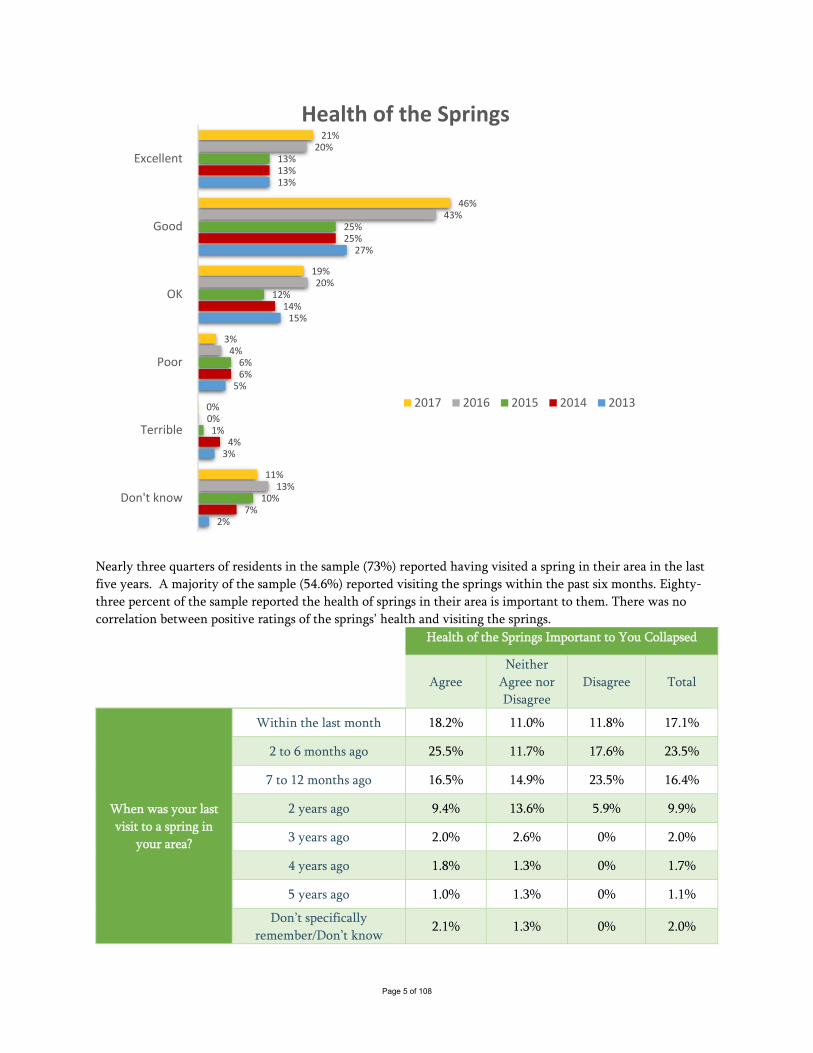
Citizens in these counties continued to report having a connection to the springs in their area. The 2017
campaign posttest saw a four percent increase in the number of respondents rating the health of the springs as
“excellent” or “good” (67% in 2017 compared to 63% in the 2016 post). This survey showed a slight decrease in
the number of residents who reported not knowing the health of the springs (11% in 2017 compared to 13% in
2016). The graph below shows five years of springs health measures from the current and similar samples.
Page 5 of 108
Nearly three quarters of residents in the sample (73%) reported having visited a spring in their area in the last
five years. A majority of the sample (54.6%) reported visiting the springs within the past six months. Eighty-
three percent of the sample reported the health of springs in their area is important to them. There was no
correlation between positive ratings of the springs’ health and visiting the springs.
Health of the Springs Important to You Collapsed
Agree
Neither
Agree nor
Disagree
Disagree Total
When was your last
visit to a spring in
your area?
Within the last month 18.2% 11.0% 11.8% 17.1%
2 to 6 months ago 25.5% 11.7% 17.6% 23.5%
7 to 12 months ago 16.5% 14.9% 23.5% 16.4%
2 years ago 9.4% 13.6% 5.9% 9.9%
3 years ago 2.0% 2.6% 0% 2.0%
4 years ago 1.8% 1.3% 0% 1.7%
5 years ago 1.0% 1.3% 0% 1.1%
Don’t specifically
remember/Don’t know 2.1% 1.3% 0% 2.0%
21%
46%
19%
3%
0%
11%
20%
43%
20%
4%
0%
13%
13%
25%
12%
6%
1%
10%
13%
25%
14%
6%
4%
7%
13%
27%
15%
5%
3%
2%
Excellent
Good
OK
Poor
Terrible
Don't know
Health of the Springs
2017 2016 2015 2014 2013

Page 6 of 108
Did not visit 23.5% 42.2% 41.2% 26.3%
Just as in previous surveys, the respondents seemed well-versed in the issues facing spring health – evidence
they are learning about the springs from other sources than actually visiting the water bodies.
Similarly to 2016, respondents reported likely reading a brochure or website about springs, but were reluctant
to participate in efforts that took the citizens away from their homes.
Key Findings: Southwest Florida Water Management District
A little over half of all respondents (54%) had heard of the District before taking the survey.
On the eight longitudinal measures (see the tables below), 2017 saw an increase in six of them compared to the
2016 post.
Southwest Florida Water Management District:
Strongly Agree
+ Agree 2013
Strongly
Agree +
Agree 2014
Strongly Agree
+ Agree 2015
Strongly
Agree + Agree
2016
Strongly
Agree +
Agree 2017
Has the scientific knowledge necessary to
improve the health of the springs in your area. 44% 48% 45% 42% 45%
Is the leader in taking the right actions to
improve the health of the springs in your area. 28% 40% 41% 32% 31%
Is committed to improving the health of the
springs in your area. 32% 48% 45% 39% 43%
These were asked to all respondents
Southwest Florida Water Management District: Excellent +
Good 2013
Excellent +
Good 2014
Excellent +
Good 2015
Excellent +
Good 2016
Excellent +
Good 2017
Protecting springs in your area 25% 32% 29% 38% 44%
Educating people about the conditions of the
springs 18% 29% 24% 31% 30%
Educating people about what they can do to
help protect the springs 20% 31% 24% 31% 35%
Ensuring that not too much water is drawn out
of the ground for various uses 16% 24% 23% 20% 28%
Listening to community input that may benefit
springs in your area 17% 27% 23% 22% 28%
These were asked to respondents who had heard of the District
Key Findings: Springs Advertising
Approximately one third (32%) of the respondents reported having seen or heard an advertisement about
springs restoration in the previous few months. The graph below shows the longitudinal trend since 2014.

Page 7 of 108
Unaided recall of “My Home. My Springs” campaign came in at around ten percent with recall of other
campaign elements scoring higher. There was continued recall of the “Restoring our Springs” campaign
concept. We will explain in the report why we believe this is inflated due to questioning error and a long,
previous campaign tenure. Consistent with previous surveys, we believe there is continued confusion with
competing springs and environmental messages.
Recommendations
In conclusion, Taproot posits the following three areas to consider for the “My Home. My Springs.” campaign.
Continue to focus on locals interacting with the springs. Residents will likely respond to the campaign
when they “can see themselves” in the advertisements.
There is still a great deal of confusion with other messages. How can the “My Home. My Springs.”
outreach stand out?
Social media is still the best channel to tell the “My Home. My Springs.” story. The key will be to
differentiate the campaign from other District posts.
The remainder of the report will present comparative data from each county and from the previous years, when
applicable.
32%
47%
24%
25%
35%
44%
23%
36%
30%
34%
22%
34%
35%
42%
27%
39%
Total
Citrus
Hernando
Marion
In the past few months, have you seen or heard any advertisements about springs or springs restoration?
(Unaided Recall)
2017 2016 2015 2014

Page 8 of 108
Health of the Springs
Respondents’ opinions of the springs in Citrus, Marion and Hernando counties were measured with the
following questions:
Have you visited any springs in your area in the last 5 years?
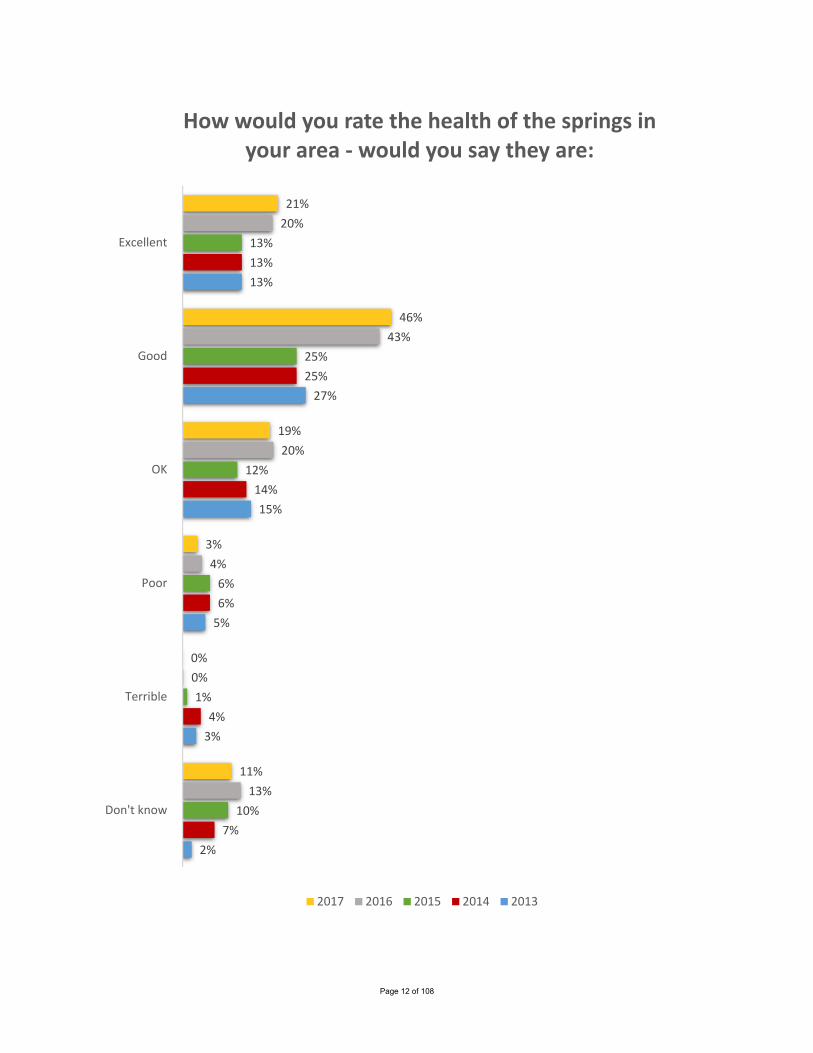
How would you rate the health of the springs in your area?
Based on what you know or might have heard, is there anything wrong with the springs in your area?
The health of springs in your area is important to you.
Too much water from the aquifer is being pumped out of the ground for various uses.
It is important for your tax dollars to be used to improve the health of the springs in your area.
Too much money is spent on restoring springs in your county.
Are you aware of any springs restoration projects happening in your area?
Where is the springs restoration project taking place?

Page 9 of 108
How likely are you to do the following to find out more about the springs in your area?
o Visit a website to get information about local springs
o Read a pamphlet/brochure about springs mailed to your house
o Attend a community meeting
o Call the government office in charge of protecting the springs
o Volunteer at a springs cleanup, planting or Lyngbya removal
o Attend a community or springs event
o Sign up for a digital newsletter
o Share a story about the springs on social media
o Send a text to a friend about the springs
Respondents rated the health of the springs as “excellent” or “good” higher than the previous four years. Three
quarters of the participants said they had been to the springs in the last five years. A majority of those who
visited the springs reported visiting within the last six months. There was no correlation between visiting the
springs and positively rating the springs’ health.
Consistent with previous years, a majority of the respondents:
Agreed the health of the springs in their area was important.
Agreed it was important to spend tax dollars on springs’ health.
Disagreed that too much money was spent on springs restoration.
An equal percentage (22 percent) of respondents stated that “more algae (Lyngbya)” and “more boaters” were
problems with local springs.
Just as in previous surveys, respondents reported a willingness to undertake behaviors that took the least effort
– reading a brochure mailed to their home and visiting a website – to learn about local springs.

Page 10 of 108
73%
71%
64%
83%
71%
72%
64%
76%
65%
72%
62%
62%
69%
72%
62%
72%
Total
Citrus
Hernando
Marion
Have you visited any of the springs in your area in the last 5 years?"Yes" Responses
2017 2016 2015 2014 2013

Page 11 of 108
23.7%
32.2%
23.3%
12.3%
1.9%
1.9%
1.9%
2.8%
18.6%
32.8%
25.5%
13.4%
3.6%
2.4%
0.4%
3.2%
26.3%
29.9%
19.3%
15.3%
2.9%
2.6%
1.8%
1.8%
23.0%
31.6%
22.7%
13.6%
2.7%
2.3%
1.4%
2.6%
Within the last month
2 to 6 months ago
7 to 12 months ago
2 years ago
3 years ago
4 years ago
5 years ago
Don’t specifically remember/Don’t know
When was your last visit to a spring in your area?
Citrus Hernando Marion Total
Page 12 of 108
21%
46%
19%
3%
0%
11%
20%
43%
20%
4%
0%
13%
13%
25%
12%
6%
1%
10%
13%
25%
14%
6%
4%
7%
13%
27%
15%
5%
3%
2%
Excellent
Good
OK
Poor
Terrible
Don't know
How would you rate the health of the springs in your area ‐ would you say they are:
2017 2016 2015 2014 2013

Page 13 of 108
Statistical Differences Between the Counties – Citrus County rated the springs as “excellent” or “good” higher than the other two counties.
24.5%
48.4%
16.7%
3.4%
7.0%
19.0%
44.8%
20.3%
1.6%
14.3%
19.2%
44.2%
20.5%
4.9%
0.3%
10.9%
20.9%
45.8%
19.2%
3.3%
0.1%
10.8%
Excellent
Good
OK
Poor
Terrible
Don't know
How would you rate the health of the springs in your area ‐would you say they are:
Citrus Hernando Marion Total

Page 14 of 108
“How would you rate the health of the springs in your area?” crossed with “When was your
last visit to a spring in your area?”
How would you rate the health of the springs in your area - would you say they are:
Excellent Good OK Poor Terrible
Don't
know Total
When was
your last
visit to a
spring in
your area?
Within the last
month 25.3% 18.0% 12.7% 23.7% 0% 0% 16.7%
2 to 6 months ago 29.0% 27.5% 18.6% 21.1% 0% 0.8% 23.0%
7 to 12 months ago 22.0% 18.9% 14.0% 10.5% 0% 1.6% 16.5%
2 years ago 11.2% 10.4% 12.7% 7.9% 0% 0.8% 9.9%
3 years ago 1.2% 1.5% 3.2% 5.3% 0% 2.4% 2.0%
4 years ago 2.5% 1.3% 1.4% 2.6% 0% 1.6% 1.6%
5 years ago 0.4% 1.3% 1.4% 2.6% 0% 0% 1.0%
Don’t specifically
remember/Don’t
know
1.2% 2.5% 1.4% 2.6% 0% 1.6% 1.9%
Did not visit 7.1% 18.6% 34.8% 23.7% 100.0% 91.1% 27.3%
There was no statistical relationship between the positive ratings of the springs in the respondents’ areas and
visits to the springs. This is evidence that citizens are learning about or shaping their opinions about the springs
from other sources. It is interesting to note that the only rating of “terrible” came from respondents who did not
visit the springs in the past five years.

Page 15 of 108
16%
22%
19%
16%
11%
10%
22%
20%
27%
19%
16%
13%
11%
21%
62%
14%
9%
5%
3%
3%
2%
56%
16%
11%
8%
4%
3%
4%
55%
15%
8%
14%
7%
2%
2%
Nothing is wrong
More algae (Lyngbya)
Less clear water
Lower water levels/ lack of rainfall
Less flow
Greener water
More boaters
Based on what you know or have heard, what is wrong with the springs in your area?*
2017 2016 2015 2014 2013

Page 16 of 108
*Multiple responses permitted
8%
10%
13%
5%
1%
4%
7%
25%
5%
10%
12%
4%
3%
3%
9%
24%
1%
1%
1%
1%
14%
1%
1%
1%
2%
0%
10%
3%
1%
2%
3%
0%
6%
4%
Dead trees
Fewer fish
More recreation
More manatees
Other
Salt water/sea‐level rise
Fewer underwater plants
Don't know
Based on what you know or have heard, what is wrong with the springs in your area?* cont.
2017 2016 2015 2014 2013

Page 17 of 108
Statistical Differences Between the Counties
Statistical Differences Between the Counties
Statistical Differences Between the Counties
13.5%
18.0%
16.1%
15.9%
Citrus
Hernando
Marion
Total
Nothing is wrong
15.4%
9.6%
23.4%
16.1%
Citrus
Hernando
Marion
Total
Lower water levels/lack of rainfall
12.2%
6.3%
15.1%
11.2%
Citrus
Hernando
Marion
Total
Less flow
27.9%
17.4%
21.6%
22.3%
Citrus
Hernando
Marion
Total
More algae (Lyngbya)
26.6%
14.8%
15.8%
19.1%
Citrus
Hernando
Marion
Total
Less clear water

Page 18 of 108
Statistical Differences Between the Counties
Statistical Differences Between the Counties
Statistical Differences Between the Counties
7.0%
7.0%
9.6%
7.9%
Citrus
Hernando
Marion
Total
Dead trees
7.3%
3.9%
1.3%
4.2%
Citrus
Hernando
Marion
Total
Saltier water/sea‐level rise
7.6%
5.5%
8.1%
7.0%
Citrus
Hernando
Marion
Total
Fewer underwater plants
30.5%
24.7%
11.4%
22.2%
Citrus
Hernando
Marion
Total
More boaters
14.6%
14.1%
10.1%
12.9%
Citrus
Hernando
Marion
Total
More recreation

Page 19 of 108
Statistical Differences Between Counties
8.3%
4.7%
1.0%
4.7%
Citrus
Hernando
Marion
Total
More manatees
10.9%
10.9%
7.8%
9.9%
Citrus
Hernando
Marion
Total
Greener water
22.1%
28.6%
25.5%
25.4%
Citrus
Hernando
Marion
Total
Don't know
Page 20 of 108
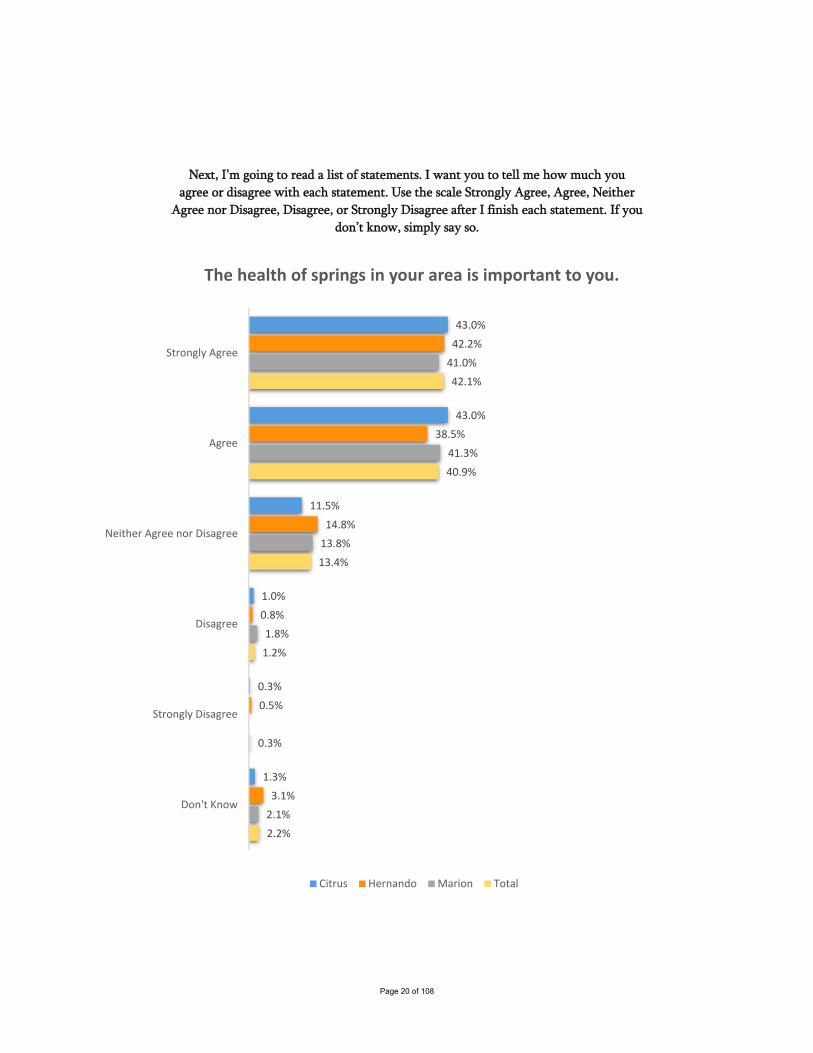
Next, I’m going to read a list of statements. I want you to tell me how much you
agree or disagree with each statement. Use the scale Strongly Agree, Agree, Neither
Agree nor Disagree, Disagree, or Strongly Disagree after I finish each statement. If you
don’t know, simply say so.
43.0%
43.0%
11.5%
1.0%
0.3%
1.3%
42.2%
38.5%
14.8%
0.8%
0.5%
3.1%
41.0%
41.3%
13.8%
1.8%
2.1%
42.1%
40.9%
13.4%
1.2%
0.3%
2.2%
Strongly Agree
Agree
Neither Agree nor Disagree
Disagree
Strongly Disagree
Don't Know
The health of springs in your area is important to you.
Citrus Hernando Marion Total
Page 21 of 108
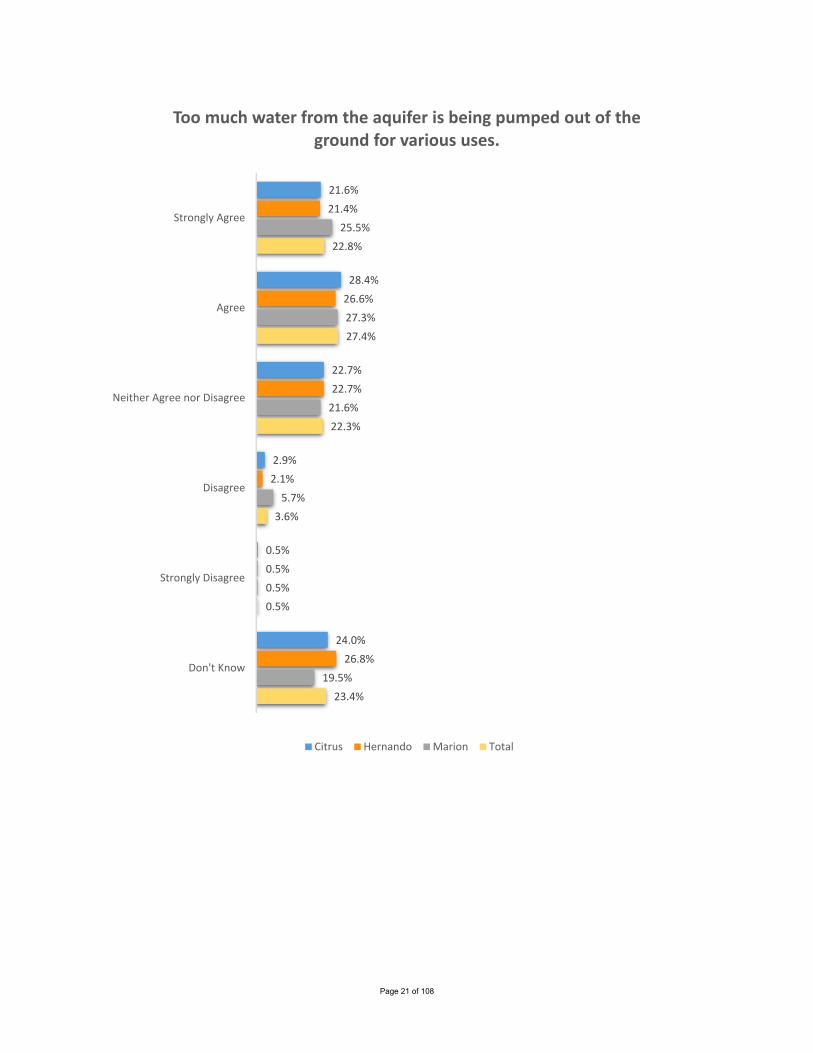
21.6%
28.4%
22.7%
2.9%
0.5%
24.0%
21.4%
26.6%
22.7%
2.1%
0.5%
26.8%
25.5%
27.3%
21.6%
5.7%
0.5%
19.5%
22.8%
27.4%
22.3%
3.6%
0.5%
23.4%
Strongly Agree
Agree
Neither Agree nor Disagree
Disagree
Strongly Disagree
Don't Know
Too much water from the aquifer is being pumped out of the ground for various uses.
Citrus Hernando Marion Total

Page 22 of 108
This question was worded differently in the previous surveys. From 2013 to 2015, the response scale was Very
important, Important, Somewhat Important, Not at all important and Don’t know. We decided to change the
scale to a more definitive measure, thus making it less confusing for the respondent.
25%
44%
23%
3%
1%
4%
27%
43%
22%
3%
1%
3%
43%
31%
18%
4%
4%
38%
34%
20%
5%
2%
35%
33%
21%
7%
5%
Strongly agree
Agree
Neither agree nor disagree
Disagree
Strongly disagree
Don't know
How important to you is it that your tax dollars be used to improve the health of the springs in your area?
2017 2016 2015 2014 2013

Page 23 of 108
24.2%
46.6%
22.4%
2.9%
1.3%
2.6%
26.0%
40.9%
24.0%
2.1%
1.8%
5.2%
24.2%
44.7%
23.6%
3.6%
0.3%
3.6%
24.8%
44.1%
23.3%
2.9%
1.1%
3.8%
Strongly Agree
Agree
Neither Agree nor Disagree
Disagree
Strongly Disagree
Don't Know
It is important for your tax dollars to be used to improve the health of the springs in your area.
Citrus Hernando Marion Total

Page 24 of 108
Springs Restorations
1.6%
3.6%
25.0%
31.8%
26.0%
12.0%
1.0%
3.4%
27.1%
27.1%
22.9%
18.5%
0.5%
2.3%
23.1%
33.8%
25.7%
14.5%
1.0%
3.1%
25.1%
30.9%
24.9%
15.0%
Strongly Agree
Agree
Neither Agree nor Disagree
Disagree
Strongly Disagree
Don't Know
Too much money is spent on restoring springs in your county.
Citrus Hernando Marion Total

Page 25 of 108
Statistical Differences Between the Counties
*Statistical Differences Between the Counties
31.5%
50.0%
18.5%
11.7%
69.3%
19.0%
11.7%
69.6%
18.7%
18.3%
63.0%
18.7%
Yes
No
Don’t know
Are you aware of any springs restoration projects happening in your area?
Citrus Hernando Marion Total
12.4%
16.5%
61.2%
25.6%
33.9%
60.3%
45.5%
8.3%
0.8%
82.2%
15.6%
33.3%
20.0%
33.3%
28.9%
6.7%
17.8%
2.2%
6.7%
4.4%
17.8%
42.2%
22.2%
11.1%
71.1%
4.4%
26.1%
13.7%
46.0%
28.0%
31.3%
43.1%
27.5%
23.7%
1.9%
Weeki Wachee Springs*
Chassahowitzka Springs
Crystal River/Kings Bay*
Rainbow Springs*
Homosassa Springs
Three Sisters Springs*
Hunter Springs*
Silver Springs*
Don’t know
Where were the springs restorations?
Citrus Hernando Marion Total

Page 26 of 108
Behaviors to Learn About Springs in Their Area
How likely are you to do the following to find out more about the springs in your
area? For each one of the items on the list, tell me Very Likely, Somewhat Likely or Not Likely at All.
93%
88%
83%
60%
54%
48%
48%
47%
37%
31%
Visit a Spring
Read a brochure mailed to your house
Visit a website to get information about local springs
Attend a community or springs event
Share a story about your local springs on social media
Volunteer at a springs cleanup, planting or Lyngbyaremoval
Subscribe to an online newsletter or mailing list
Send a text message to a friend about your local springs
Attend a community meeting
Call the government office in charge of protecting thesprings
Very & Somewhat Likely Measures Combined
Very & Somewhat Likely

Page 27 of 108
Statistical Differences Between the Counties
41.1%
46.1%
12.8%
36.7%
43.5%
19.8%
38.2%
42.1%
19.7%
38.7%
43.9%
17.4%
Very Likely
Somewhat Likely
Not Likely At All
Visit a website to get information about local springs
Citrus Hernando Marion Total
67.7%
27.9%
4.4%
53.1%
38.3%
8.6%
59.7%
31.9%
8.3%
60.2%
32.7%
7.1%
Very Likely
Somewhat Likely
Not Likely At All
Visit a Spring
Citrus Hernando Marion Total

Page 28 of 108
People continue to not like meetings.
53.9%
35.4%
10.7%
49.0%
38.0%
13.0%
47.0%
39.5%
13.5%
50.0%
37.6%
12.4%
Very Likely
Somewhat Likely
Not Likely At All
Read a brochure mailed to your house
Citrus Hernando Marion Total
6.3%
31.0%
62.8%
7.6%
30.2%
62.2%
6.5%
29.4%
64.2%
6.8%
30.2%
63.1%
Very Likely
Somewhat Likely
Not Likely At All
Attend a community meeting
Citrus Hernando Marion Total

Page 29 of 108
6.0%
25.3%
68.8%
8.1%
24.5%
67.4%
4.9%
23.4%
71.7%
6.3%
24.4%
69.3%
Very Likely
Somewhat Likely
Not Likely At All
Call the government office in charge of protecting the springs
Citrus Hernando Marion Total
10.2%
40.1%
49.7%
12.2%
38.0%
49.7%
10.1%
33.2%
56.6%
10.8%
37.1%
52.0%
Very Likely
Somewhat Likely
Not Likely At All
Volunteer at a springs cleanup, planting or Lyngbya removal
Citrus Hernando Marion Total

Page 30 of 108
18.2%
45.8%
35.9%
15.4%
41.4%
43.2%
14.0%
46.0%
40.0%
15.9%
44.4%
39.7%
Very Likely
Somewhat Likely
Not Likely At All
Attend a community or springs event
Citrus Hernando Marion Total
24.0%
33.6%
42.4%
20.3%
33.9%
45.8%
16.9%
34.8%
48.3%
20.4%
34.1%
45.5%
Very Likely
Somewhat Likely
Not Likely At All
Share a story about your local springs on social media
Citrus Hernando Marion Total

Page 31 of 108
18.0%
30.5%
51.6%
11.7%
34.9%
53.4%
17.9%
29.4%
52.7%
15.9%
31.6%
52.6%
Very Likely
Somewhat Likely
Not Likely At All
Send a text message to a friend about your local springs
Citrus Hernando Marion Total
10.4%
37.0%
52.6%
13.5%
35.7%
50.8%
10.9%
35.3%
53.8%
11.6%
36.0%
52.4%
Very Likely
Somewhat Likely
Not Likely At All
Subscribe to an online newsletter or mailing list
Citrus Hernando Marion Total

Page 32 of 108
Perceptions of the Southwest Florida Water
Management District
This section focuses on the perceptions that citizens in Citrus, Hernando and Marion counties have of the
District. To gauge responses, we asked the following questions:
Before today’s survey, had you ever heard of the Southwest Florida Water Management District,
sometimes called Swiftmud?
I’m going to read a list of groups you may have heard of. Please tell me if you believe they are Very
Credible, Somewhat Credible, or Not at all Credible. If you have never heard of them, let me know
that too.
The Southwest Florida Water Management District is the leader in taking the right actions to improve
the health of the springs in your area.
The Southwest Florida Water Management District has the scientific knowledge necessary to improve
the health of the springs in your area.
The Southwest Florida Water Management District is committed to improving the health of the
springs in your area.
The Southwest Florida Water Management District cares about the health of the springs in my area.
Using a scale of Excellent, Good, OK, Poor and Terrible, how would you rate the Southwest Florida
Water Management District's performance in:
o Protecting springs in your area
o Educating people about the condition of the springs
o Educating people about what they can do to help protect the springs
o Ensuring that not too much water is drawn out of the ground for various uses
o Listening to community input that may benefit the springs in your area
Fewer residents than in previous years reported having heard of the Southwest Florida Water Management
District before taking the survey. While District awareness dropped a few percentage points, positive sentiment
either increased or remained the same from previous surveys on most of the survey questions asked.
Two-thirds of the respondents rated the District as very or somewhat credible. This statistic was consistent with
previous years. Once again, federal and state government agencies tended to be rated higher on the credibility
scale.
We believe that by continuing to conduct campaigns like “My Home. My Springs.” and other public outreach
efforts, District sentiment will continue to grow in the community.
Two notes on the following charts:
First: The question “Scientists at the Southwest Florida Water Management District have the scientific
knowledge necessary to improve the health of the springs in your area” was asked to every respondent with the
assumption that if they didn’t know about the District, they would respond “Don’t know.”

Page 33 of 108
Second: When testing the questions “Using a scale of Excellent, Good, OK, Poor and Terrible, how would you
rate the Southwest Florida Water Management District's performance,” Only respondents who had heard of the
District were surveyed.
54%
64%
61%
38%
58%
62%
72%
43%
66%
73%
79%
46%
71%
79%
80%
53%
65%
79%
78%
43%
Total
Citrus
Hernando
Marion
Before today’s survey, had you ever heard of the Southwest Florida Water Management District, sometimes called
Swiftmud?
2017 2016 2015 2014 2013

Page 34 of 108
Statistical Differences Between the Counties
I’m going to read a list of groups you may have heard of. Please tell me if you
believe they are Very Credible, Somewhat Credible, or Not at all Credible. If you have
never heard of them, let me know that too.
64.1%
32.3%
3.6%
61.5%
32.8%
5.7%
37.9%
56.1%
6.0%
54.5%
40.4%
5.1%
Yes
No
Don’t know
Before today’s survey, had you ever heard of the Southwest Florida Water Management District, sometimes called
Swiftmud?
Citrus Hernando Marion Total

Page 35 of 108
96%
95%
93%
86%
85%
84%
82%
74%
69%
51%
42%
41%
Your local city or county government
U.S. Fish and Wildlife Service
Florida Fish and Wildlife ConservationCommission
Florida Department of Environmental Protection
US Environmental Protection Agency
Florida Department of Agriculture andConsumer Services
“Save the Manatee” Organization
University of Florida/IFAS (Institute of Food andAgricultural Sciences)
Southwest Florida Water Management District
The Sierra Club
Florida Springs Institute
Florida Citizens for Cleaner Springs
Total Credibility (Very & Somewhat Credible Combined) 2017

Page 36 of 108
Statistical Differences Between the Counties
23.4%
45.1%
10.9%
20.6%
31.8%
42.7%
6.0%
19.5%
20.3%
45.2%
7.5%
27.0%
25.2%
44.3%
8.2%
22.4%
Very Credible
Somewhat Credible
Not At All Credible
Never Heard of Them
Southwest Florida Water Management District
Citrus Hernando Marion Total
40.9%
45.1%
6.5%
7.6%
39.3%
47.4%
3.4%
9.9%
37.1%
48.6%
3.9%
10.4%
39.1%
47.0%
4.6%
9.3%
Very Credible
Somewhat Credible
Not At All Credible
Never Heard of Them
Florida Department of Environmental Protection
Citrus Hernando Marion Total

Page 37 of 108
This is the fake organization presented to show that the population will react to certain terms and possibly get
confused with organizations in this space. The results are consistent with previous surveys.
Statistical Differences Between the Counties
14.3%
27.6%
1.8%
56.3%
13.8%
25.8%
3.1%
57.3%
11.9%
30.6%
2.6%
54.8%
13.4%
28.0%
2.5%
56.1%
Very Credible
Somewhat Credible
Not At All Credible
Never Heard of Them
Florida Citizens for Cleaner Springs
Citrus Hernando Marion Total
42.2%
31.5%
0.3%
26.0%
35.2%
38.3%
3.1%
23.4%
44.4%
29.1%
1.3%
25.2%
40.6%
33.0%
1.6%
24.9%
Very Credible
Somewhat Credible
Not At All Credible
Never Heard of Them
University of Florida/IFAS (Institute of Food and Agricultural Sciences)
Citrus Hernando Marion Total

Page 38 of 108
36.5%
45.8%
3.9%
13.8%
35.4%
50.5%
2.6%
11.5%
36.4%
48.8%
3.1%
11.7%
36.1%
48.4%
3.2%
12.3%
Very Credible
Somewhat Credible
Not At All Credible
Never Heard of Them
Florida Department of Agriculture and Consumer Services
Citrus Hernando Marion Total
61.2%
33.6%
1.6%
3.6%
60.4%
34.9%
1.8%
2.9%
57.7%
37.1%
2.6%
2.6%
59.8%
35.2%
2.0%
3.0%
Very Credible
Somewhat Credible
Not At All Credible
Never Heard of Them
U.S. Fish and Wildlife Service
Citrus Hernando Marion Total

Page 39 of 108
43.8%
39.6%
2.3%
14.3%
43.2%
40.1%
1.6%
15.1%
38.2%
40.5%
1.6%
19.7%
41.7%
40.1%
1.8%
16.4%
Very Credible
Somewhat Credible
Not At All Credible
Never Heard ofThem
“Save the Manatee” Organization
Citrus Hernando Marion Total
35.9%
47.7%
10.4%
6.0%
39.8%
46.9%
7.8%
5.5%
30.4%
53.8%
9.4%
6.5%
35.4%
49.4%
9.2%
6.0%
Very Credible
Somewhat Credible
Not At All Credible
Never Heard of Them
US Environmental Protection Agency
Citrus Hernando Marion Total

Page 40 of 108
21.1%
31.8%
7.8%
39.3%
21.9%
32.0%
7.6%
38.5%
16.6%
28.6%
10.6%
44.2%
19.9%
30.8%
8.7%
40.7%
Very Credible
Somewhat Credible
Not At All Credible
Never Heard of Them
The Sierra Club
Citrus Hernando Marion Total
15.4%
25.3%
2.3%
57.0%
14.3%
27.9%
1.3%
56.5%
12.2%
30.1%
1.8%
55.8%
14.0%
27.8%
1.8%
56.5%
Very Credible
Somewhat Credible
Not At All Credible
Never Heard of Them
Florida Springs Institute
Citrus Hernando Marion Total

Page 41 of 108
57.0%
35.7%
1.8%
5.5%
57.0%
35.4%
0.8%
6.8%
55.1%
37.4%
2.1%
5.5%
56.4%
36.2%
1.6%
5.9%
Very Credible
Somewhat Credible
Not At All Credible
Never Heard of Them
Florida Fish and Wildlife Conservation Commission
Citrus Hernando Marion Total

Page 42 of 108
9.6%
84.4%
5.2%
0.8%
7.0%
86.7%
5.7%
0.5%
0.8%
98.7%
0.5%
5.8%
89.9%
3.6%
0.6%
Very Credible
Somewhat Credible
Not At All Credible
Never Heard of Them
Your local city or county government
Citrus Hernando Marion Total

Page 43 of 108
This was asked to every respondent with the assumption that if they didn’t know about the District, they would respond “Don’t know.” This
question was asked in the same way in 2016.
10%
35%
28%
3%
1%
22%
10%
32%
29%
5%
4%
21%
7%
38%
20%
4%
2%
30%
8%
40%
18%
8%
2%
23%
7%
37%
13%
11%
3%
29%
Strongly agree
Agree
Neither agree nor disagree
Disagree
Strongly disagree
Don't know
Scientists at the Southwest Florida Water Management District have the scientific knowledge necessary to improve the health of
the springs in your area.
2017 2016 2015 2014 2013

Page 44 of 108
This was asked to every respondent with the assumption that if they didn’t know about the District, they would respond “Don’t know.”
9.6%
33.9%
29.2%
4.2%
2.3%
20.8%
13.0%
37.5%
24.5%
2.3%
0.5%
22.1%
8.1%
33.8%
29.9%
2.3%
1.6%
24.4%
10.2%
35.0%
27.8%
2.9%
1.5%
22.5%
Strongly Agree
Agree
Neither Agree nor Disagree
Disagree
Strongly Disagree
Don't Know
The Southwest Florida Water Management District has the scientific knowledge necessary to improve the health of the
springs in your area.
Citrus Hernando Marion Total

Page 45 of 108
This was asked to every respondent with the assumption that if they didn’t know about the District, they would respond “Don’t know.”
7%
24%
34%
7%
3%
25%
8%
24%
33%
7%
4%
24%
7%
34%
22%
8%
3%
26%
5%
35%
18%
13%
5%
25%
4%
24%
14%
13%
7%
39%
Strongly agree
Agree
Neither agree nor disagree
Disagree
Strongly disagree
Don't know
The Southwest Florida Water Management District is the leader in taking the right actions to improve the health of the springs in your
area.
2017 2016 2015 2014 2013

Page 46 of 108
Statistical Differences Between Counties
This was asked to every respondent with the assumption that if they didn’t know about the District, they would respond “Don’t know.”
4.7%
23.2%
33.9%
10.9%
4.4%
22.9%
9.6%
25.8%
32.8%
4.9%
1.8%
25.0%
5.7%
23.1%
34.5%
6.0%
2.6%
28.1%
6.7%
24.0%
33.7%
7.3%
2.9%
25.3%
Strongly Agree
Agree
Neither Agree nor Disagree
Disagree
Strongly Disagree
Don't Know
The Southwest Florida Water Management District is the leader in taking the right actions to improve the health of the springs in
your area.
Citrus Hernando Marion Total

Page 47 of 108
This was asked to every respondent with the assumption that if they didn’t know about the District, they would respond “Don’t know.”
9%
34%
29%
6%
1%
21%
9%
30%
31%
7%
3%
20%
9%
36%
20%
7%
2%
27%
6%
42%
18%
10%
3%
20%
4%
28%
12%
14%
5%
37%
Strongly agree
Agree
Neither agree nor disagree
Disagree
Strongly disagree
Don't know
The Southwest Florida Water Management District is committed to improving the health of the springs in your area.
2017 2016 2015 2014 2013

Page 48 of 108
Statistical Differences Between Counties
This was asked to every respondent with the assumption that if they didn’t know about the District, they would respond “Don’t know.”
6.8%
34.1%
29.7%
8.3%
2.1%
19.0%
13.0%
35.2%
27.9%
3.6%
0.3%
20.1%
6.8%
32.2%
30.9%
5.2%
1.6%
23.4%
8.8%
33.8%
29.5%
5.7%
1.3%
20.8%
Strongly Agree
Agree
Neither Agree nor Disagree
Disagree
Strongly Disagree
Don't Know
The Southwest Florida Water Management District is committed to improving the health of the springs in your area.
Citrus Hernando Marion Total

Page 49 of 108
New question in 2017
9.6%
31.8%
28.9%
4.9%
2.6%
22.1%
11.7%
30.5%
32.3%
3.4%
1.0%
21.1%
7.3%
30.4%
32.7%
3.1%
1.6%
24.9%
9.5%
30.9%
31.3%
3.8%
1.7%
22.7%
Strongly Agree
Agree
Neither Agree nor Disagree
Disagree
Strongly Disagree
Don't Know
The Southwest Florida Water Management District scientists have the expertise to maintain the springs in our area.
Citrus Hernando Marion Total

Page 50 of 108
New question in 2017
Statistical Differences Between the Counties
7.6%
34.1%
29.4%
8.1%
2.9%
18.0%
15.6%
36.7%
25.8%
4.7%
1.0%
16.1%
8.3%
35.1%
26.0%
5.5%
2.1%
23.1%
10.5%
35.3%
27.1%
6.1%
2.0%
19.1%
Strongly Agree
Agree
Neither Agree nor Disagree
Disagree
Strongly Disagree
Don't Know
The Southwest Florida Water Management District cares about the health of the springs in my area.
Citrus Hernando Marion Total

Page 51 of 108
Using a scale of Excellent, Good, OK, Poor and Terrible, how would you rate the
Southwest Florida Water Management District's performance in:
Only respondents who had heard of the District responded.
12%
32%
29%
10%
2%
15%
7%
30%
27%
14%
4%
17%
7%
22%
18%
13%
4%
35%
8%
24%
25%
17%
9%
17%
5%
20%
23%
13%
8%
32%
Excellent
Good
OK
Poor
Terrible
Don't know
Protecting springs in your area
2017 2016 2015 2014 2013

Page 52 of 108
Statistical Differences Between the Counties
Only respondents who had heard of the District responded.
14.2%
24.4%
29.3%
13.0%
3.7%
15.4%
12.3%
40.3%
23.3%
6.4%
0.8%
16.9%
6.2%
30.8%
37.0%
11.0%
2.7%
12.3%
11.6%
31.8%
28.8%
10.0%
2.4%
15.3%
Excellent
Good
OK
Poor
Terrible
Don't know
Protecting springs in your area
Citrus Hernando Marion Total

Page 53 of 108
Only respondents who had heard of the District responded.
9%
21%
30%
21%
5%
14%
9%
21%
30%
21%
5%
14%
7%
17%
19%
19%
6%
32%
7%
22%
21%
28%
8%
14%
5%
15%
17%
22%
7%
33%
Excellent
Good
OK
Poor
Terrible
Don't know
Educating people about the condition of the springs
2017 2016 2015 2014 2013

Page 54 of 108
Only respondents who had heard of the District responded.
6.5%
24.4%
32.9%
20.3%
2.8%
13.0%
12.7%
28.8%
27.1%
14.4%
2.5%
14.4%
6.2%
22.6%
35.6%
20.5%
4.1%
11.0%
8.8%
25.6%
31.4%
18.2%
3.0%
13.1%
Excellent
Good
OK
Poor
Terrible
Don't know
Educating people about the condition of the springs
Citrus Hernando Marion Total

Page 55 of 108
Only respondents who had heard of the District responded.
9%
26%
29%
20%
3%
13%
8%
23%
29%
22%
5%
14%
6%
18%
19%
17%
8%
32%
7%
24%
22%
24%
10%
13%
6%
14%
18%
23%
7%
32%
Excellent
Good
OK
Poor
Terrible
Don't know
Educating people about what they can do to help protect the springs
2017 2016 2015 2014 2013

Page 56 of 108
Only respondents who had heard of the District responded.
7.3%
25.6%
28.0%
23.6%
2.0%
13.4%
10.6%
29.7%
24.6%
17.8%
2.5%
14.8%
7.5%
22.6%
36.3%
19.2%
3.4%
11.0%
8.6%
26.4%
28.7%
20.4%
2.5%
13.4%
Excellent
Good
OK
Poor
Terrible
Don't know
Educating people about what they can do to help protect the springs
Citrus Hernando Marion Total

Page 57 of 108
Only respondents who had heard of the District responded.
Statistical Differences Between the Counties
7%
21%
22%
19%
10%
21%
6%
14%
22%
20%
19%
18%
7%
16%
17%
14%
7%
38%
4%
20%
19%
23%
14%
20%
4%
12%
17%
24%
10%
34%
Excellent
Good
OK
Poor
Terrible
Don't know
Ensuring that not too much water is drawn out of the ground for various uses
2017 2016 2015 2014 2013

Page 58 of 108
Statistical Differences Between the Counties
Only respondents who had heard of the District responded.
8.5%
15.9%
22.4%
19.1%
13.0%
21.1%
7.6%
22.0%
22.5%
17.4%
4.2%
26.3%
2.1%
26.0%
20.5%
23.3%
14.4%
13.7%
6.7%
20.5%
22.0%
19.4%
10.0%
21.3%
Excellent
Good
OK
Poor
Terrible
Don't know
Ensuring that not too much water is drawn out of the ground for various uses
Citrus Hernando Marion Total

Page 59 of 108
Only respondents who had heard of the District responded.
7%
21%
28%
14%
6%
24%
6%
16%
28%
16%
10%
25%
5%
18%
16%
12%
5%
43%
5%
22%
22%
20%
12%
20%
4%
13%
18%
19%
9%
37%
Excellent
Good
OK
Poor
Terrible
Don't know
Listening to community input that may benefit the springs in your area?
2017 2016 2015 2014 2013

Page 60 of 108
Statistical Differences Between the Counties
Only respondents who had heard of the District responded.
7.3%
16.7%
28.0%
19.5%
8.1%
20.3%
8.1%
23.3%
25.4%
9.7%
3.4%
30.1%
2.7%
25.3%
30.8%
13.7%
8.2%
19.2%
6.5%
21.2%
27.7%
14.5%
6.4%
23.7%
Excellent
Good
OK
Poor
Terrible
Don't know
Listening to community input that may benefit the springs in your area
Citrus Hernando Marion Total

Page 61 of 108
Springs Advertising Recall & Evolution
This was the first test of the “My Home. My Springs.” campaign. Since the concept was introduced this year, we
created a baseline by asking the following questions:
Have you recently seen or heard advertisements about springs or springs restoration in your area?
Where did you see or hear this advertising?
What do you remember about the advertisement?
Think about the last advertisement about springs or springs restoration you heard or saw. What
organization sponsored the message?
Nearly a third of the overall sample reported seeing or hearing springs related advertisements within the past
few months. Of those reporting recall, nearly 45 percent stated they remembered the previous campaign,
“Restoring our Springs” – only ten percent recalled “My Home. My Springs.” We feel comforted in this
baseline. We believe the “restoring” number is inflated because of the way we ask the question, “Have you
recently seen or heard advertisements about springs or springs restoration in your area?” Next year we suggest
taking out the phrase, “springs restoration” from the question.
Just as in previous years, a large portion of the sample reported seeing advertisements on television or in the
newspaper. As in our report last year, we think these number are overinflated. Previous studies show that
people have a difficult time differentiating media messages as advertisements, social media posts, news stories or
even entertainment. We believe respondents legitimately consumed media messages about the springs, just not
the District’s ads. Evidence of this has been found in previous surveys as well.
We do believe there continues to be confusion with competing messaging in the springs area. This confusion
ultimately inflates recall. As the District continues to build out “My Home. My Springs.”, it should find ways to
develop messaging that is unique to them.
When respondents were able to name the organization behind the messaging, the District beat out others for
the credit. A total of 11% of respondents were able to name the District as the organization who sponsored the
last advertisement about springs or springs restoration they saw or heard compared to 9.8% who responded
“your local city or county government,” the next most common response.
The data presented in this section can assist the District in honing the “My Home. My Springs.” concept.
Specific campaign guidance will accompany the pertinent data tables.

Page 62 of 108
2017 “My Home. My Springs.” Campaign Collateral Examples
Here are three example collateral pieces that were used for the 2017 “My Home. My Springs.” campaign. The
campaign ran from April through June and includes billboards, newspaper ads, digital and social media ads,
movie theater ads, radio commercials as well as utility bill inserts.
Sample Radio Scripts
My Home. My Springs. 2017 Campaign :15 Radio Script As a scientist, protecting our springs is more than a job for me at the Southwest Florida
Water Management District. This is my home. These are my springs. Share your
springs story with us on social media using hashtag MySprings.
:30 Radio Script As a scientist, protecting our springs is more than a job for me at the Southwest Florida
Water Management District. I live here. I love spending time at them. I kayak and
snorkel or just relax with my family. They’re a place to enjoy the outdoors and are
important to the local economy. I have made memories at these springs and want my
children and grandchildren to enjoy them too. This is my home. These are my springs.
Share your springs story with us on social media using hashtag MySprings.
Sample Billboard

Page 63 of 108
Sample Bill Insert
Sample Social Media Posts

Page 64 of 108

Page 65 of 108

Page 66 of 108
Springs Advertising Recall
32%
47%
24%
25%
35%
44%
23%
36%
30%
34%
22%
34%
35%
42%
27%
39%
Total
Citrus
Hernando
Marion
In the past few months, have you seen or heard any advertisements about springs or springs restoration? (Unaided
Recall)
2017 2016 2015 2014
46.9%
49.5%
3.6%
23.7%
67.2%
9.1%
25.5%
66.5%
8.1%
32.0%
61.1%
6.9%
Yes
No
Don't Know
Have you recently seen or heard advertisements about springs or springs restoration in your area?
Citrus Hernando Marion Total

Page 67 of 108
Statistical Differences Between the Counties
*Multiple responses permitted
45%
31%
11%
14%
42%
20%
1%
2%
7%
58%
34%
9%
8%
21%
15%
2%
1%
5%
15%
8%
4%
3%
2%
1%
2%
15%
10%
3%
3%
3%
2%
6%
Newspaper
Television
Billboard
Radio
Internet/social media
Community events
Don't know
Movie Theatre
Utility Bill Insert
Where did you see or hear this advertising?*
2017 2016 2015 2014

Page 68 of 108
This section will look at each medium individually to better understand where people believe they are
receiving the springs advertisements. As we have mentioned in the past, citizens often do not differentiate
public service advertisements from news stories. We believe this is the reason so many have reported seeing ads
on television and in the newspaper.
13.9%
13.2%
15.3%
14.1%
Citrus
Hernando
Marion
Total
Radio
42.2%
39.6%
42.9%
41.7%
Citrus
Hernando
Marion
Total
Internet/Social Media
13.3%
14.3%
3.1%
10.8%
Citrus
Hernando
Marion
Total
Billboard

Page 69 of 108
Statistical Differences Between the Counties
Statistical Differences Between the Counties
Statistical Differences Between the Counties
28.9%
40.7%
25.5%
30.9%
Citrus
Hernando
Marion
Total
Television
56.7%
29.7%
36.7%
44.7%
Citrus
Hernando
Marion
Total
Newspaper
2.2%
4.4%
1.0%
2.4%
Citrus
Hernando
Marion
Total
Movie theater
Page 70 of 108
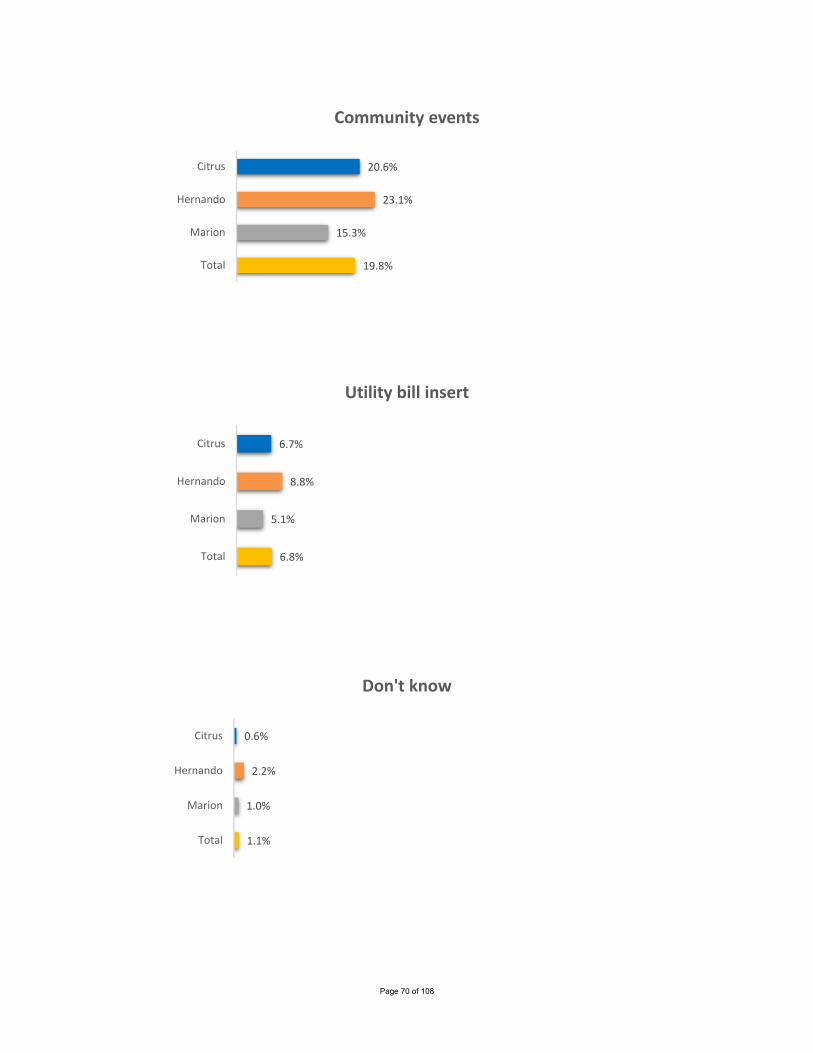
20.6%
23.1%
15.3%
19.8%
Citrus
Hernando
Marion
Total
Community events
6.7%
8.8%
5.1%
6.8%
Citrus
Hernando
Marion
Total
Utility bill insert
0.6%
2.2%
1.0%
1.1%
Citrus
Hernando
Marion
Total
Don't know

Page 71 of 108

Page 72 of 108
43%
24%
7%
27%
21%
24%
5%
1%
6%
46%
21%
12%
28%
34%
38%
5%
3%
4%
9%
1%
1%
1%
0%
1%
0%
12%
5%
6%
2%
0%
0%
0%
1%
1%
14%
6%
Restoring our Springs!
Mother and baby manatee
The springs have been changing for nearly acentury
Join us in the community effort
It will take time to restore our springs
Southwest Florida Water Management District
Circles with pictures of the springs
Other
Don't remember
Residents have seen or heard advertisements featuring the following:
(Unaided Recall)
2017 2016 2015 2014
Page 73 of 108
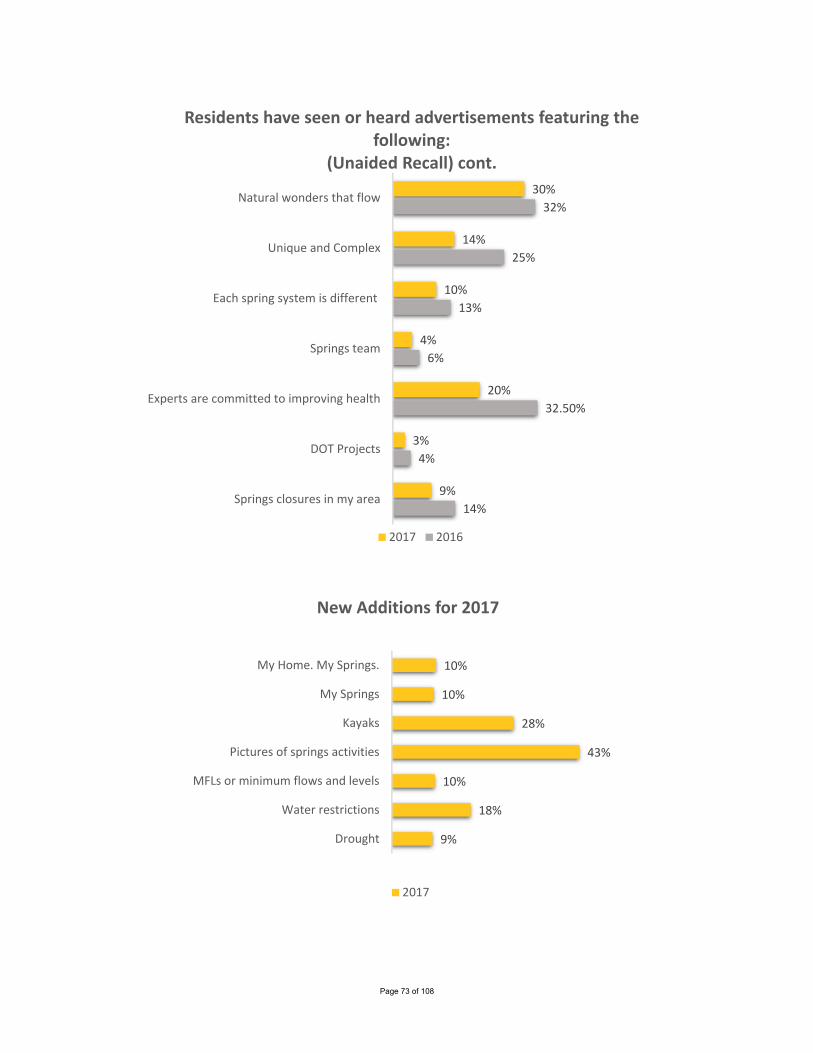
30%
14%
10%
4%
20%
3%
9%
32%
25%
13%
6%
32.50%
4%
14%
Natural wonders that flow
Unique and Complex
Each spring system is different
Springs team
Experts are committed to improving health
DOT Projects
Springs closures in my area
Residents have seen or heard advertisements featuring the following:
(Unaided Recall) cont.
2017 2016
10%
10%
28%
43%
10%
18%
9%
My Home. My Springs.
My Springs
Kayaks
Pictures of springs activities
MFLs or minimum flows and levels
Water restrictions
Drought
New Additions for 2017
2017

Page 74 of 108
This high recall could be a result of the previous campaign length or the priming of the interviewee by asking,
“Have you recently seen or heard advertisements about springs or springs restoration in your area?”
6.1%
11.0%
6.1%
7.3%
Citrus
Hernando
Marion
Total
The springs have been changing for nearly a century
20.0%
23.1%
20.4%
20.9%
Citrus
Hernando
Marion
Total
It will take time to restore our springs
46.1%
39.6%
40.8%
43.1%
Citrus
Hernando
Marion
Total
Restoring our Springs!

Page 75 of 108
Statistical Differences Between the Counties
As we mentioned in the previous reports and presentations, we believe that simply identifying manatees is a
weak linkage to the District’s campaign.
To be registered here, the respondent had to have used the words “natural wonders.”
To be registered here, the respondent had to have used the words “unique” or “complex.”
31.1%
25.3%
11.2%
24.4%
Citrus
Hernando
Marion
Total
Mother and baby manatee
28.3%
29.7%
31.6%
29.5%
Citrus
Hernando
Marion
Total
Springs are natural wonders that flow through Florida
14.4%
12.1%
14.3%
13.8%
Citrus
Hernando
Marion
Total
Springs are unique and complex

Page 76 of 108
Just as with manatees, we believe that this is a weak link to your campaign.
To register here, they had to use the word “team.”
7.2%
5.5%
2.0%
5.4%
Citrus
Hernando
Marion
Total
Circles with pictures of the springs
8.9%
12.1%
9.2%
9.8%
Citrus
Hernando
Marion
Total
Each spring system is different
5.6%
5.5%
1.0%
4.3%
Citrus
Hernando
Marion
Total
Springs Team

Page 77 of 108
To register here, they had to use the word “experts.”
Statistical Differences Between the Counties
20.6%
22.0%
15.3%
19.5%
Citrus
Hernando
Marion
Total
District experts are committed to improving the health of major springs in our region
12.8%
5.5%
4.1%
8.7%
Citrus
Hernando
Marion
Total
Springs closures in my area
30.0%
23.1%
23.5%
26.6%
Citrus
Hernando
Marion
Total
Join us in the community effort

Page 78 of 108
Statistical Differences Between the Counties
Statistical Differences Between the Counties
To qualify here, the respondent had to say, “my springs” without “my home.”
1.7%
6.6%
1.0%
2.7%
Citrus
Hernando
Marion
Total
Department of Transportation Projects
27.8%
20.9%
18.4%
23.6%
Citrus
Hernando
Marion
Total
Southwest Florida Water Management District
10.0%
11.0%
7.1%
9.5%
Citrus
Hernando
Marion
Total
My springs

Page 79 of 108
As we have previously stated in discussions about manatees-related visuals, some caution should be taken in
drawing direct links between these visuals and specific recall of its “My Home. My Springs.” Campaign.
Statistical Differences Between the Counties
To register here, the interviewee had to say, “minimum flow” or “minimum levels.”
28.3%
34.1%
20.4%
27.6%
Citrus
Hernando
Marion
Total
Kayaks
48.3%
35.2%
38.8%
42.5%
Citrus
Hernando
Marion
Total
Pictures of springs/activities
14.4%
3.3%
7.1%
9.8%
Citrus
Hernando
Marion
Total
MFLs or minimum flows and levels

Page 80 of 108
18.9%
18.7%
15.3%
17.9%
Citrus
Hernando
Marion
Total
Water restrictions
8.9%
6.6%
12.2%
9.2%
Citrus
Hernando
Marion
Total
Drought
4.4%
6.6%
8.2%
6.0%
Citrus
Hernando
Marion
Total
Don’t remember anything about the ad

Page 81 of 108
A third of respondents don’t know where the messages are coming from. The District did get the most credit (a
little over 11%) of the named organizations. This graph shows that the District should be more explicit in its
messaging if they are concerned with people knowing the ads come from them.
33%
11%
10%
8%
7%
7%
4%
4%
4%
4%
3%
2%
2%
1%
1%
I don’t know
Southwest Florida Water Management District
Your local city or county government
Friends of the Rainbow River/Rainbow RiverConservation
Florida Department of Environmental Protection
“Save the Manatee” Organization or other local environmental nonprofit organization
Florida Department of Agriculture and ConsumerServices
Homosassa River Restoration
Save Crystal River
U.S. Fish & Wildlife Service
One Rake at a Time
University of Florida/IFAS (Institute of Food andAgricultural Sciences)
Duke Energy
Other
Florida Springs Institute
Think about the last advertisement about springs or springs restoration you heard or saw. What organization sponsored the
message?
Total 2017 Sample

Page 82 of 108
The Evolution of the “My Home. My Springs.” Campaign
In last year’s survey Taproot added a few questions to gauge some psychographics and emotional components
associated with visiting springs. We included them again in 2017. We urge the District to use these responses to
continue to hone messaging and social media content as the campaign grows.
The following statements continue to explore why people visit the springs and the deeper meaning the visits
may have in their lives.
Statistical Differences Between the Counties
32.3%
47.1%
13.8%
2.9%
0.5%
3.4%
26.6%
38.8%
21.1%
3.9%
1.3%
8.3%
29.9%
43.9%
19.5%
3.4%
0.3%
3.1%
29.6%
43.3%
18.1%
3.4%
0.7%
4.9%
20.4%
46.2%
22.3%
3.9%
2.0%
5.2%
Strongly Agree
Agree
Neither Agree nor Disagree
Disagree
Strongly Disagree
Don't Know
Visiting the springs in my area is a source of relaxation.
Citrus Hernando Marion 2017 Total 2016 Total

Page 83 of 108
The District should continue to use imagery and content that elicits the “relaxation” connection to local springs.
Statistical Differences Between the Counties
30.7%
36.5%
18.8%
8.3%
3.9%
1.8%
23.4%
31.8%
20.6%
13.5%
5.7%
4.9%
23.1%
31.9%
23.1%
16.1%
4.7%
1.0%
25.8%
33.4%
20.8%
12.7%
4.8%
2.6%
18.9%
33.3%
22.7%
16.8%
4.3%
4.1%
Strongly Agree
Agree
Neither Agree nor Disagree
Disagree
Strongly Disagree
Don't Know
When describing where I live, I am likely to mention the springs in my area.
Citrus Hernando Marion 2017 Total 2016 Total
Page 84 of 108
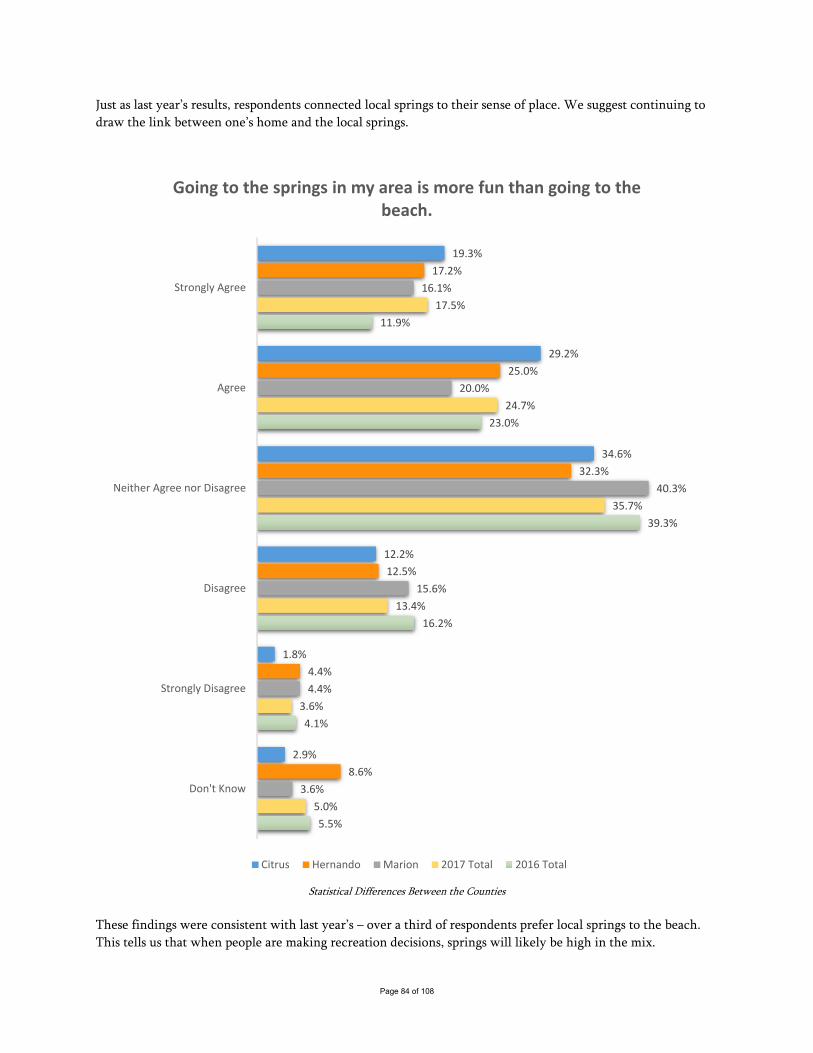
Just as last year’s results, respondents connected local springs to their sense of place. We suggest continuing to
draw the link between one’s home and the local springs.
Statistical Differences Between the Counties
These findings were consistent with last year’s – over a third of respondents prefer local springs to the beach.
This tells us that when people are making recreation decisions, springs will likely be high in the mix.
19.3%
29.2%
34.6%
12.2%
1.8%
2.9%
17.2%
25.0%
32.3%
12.5%
4.4%
8.6%
16.1%
20.0%
40.3%
15.6%
4.4%
3.6%
17.5%
24.7%
35.7%
13.4%
3.6%
5.0%
11.9%
23.0%
39.3%
16.2%
4.1%
5.5%
Strongly Agree
Agree
Neither Agree nor Disagree
Disagree
Strongly Disagree
Don't Know
Going to the springs in my area is more fun than going to the beach.
Citrus Hernando Marion 2017 Total 2016 Total

Page 85 of 108
Statistical Differences Between the Counties
2.9%
3.9%
21.4%
40.9%
27.1%
3.9%
1.8%
4.7%
24.2%
34.9%
21.9%
12.5%
1.0%
3.6%
25.5%
37.1%
26.2%
6.5%
1.9%
4.1%
23.7%
37.6%
25.1%
7.6%
1.5%
3.6%
24.8%
39.3%
22.0%
8.8%
Strongly Agree
Agree
Neither Agree nor Disagree
Disagree
Strongly Disagree
Don't Know
The springs in my area are overrated.
Citrus Hernando Marion 2017 Total 2016 Total

Page 86 of 108
This graph shows the springs are an authentic part of the community – not one of the artificial “theme park”
destinations popular in Florida.
Statistical Differences Between the Counties
39.1%
41.9%
14.3%
1.3%
3.4%
33.6%
37.0%
17.2%
1.3%
1.3%
9.6%
35.6%
43.4%
15.1%
1.8%
0.5%
3.6%
36.1%
40.8%
15.5%
1.5%
0.6%
5.6%
28.9%
46.4%
19.2%
0.8%
0.7%
4.1%
Strongly Agree
Agree
Neither Agree nor Disagree
Disagree
Strongly Disagree
Don't Know
A day at the springs is a day well spent.
Citrus Hernando Marion 2017 Total 2016 Total

Page 87 of 108
Continue to pair the activities that happen at the springs accompanied with the “My Home. My Springs.”
message and not simply the springs alone – e.g. manatees, fish, trees. Show what people can expect to do when
they visit – a visual representation of a “day well spent.”
34.1%
37.0%
18.0%
5.5%
1.6%
3.9%
26.0%
31.3%
19.8%
10.7%
4.7%
7.6%
31.2%
41.0%
16.9%
5.7%
2.9%
2.3%
30.4%
36.4%
18.2%
7.3%
3.0%
4.6%
22.0%
36.2%
18.1%
10.9%
8.6%
4.2%
Strongly Agree
Agree
Neither Agree nor Disagree
Disagree
Strongly Disagree
Don't Know
I have many good memories about visiting the springs in my area.
Citrus Hernando Marion 2017 Total 2016 Total

Page 88 of 108
Statistical Differences Between the Counties
Nearly three quarters of the sample reported having fond memories from springs visits. This may be an
opportunity to engage local citizens – rather than “share your springs story,” try “share your favorite springs
memory.”

Page 89 of 108
Just as last year’s results, the sample was all over the spectrum. We should look at losing this question next year.
18.2%
17.2%
26.6%
16.1%
16.9%
4.9%
15.9%
13.8%
23.2%
22.4%
17.2%
7.6%
17.1%
20.5%
22.3%
20.5%
14.0%
5.5%
17.1%
17.2%
24.0%
19.7%
16.0%
6.0%
12.0%
15.9%
21.3%
23.9%
21.1%
5.8%
Strongly Agree
Agree
Neither Agree nor Disagree
Disagree
Strongly Disagree
Don't Know
Visiting springs was an important part of my childhood.
Citrus Hernando Marion 2017 Total 2016 Total

Page 90 of 108
Statistical Differences Between the Counties
Once again, this table shows that closures put a damper on the recreation plans for residents throughout the
District.
12.8%
24.5%
32.6%
17.2%
9.9%
3.1%
10.9%
21.4%
32.0%
18.0%
7.8%
9.9%
9.6%
24.7%
34.5%
21.8%
6.2%
3.1%
11.1%
23.5%
33.0%
19.0%
8.0%
5.4%
10.1%
20.6%
29.6%
25.1%
10.2%
4.3%
Strongly Agree
Agree
Neither Agree nor Disagree
Disagree
Strongly Disagree
Don't Know
Springs closures in my area put a damper on my recreation plans.
Citrus Hernando Marion 2017 Total 2016 Total

Page 91 of 108
Just as we found last year, residents report closers affect them “personally.” We see this as another piece of
evidence that individuals have a strong personal connection to their local springs.
12.2%
19.3%
31.3%
21.1%
9.9%
6.3%
14.3%
18.5%
32.3%
17.4%
7.8%
9.6%
9.6%
20.8%
31.4%
22.9%
9.4%
6.0%
12.1%
19.5%
31.7%
20.5%
9.0%
7.3%
11.2%
21.8%
34.3%
17.1%
6.9%
8.7%
Strongly Agree
Agree
Neither Agree nor Disagree
Disagree
Strongly Disagree
Don't Know
Springs closures in my area affected me personally.
Citrus Hernando Marion 2017 Total 2016 Total

Page 92 of 108
Survey Sample Description
As in previous years, our survey sample was drawn from adults in Citrus, Hernando and the District’s portion of
Marion. Since time was tight in this survey, we culled down the traditional demographic questions to only
those that we would need for classification purposes:
I’m going to list some websites. Please tell me if you have visited each website in the past six months.
o VisitFlorida.com
o WaterMatters.org
o Facebook.com
o Twitter.com
o YouTube.com
o Weather.com
About how far from a water body (river, lake, stream, springs) do you live?
Which category best fits your age?
Do you live full-time or part-time in Florida?
Which of the following best represents your total household income in 2015 from all sources?
Was the respondent male or female?
While six out of ten members of the sample had heard of WaterMatters.org, only a small portion had visited the
site in the past 6 months. This was consistent in both the previous surveys. Also consistent with previous
surveys was the report that Facebook.com, YouTube.com or Weather.com were the most popular with the
respondents. We suggest the District continue to put resources into social media since such a large portion of
the sample reported regular use.

Page 93 of 108
Online Media Use
I’m going to list some websites. Please tell me if you have visited each website in
the past six months.
Statistical Differences Between the Counties
6.0%
59.4%
32.6%
2.1%
8.3%
56.8%
33.1%
1.8%
4.2%
52.7%
41.8%
1.3%
6.2%
56.3%
35.8%
1.7%
Yes
No
Never heard of them
Don’t remember
WaterMatters.org
Citrus Hernando Marion Total

Page 94 of 108
36.5%
53.6%
7.8%
2.1%
31.8%
58.1%
6.3%
3.9%
37.7%
51.7%
8.1%
2.6%
35.3%
54.5%
7.4%
2.9%
Yes
No
Never heard of them
Don’t remember
VisitFlorida.com
Citrus Hernando Marion Total
88.3%
11.5%
0.3%
83.9%
15.6%
0.5%
86.5%
13.2%
0.3%
86.2%
13.4%
0.3%
0.1%
Yes
No
Never heard of them
Don’t remember
Facebook.com
Citrus Hernando Marion Total

Page 95 of 108
37.2%
62.8%
38.3%
60.4%
1.0%
0.3%
38.7%
60.8%
0.5%
38.1%
61.3%
0.3%
0.3%
Yes
No
Never heard of them
Don’t remember
Twitter.com
Citrus Hernando Marion Total
85.2%
14.6%
0.3%
84.6%
14.1%
0.3%
1.0%
86.0%
13.5%
0.5%
85.3%
14.1%
0.2%
0.5%
Yes
No
Never heard of them
Don’t remember
Youtube.com
Citrus Hernando Marion Total

Page 96 of 108
76.8%
20.6%
1.8%
0.8%
72.4%
26.0%
0.8%
0.8%
82.3%
16.1%
0.8%
0.8%
77.2%
20.9%
1.1%
0.8%
Yes
No
Never heard of them
Don’t remember
Weather.com
Citrus Hernando Marion Total
14.1%
73.7%
9.4%
2.9%
16.4%
69.8%
10.7%
3.1%
14.5%
73.5%
9.6%
2.3%
15.0%
72.3%
9.9%
2.8%
Yes
No
Never heard of them
Don’t remember
SaveTheManatee.org
Citrus Hernando Marion Total

Page 97 of 108
Statistical Differences Between the Counties
Statistical Differences Between the Counties
25.3%
68.5%
5.2%
1.0%
40.1%
54.7%
1.6%
3.6%
13.0%
73.8%
12.5%
0.8%
26.1%
65.7%
6.4%
1.8%
Yes
No
Never heard of them
Don’t remember
TampaBay.com
Citrus Hernando Marion Total
61.2%
34.6%
3.4%
0.8%
6.3%
54.7%
38.3%
0.8%
3.9%
62.1%
32.7%
1.3%
23.8%
50.5%
24.8%
1.0%
Yes
No
Never heard of them
Don’t remember
ChronicleOnline.com
Citrus Hernando Marion Total

Page 98 of 108
10.4%
64.8%
20.8%
3.9%
12.2%
57.8%
27.3%
2.6%
16.4%
60.8%
20.5%
2.3%
13.0%
61.1%
22.9%
2.9%
Yes
No
Never heard of them
Don’t remember
FloridaSprings.org
Citrus Hernando Marion Total

Page 99 of 108
Demographics
Statistical Differences Between the Counties
11.5%
7.6%
7.8%
10.9%
25.3%
34.6%
2.3%
6.0%
7.6%
4.9%
8.9%
32.0%
35.4%
5.2%
4.7%
4.4%
4.4%
11.2%
19.0%
51.7%
4.7%
7.4%
6.5%
5.7%
10.3%
25.4%
40.6%
4.1%
Next to one
Within a half mile
Within a mile
1 to 2 miles
3 to 5 miles
More than 5 miles
Don't know
About how far from a water body (river, lake, stream, springs) do you live?
Citrus Hernando Marion Total

Page 100 of 108
9.1%
89.8%
0.5%
6.0%
91.9%
1.8%
6.2%
93.5%
0.3%
7.1%
91.8%
0.9%
Yes
No
I prefer not to answer
Are you a member in a community or environmental organization?
Citrus Hernando Marion Total
29.7%
2.7%
2.7%
5.4%
2.7%
45.9%
2.7%
8.1%
12.5%
8.3%
8.3%
4.2%
12.5%
4.2%
20.8%
16.7%
12.5%
8.3%
8.3%
8.3%
12.5%
33.3%
16.7%
12.5%
18.8%
2.4%
3.5%
2.4%
2.4%
8.2%
1.2%
4.7%
35.3%
10.6%
10.6%
Florida Springs Institute
One Rake at a Time
Homosassa River Restoration
Friends of the Rainbow River/Rainbow River Conservation
Save Crystal River
“Save the Manatee” Organization
Rotary International
Boy/Girl Scouts
Other
I don’t know
No organization
What is the name of the organization?
Citrus Hernando Marion Total

Page 101 of 108
“Other environmental organizations” included: The Audubon Society, Boys and Girls Clubs, Florida Trails,
Humane Society, National World Wildlife Rescue, the Masons, and multiple mentions of their homeowners’
association.
23.4%
51.0%
25.3%
0.3%
27.1%
48.7%
24.0%
0.3%
24.2%
51.4%
24.2%
0.3%
24.9%
50.4%
24.5%
0.3%
Under 35
35 to 64
65 or older
Prefer not to answer
Which category best fits your age?
Citrus Hernando Marion Total
96.4%
2.9%
0.8%
93.2%
3.9%
2.9%
89.6%
5.7%
4.7%
93.1%
4.2%
2.8%
Full‐time
Part‐time
Prefer not to answer
Do you live full‐time or part‐time in Florida?
Citrus Hernando Marion Total

Page 102 of 108
22.7%
29.9%
19.3%
12.2%
7.0%
8.9%
17.7%
33.1%
22.1%
8.1%
8.3%
10.7%
18.2%
31.2%
22.3%
10.9%
9.4%
8.1%
19.5%
31.4%
21.2%
10.4%
8.2%
9.2%
Less than $25,000
$25,000 to $49,999
$50,000 to $74,999
$75,000 to $99,999
More than $100,000
Prefer not to answer
Which of the following best represents your total household income in 2016 from all sources?
Citrus Hernando Marion Total
32.3%
67.2%
0.5%
29.9%
69.5%
0.5%
29.6%
70.4%
30.6%
69.0%
0.3%
Male
Female
Unknown
Gender
Citrus Hernando Marion Total

Page 103 of 108
Appendix
2017 “My Home. My Springs.” Post Test Instrument
Final 6/24/2017
Q1. In which county do you live?
1. Citrus
2. Hernando
3. Marion
4. Other [TERMINATE]
Q2. Have you visited any springs in your area in the last 5 years?
1. Yes [Go to Q2a]
2. No [Go to Q3]
3. Don’t know - DO NOT READ
Q2a. When was your last visit to a spring in your area?
DO NOT READ
1. Within the last month
2. 2 to 6 months ago
3. 7 to 12 months ago
4. 2 years ago
5. 3 years ago
6. 4 years ago
7. 5 years ago
8. Don’t specifically remember/Don’t know
Q3. How would you rate the health of the springs in your area - would you say they are:
1. Excellent
2. Good
3. OK
4. Poor
5. Terrible
6. Don't know - DO NOT READ
Q4. Based on what you know or might have heard, is there anything wrong with the springs in your area? IF YES
- “such as…” OR “what specifically is wrong”
DO NOT READ; CATEGORIZE; PROBE FOR UP TO 3
1. Lower water levels/lack of rainfall
2. Less flow
3. More algae (Lyngbya)
4. Less clear water
5. Greener water
6. Dead trees
7. Saltier water/sea-level rise
8. Fewer fish
9. Fewer underwater plants
10. More boaters
11. More recreation
12. More manatees
13. Nothing is wrong
14. Other [RECORD]
15. Don't know - DO NOT READ

Page 104 of 108
Q5. Have you recently seen or heard advertisements about springs or springs restoration in your area?
1. Yes
2. No [GO TO Q9]
3. Don't Know – [DO NOT READ] [GO TO Q9]
Q6. Where did you see or hear this advertising? (Select all that apply)
DO NOT READ
PROBE FOR UP TO 3
1. Radio
2. Internet [May respond as Online or Social Media]
3. Billboard
4. Television
5. Newspaper
6. Movie theater
7. Community events
8. Utility bill insert
9. Don't know – [DO NOT READ]
Q7. What do you remember about the advertisement?
DO NOT READ
CATEGORIZE
PROBE FOR UP TO 3
1. My Home. My Springs. - New addition in post test
2. My springs - New addition in post test
3. Kayaks - New addition in post test
4. Pictures of springs/activities - New addition in post test
5. MFLs or minimum flows and levels - New addition in post test
6. Water restrictions - New addition in post test
7. Drought - New addition in post test
8. The springs have been changing for nearly a century
9. It will take time to restore our springs
10. Restoring our Springs!
11. Mother and baby manatee
12. Southwest Florida Water Management District
13. Springs are natural wonders that flow through Florida
14. Springs are unique and complex
15. Circles with pictures of the springs
16. Each spring system is different
17. Springs Team
18. District experts are committed to improving the health of major springs in our region
19. Join us in the community effort
20. Department of Transportation Projects
21. Springs closures in my area
22. Other [RECORD]
23. Don’t remember anything about the ad
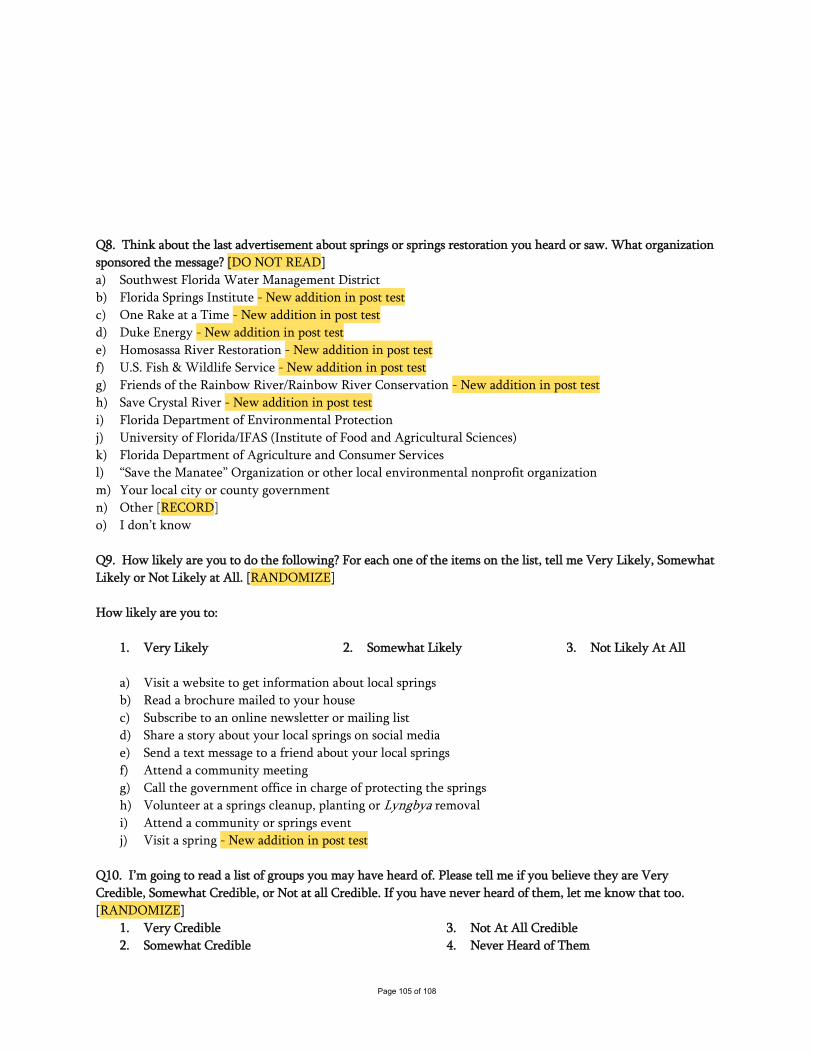
Page 105 of 108
Q8. Think about the last advertisement about springs or springs restoration you heard or saw. What organization
sponsored the message? [DO NOT READ]
a) Southwest Florida Water Management District
b) Florida Springs Institute - New addition in post test
c) One Rake at a Time - New addition in post test
d) Duke Energy - New addition in post test
e) Homosassa River Restoration - New addition in post test
f) U.S. Fish & Wildlife Service - New addition in post test
g) Friends of the Rainbow River/Rainbow River Conservation - New addition in post test
h) Save Crystal River - New addition in post test
i) Florida Department of Environmental Protection
j) University of Florida/IFAS (Institute of Food and Agricultural Sciences)
k) Florida Department of Agriculture and Consumer Services
l) “Save the Manatee” Organization or other local environmental nonprofit organization
m) Your local city or county government
n) Other [RECORD]
o) I don’t know
Q9. How likely are you to do the following? For each one of the items on the list, tell me Very Likely, Somewhat
Likely or Not Likely at All. [RANDOMIZE]
How likely are you to:
1. Very Likely 2. Somewhat Likely 3. Not Likely At All
a) Visit a website to get information about local springs
b) Read a brochure mailed to your house
c) Subscribe to an online newsletter or mailing list
d) Share a story about your local springs on social media
e) Send a text message to a friend about your local springs
f) Attend a community meeting
g) Call the government office in charge of protecting the springs
h) Volunteer at a springs cleanup, planting or Lyngbya removal
i) Attend a community or springs event
j) Visit a spring - New addition in post test
Q10. I’m going to read a list of groups you may have heard of. Please tell me if you believe they are Very
Credible, Somewhat Credible, or Not at all Credible. If you have never heard of them, let me know that too.
[RANDOMIZE]
1. Very Credible
2. Somewhat Credible
3. Not At All Credible
4. Never Heard of Them

Page 106 of 108
a) Southwest Florida Water Management
District
b) Florida Department of Environmental
Protection
c) Florida Citizens for Cleaner Springs [RED
HERRING]
d) University of Florida/IFAS (Institute of Food
and Agricultural Sciences)
e) Florida Department of Agriculture and
Consumer Services
f) U.S. Fish and Wildlife Service
g) “Save the Manatee” Organization
h) US Environmental Protection Agency
i) The Sierra Club
j) Florida Springs Institute
k) Florida Fish and Wildlife Conservation
Commission
l) Your local city or county government
Q11. Next, I’m going to read a list of statements. I want you to tell me how much you agree or disagree with each
statement. Use the scale Strongly agree, Agree, Neither Agree nor Disagree, Disagree, or Strongly Disagree after I
finish each statement. If you don’t know, simply say so. [RANDOMIZE]
1) Strongly Agree
2) Agree
3) Neither Agree nor
Disagree
4) Disagree
5) Strongly Disagree
a) The health of springs in your area is important to you.
b) Too much water from the aquifer is being pumped out of the ground for various uses.
c) It is important that your tax dollars be used to improve the health of the springs in your area.
d) The Southwest Florida Water Management District is the leader in taking the right actions to improve
the health of the springs in your area.
e) The Southwest Florida Water Management District has the scientific knowledge necessary to improve
the health of the springs in your area.
f) The Southwest Florida Water Management District is committed to improving the health of the
springs in your area.
g) Too much money is spent on restoring springs in your county.
h) The Southwest Florida Water Management District scientists have the expertise to maintain the
springs in our area.
i) The Southwest Florida Water Management District cares about the health of the springs in my area. -
New addition in post test
j) Springs closures in my area affected me personally. – Being asked to all counties in post test
k) Springs closures in my area put a damper on my recreation plans. – Being asked to all counties in post
test
Testing emotional connections/Springs Usefulness
l) Visiting springs was an important part of my childhood.
m) I have many good memories about visiting the springs in my area.
n) A day at the springs is a day well spent.
o) The springs in my area are overrated.
p) Going to the springs in my area is more fun than going to the beach.
q) When describing where I live, I am likely to mention the springs in my area.
r) Visiting the springs in my area is a source of relaxation.
Q12. Are you aware of any springs restoration or improvement projects happening in your area?
1. Yes
2. No [GO TO Q14]

Page 107 of 108
3. Don’t know - DO NOT READ [GO TO Q14]
Q13. Where is the springs project taking place? [DO NOT READ]
1. Weeki Wachee Springs
2. Chassahowitzka Springs
3. Crystal River/Kings Bay
4. Rainbow Springs
5. Homosassa Springs
6. Three Sisters Springs
7. Hunter Spring
8. Silver Springs
9. Other [RECORD]
10. Don’t know or don’t recall [DO NOT READ]
Q14. Before today’s survey, had you ever heard of the Southwest Florida Water Management District, sometimes
called Swiftmud?
1. Yes
2. No [GO TO Q16]
3. Don’t know - DO NOT READ [GO TO Q16]
Q15. Using a scale of Excellent, Good, OK, Poor and Terrible, how would you rate the Southwest Florida Water
Management District's performance in:
1. Excellent
2. Good
3. OK
4. Poor
5. Terrible
6. Don't know
a) Protecting springs in your area
b) Educating people about the condition of the springs
c) Educating people about what they can do to help protect the springs
d) Ensuring that not too much water is drawn out of the ground for various uses
e) Listening to community input that may benefit the springs in your area
Q16. I’m going to list some websites. Please tell me if you have visited each website in the past six months.
[RANDOMIZE]
1. Yes
2. No
3. Never heard of them
4. Don’t remember – [DO NOT READ]
a) VisitFlorida.com
b) WaterMatters.org
c) Facebook.com
d) Twitter.com
e) Youtube.com
f) Weather.com
g) SaveTheManatee.org
h) TampaBay.com
i) ChronicleOnline.com
j) FloridaSprings.org
Q17. About how far from a water body (river, lake, stream, springs) do you live?
[READ IF NECESSARY]
1. Next to one
2. Within a half mile
3. Within a mile

“My Home. My Springs.” Post Test Results Page 108
4. 1 to 2 miles
5. 3 to 5 miles
6. More than 5 miles
7. Don't know - DO NOT READ
Q18. Are you a member in a community or environmental organization? - New addition in post test
1. Yes [GO TO Q20]
2. No
3. Refused
Q19. What is the name of the organization? - New addition in post test
a) Florida Springs Institute
b) One Rake at a Time
c) Homosassa River Restoration
d) Friends of the Rainbow River/Rainbow River
Conservation
e) Save Crystal River
f) “Save the Manatee” Organization
g) Rotary International
h) Boy/Girl Scouts
i) Other [RECORD]
j) I don’t know
Q20. Which category best fits your age?
1. Under 35
2. 35 to 64
3. 65 or older
4. Refused [DO NOT READ]
Q21. Do you live full-time or part-time in Florida?
1. Full-time
2. Part-time
3. Don't know – [DO NOT READ]
Q22. Which of the following best represents your total household income in 2016 from all sources?
1. Less than $25,000
2. $25,000 to $49,999
3. $50,000 to $74,999
4. $75,000 to $99,999
5. More than $100,000
6. Refused – [DO NOT READ]
That concludes our survey. Thank you very much for your time and opinions!
Q23. Was the respondent male or female?
1. Male
2. Female
3. Indeterminate