mycotoxins and poultry health - college of agriculture and ... · mycotoxins and poultry health...
TRANSCRIPT

Mycotoxins and Poultry Health Natacha S. Hogan
Department of Animal and Poultry Science, University of Saskatchewan, Saskatoon, SK Toxicology Centre, University of Saskatchewan, Saskatoon, SK

Outline
• Fusarium Mycotoxins and Poultry Health
• Post-harvest Strategies for Mycotoxins • Sorting • Binding/bio-protection/detoxification
• Current Research • Broiler feeding trials • In ovo studies

Fusarium
• Fusarium head blight – disease caused by infection with Fusarium fungal species
• bleached heads and shriveled chalky/pinkish kernels (FDK = Fusarium damaged kernels)
• F. graminearum most common in western Canada in wheat
• Decreases grade, yield, safety, security and economical value
https://www.grainscanada.gc.ca/wheat-ble/factor-facteur/fusdmg-eng.htm

Occurance of mycotoxins in North America
• Ochratoxin 20%
• Fumonisin 48%
• Deoxynivalenol 68%
• Zearalenone 37%
• Aflatoxin 19%
Proportion of positive samples in percentage (2013)

Mycotoxins Relevant to Poultry Nutrition
Mycotoxin Specific Toxins General Effects
Aflatoxin (AF) Aflatoxin B1 Reduced feed efficiency, egg
production, immune suppression,
liver lesions

Mycotoxins Relevant to Poultry Nutrition
Mycotoxin Specific Toxins General Effects
Aflatoxin (AF) Aflatoxin B1 Reduced feed efficiency, egg
production, immune suppression,
liver lesions
Ochratoxins (OTA) Ochratoxin A Poor feathering, reduced growth
and egg production, kidney toxicity

Mycotoxins Relevant to Poultry Nutrition
Mycotoxin Specific Toxins General Effects
Aflatoxin (AF) Aflatoxin B1 Reduced feed efficiency, egg
production, immune suppression,
liver lesions
Ochratoxins (OTA) Ochratoxin A Poor feathering, reduced growth
and egg production, kidney toxicity
Fumonisins (FUM) Fumonisin B1 Decreased BW gain and feed
intake, liver pathology (poultry
relatively resistant)
Trichothecenes T2, Zearalenone,
Nivalenol
Deoxynivalenol (DON)
Oral lesions, decreased egg
production and shell quality, growth
depression, immune suppression
Reduced feed intake, growth
suppression, immune suppression,
gut barrier

In 2013 = 59% positive for DON (approx 4000 tests)
Murugesan et al. 2015 Poultry Science 00:1-18

In 2013 = 60% positive for DON (approx 1300 tests)
Murugesan et al. 2015 Poultry Science 00:1-18

Legislated Max Tolerance Levels for Poultry
Mycotoxin Commodity Level Country
DON Diets for Poultry 5 ppm (mg/kg) CAN
Grains destined for Poultry
Diets
10 ppm USA
HT-2 Diets for Poultry 0.1 ppm CAN
AF Animal Feeding Stuffs 20 ppb CAN/US
RECOMMENDED TOLERANCE LEVELS
T-2 Diets for Poultry >1 ppm
ZEA Diets for Poultry None
OTA Diets for Poultry >2 ppm
FUM Total ration for breeding stock
Total ration for slaughter
15 ppm
50 ppm
Ergot Chicks 6-9 ppm http://www.inspection.gc.ca/animals/feeds/regulatory-guidance/rg-8/eng/
Mycotoxins and Poultry Health

Poultry Performance
• Modern broiler chickens are selected for superior growth performance and require high quality diets to reach genetic potential (Schmidt et al., 2009; Zuidhof et al., 2014; Collins et al., 2014)


Devegowda, G., T. N. K. Murthy, and Duarte E. Diaz. "Mycotoxins: their effects in poultry and some practical solutions." The mycotoxin blue book (2005): 25-56.
“Under practical conditions, no poultry feed is completely free of mycotoxins”
“The adverse effects of mycotoxins on poultry are many fold indicating a clear and persistent danger”
“Additionally, no feed can be expected to contain only one mycotoxin”

Impact of mycotoxins • Direct health challenges
• Reduced immune response (vaccinations) • Toxicity • Skeletal health
• Reduced feed intake
• Reduced nutrient absorption/Excretion of lipids • MALABSORPTION SYNDROME • Residues in meat / Eggs
• Condemnations / Downgrading • Bruising • Loss of salable product (i.e.: liver, gizzard erosion)
• Reproduction (loss in fertility & hatchability)

Lesions of the beak
Lesions in the mouth
Photos: http://www.knowmycotoxins.com/index.htm
Growth and performance
Gizzard lesions
Pale liver

Meta-analytical analysis (Andretta et al., 2011)
98 papers (1980-2009): • >1400 diets • >37,000 birds
Three criteria: • Intoxication with mycotoxins • Commercial broilers • Measured performance and/or organ weights
Variables: • Exposure period, mycotoxin type and conc, age, BW, sex • Data 1401 rows x 189 columns

Meta-analytical analysis (Andretta et al., 2011)
Younger birds more affected
If mycotoxins were present:
• Feed intake 12%
• Body weight 14% • Ochratoxins and aflatoxins
most severe
• Mortality • DON - 8.8 x greater • Aflatoxins - 2.8 x greater
• Organ weights • Liver 15%
• Kidneys 11% • Lungs 9% • Gizzard 3%

Post-harvest Strategies for Mycotoxins

Mitigation Strategies
• Pre-harvest control • Crop management (fungicides, fungistats) • Plant genetics • Biological control
• Post-harvest control • Sorting technology • Chemoprotection • Chemoprevention

Sorting Damaged Kernels
1. Physical separation by hand
2. Mechanical separation
3. Near Infrared Reflectance (NIR) Spectrometry
Measures reflected wavelengths (1200 – 2400nm) predict CP

Unsorted F1 F2 F3 F4 F5 F60
5
10
15
20
25
30
My
co
toxin
le
ve
l (p
pm
)
DON
IQ BoMill Fractions
Fraction 6 Fraction 1

Applicability in research
• Produce naturally contaminated diets with a range of mycotoxin concentrations from a single wheat source
21-28 d 28-35 d0
100
200
300
Control Ad lib
Low Ad lib
Medium Ad lib
High Ad lib
Daily
Feed Inta
ke (
g/d
ay)
21-28 d 28-35 d0
50
100
150
Control Ad lib
Low Ad lib
Medium Ad lib
High Ad lib
Avera
ge D
aily
Weig
ht G
ain
(A
DG
, g/d
ay)

Current Research

1. Identify factors that influence susceptibility of poultry to adverse effects of mycotoxins
2. Develop sensitive methods for evaluating (biomarkers) exposure and toxicity in poultry
3. Test novel strategies for reducing exposure, bioavailability and toxicity of mycotoxins in production animals

Identify the critical period(s) of sensitivity to the effects of feed-borne Fusarium mycotoxins on growth performance and gut morphology in broiler chickens
Starter Diet Grower Diet
Treatment 1-14 d 15-21 d 22-34 d
Control Control Control Control
DON 1 -14 d DON Control Control
DON 15 -21 d Control DON Control
DON 22-34 d Control Control DON
DON 1-34 d DON DON DON
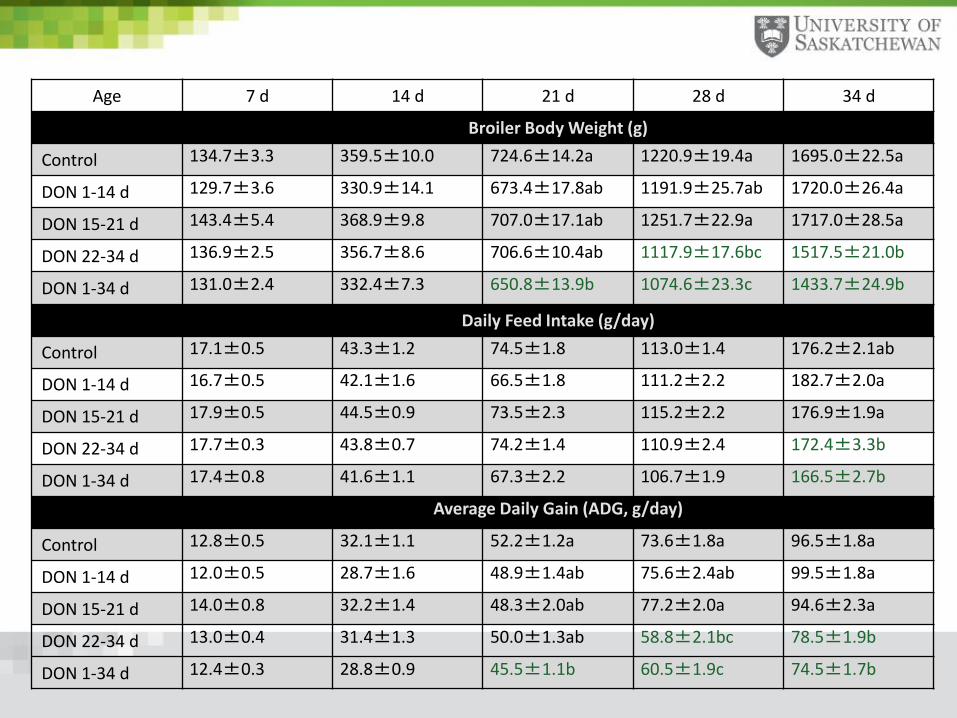
Age 7 d 14 d 21 d 28 d 34 d
Broiler Body Weight (g)
Control 134.7±3.3 359.5±10.0 724.6±14.2a 1220.9±19.4a 1695.0±22.5a
DON 1-14 d 129.7±3.6 330.9±14.1 673.4±17.8ab 1191.9±25.7ab 1720.0±26.4a
DON 15-21 d 143.4±5.4 368.9±9.8 707.0±17.1ab 1251.7±22.9a 1717.0±28.5a
DON 22-34 d 136.9±2.5 356.7±8.6 706.6±10.4ab 1117.9±17.6bc 1517.5±21.0b
DON 1-34 d 131.0±2.4 332.4±7.3 650.8±13.9b 1074.6±23.3c 1433.7±24.9b
Daily Feed Intake (g/day)
Control 17.1±0.5 43.3±1.2 74.5±1.8 113.0±1.4 176.2±2.1ab
DON 1-14 d 16.7±0.5 42.1±1.6 66.5±1.8 111.2±2.2 182.7±2.0a
DON 15-21 d 17.9±0.5 44.5±0.9 73.5±2.3 115.2±2.2 176.9±1.9a
DON 22-34 d 17.7±0.3 43.8±0.7 74.2±1.4 110.9±2.4 172.4±3.3b
DON 1-34 d 17.4±0.8 41.6±1.1 67.3±2.2 106.7±1.9 166.5±2.7b
Average Daily Gain (ADG, g/day)
Control 12.8±0.5 32.1±1.1 52.2±1.2a 73.6±1.8a 96.5±1.8a
DON 1-14 d 12.0±0.5 28.7±1.6 48.9±1.4ab 75.6±2.4ab 99.5±1.8a
DON 15-21 d 14.0±0.8 32.2±1.4 48.3±2.0ab 77.2±2.0a 94.6±2.3a
DON 22-34 d 13.0±0.4 31.4±1.3 50.0±1.3ab 58.8±2.1bc 78.5±1.9b
DON 1-34 d 12.4±0.3 28.8±0.9 45.5±1.1b 60.5±1.9c 74.5±1.7b

a
b

• Broilers are more sensitive to moderate levels (~ 6 ppm) dietary DON during 21 – 35 d as indicated by reduction of feed intake, ADG and body weight
• Growth suppression effects of dietary DON is caused by reduction of feed intake and reduced feed efficiency
• The reduction of feed efficiency may be caused by alteration of small intestine histology structures

Broiler Feed Preference of Different Levels of Fusarium Mycotoxins Contaminated Diets
• Control (0.085 ppm DON) vs. Low (2.27 ppm DON) vs. High (5.84 ppm DON)
• Feeders were divided into two equal size sections
• Experiment diet was provided in each section
• Feed intake of each diet was measured on 28d
Section 1 Section 2
Control Low DON
Control High DON
Low DON High DON

0 50 100 150
Control vs. Low
Control vs. High
Low vs. High
Control Low mycotoxins High mycotoxins
Average daily feed intake (g/d)0 50 100 150
Control vs. Low
Control vs. High
Low vs. High
Control Low mycotoxins High mycotoxins
Average daily feed intake (g/d)0 50 100 150
Control vs. Low
Control vs. High
Low vs. High
Control Low mycotoxins High mycotoxins
Average daily feed intake (g/d)0 50 100 150
Control vs. Low
Control vs. High
Low vs. High
Control Low mycotoxins High mycotoxins
Average daily feed intake (g/d)
0 50 100 150
Control vs. Low
Control vs. High
Low vs. High
Control Low mycotoxins High mycotoxins
Average daily feed intake (g/d)
Broilers preferred the control diet over low and high mycotoxins diet.
There was no preference indicated for the low vs high mycotoxin diets
Effects of feed-borne Fusarium mycotoxins (primarily
DON) on broiler feed preference during 22-28 d

Control Low High0.0
0.2
0.4
0.6
0.8
1.0
1.2
1.4
1.6
1.8
2.0
2.2
Treatment
Fe
ed
to
ga
in r
atio
(F
:G)
Effects of feed-borne Fusarium mycotoxins (primarily
DON) on broiler feed efficiency during 22-28

Acknowledgements
• Anhao Wang
• Michael Kautzman
• Emilie Viczko
• Dr. Tom Scott
• U of S Poultry Research Centre
• Prairie Diagnostic Services, Saskatoon, SK
• Flaman Grain Handling & Cleaning, Saskatoon, SK
