myeloma: are we on the brink of a cure? · myeloma: are we on the brink of a cure? jeffrey wolf, md...
TRANSCRIPT

Myeloma: Are We on the Brink
of a Cure?
Jeffrey Wolf, MD
Director, Myeloma Program
University of California,
San Francisco

Kumar S. Blood 2008;111: 2516 – 2520; Kumar S. Leukemia (2014) 28, 1122–1128.
Survival in MyelomaIFM –DFCI; 2015
2011-14
1961-70
2001-10
1991-2000

Multiple Myeloma (MM) Approximately 30,330 new cases in 2016. 95,874 currently with MM
Accounts for 1% of all malignancies and about 10% of hematological cancers
Accounts for 2% of deaths from all cancers and 20% of deaths from hematological cancers
Slightly more common in men than women Incidence in African Americans is about twice that of
whites Median age at diagnosis is 66 years
Age <50 years: 10% Age <40 years: 2%
American Cancer Society. Cancer Facts and Figures 2007. Atlanta, GA: American Cancer Society; 2007; Kufe. Cancer Medicine. 6th ed. 2003:2219; Clinical and laboratory manifestations of MM. UpToDate Web site. Available at: http://www.utdol.com/utd/content/topic.do?topicKey=plasma/2083&type=A&selectedTitle=2~80. Accessed January 2, 2007.

Myeloma MM is characterized by:
Excessive numbers of abnormal plasma cells in the bone marrow
Overproduction of intact monoclonal immunoglobulins (IgG, IgA, IgD) or free antibody light chains
concomitant drop in other immunoglobulins
CRAB Criteria
HyperCalcemia
Renal
Anemia
Bone Lesions
Kufe. Cancer Medicine. 6th ed. 2003:2219.
Reproduced with permission from the Multiple Myeloma
Research Foundation Web site. Available at:
http://www.multiplemyeloma.org/about_myeloma/index.html

Kyle R et al. N Engl J Med 2007;356:2582-2590
Characteristics of Active Multiple Myeloma and Its Precursors
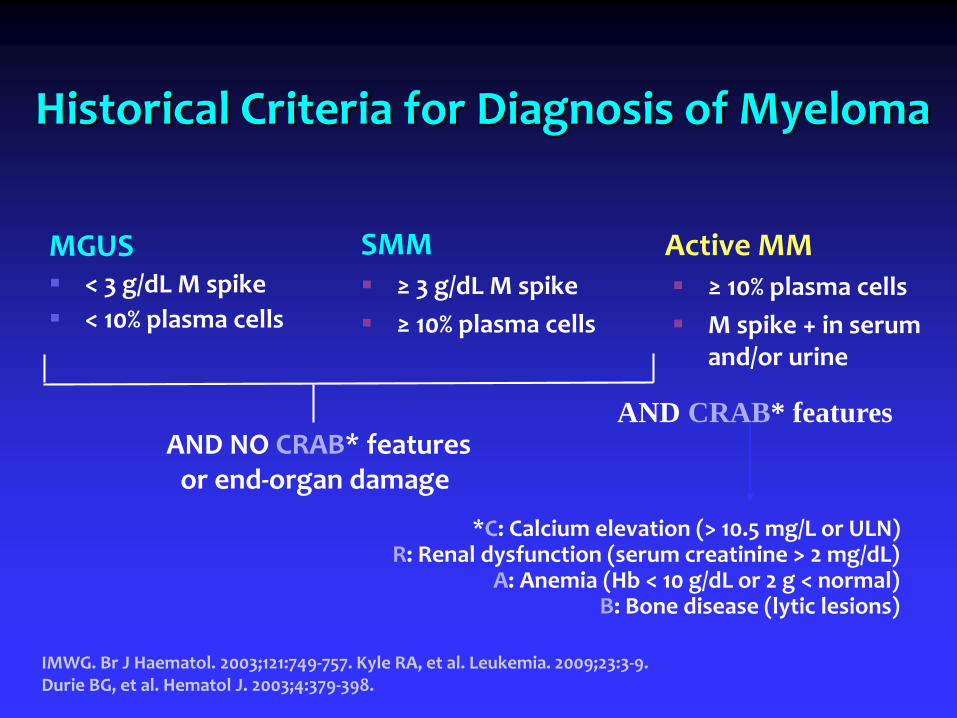
Historical Criteria for Diagnosis of Myeloma
MGUS < 3 g/dL M spike
< 10% plasma cells
SMM ≥ 3 g/dL M spike
≥ 10% plasma cells
Active MM ≥ 10% plasma cells
M spike + in serum and/or urine
IMWG. Br J Haematol. 2003;121:749-757. Kyle RA, et al. Leukemia. 2009;23:3-9. Durie BG, et al. Hematol J. 2003;4:379-398.
*C: Calcium elevation (> 10.5 mg/L or ULN)R: Renal dysfunction (serum creatinine > 2 mg/dL)
A: Anemia (Hb < 10 g/dL or 2 g < normal)B: Bone disease (lytic lesions)
AND NO CRAB* featuresor end-organ damage
AND CRAB* features
100
80
60
40
20
0
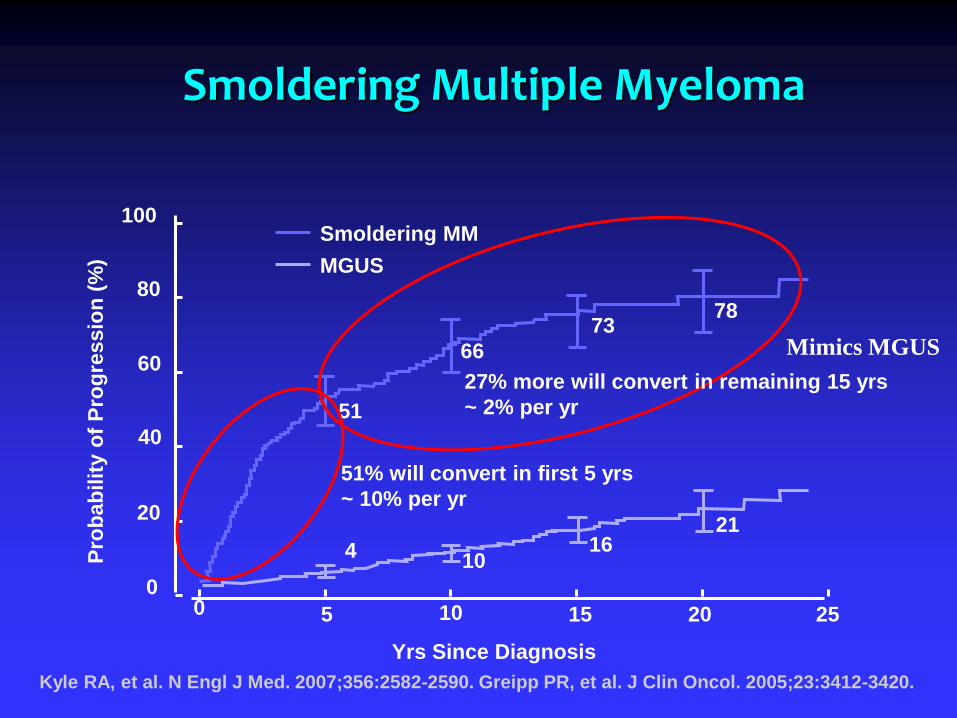
51% will convert in first 5 yrs
~ 10% per yr
0 5 10 15 20 25
Pro
bab
ilit
y o
f P
rog
ress
ion
(%
)
51
66
7378
410
1621
MGUS
Smoldering MM
Smoldering Multiple Myeloma
Kyle RA, et al. N Engl J Med. 2007;356:2582-2590. Greipp PR, et al. J Clin Oncol. 2005;23:3412-3420.
Yrs Since Diagnosis
27% more will convert in remaining 15 yrs
~ 2% per yr
Mimics MGUS

HR: 13.7; P < .001
Biomarkers to Predict Risk of Progression
FLC ratio ≥ 100 predicts risk (P < .0001)
Clonal plasma cells in BM predicts risk (P < .001)
Larsen JT, et al. Leukemia. 2013;27:941-946. Kastritis E, et al. Leukemia. 2013;27:947-953.
FLC ratio ≥ 100FLC ratio < 100Median TTP:
15 mos Median TTP:55 mos
1.0
0.8
0.6
0.4
0.2
0
0 20 40 60 80 100 120
Mos to Progression
BM plasma cells < 60%
BM plasma cells ≥ 60%
% P
rog
ress
ion
to
S
ymp
tom
atic
Mye
lom
a
% P
rog
ress
ion
to
MM
Mos to Progression
720 6 12 18 24 30 36 42 48 54 60 66
1.0
0.8
0.6
0.4
0.2
0
Pre-existing MGUS(Monoclonal Gammopathy of Undetermined Significance)

PLCO StudyLandgren, et.al.
100% of patients with samples 2 years prior had MGUS
82.4% with samples 8 years prior had MGUS
97.1% of all patients had MGUS from 2 to 8 or more years prior

Walter Reed StudyWeiss et.al.
Samples available for 30/90
Median number of samples available 3.5 (1-14)
PPCD detected in 27/30
+SPEP and/or IFE 21
+ sFLC 6
First detected
sFLC alone 6
IFE alone 1
SPEP + IFE 5
IFE + sFLC 1
All three 14

Imaging

Pretreatment After 4 Cycles
Plasmacytomas
Bortezomib +/- Dex:Confirmation of Remission: PET Scan
Jagannath et al. ASH 2004; Abstract 333
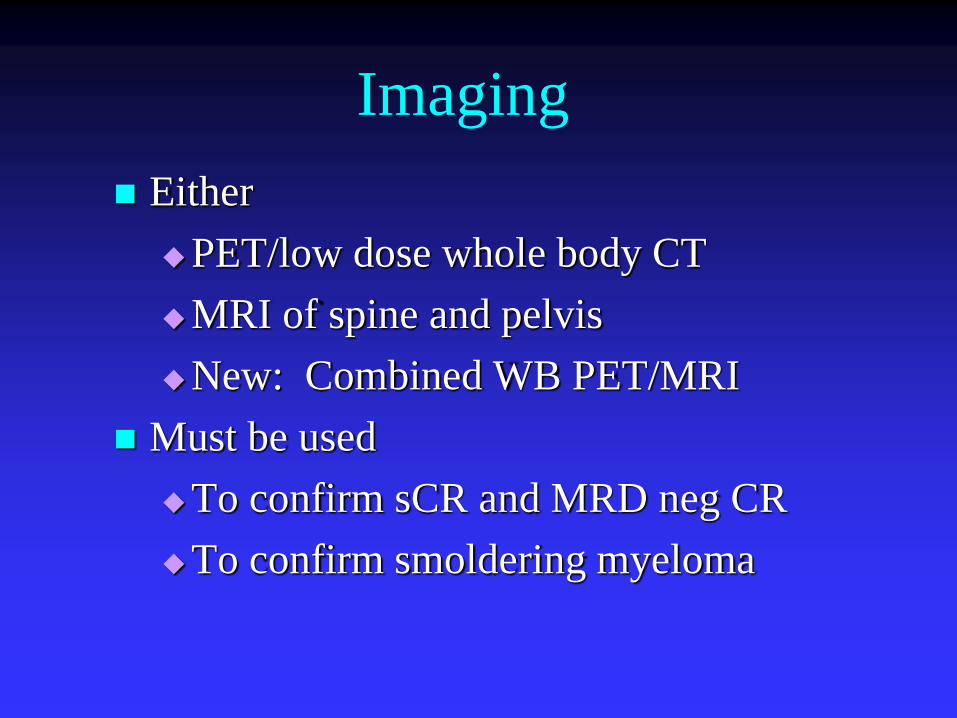
Imaging
Either
PET/low dose whole body CT
MRI of spine and pelvis
New: Combined WB PET/MRI
Must be used
To confirm sCR and MRD neg CR
To confirm smoldering myeloma

Measurement of the Disease
Measurement of protein
Immunoelectropheresis (IEP) or
Immunofixation (IF or IFE)
Serum Protein Electropheresis (SPEP) with M-spike (M-protein)
Quantitative immunoglobulins (IgG. IgA. IgD, IgM)
Free light chain analysis replacing urine studies, including Bence-Jones and 24 hour total protein
MRD – Flow or NGS

Measurements of Response IMWG Criteria
SD = <25% reduction
MR = 25% - 49% reduction
PR = 50 % or greater reduction
VGPR = 90% reduction in protein spike (includes nCR)
nCR = pos IEP
CR = neg IEP
sCR = nml free lite and absence of clonal cells in BM
MRD neg CR

The Iceberg

Evidence that CR Matters
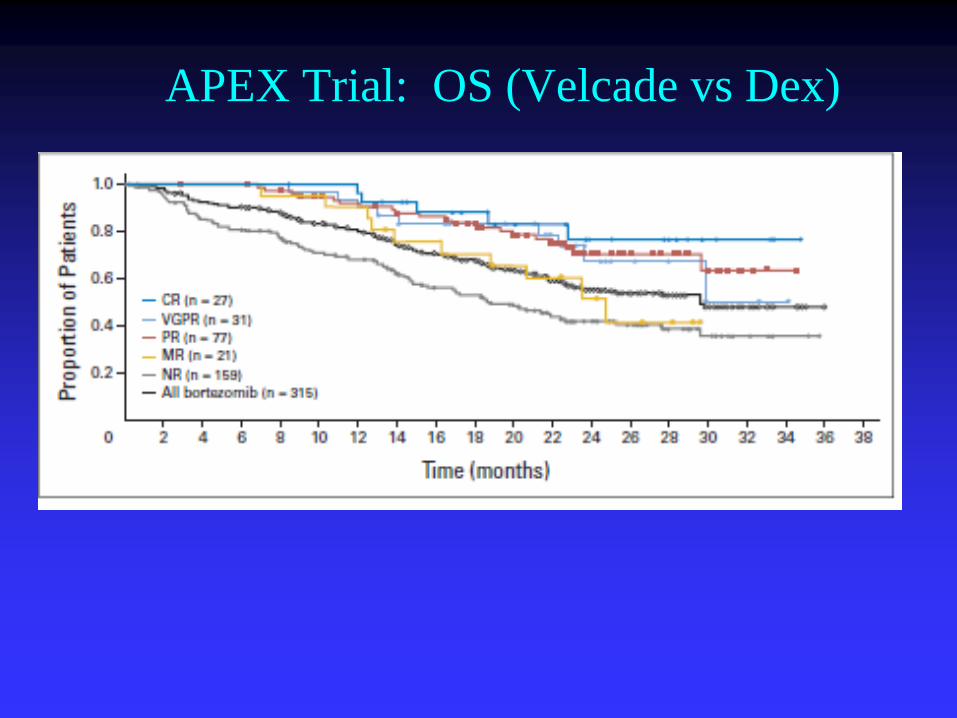
APEX Trial: OS (Velcade vs Dex)

CR vs nCR / VGPR / PR vs Less
Martinez-Lopez J, et al. Blood. 2011;118:529-534.
PFS
P = 0.00001
1.0
0.9
0.8
0.7
0.6
0.5
0.4
0.3
0.1
0.2
0.0
0.9
0.8
0.7
0.6
0.5
0.4
0.3
0.1
0.2
0.0
0 05 510 1015 1520 years 20 years
CR (n=63) nCR (n = 66) + VGPR (n = 54) + PR (n = 114) SD (n = 12) + PD (n = 14)
Prognostic effect of CR patients vs those in nCR or VGPR or PR vs patients with SD or PD after HDT/ASCT
OS
P = 0.00001
1.0
Minimal Residual Disease (MRD)
Flow
Next Generation Sequencing

Measurement of MRD
Black Swan (Spanish) Flow
8-12 color
Characteristics
105
No need for ID specimen
Must do it on fresh specimen
Clonoseq (Adaptive) NGS
Characteristics
106
Requires ID specimen
8 % failure to identify clone
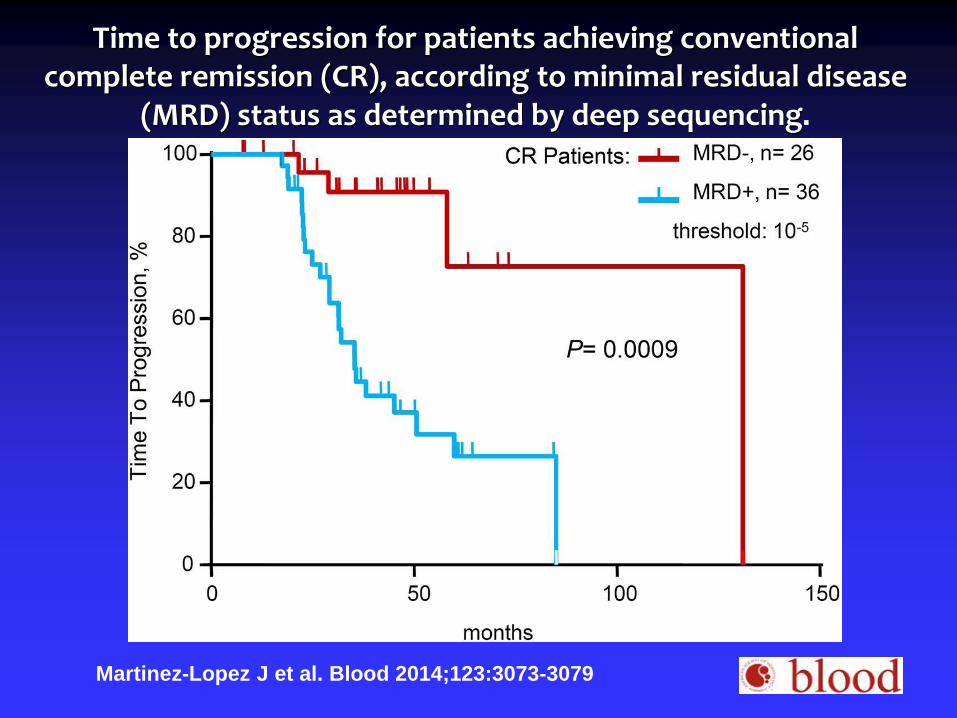
Time to progression for patients achieving conventional complete remission (CR), according to minimal residual disease
(MRD) status as determined by deep sequencing.
Martinez-Lopez J et al. Blood 2014;123:3073-3079

IFMDFCI 2009 MRD

Why are we Failing to Obtain
Long Periods of Disease Control
in 25% of Patients?

Evolution of Myeloma Therapy

39 y.o. female with months of severe back pain, right leg pain, and lower extremity weakness. Subsequently she
developed clavicular fractures and spine and lower extremity deformities.
Admitted to her local hospital, April 15, 1844
Solly, Med Chirur Trans London 1844
Patient Case:
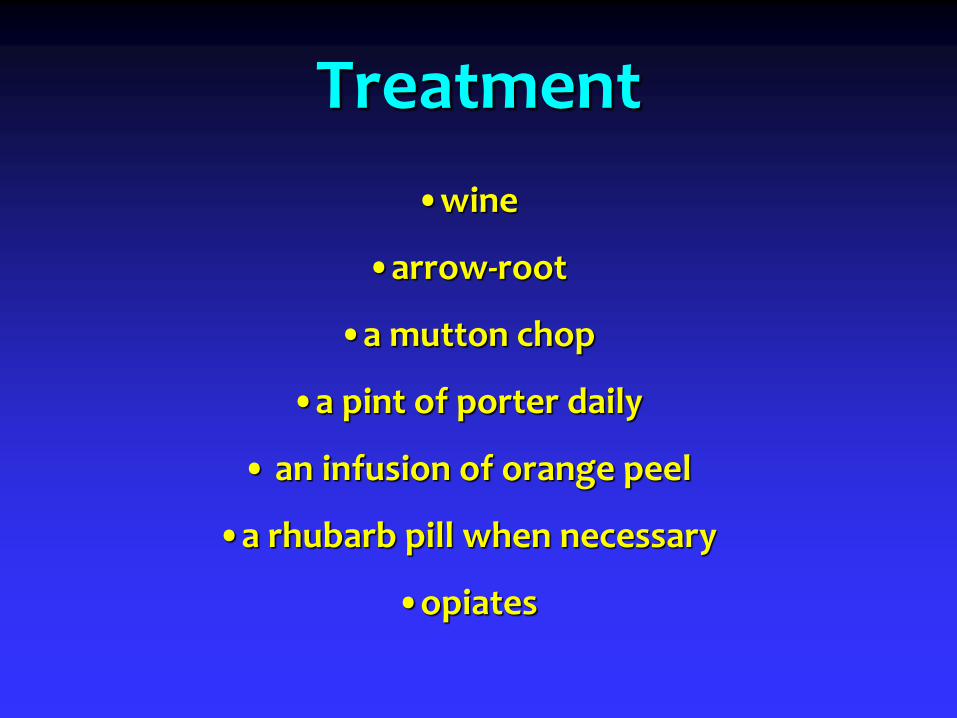
Treatment
•wine
•arrow-root
•a mutton chop
•a pint of porter daily
• an infusion of orange peel
•a rhubarb pill when necessary
•opiates

Conclusion
“earthy matter of the bone is absorbed and thrown out by the kidneys”

CP1143748-23
Myeloma Therapy (1961-1970)

Myeloma Therapy (1971-1990)
Steroids
Alkylators
Cyclophosphamide (Cytoxan)
Melphalan (low dose)
OS = 2 years

Myeloma Therapy (1991-2000)
VAD (Vincristine, adriamycin, decadron)
Autologous PSC-T(peripheral stem cell transplant) (use of high dose melphalan)
+/- Allogeneic PSC-T
+/- Interferon
OS = 3-4 years for good risk, lower stages
= 2 years for everyone else

Myeloma Therapy (2001-2010)
Thalidomide
Bortezomib (Velcade) (5/2003)
Lenalidomide (Revlimid) (12/27/05)
Pegylated liposomal doxorubicin (Doxil) (2007) ( (in combo with bortezomib)
Continued auto PSC-T
Began combinations with new agents and old
RVd
CyBorD
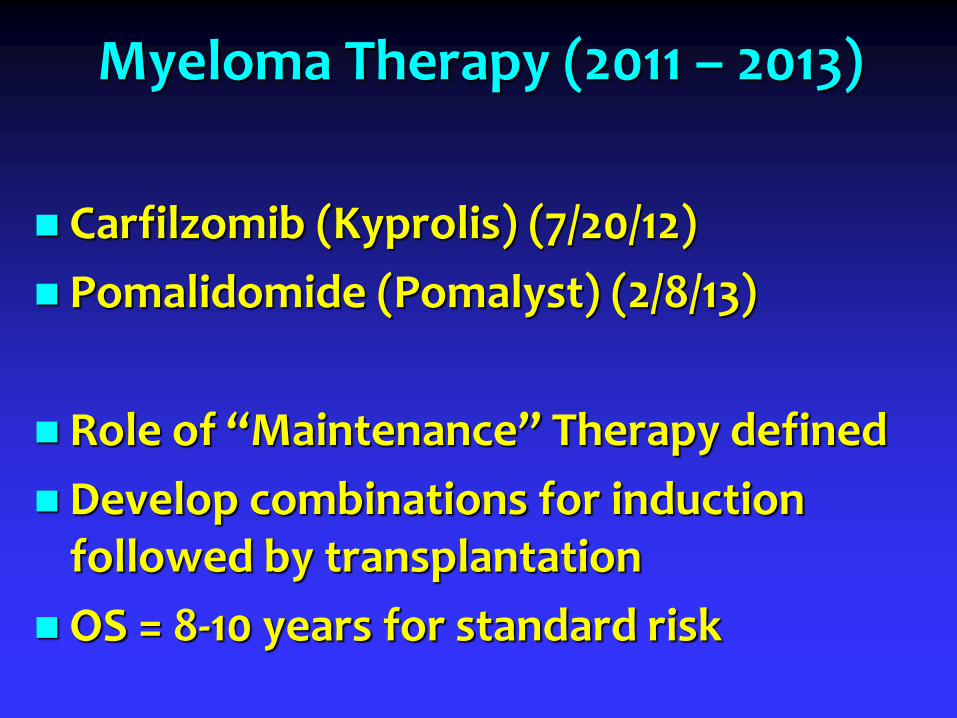
Myeloma Therapy (2011 – 2013)
Carfilzomib (Kyprolis) (7/20/12)
Pomalidomide (Pomalyst) (2/8/13)
Role of “Maintenance” Therapy defined
Develop combinations for induction followed by transplantation
OS = 8-10 years for standard risk
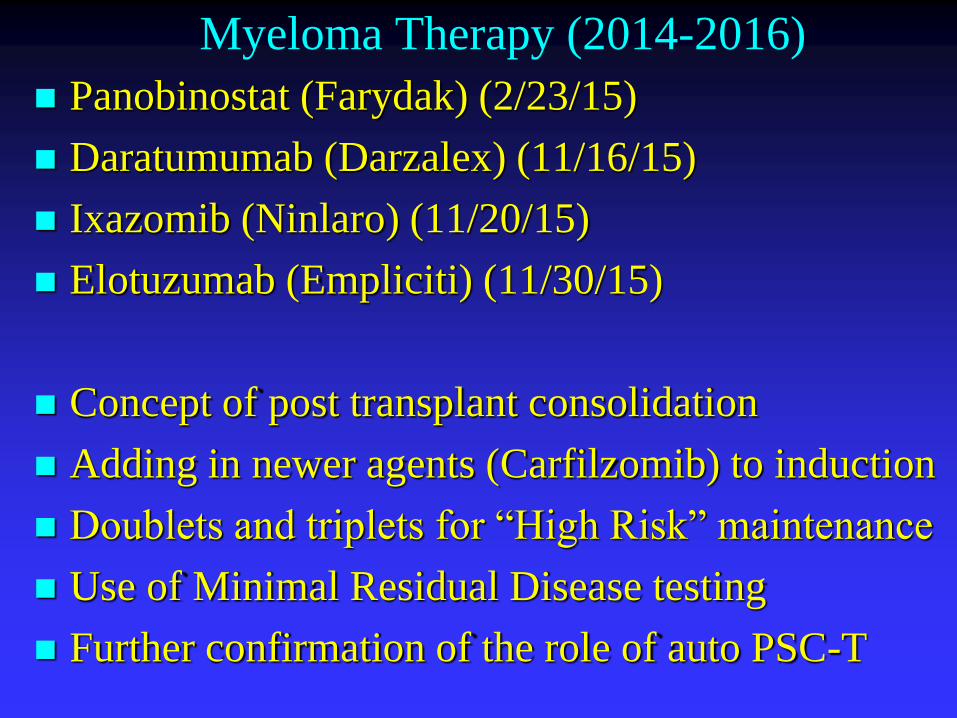
Myeloma Therapy (2014-2016)
Panobinostat (Farydak) (2/23/15)
Daratumumab (Darzalex) (11/16/15)
Ixazomib (Ninlaro) (11/20/15)
Elotuzumab (Empliciti) (11/30/15)
Concept of post transplant consolidation
Adding in newer agents (Carfilzomib) to induction
Doublets and triplets for “High Risk” maintenance
Use of Minimal Residual Disease testing
Further confirmation of the role of auto PSC-T

Decisions at Diagnosis Does this patient need treatment at all? Smoldering?
Use of PET/CT
Studies of Revlimid and other agents in smoldering
Transplant candidate vs not (Melphalan issue)
Not necessarily still true
Nobody (except in Europe) uses frontline melphalan
There are combinations that work for both groups
We now have Plerixafor

Initial Induction Therapy for Patients Eligible for Transplant
NO MELPHALAN

Improving Response Rates with Combination Therapies

Carfilzomib (Kyprolis)

KRd (? Improvement over RVd?)Jakubowiak, 2015
Frontline Therapy for Patients Ineligible for Transplant
Melphalan OK

Improving Response Rates with Combination Therapies

Stem Cell Transplantation
There is still a role!!!

Len-Bz-Dex ×3
Len-Bz-Dex ×5
Len ×12m (IFM)
Len until relpase (US)
Stem collection
Len-Bz-Dex ×3
ASCT
Len ×12m (IFM)Len until relapse (US)
Stem collection
Len-Bz-Dex ×2
ASCT at relapse
NCI Clinical Trial Identifier NCT01191060.
The Debate…ASCT: Up-Front or at RelapseDFCI/IFM 2009 Trial

IFM/DFCI 2009
P<0.001
0
10
20
30
40
50
60
70
80
90
100
Pa
tient
s (%
)
350 296 228 128 24no HDT350 309 261 153 27HDT
N at risk
0 12 24 36 48
Months of follow-up
HDT
no HDT
Transplant improved PFS

Further Evidence for Role of
Auto ASCT

KRd (? Improvement over RVd?)Jakubowiak, 2015

KRd + ASCTZimmerman, 2016
Maintenance Therapy(continuation therapy)
CALGB 100104: A Phase III Randomized, Double-Blind
Study of LEN vs. PBO Maintenance Therapy Following ASCT for MM
McCarthy P., et al
McCarthy PL. N Engl J Med. 2012;366:1770-1781.

CALGB 100104: Study Design and Endpoints
Primary endpoint: TTP (time from ASCT to PD/death)
Secondary endpoints: OS, post-ASCT response, long-term LEN feasibility
* All patients received thromboprophylaxis; † LEN dose adjustments between 5-15 mg permitted.
ASCT: autologous stem cell transplant; β2-M: β2-microglobulin; CALGB: Cancer and Leukemia Group B; CR: complete response; LEN: lenalidomide; MEL200: melphalan 200 mg/m2; MR:
minimal response; OS: overall survival; PD: progressive disease; PR: partial response; R: randomization; SD: stable disease; THAL: thalidomide; TTP: time to progression; Tx: treatment.
McCarthy PL. N Engl J Med. 2012;366:1770-1781.
R 1:1CR, PR,
MR, SD Placebo
(n = 229)
MEL200
ASCT
N = 460
• ≤ 70 years of age
• ≤ 1 yr from start of Tx
• Stratified by β2-M and
THAL and LEN use
during induction
LEN
10 mg/day†
(n = 231)
Maintenance*Restaging(Within 100 days)

CALGB 100104: Time to Progression
ASCT: autologous stem cell transplant; CALGB: Cancer and Leukemia Group B; HR: hazard ratio; LEN: lenalidomide; N/A: not applicable; PBO: placebo; TTP: time to progression.
McCarthy PL. N Engl J Med. 2012;366:1770-1781.
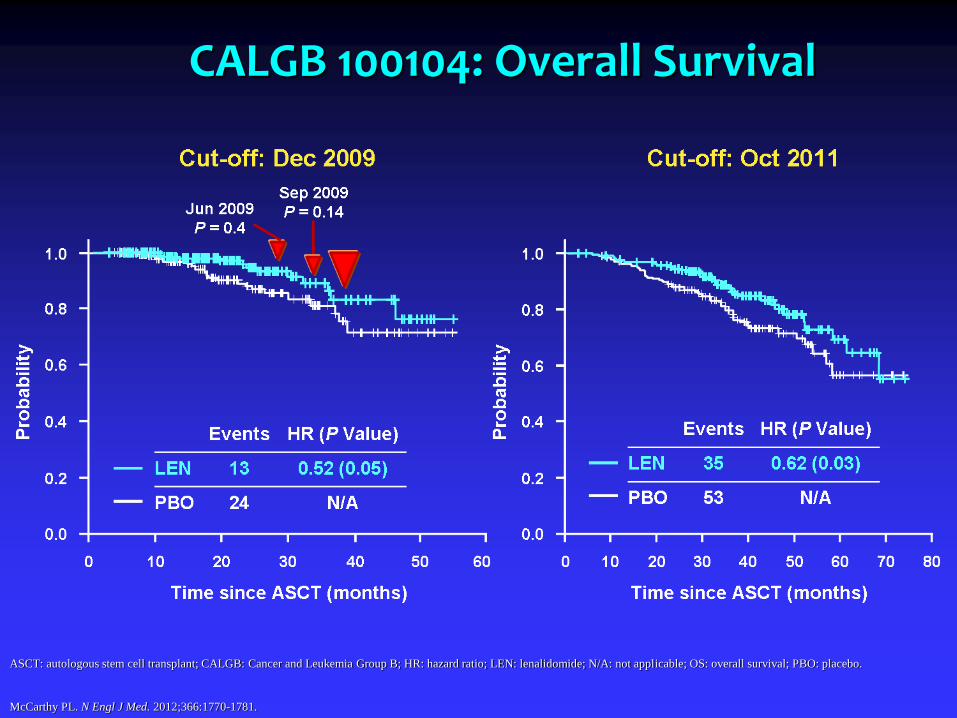
CALGB 100104: Overall Survival
ASCT: autologous stem cell transplant; CALGB: Cancer and Leukemia Group B; HR: hazard ratio; LEN: lenalidomide; N/A: not applicable; OS: overall survival; PBO: placebo.
McCarthy PL. N Engl J Med. 2012;366:1770-1781.

New Drugs/New Studies
Ixazomib (Ninlaro)
Panobinostat (Farydak)
Elotuzumab (Impliciti)
Daratumumab (Darzalex)

Daratumumab
Anti CD 38

Castor: Vd vs Dara Vd
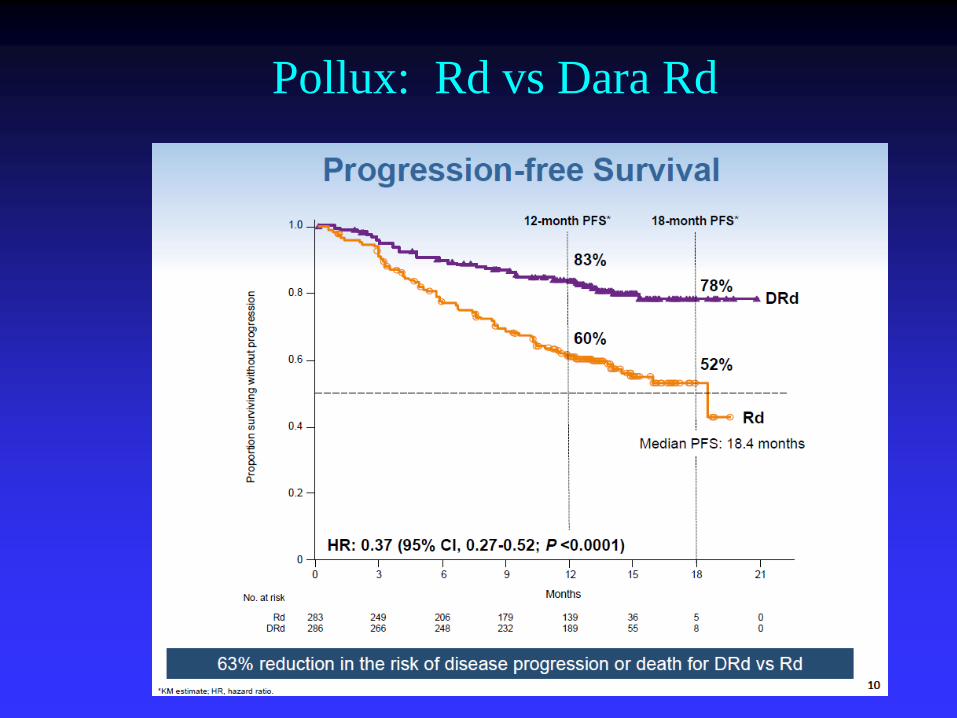
Pollux: Rd vs Dara Rd
Immunotherapies
Antibodies
Vaccines
Checkpoint Inhibitors
BiTEs
CAR-Ts

Vaccine approaches: DC fusion
Courtesy of David Avigan

BiTe Therapy
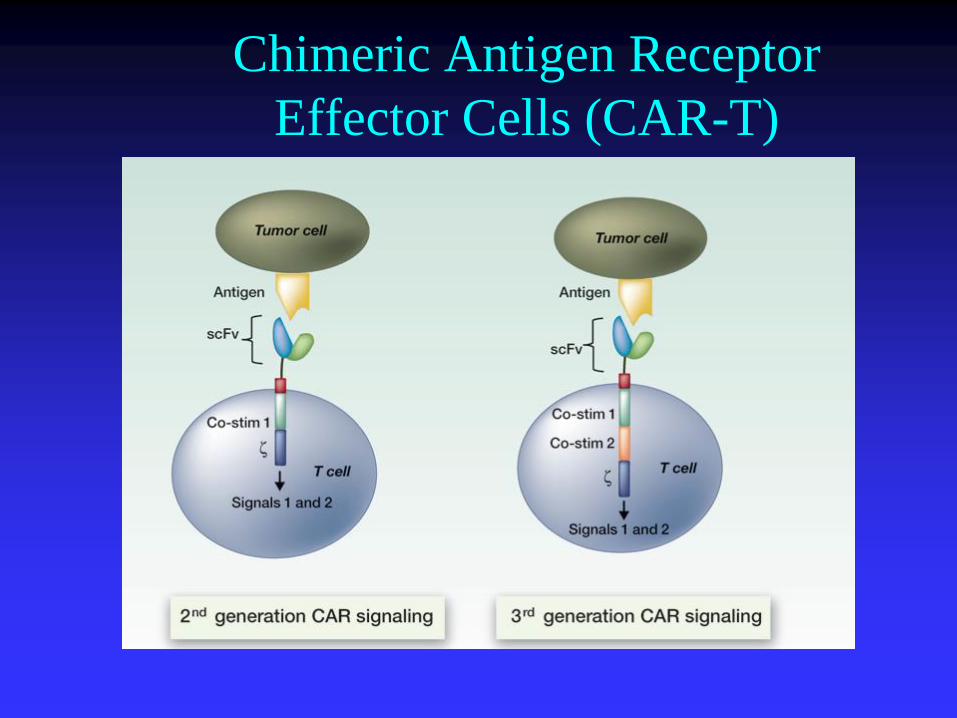
Chimeric Antigen Receptor
Effector Cells (CAR-T)
Treatment of High Risk Smoldering Myeloma
Is there a rationale for treating?

Kyle R et al. N Engl J Med 2007;356:2582-2590
Characteristics of Active Multiple Myeloma and Its Precursors

Free Light is Useful for Risk Assessment in SMM
Dispenzeri et al Blood 2008

Lenalidomide25 mg/daily during 21d every 28 d
Dexamethasone20 mg D1-D4 and D12-D15 every 28 d
Therapeutic abstentionInduction
Nine 4-week cycles
MaintenanceLenalidomide
10 mg/daily during 21 devery month*
Therapeutic abstention
Schedule of therapy (N = 126 pts)
Spanish Myeloma Group
Treatment arm(n = 60)
Control arm(n = 66)
* Low-dose Dex will be added at the moment of biological progression
Ammendment on August 2011: Stop treatment at 2 years of treatment
Matteos et al. ASH 2011

50454035302520151050
1.0
0.8
0.6
0.4
0.2
0.0
Len-Dex vs. No Treatment: TTP to Active Disease (N = 119)
ITT analysis
Median follow-up: 32 months (range 12–49)
Lenalidomide + dex
Median TTP: NR
9 Progressions (15%)
5 pts:early disc followed by DP
4 pts:symptomatic DP
No treatment
Median TTP: 23m
37 Progressions (59%)
20 patients: bone disease
7 patients: renal failure
HR: 6.0; 95% IC (2.9–12.6); p < 0.0001
Time from inclusion
Pro
po
rtio
n o
f p
ati
en
ts a
live
1009080706050403020100
1.0
0.8
0.6
0.4
0.2
0.0
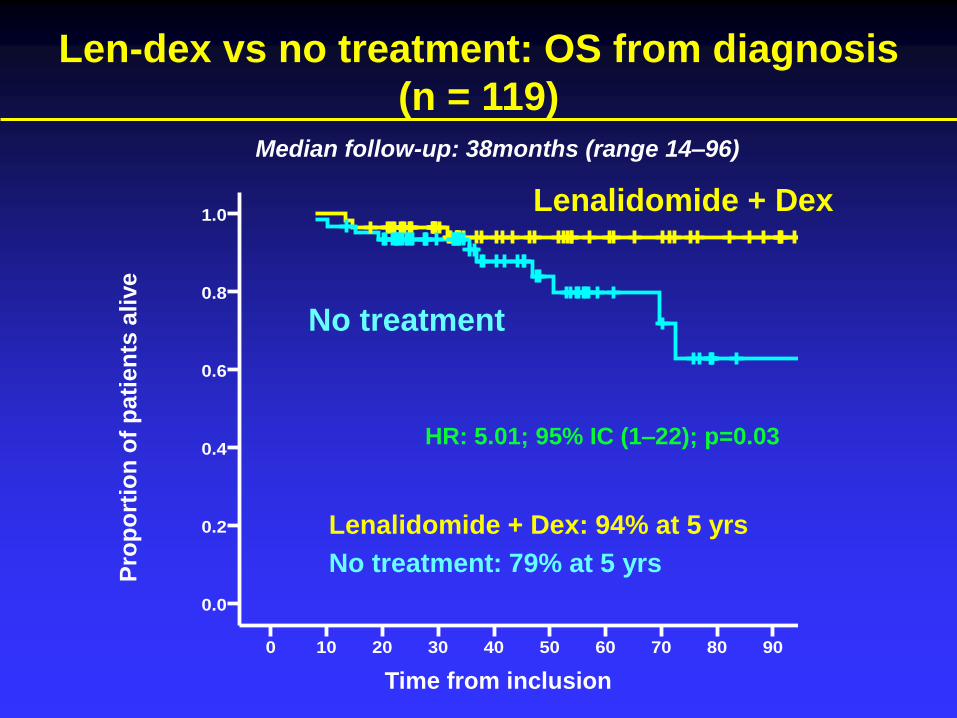
Len-dex vs no treatment: OS from diagnosis
(n = 119)
Lenalidomide + Dex
No treatment
Time from inclusion
Pro
po
rtio
n o
f p
ati
en
ts a
live
HR: 5.01; 95% IC (1–22); p=0.03
Lenalidomide + Dex: 94% at 5 yrs
No treatment: 79% at 5 yrs
Median follow-up: 38months (range 14–96)


Thank you