myer holdings limited abn 14 119 085 602 myer holdings
TRANSCRIPT

outside back cover 4.5 outside front cover
myer holdings limited ABn 14 119 085 602 AnnuAl report 2010
my
er ho
ldin
gs lim
ited A
nn
uA
l repo
rt 2010

outside back cover 4.5 outside front cover
About this Annual reportMyer Holdings Limited’s Annual Report contains detailed financial information. A summary of the Company’s performance is contained in Myer’s Annual Review (pictured above) which is available in hard copy by contacting our share registry or can be viewed online at www.myer.com.au in the Investors section.
Annual general meetingThe Annual General Meeting for Myer Holdings Limited will be held at the Melbourne Convention and Exhibition Centre, Plenary 1, 1 Convention Centre Place, South Wharf, Victoria 3006 on Friday 12 November 2010, at 12 noon.
myer holdings limited ABn 14 119 085 602
myer holdings limited ABn 14 119 085 602 AnnuAl report 2010
myer holdings limitedABn 14 119 085 602 AnnuAl review 2010
shAreholder informAtion
Corporate directory
directorsH McDonald (Chairman) B Brookes (CEO) A Brennan T Flood P Hay R Myer
general Counsel and Company secretaryM Rodwell
senior leadership teamFinance and AuditM Ashby
Strategic Planning and Human ResourcesG Travers
Buying OperationsP Winn
Store OperationsN Abboud
principal registered office in AustraliaLevel 7 800 Collins Street Docklands VIC 3008 Telephone: +61 3 8667 6000
share registryComputershare Investor Services Pty Limited GPO Box 2975 Melbourne VIC 3001Within Australia: 1300 820 260 Outside Australia: +61 3 9415 4332 www.investorcentre.com
investor relationsD Gunn Telephone: +61 3 8667 7879 Email: [email protected]
AuditorPricewaterhouseCoopers Level 19, Freshwater Place 2 Southbank Boulevard Southbank VIC 3006
stock exchange listingMyer Holdings Limited (MYR) shares are listed on the Australian Securities Exchange (ASX).
Websitewww.myer.com.au
2 81

1 Chairman’s letter 2 Corporate Governance Statement 8 Directors’ Report 15 Remuneration Report 27 Financial Report 77 Auditor’s report 80 Shareholder Information 81 Corporate directory
chairman’s letter contents
Welcome to the Myer Holdings Limited 2010 Annual Report. This report includes Myer’s Corporate Governance Statement and Directors’ Report (including the Remuneration Report), as well as the statutory accounts.
Please read the Annual Report together with the 2010 Annual Review, which provides a review of Myer’s operational performance. If you have not received Myer’s Annual Review, an interactive version is available at www.myer.com.au or you can request a copy to be posted to you by contacting Myer’s investor relations team. Please see the inside back cover for contact details.
Financial highlightsMyer delivered a record profit during the 2010 financial year, despite a challenging trading environment characterised by fragile consumer confidence on the back of successive interest rate rises, the higher cost of living and global economic uncertainty. These tough market conditions were compounded by the cycling of the significant Federal Government stimulus payments that were made during the 2009 financial year. Total sales for the Group were up 0.7% to $3,283.6 million1 (2009: $3,260.8 million).
Earnings before interest and tax (EBIT) were up 14.9% to $270.9 million,1 well ahead of the Prospectus forecast of $260.8 million. Net profit after tax (NPAT) was up 55.1% to $168.7 million1 (2009: $108.7 million), ahead of the Prospectus forecast of $159.7 million.
DividendsA fully franked final dividend of 11.5 cents per ordinary share (cps) will be paid on 4 November 2010. This brings the total dividend for 2010 to 22 cps, fully franked.
outlookAfter four years and over half a billion dollars of investment in supply chain, technology, brands and stores, we have built what we know to be a world-class operating platform that will give us real competitive advantage and will help sustain our growth into the future.
We are now on the cusp of a new phase, the growth phase, which will see us expand our store portfolio by 15 new stores over the next four years. The first of these opened at Top Ryde in New South Wales in August and the second is due to open at Robina in Queensland in October. The complete rebuild of our Melbourne flagship store is almost complete, with the majority of the store due to be open in time for Christmas, and the team is excited about offering Myer customers a truly international-class retail experience.
Inspiring our customers is at the heart of what we aspire to do. We offer customers a great range of brands, and a wide and meaningful choice, irrespective of their budgets. We are continuing to invest in the look, feel and overall standard of our stores and our customers have responded well to the fresh approach we’ve taken to visual merchandising. Speed and efficiency are critical for any retail business, and we are fortunate to have a fast, low-cost operating platform that enables us to respond to customer preferences quickly and get product into store fast. We continue to strive towards building a Myer team that is passionate, well motivated and incentivised towards delivering a higher level of service for our customers.
Regards
Howard McDonaldChairman
1 The 2010 financial year for the Company was a 53-week period for statutory reporting purposes (ended 31 July 2010), compared to 2009, which was a 52-week period. For comparative purposes, the 2010 numbers above have been restated to a 52-week proforma basis, including adjustments to interest and tax for 2010 to reflect the new capital structure as if it had been in place for the whole year. Net profit after tax excludes IPO costs of $96.4 million included in the statutory financial report.

2
Myer and the Board are committed to achieving the highest standards of corporate governance. Accordingly, the Board has adopted a corporate governance framework which consists of principles and policies consistent with the ASX Corporate Governance Council’s Corporate Governance Principles and Recommendations (2nd Edition) (ASX Principles) which assist the Board to discharge its corporate governance responsibilities on behalf of the shareholders. The Board has also implemented practices designed to promote responsible management and good conduct.
Details of Myer’s key policies and practices and the Charters for the Board and each of its Committees can be seen on the Myer website, at www.myer.com.au. Myer and its controlled entities together are referred to as the Group in this statement.
The main features of the Group’s corporate governance practices are set out below.
Board of Directors The Board has ultimate responsibility for setting policy regarding the business and affairs of Myer for the benefit of shareholders and other stakeholders. The Board has adopted a Charter to provide a framework for the effective operation of the Board. As set out in the Board Charter, the Board has clearly established the functions reserved to it and those delegated to senior executives.
Role and functions of the Board The primary responsibilities of the Board are to:
monitor corporate performance and the implementation of –strategy and policy;select, appoint and evaluate the performance of, determine –the remuneration of, and plan the succession of the CEO;on recommendation of the CEO, select, appoint and review –the performance of the CFO and other senior executives;contribute to and approve management development of –corporate strategy, including setting performance objectives and approving operating budgets;review, ratify and monitor systems of risk management and –internal control and ethical and legal compliance;approve major capital expenditure, acquisitions and divestments, –and monitor capital management; monitor and review management processes; and –develop and review corporate governance principles and policies. –
The Board delegates the implementation of the strategic objectives, plans and budgets approved by the Board to the CEO and management.
Board responsibility for performance assessment of senior executivesAll senior executives undergo a performance and development review on an annual basis. This review process involves the following:
each senior executive is assessed in relation to a set of key –performance criteria against which they will be measured. These criteria include both financial and non-financial performance measures;at the end of each financial year, all senior executives meet with –their manager to discuss their performance over the previous year; andupon the completion of the performance appraisal meeting, each –senior executive is provided with feedback on their performance and a rating is determined based on that performance. As well as the review of performance, where appropriate, a development plan is also agreed to facilitate the ongoing contribution of the executive to the needs of the business.
A performance evaluation for senior executives which accords with the process described above has taken place during this reporting period.
It is the role of the Board to review the performance of the CEO and to review the assessments made by the CEO of the performance of his direct reports.
The Nomination and Remuneration Committee is responsible for the review of the senior management assessment processes from time to time to ensure that they remain consistent with the Board’s overall objectives for the business.
Board composition The Board operates in accordance with the broad principles set out in its Charter which is available from the corporate governance information section of the Myer website. The Charter details the Board’s composition and responsibilities. As at the date of this Report, the Board comprised of the following Directors:
Name Position Appointed
H McDonald Chairman, Independent Non-Executive Director 2006B Brookes CEO and Managing Director 2006A Brennan Independent Non-Executive Director 2009T Flood Independent Non-Executive Director 2009*P Hay Independent Non-Executive Director 2010R Myer Independent Non-Executive Director 2006
* Tom Flood was appointed a Director of Myer Pty Ltd in 2007.
Corporate Governance Statement
corporate Governance statement

Myer Holdings Limited Annual Report 2010 3
The majority of the Board, including the Chairman, are independent Non-Executive Directors.
The Constitution of Myer states that the minimum number of Directors is four and the maximum is fixed by the Directors but may not be more than 12. Directors may be appointed to the Board to fill casual vacancies and are elected at Annual General Meetings of Myer.
Myer intends to maintain a mix of Directors on the Board from different backgrounds with complementary skills and experience so that the composition of the Board reflects the appropriate range of independence, skills and experience for Myer. The Board is considering the appointment of a new Director in the future to further enhance the skills and experience of the Board. Further details of current Director’s term of office, skills, qualifications, experience and expertise are set out on pages 10–11 of the Directors’ Report.
Directors’ independence The Board Charter sets out guidelines and thresholds of materiality for the purposes of determining independence of Directors in accordance with the ASX Principles. The Board has adopted a definition of independence that is based on that set out in Box 2.1 of the ASX Principles. In general, Directors will be considered to be independent if they are not members of management and they:
are not a substantial shareholder of Myer, or an officer of, or –otherwise directly associated with, a substantial shareholder of Myer;have not, within the last three years, been employed in an –executive capacity by Myer or another Group member;except in connection with reorganisations within the Group, have –not within the last three years been a principal or employee of a material professional adviser or a material consultant to Myer or another Group member;are not a material supplier to, or customer of Myer or another –Group member or an officer of or otherwise directly or indirectly associated with a material supplier or customer of Myer; andhave no material contractual relationship with Myer or another –Group member, other than as a Director of Myer.
Materiality for these purposes is assessed on a case-by-case basis, having regard to both quantitative and qualitative principles. In terms of quantitative assessment the Board will:
determine the appropriate base to apply (e.g. revenue, equity –or expenses), in the context of each situation;consider an interest (in the relevant base) of 10% or more of –Myer’s shares to be material;consider and review each interest (in the relevant base) –of between 5% and 10% on a case by case basis; andconsider an affiliation with a business which accounts for less –than 5% of the relevant base to be immaterial for the purposes of determining independence.
In terms of qualitative assessment, the Board will consider whether there are any factors or considerations which may mean that the Director’s interest, business or relationship could, or could be reasonably perceived to, materially interfere with the Director’s ability to act in the best interests of Myer.
The Board is currently made up of six Directors, five of whom are Non-Executive Directors. At the date of signing the Directors’ Report, it is the Board’s view that each of its Non-Executive Directors is independent. Details of the relationships affecting Directors’ independence and their independent status (if any) are set out below.
Howard McDonald was appointed a Director in October 2006 and Chairman in August 2009 and supplied consultancy services to Myer from October 2006 to March 2009. Mr McDonald is also Chairman and a shareholder of Rodd & Gunn, a Myer supplier, and a Director of General Pants Co., a Myer competitor. For the financial year ended 31 July 2010, the percentage of Myer’s total sales represented by Rodd & Gunn was well below the materiality threshold established by the Board in its Charter.
Tom Flood was appointed a Director of Myer Pty Ltd in July 2007 and provided consultancy services to Myer one day per week during the period from July 2007 to March 2008 as part of the specific Board function in overseeing the work performed by management on the ‘Store of the Future’ project.
Having regard to:a) the nature and extent of the work performed and, in the case
of Mr McDonald, the extent of the dealings between the other companies and Myer; and
b) the remote likelihood that the Board will need to consider the subject matter of that work or those dealings,
the Board has determined that Mr Flood and Mr McDonald are independent Directors.
Term of office In accordance with the ASX Listing Rules and Myer’s Constitution, all Non-Executive Directors must retire from office no later than the third Annual General Meeting following their last election. Where eligible, a Director may stand for re-election. The Managing Director/CEO will not retire by rotation.
Chairman and CEO The Chairman is responsible for:
providing appropriate leadership to the Board and Myer; –representing the Board to shareholders and communicating –the Board’s position; andpromoting constructive and respectful relations between –the Board and management.
The CEO is responsible for:managing Myer as directed by the Board; and –implementing strategic objectives and plans approved by –the Board.
As set out in the Board Charter, the offices of Chairman and CEO are separate roles and are not exercised by the same individual. The Chairman is an independent Non-Executive Director.
Induction All new senior executives and Directors participate in an induction program. The Directors’ program specifically covers the operation of the Board and its Committees and financial, strategic, operations and risk management issues, which enables them to actively participate in decision-making as soon as possible.
New Directors are provided with a letter of appointment setting out Myer’s expectations, their responsibilities and rights and the terms and conditions of their tenure.
4
Board of Directors (continued)Commitment The number of meetings of the Board and of each Board Committee held during the period ended 31 July 2010, and the number of meetings attended by each Director is disclosed on page 12.
When reviewing a potential candidate for Board appointment, the Nomination and Remuneration Committee will consider the capability of the candidate to devote the necessary time and commitment to the role.
Independent professional advice Directors and Board Committees are entitled, with the approval of the Chair, to seek independent professional advice at Myer’s expense in connection with their duties and responsibilities.
Performance assessment of the Board, its Committees and individual DirectorsThe Board, with the assistance of the Nomination and Remuneration Committee as required, has committed to undertaking an annual review of the performance of individual Directors and the Board as a whole, as well as its Committees. Given the recent listing of Myer, the performance assessment of the Board, its Committees and individual Directors has not occurred during the reporting period. However, the process and format of such a review has been agreed by the Board, and will be implemented following the release of the Company’s first full financial year results.
Within this agreed process each Director completes a Board Review and Assessment Document and the Chairman will undertake an annual assessment of the performance of individual Directors, the Board and its Committees and will meet privately with each Director to discuss this assessment.
The first performance review of the Board, its Committees and individual Directors will take place in the coming financial year.
Board committees The Board has established two Committees to assist in the execution of its duties and responsibilities and to allow detailed consideration of complex issues. The current Committees of the Board are the Nomination and Remuneration Committee and the Audit, Finance and Risk Committee. Each is comprised entirely of Non-Executive Directors. The Committee structure and membership is reviewed on an annual basis.
Each Committee has its own written Charter setting out its role and responsibilities, composition, structure, membership requirements and the manner in which the Committee is to operate. These Charters are reviewed on an annual basis and are available on the Myer website. All matters determined by Committees are submitted to the full Board as recommendations for Board decisions.
Minutes of Committee meetings are tabled at the subsequent Board meeting. Additional requirements for specific reporting by the Committees to the Board are addressed in the Charters of the individual Committees.
Nomination and Remuneration Committee The Nomination and Remuneration Committee operates in accordance with the Nomination and Remuneration Committee Charter which is available on the Myer website. It is responsible for the following matters:
reviewing, assessing and making recommendations to the Board –on the size and composition of the Board, including assessment of desirable and necessary competencies of the Board members;assisting the Board to assess the performance of the Board, its –Committees and individual Directors;reviewing succession plans for the Board and the succession of the –Chair and the CEO and overseeing the development of succession planning in relation to management;assisting the Board with the selection and appointment of –Non-Executive Directors and the recruitment procedures for the CEO of Myer; andassisting the Board in determining appropriate remuneration policies –(including short- and long-term incentive plans for the CEO).
The Nomination and Remuneration Committee currently consists of the following Directors:
R Myer (Chair) –A Brennan –H McDonald –
Details of the number of Committee meetings and Directors’ attendance at Committee meetings are set out on page 12 of the Directors’ Report. Prior to the listing of Myer, P Chen (as Chairman) and S Schneider were members of Myer’s Nomination and Remuneration Committee. Both P Chen and S Schneider resigned as Directors on 27 September 2009.
Appointment of new DirectorsThe Nomination and Remuneration Committee Charter also details the factors to be considered when reviewing a potential candidate for Board appointment, including:
the skills, experience and personal qualities that will best –complement Board effectiveness;the capability of any candidate to devote the necessary time –to the role;any potential conflicts of interest and independence; and –the provision of all relevant information to Directors in relation –to any potential candidate and that any offer be made by the Chair only after having consulted all Directors on the potential appointment.
The Board acknowledges the concerns raised by various corporate governance bodies in relation to the diversity in Australian companies at Board and senior executive levels. In response to these concerns, the Board and the Nomination and Remuneration Committee will assess how diversity criteria, including gender, could be taken into account when assessing future Board candidates’ skills, experience and expertise. This assessment will include the establishment of measurable objectives for promoting gender diversity throughout the Group.
Corporate Governance Statement continued
corporate Governance statement

Myer Holdings Limited Annual Report 2010 5
Remuneration The Nomination and Remuneration Committee advises the Board on remuneration and incentive policies and practices generally, and makes specific recommendations on remuneration packages and other terms of employment for the CEO, Executive Directors and Non-Executive Directors and, on advice from the CEO, other senior executives.
In fulfilling its responsibilities, the Nomination and Remuneration Committee:
reviews and recommends arrangements for the CEO and –executives that report to the CEO, including contract terms, annual remuneration and participation in Myer’s short- and long-term incentive plans;reviews and recommends remuneration arrangements for –senior management;reviews major changes and developments in Myer’s remuneration, –recruitment, retention and termination policies and procedures for senior management, remuneration polices, superannuation arrangements, human resource practices and employee relations strategies for the Group;reviews the senior management performance assessment –processes, and the annual results of those assessments;reviews and approves short-term incentive strategy, performance –targets and bonus payments; reviews and recommends to the Board major changes/ –developments to Myer’s employee equity incentive plans; andreviews and recommends to the Board the remuneration –arrangements for the Chair and the Non-Executive Directors, including fees, travel and other benefits.
The Committee receives briefings from an independent external remuneration adviser on recent developments on remuneration and related matters, as required.
The Board believes that executive remuneration should be:equitable and aligned with the long-term interests of Myer; –structured effectively to attract, motivate and retain skilled –executives; and linked to the creation of sustainable shareholder returns. –
Myer’s remuneration structure distinguishes between Non-Executive Directors’ remuneration and that of the CEO and senior executives. From the date of listing of Myer on the ASX, remuneration for Non-Executive Directors does not include any performance-based components and Non-Executive Directors do not participate in any incentive plans (Options held by Howard McDonald and Tom Flood were granted during their previous roles as both consultants and Directors prior to the listing of Myer). Remuneration for the CEO and senior executives is performance-based and includes:
base pay and benefits, including superannuation; and –short- and long-term incentives. –
Further information on Directors’ and executives’ remuneration, including principles used to determine remuneration, is set out in the Remuneration Report on pages 15 to 26. In accordance with Group policy, participants in equity-based remuneration plans are not permitted to enter into any transactions that would limit the economic risk of options or other unvested entitlements.
Audit, Finance and Risk CommitteeThe Audit, Finance and Risk Committee oversees and reviews Myer’s financial reporting and disclosure processes and the effectiveness of Myer’s controls in the areas of operational and balance sheet risk, and legal and regulatory compliance programs.
The Audit, Finance and Risk Committee’s key responsibilities and functions are to:
oversee Myer’s relationship with its external auditor and the –external audit function, including attending to the appointment, independence and remuneration of the external auditor; oversee Myer’s relationship with the internal auditor and the –internal audit function generally; oversee the preparation of the financial statements and reports, –including assisting the Board in relation to the reporting of financial information; oversee Myer’s financial controls and systems, including ensuring –the appropriate application and amendment of accounting policies; andmanage the process of identification and management of risk. –
In fulfilling its responsibilities, the Audit, Finance and Risk Committee: receives regular reports from management and the internal and –the external auditors;meets with the internal and external auditors at least twice a year, –or more frequently if necessary; reviews the processes that the CEO and CFO have in place to –support their certifications to the Board; reviews any significant disagreements between the auditors and –management, even if they have been resolved; meets separately with the external auditors and the Head of –Internal Audit at least twice a year without the presence of management; andprovides the internal and external auditors with a clear line of –direct communication at any time to either the Chair of the Audit, Finance and Risk Committee or the Chair of the Board.
The Audit, Finance and Risk Committee has authority, within the scope of its responsibilities, to seek any information it requires from any employee or external party.
All of the Directors on the Audit, Finance and Risk Committee are independent and non-executive. The Audit, Finance and Risk Committee consists of the following Directors:
A Brennan (Chair) –T Flood –R Myer –
Details of the number of Committee meetings and Directors’ attendance at Committee meetings are set out on page 12 of the Directors’ Report. Prior to the listing of Myer, S Schneider was a member of Myer’s Audit, Finance and Risk Committee. S Schneider resigned as a Director on 27 September 2009.
Members of management and the external auditors attend meetings of the Committee by invitation. The Committee may also have access to financial and legal advisers or other independent advisers, in accordance with the Audit, Finance and Risk Committee Charter.
All members of the Committee are financially literate and have an appropriate understanding of the industries in which the Group operates. The Audit, Finance and Risk Committee operates in accordance with the Audit, Finance and Risk Committee Charter which is available on the Myer website.

6
Board committees (continued)External auditors Under its Charter, the Audit, Finance and Risk Committee has the responsibility and authority to appoint the external auditor as well as evaluating its effectiveness and independence.
The performance of the external auditor is reviewed annually and the Audit, Finance and Risk Committee reviews and assesses its independence including, but not limited to, any relationships with Myer or any other entity that may impair or appear to impair the external auditor’s judgement or independence in respect of Myer. The current practice is for the rotation of the audit engagement partner to occur every five years. PricewaterhouseCoopers was reappointed as the external auditor in 2009.
The external auditor will attend the Annual General Meeting and be available to answer shareholder questions about the conduct of the audit and the preparation and content of the audit report.
risk managementMyer recognises the importance of risk management practices. Effective risk management assists management and the Board in the delivery of Myer’s strategy.
The Board has ultimate responsibility for the oversight of risks. The Board delegates coordination of risk oversight through the Audit, Finance and Risk Committee. The Committee’s role in relation to risk management is to review and report to the Board as to whether:
Myer’s ongoing risk management program effectively identifies –all areas of potential material business risks;adequate policies and procedures have been designed and –implemented to manage material business risks; a regular program of audits is undertaken to test the adequacy –of and compliance with prescribed policies; andremedial action is undertaken to redress areas of weakness. –
Management implemented a formal Risk Management Framework during the reporting period. Part of the risk management process involves management reporting to the Board on the material business risks and the effectiveness of Myer in managing these risks, on an annual basis. For the reporting period, management has reported to the Board, in accordance with ASX recommendation, as to the effectiveness of Myer’s management of the Group’s material business risks.
Prior to the implementation of the formal Risk Management Framework, risk was managed through reports to the Audit, Finance and Risk Committee. The Risk Management Policy was written by Management and submitted to the Audit, Finance and Risk Committee for approval and recommendation to the full Board for ratification. This policy forms the basis of Myer’s system for managing risks and maintaining a sound internal control environment. Myer’s Risk Management Policy is available on the Myer website.
Risk management systemThe Framework aligns with ISO 31000:2009 Risk Management Principles and Guidelines and provides management with a consistent approach to recognising and managing risks.
Risk management occurs at all levels of Myer. Management and team members are committed to the proper identification, measurement, ownership and management of risk. Key aspects of the risk and control framework are:
the identification and assessment of material business risks which –include financial risks, non-financial risks and major project risks;the regular review of internal controls, mitigation plans, and –ownership responsibility for risks; andthe formal reporting of risks, management activities and progress –against plans.
Internal auditA separate internal audit division has been established and is overseen by an Assurance Manager who reports to the CFO and liaises directly with the Audit, Finance and Risk Committee.
The internal audit division carries out regular systematic monitoring of control activities and reports to both relevant business unit management and the Audit, Risk and Finance Committee.
An independent external firm of accountants assists the Assurance Manager in reviewing the effectiveness of the risk management system when undertaking risk assessments.
Board assurances on financial reporting risksThe Board has received assurance from the CEO and the CFO that the declaration provided in accordance with section 295A of the Corporations Act 2001 is founded on a sound system of risk management and internal control and that the system is operating effectively in all material respects in relation to financial reporting risks.
The CEO and CFO made the following certifications to the Board: that Myer’s financial reports are complete and present a true and –fair view, in all material respects, of the financial condition and operational results of Myer and the Group and are in accordance with relevant accounting standards; that the above statement is founded on a sound system of –risk management and internal compliance and control which implements the policies adopted by the Board; and that Myer’s risk management and internal compliance and control –is operating efficiently and effectively in all material respects in relation to financial reporting risks.
other governance mattersCode of Conduct Myer has developed a Code of Conduct (the Code) which sets out Myer’s commitment to maintaining the highest level of integrity and ethical standards in all business practices. The Code outlines how Myer expects Directors and employees to behave and conduct business in a range of circumstances, including in circumstances of actual or potential conflicts of interest, and the steps that should be taken in the event of uncertainty or a suspected breach of the Code. In particular, the Code requires awareness of, and compliance with, laws and regulations relating to Myer’s operations, including occupational health and safety, fair trading and dealing, privacy and employment practices.
Corporate Governance Statement continued
corporate Governance statement

Myer Holdings Limited Annual Report 2010 7
The Code requires employees who are aware of unethical practices within the Group, or of breaches of the Code, to report these directly to their manager or via the Myer whistleblower line. The whistleblower line is accessible 24 hours a day seven days a week. The Myer Whistleblower Policy outlines that Myer will take all reasonable steps to ensure that adequate and appropriate protection is being provided for those who, in good faith, make a report. This protection applies regardless of whether the matter is proven or not. The Board has appointed a Whistleblower Protection Officer to receive reports. Investigation officers separately manage investigations in relation to potential breaches of the Corporations Act 2001. These matters are reported to the Audit, Finance and Risk Committee.
The Internal Audit division can review and report directly to the Board with regard to the effectiveness of and the level of compliance with the Code. Myer’s Human Resources department also has responsibility for the initial investigations of significant issues raised under the whistleblower program where they relate to team members. All relevant matters are reported to the Audit, Finance and Risk Committee.
A copy of the Code is available on the Myer website.
Continuous disclosure Myer places a high priority on communication with shareholders and is aware of the continuous disclosure obligations it has under the Corporations Act 2001 and the ASX Listing Rules, to keep the market fully informed of information which is not generally available and which may have a material effect on the price or value of Myer’s shares.
Myer has adopted a Continuous Disclosure Policy which establishes procedures to ensure that Directors and management are aware of, and fulfil their obligations in relation to, the timely disclosure of material price-sensitive information.
Myer has also established a Continuous Disclosure Committee. The Committee is constituted by the:
Chief Executive Officer; –Chief Financial Officer; and –General Counsel and Company Secretary. –
The role of the Committee is to:review all potentially material price-sensitive information of which –management or the Board becomes aware; determine whether any of that information is required to be –disclosed to the ASX; andcoordinate the actual form of disclosure with the relevant –members of management or Board, as appropriate.
All deliberations of the Committee will be shared without delay with the Chair or, in the Chair’s absence, the Chair of the Audit, Finance and Risk Committee.
The Company Secretary has been nominated as the person responsible for communications with the ASX.
Myer’s Continuous Disclosure Policy is available on the Myer website.
Securities tradingMyer has adopted Guidelines for dealing in securities which:
explain the types of conduct prohibited under the – Corporations Act 2001 in relation to dealings in securities; and establish a best practice procedure in relation to Directors’, –senior executives’ and employees’ dealings in Myer’s securities.
Subject to the overriding restriction that employees may not deal in securities while they are in possession of price-sensitive information, Directors and senior executives, as defined in the Guidelines, will only be permitted to deal in securities during certain ‘trading windows’. The trading windows include the periods following the release of Myer’s half-year and full year financial results and the Annual General Meeting. Outside the ‘trading windows’, Directors and senior executives must receive clearance from the Chairman, CEO or Company Secretary (as relevant) for any proposed dealing in securities.
A copy of the Guidelines is available on the Myer website.
Shareholder communication Myer also has arrangements in place to promote communication with shareholders and to encourage effective participation at general meetings. Accordingly, Myer has developed a Shareholder Communication Strategy which aims to ensure that shareholders are kept informed of all major developments affecting the state of affairs of Myer. The Shareholder Communication Strategy sets out the various means by which shareholders can obtain information about Myer’s activities.
All information disclosed to the ASX is posted on the Myer website as soon as it is disclosed to the ASX. When briefings are made on aspects of the Group’s operations, the material used in the presentation is first released to the ASX and posted on the Myer website where the briefing contains material price-sensitive information that has not already been released to the market.
Procedures have also been established for reviewing whether any price-sensitive information has been inadvertently disclosed and, if so, this information is also immediately released to the market.
In addition to these arrangements, Myer seeks to provide opportunities for shareholders to keep informed of Myer’s activities through electronic means. Myer’s announcements, details of Myer meetings and financial reports are available on the Myer website.
The website also enables users to provide feedback and has an option for shareholders to register their email address for direct email updates on matters concerning Myer.
The Myer Shareholder Communication Strategy is available on the Myer website.

1 All numbers quoted are on a 53-week basis as disclosed in the Financial Report unless otherwise stated.
8
Your Directors present their report on the consolidated entity consisting of Myer Holdings Limited and the entities it controlled at the end of, or during, the period ended 31 July 2010.
DirectorsThe following persons were Directors of Myer Holdings Limited during the whole of the year and up to the date of this report:
Howard McDonald –Bernie Brookes –Tom Flood –Rupert Myer AM –
Anne Brennan was appointed as a Director on 16 September 2009 and continues in office at the date of this report. Peter Hay was appointed as a Director on 3 February 2010 and continues in office at the date of this report. Dan Carroll, Paul Chen, Gary Kusin, Steven Schneider and Richard Blum were Directors as at the beginning of the financial year until their resignation as Directors on 27 September 2009. William Wavish was a Director as at the beginning of the financial year until his resignation as a Director on 4 August 2009.
principal activitiesDuring the year the principal activity of the Group consisted of the operation of the Myer department store business.
review of operations and activitiesA review of operations and activities is set out below. Further information on the operations and activities of Myer can be found in the 2010 Myer Annual Review. The year has been a very significant one for Myer, with a highlight being the successful listing on the ASX on 2 November 2009. Other highlights for the year, in what was a challenging retail environment, include the:
delivery of improved visual merchandising in stores; –refurbishment of our existing stores at Castle Hill, Blacktown –and Northland;fifth birthday of the – myer one loyalty program which now comprises 3.7 million members and accounts for 68% of total sales;ongoing improvement of our merchandise offer and a –continuation in the excellent performance from Myer Exclusive Brands which now contribute over 17% of sales;implementation of the CCTV system providing greater security for –our customers and staff, as well as assisting in a reduction in theft; andopening of our new National Support Office in the Melbourne –Docklands precinct.
Financial performance1
The Group experienced a strong year, achieving a record EBIT of $270.3 million, up 14.6% on the previous year. Total sales value for the Group on a comparable 52-week trading basis increased 0.7% to $3,284 million, compared to $3,261 million in 2009.
Operating gross profit margin increased by 46 basis points to 39.64%, compared to 2009 due to an improved merchandise mix, a reduction in shrinkage, as well as improved buying and sourcing. In addition, the gross margin improvement reflects our ability to respond to a competitive pricing environment, particularly during the months when we cycled the Federal Government stimulus, by leveraging our myer one database to achieve more targeted promotional activity.
Myer’s cash cost of doing business as a percentage to sales fell by 41 basis points to 29.54% compared to 29.95% in 2009. This result was driven by ongoing and sustainable cost efficiencies as a result of Myer’s investment in technology and its supply chain over the last four years, as well as improved procurement practices.
Net profit after tax for the year was $163.5 million. Proforma net profit after tax based on a 52-week period (with interest and tax adjusted to reflect the changed capital structure for the full year) was $168.7 million. The proforma earnings per share was 29.0 cents, ahead of the Prospectus forecast of 27.3 to 28.3 cents.
Following the change in Myer’s capital structure as a result of the IPO, and with strong cash generation during the year, net debt reduced from $694 million to $314 million and gearing improved from 65% to 27%.
The improved performance for the period was achieved through a combination of initiatives to counter the challenging macro environment, including the leveraging of the myer one loyalty program; more strategic and targeted marketing and promotions; improved in-store presentation; and a continuing focus on cost control.
MerchandiseMyer continues to focus on being a destination for fashion, providing inspiration to everyone. Our merchandise offer targets a broad range of customers across different demographics, in different climates and with varying budgets. While we stock over 2,000 brands, importantly, we offer meaningful breadth and depth of range in the brands that we stock, resulting in better choices for customers.
Myer continues to build strong relationships with key strategic national brands and concessionaires who bring specialist expertise or must-stock brands or services that are important to our diverse customer base.
New stores and store refurbishment programOur new store at Top Ryde opened on 4 August 2010, and we remain on track to open a further 14 new stores by 2014, taking the total number of stores from 66 to 80. Leases for all but one of these new stores have been signed.
During 2010, we announced the signing of two new leases, the first in the Lakeside Joondalup Centre in the northern suburbs of Perth and the second at Fountain Gate in the outer south-eastern suburbs of Melbourne.
Our store refurbishment program continues to deliver positive results and represents an important driver of sales growth for the business. Some of the most recent refurbishments at Sydney City, Geelong, Doncaster, Castle Hill and Blacktown continue to deliver impressive results and we continue to apply the learnings from each project to enhance the way we manage our property and store development activities. The refurbishments of Canberra, Garden City and Charlestown are underway and the stores will be re-launched by December 2010.
Directors’ Report
Directors’ report

Myer Holdings Limited Annual Report 2010 9
Following a total rebuild, Myer’s flagship store in Bourke Street, Melbourne, will deliver around 32,000m2 of selling space in a single store over nine levels in the centre of Melbourne. An additional area of approximately 3,000m2 is taken up by Mural Hall and dedicated event and promotional space. Myer Melbourne will be one of the biggest standalone department stores by turnover in the Southern Hemisphere and will rank as one of the best department stores in the world. The store’s design combines the best of the old and the new with its heritage listed Bourke Street facade, which has been fully restored to include a new glass canopy, and the reopening of the Bourke Street windows from levels one to six. In addition, we have fully restored the iconic Mural Hall, Melbourne’s most famous ballroom that will be open to the public for events.
Myer Melbourne will showcase the biggest range of local and international brands across all categories, and the range of services and amenities will provide customers with a unique shopping experience. Included in the store will be a world-class cosmetics hall and technology department, a champagne bar, a scent room for fragrances, a Benefit Pretty Room and local Melbourne favourite Brunetti café. There will be personal shopping throughout the store including a new Youth personal shopping area and an upgraded personalised shopping service on the fashion floors. We have also secured a number of prestige fashion labels for the new store.
In April 2010, Myer relocated its National Support office to a new building at 800 Collins Street, in Melbourne’s Docklands. This new office is home to approximately 900 team members including the merchandise, supply chain, finance, IT, human resources and store operation teams.
Store operationsImproving customer service continues to be a priority within the business. During 2010, we completed the first stage of a major project to align our store team member rosters to customer shopping patterns, leading to improved labour productivity and enhanced customer service results.
The new point-of-sale (POS) system is being progressively rolled out and is planned to be in all stores before Christmas this year. The new POS will improve customer service in many ways including shortening transaction times so that team members can spend more time helping customers. The rollout of our new POS is well underway and we currently have 25 stores successfully operating the new system. The new POS will contribute to improved customer service at Myer through faster transaction times and the capability to check near real time stock availability across all stores.
During 2010, we completed a major project to install 6,000 closed-circuit television cameras (CCTV) in all stores (except those under refurbishment). The benefits of the new system have been immediate and, combined with other initiatives, have helped to reduce the level of store theft and assisted in security for our staff and customers.
Safety remains a key imperative and we continue to make progress in reducing lost time injuries with a 32% reduction in our lost time injury frequency rate from last year. This is reflective of a Company wide focus on looking after our people through initiatives such as manual-handling and safe work practices training, safety team talks and a focused education program for our managers.
Marketing and Loyaltymyer one continues to represent an important competitive advantage with 68% of the Group’s sales now attributed to myer one customers. There are a total of 3.7 million members and over 5 million cards in circulation. During 2010, we have increased the number of email addresses for myer one members to 1.6 million – an increase of 35%. myer one customers with valid email addresses spent on average 15% more than myer one customers without email addresses.
The growing value of the myer one program to customers is evidenced by the fact that we now have over 20,000 Gold members who spend over $7,500 per annum at Myer. During 2010, we focused on offering our myer one customers relevant exclusive and early offers including invitations to Secret Sales, promotions within specific categories, and other offers.
Over the last year we rewarded our loyal myer one customers with over $51 million in gift cards through our quarterly distributions.
The affiliates program continues to gather momentum. Over 600 affiliates are now associated with myer one, enabling our customers to earn points when they spend across a number of businesses including hotels, petrol stations, cafes, restaurants, retail outlets, wine outlets, flowers, travel, hairdressing, health insurance and box office.
During 2010, we launched a suite of general insurance products in association with QBE, Australia’s largest international general and reinsurance group. myer one members will be entitled to earn shopping credits on the dollars spent on any policy and enjoy competitive prices.
The Myer Visa card continues to play an important part in our customer loyalty strategy, giving customers more reasons to shop at Myer as they accrue shopping credits through spending on their credit cards.
In July 2010, we launched a Myer iPhone application through which customers can browse and search latest store catalogues, receive exclusive offers, view the fashion gallery, and purchase from a range of 1,500 products including gift cards directly from their iPhone. We have already had over 23,000 sign-ups to the iPhone application.
Supply chain and ITSpeed to market is critical for any retailer, and the significant investment we have made in our supply chain and technology platforms over the past four years means we are better able to respond to fashion trends and customer preferences.
Floor ready and source tagging remain a focus for all our merchandise to ensure product is quickly available to customers in stores. The commitment by our suppliers to deliver floor ready merchandise has now reached 90%, which is a significant achievement. The merchandise arrives in our stores already tagged and hung, ready to be presented to customers, which results in significant time saving for our store team members and ensures that stocks are replenished as quickly as possible, which improves the customer experience.

10
DividendsDividends paid to members during the period were as follows:
2010 2009 $’000 $’000
Interim ordinary dividend for the period ended 31 July 2010 of 10.5 cents fully franked (2009 nil) per fully paid share, paid on 6 May 2010 61, 031 –
In addition to the above dividend, since the end of the financial year the Directors have determined the payment of a final fully franked dividend of $66.8 million (11.5 cents per fully paid share) to be paid on 4 November 2010 out of retained earnings at 31 July 2010.
significant changes in the state of affairsOn 2 November 2009, Myer’s shares were listed on the Australian Securities Exchange (ASX). As part of this process, Myer undertook an Initial Public Offering of shares (IPO), under which Myer’s previous controlling shareholder sold its entire holding of shares. Funds raised under the IPO, along with funds raised under new financing facilities, were used to repay existing financing facilities. This resulted in a major change in the capital structure of the Consolidated Entity as detailed in the Financial Report contained within this Annual Report.
Other than the above, there were no significant changes in the state of affairs of the Consolidated Entity during the year or up to the date of this report.
matters subsequent to the end of the financial yearNo matter or circumstance has arisen since 31 July 2010 that has significantly affected, or may significantly affect:(a) the Group’s operations in future financial years; or(b) the results of those operations in future financial years; or(c) the Group’s state of affairs in future financial years.
likely developments and expected results of operationsComments on the likely developments or expected results of the Consolidated Entity’s operations are included in the Review of Operations at page 8. Further information on likely developments in the operations of the Consolidated Entity and the expected results of those operations in future financial periods has been omitted as the Directors believe it would be likely to result in unreasonable prejudice to the Consolidated Entity’s interests.
information on DirectorsHoward McDonaldChairmanIndependent Non-Executive DirectorMember of the Board since 6 November 2006Non-Executive Chairman since 4 August 2009 Member – Nomination and Remuneration Committee
Howard brings significant retail and fashion experience to the Myer business with 35 years of experience in consumer goods industries.
Howard was previously Managing Director of The Just Group, from December 1997 to September 2006, during which time he repositioned and expanded the Group. In 2001, he led the Just Jeans Group into Australia’s first public to private management buyout and in May 2004 Just Group was re-listed on the ASX. Just Group Ltd is the largest specialty apparel retailer in Australasia with over 800 stores. Its stable of brands includes Just Jeans, Jay Jays, Jacqui E, Portmans, Peter Alexander Sleepwear and Dotti.
Prior to this, Howard held a number of roles within the Pacific Dunlop Group across Footwear, Clothing and Textiles, and Corporate, including heading up Corporate Affairs for Pacific Dunlop, where he sat on all the Management Boards of this diversified conglomerate. Howard’s time at Pacific Dunlop culminated in the role of Managing Director of Pacific Brands Clothing, where he focused on off-shore manufacturing, international marketing and textile manufacturing, managing brands such as Bonds, Holeproof, Berlei, Jockey and others.
Howard holds a Bachelor of Economics degree from Monash University and is a member of the Australian Institute of Company Directors. Howard resides in Victoria and is 60 years of age.
Other current directorshipsHoward is currently Chairman of Rodd & Gunn Australia Limited (a Myer supplier) and Rodd & Gunn New Zealand Limited and a Director of General Pants Co. Pty Ltd (a Myer competitor).
Bernie BrookesManaging Director and CEOMember of the Board since 12 July 2006
Bernie was appointed Managing Director and CEO of the Myer Group on 2 June 2006. In his role Bernie has been responsible for the transition of Myer following the separation from the Coles Group and for rebuilding the Myer business under new ownership. Bernie has spent 34 years working within the retail industry in local and international roles in India and China. Prior to joining Myer, Bernie was a Management Director of Woolworths and was a chief architect of Woolworths’ Project Refresh, which reduced costs by more than $5 billion over five years and reinvested these savings back into the business. His Woolworths experience also included a variety of general management positions in three states across the Buying, IT, Marketing and Operations departments.
Bernie has also held a number of roles as president and executive of various industry organisations including Retail Traders Association in Queensland and Victoria and President of the Queensland Grocery Association, and he has assisted on a number of charitable and government ventures and committees.
Bernie has received many awards, including Food Week Retail Executive of the Year, National Retail Association Food Industry Executive of the Year and Food Week Buyer of the Year for four years during the 1980s and 1990s.
Bernie is currently patron of the Australian Joe Berry Memorial Award and the Australian representative judge of the World Retail Awards.
Bernie holds Bachelor of Arts and Diploma of Education degrees from Macquarie University. Bernie resides in Victoria and New South Wales and is 50 years of age.
Directors’ Report continued
Directors’ report

Myer Holdings Limited Annual Report 2010 11
Other current directorshipsBernie is a Member of the Advisory Board of First Unity Financial Group.
Anne BrennanIndependent Non-Executive DirectorMember of the Board since 16 September 2009Chair – Audit, Finance and Risk CommitteeMember – Nomination and Remuneration Committee
Anne brings to the Myer business strong financial credentials and business experience. Anne has worked in a variety of senior management roles in both large corporates and professional services firms.
Anne was the Finance Director of the Coates Group during 2008 and 2009 and prior to that she was the CFO for CSR and was a board member for a number of CSR’s investment companies. She has extensive experience in financial management, treasury, audit, risk management, tax, investor relations and ASX and statutory reporting.
Prior to her role at CSR, Anne was a partner in three professional services firms: KPMG, Arthur Andersen and Ernst & Young, initially in the audit practice and, in the 10 years before joining CSR, as a partner in Corporate Finance and Transaction Services practices. Anne was also a member of the national executive team and a board member of Ernst & Young.
Anne holds a Bachelor of Commerce (Honours) degree from University College Galway. She is a Fellow of the Institute of Chartered Accountants in Australia and a fellow of the Australian Institute of Company Directors. Anne resides in New South Wales and is 50 years of age.
Other current directorshipsAnne is a Director of the Australia Ireland Fund and a Councillor of the Australian Institute of Company Directors (NSW).
Tom FloodIndependent Non-Executive DirectorMember of the Board since 17 March 2009Member – Audit, Finance and Risk Committee
Tom has been a Director of Myer Pty Ltd since 26 July 2007 and a Director of Myer Holdings Limited since 17 March 2009.
Tom brings to Myer 39 years of experience in the retail industry, with the majority of his career spent in the supermarket industry.
Tom joined Woolworths upon his arrival in Australia. During his time there, Tom assumed the position of General Manager, Supermarkets for Western Australian and subsequently for Victoria (Safeway). In these roles, Tom oversaw all areas of the supermarket business, including Buying, Marketing, Store Operations, Distribution, Finance, Security and Insurance. Tom was subsequently appointed Chief General Manager Operations for all Woolworths stores in Australia. Following that, Tom was appointed to the role of Director of Supermarkets with overall responsibility for Woolworths’ core supermarkets business.
Tom began his retail career in Ireland with the Superquinn Supermarket Group before moving to London for a role with the United States-owned Safeway Supermarket group. Tom resides in Victoria and is 62 years of age.
Peter HayIndependent Non-Executive DirectorMember of the Board since 3 February 2010
Peter has a strong background in company law and investment banking work, with particular expertise in relation to mergers and acquisitions. He has also had significant involvement in advising governments and government-owned enterprises.
Peter was the Chief Executive of law firm Freehills (2000 – 2005) where he had been partner since 1977.
Peter holds a Law Degree from the University of Melbourne and is a Fellow of the Australian Institute of Company Directors. Peter resides in Victoria and is 60 years of age.
Other current directorshipsPeter is currently Chairman of Lazard Pty Ltd’s Advisory Board, and a director of Alumina Limited (since 2002). He is a director of Australia and New Zealand Banking Group Limited (since 2008), a director of GUD Holdings Limited (since 2009) and a director of NBN Co Limited (since 2009). Peter is also a part-time member of the Takeovers Panel (since 2009). Peter is also a director of Epworth Foundation (since 2008) and Landcare Australia Ltd (since 2008).
Rupert Myer AMIndependent Non-Executive DirectorMember of the Board since 12 July 2006Chair – Nomination and Remuneration CommitteeMember – Audit, Finance and Risk Committee
Rupert is Chairman of the Myer Family Company, an actively managed investment group holding Australian and international equity portfolios as well as private equity and property investments. He is a director of The Myer Family Office Limited. He was formerly a director of MCS Property Limited.
Rupert is a member of the University of Melbourne Faculty of Economics and Commerce Advisory Board.
His previous community activities have been as Chairman of the NGV Foundation, International Social Service and Work Placement and as a board member of The Museum of Contemporary Art and a trustee of The National Gallery of Victoria. He chaired the Federal Government’s Inquiry into the Contemporary Visual Arts and Craft Sector, which completed its report in 2002.
Rupert holds a Bachelor of Commerce (Honours) degree from the University of Melbourne and a Master of Arts from the University of Cambridge and is a member of the Australian Institute of Company Directors. He became a Member of the Order of Australia in January 2005 for service to the arts, for support of museums and galleries, and the community through a range of philanthropic and service organisations. Rupert resides in Victoria and is 52 years of age.
Other current directorshipsRupert is Chairman of the Myer Family Company Ltd and a director of AMCIL Limited and of Diversified United Investment Limited. He is Chairman of the National Gallery of Australia and a board member of the National Gallery of Australia Foundation.
He also serves as Chairman of Kaldor Public Arts Projects, as a member of the Felton Bequests’ Committee and as a board member of Jawun – Indigenous Corporate Partnerships.

12
Directors’ interests in shares
Relevant Interest Options over Director in Ordinary Shares Ordinary Shares
H McDonald 2,047,723 26,667B Brookes 10,980,077 7,860,394A Brennan 53,658 –T Flood 390,000 10,000P Hay 12,195 –R Myer 725,710 –
On his retirement from the Board on 4 August 2009, William Wavish had a relevant interest in 6,650,000 shares and 5,600,000 options in Myer.
Executive Directors are the only Directors entitled to participate in the Long-term Incentive Plan. Details of these interests are disclosed in the Remuneration Report, which appears on pages 15 to 26 of this report. Options held by Howard McDonald and Tom Flood represent options granted during their previous roles as both consultants and Directors. These remaining options do not have performance conditions.
company secretaryThe Company Secretary is Marion Rodwell. Marion was appointed to the position of General Counsel & Company Secretary of the Myer Group on 31 March 2008. Marion has 22 years of commercial experience. Prior to joining Myer, Marion held similar roles in the financial services, gaming and retail industries over many years. Marion holds a Law Degree and an Economics Degree, both from Monash University.
Steven Black was a joint Company Secretary and resigned from this role on 19 March 2010. Steven continues in employment with the Myer Group.
meetings of DirectorsThe number of meetings of Myer’s Board of Directors and of each Board Committee held during the period ended 31 July 2010, and the numbers of meetings attended by each Director as set out below.
Full meetings of Directors Meetings of Committees Audit, Finance Nomination & Risk & RemunerationDirector A B A B A B
H McDonald 12 12 1 1 4 4B Brookes 12 12 A Brennan (appointed 16 Sept 2009) 9 9 3 3 3 3T Flood 12 12 4 4 P Hay (appointed 3 Feb 2010) 3 4 R Myer 12 12 4 4 3 3W Wavish (resigned 4 Aug 2009) – – D Carroll (resigned 27 Sept 2009) 4 4 P Chen (resigned 27 Sept 2009) 4 4 1 1G Kusin (resigned 27 Sept 2009) 4 4 S Schneider (resigned 27 Sept 2009) 4 4 1 1 1 1R Blum (resigned 27 Sept 2009) 3 4
A = Number of meetings attendedB = Number of meetings held during the time the Director held office or was a member of the committee during the year
retirement, election and continuation in office of DirectorsW Wavish resigned as a Director and as the Executive Chairman on 4 August 2009 P Chen resigned as a Director on 27 September 2009G Kusin resigned as a Director on 27 September 2009S Schneider resigned as a Director on 27 September 2009R Blum resigned as a Director on 27 September 2009A Brennan was appointed as a Director on 16 September 2009P Hay was appointed as a Director on 3 February 2010
Directors’ Report continued
Directors’ report
Myer Holdings Limited Annual Report 2010 13
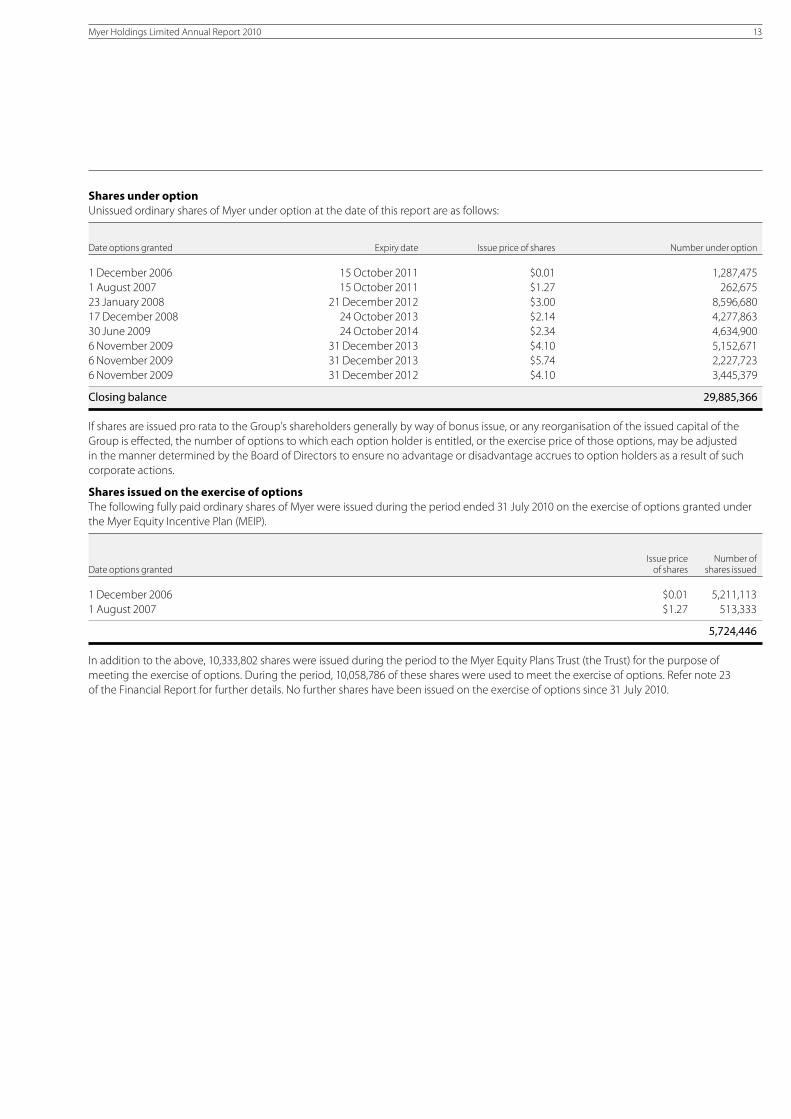
shares under optionUnissued ordinary shares of Myer under option at the date of this report are as follows:
Date options granted Expiry date Issue price of shares Number under option
1 December 2006 15 October 2011 $0.01 1,287,4751 August 2007 15 October 2011 $1.27 262,67523 January 2008 21 December 2012 $3.00 8,596,68017 December 2008 24 October 2013 $2.14 4,277,86330 June 2009 24 October 2014 $2.34 4,634,9006 November 2009 31 December 2013 $4.10 5,152,6716 November 2009 31 December 2013 $5.74 2,227,7236 November 2009 31 December 2012 $4.10 3,445,379
Closing balance 29,885,366
If shares are issued pro rata to the Group’s shareholders generally by way of bonus issue, or any reorganisation of the issued capital of the Group is effected, the number of options to which each option holder is entitled, or the exercise price of those options, may be adjusted in the manner determined by the Board of Directors to ensure no advantage or disadvantage accrues to option holders as a result of such corporate actions.
shares issued on the exercise of optionsThe following fully paid ordinary shares of Myer were issued during the period ended 31 July 2010 on the exercise of options granted under the Myer Equity Incentive Plan (MEIP).
Issue price Number of Date options granted of shares shares issued
1 December 2006 $0.01 5,211,1131 August 2007 $1.27 513,333
5,724,446
In addition to the above, 10,333,802 shares were issued during the period to the Myer Equity Plans Trust (the Trust) for the purpose of meeting the exercise of options. During the period, 10,058,786 of these shares were used to meet the exercise of options. Refer note 23 of the Financial Report for further details. No further shares have been issued on the exercise of options since 31 July 2010.

14
The Remuneration Report, which comprises part of this Directors’ Report, is presented separately on the following pages 15 to 26.
indemnification and insurance of officersThe Company has agreed to indemnify all Directors and Officers against losses incurred in their role as Director, Alternate Director, Secretary, Executive or other employee of the Company or its subsidiaries, subject to certain exclusions, including to the extent that such indemnity is prohibited by the Corporations Act 2001 or any other applicable law. The agreement stipulates that the Company will meet the full amount of any such liabilities, costs and expenses (including legal fees). The Company has not been advised of any claims under any of the above indemnities.
During the financial year the Company paid insurance premiums for a Directors’ and Officers’ liability insurance contract that provides cover for the current and former Directors, Alternate Directors, Secretaries and Executive Officers of the Company and its subsidiaries. The Directors have not included details of the nature of the liabilities covered in this contract or the amount of the premium paid, as disclosure is prohibited under the terms of the contract.
proceedings on behalf of the companyNo person has applied to the Court under section 237 of the Corporations Act 2001 for leave to bring proceedings on behalf of the Company, or to intervene in any proceedings to which the Company is a party, for the purpose of taking responsibility on behalf of the Company for all or part of those proceedings.
No proceedings have been brought or intervened in on behalf of the Company with leave of the Court under section 237 of the Corporations Act 2001.
environmental regulationThe Group is subject to the reporting requirements of both the Energy Efficiency Opportunities Act 2006 and the National Greenhouse and Energy Reporting Act 2007.
The Energy Efficiency Opportunities Act 2006 requires the Group to assess its energy usage, including the identification, investigation and evaluation of energy saving opportunities, and to report publicly on the assessments undertaken, including action the Group intends to take as a result of such assessments. As required under this Act, the Group registered with the Department of Resources, Energy and Tourism as a participant entity and is due to submit its third public report for the 2010 year by 31 December 2010.
The National Greenhouse and Energy Reporting Act 2007 requires the Group to report its annual greenhouse gas emissions and energy use. The Group has implemented systems and processes for the collection and calculation of the data required, and will be able to prepare and submit its second report to the Greenhouse and Energy Data Officer by 31 October 2010.
non-audit servicesMyer may decide to employ the auditor on assignments additional to their statutory audit duties where the auditor’s expertise and experience with Myer and/or the Group are important.
Details of the amounts paid or payable to the auditor (PricewaterhouseCoopers) for audit and non-audit services provided during the year are set out at page 68 of this Annual Report.
The Board of Directors has considered the position and, in accordance with advice received from the Audit, Finance and Risk Committee, is satisfied that the provision of the non-audit services is compatible with the general standard of independence for auditors imposed by the Corporations Act 2001. The Directors are satisfied that the provision of non-audit services by the auditor did not compromise the auditor independence requirements of the Corporations Act 2001 for the following reasons:
all non-audit services have been reviewed by the Audit, Finance –and Risk Committee to ensure they do not impact on the impartiality and objectivity of the auditor; andnone of the services undermine the general principles relating –to auditor independence as set out in APES 110 Code of Ethics for Professional Accountants.
auditor’s independence declaration A copy of the auditor’s independence declaration as required under section 307C of the Corporations Act 2001 is set out on page 79.
rounding of amounts The Group has taken advantage of Class Order 98/100, issued by the Australian Securities and Investments Commission, relating to the ‘rounding off’ of amounts in the Directors’ report. Amounts in the Directors’ report have been rounded off to the nearest thousand dollars, or in certain cases, to the nearest dollar.
This report is made in accordance with a resolution of Directors.
Howard McDonald Melbourne Chairman 27 September 2010
Directors’ Report continued
Directors’ report
15
The information provided in this Remuneration Report has been audited as required by section 308(3C) of the Corporations Act 2001 (section 300A).
Key management personnelThis Remuneration Report sets out the remuneration policy, practices and outcomes for Key Management Personnel (KMP) of Myer. It also sets out details for the top five most highly remunerated senior managers in Myer and the Group.
The KMP of Myer are its Non-Executive Directors and Executive Directors, and certain Senior Executives.
principles used to determine the nature and amount of remunerationThe Board has established a Nomination and Remuneration Committee (Committee), which makes recommendations to the Board on remuneration and incentive strategies and practices and specific recommendations on remuneration packages and other terms of employment for the CEO, other senior executives and Non-Executive Directors, including the Chairman.
The Committee has been established under rule 8.15 of the Constitution of Myer Holdings Limited (Company) to ensure the framework of executive rewards are aligned to the achievement of strategic objectives and the creation of shareholder value.
Details of the Committee, its membership and meetings are set out in the Corporate Governance Statement and Directors’ Report.
Responsibility for remuneration policyIn discharging its responsibilities, the Committee must have regard to the following policy objectives:
to ensure that the Company’s remuneration structures are –equitable and aligned with the long-term interests of the Company and its shareholders;to attract and retain skilled executives; –to structure short- and long-term incentives that are challenging –and linked to the creation of sustainable shareholder returns; andto ensure that any termination benefits are justified and –appropriate.
In the discharge of the Committee’s responsibilities, no Director or executive should be directly involved in determining their own remuneration.
The Committee must at all times have regard to, and notify the Board as appropriate of, all legal and regulatory requirements, including any shareholder approvals required.
The Committee Chair or if they are not available, a Committee member should attend the Annual General Meeting and make themselves available to answer any questions from shareholders about the Committee’s activities or, if appropriate, the Company’s remuneration arrangements.
Executive Remuneration PolicySince the listing of Myer in November 2009, the Board has taken independent advice with regard to remuneration structure and market comparators for the executive group. In consultation with external remuneration consultants Mercer (Australia) Pty Ltd, the Board has introduced the structure of an executive remuneration framework that is market competitive and complementary to the overall reward and recognition strategy of the organisation. This change reflects a remuneration balance more aligned to Myer as a listed entity rather than the structures in place during the period of private equity ownership which were aligned to the objectives of
the private equity owners. Executive rewards have been determined to ensure an appropriate balance between shareholders’ and executives’ interests.
In order to align shareholders’ and executives’ interests, executive rewards are designed to:
have profit as a core component of plan design; –focus on sustained growth in shareholder wealth, consisting –of dividends and growth in earnings per share and share price, and delivering consistent returns as well as focusing the executives on key non-financial drivers of value; andattract and retain high-calibre executives. –
In order to attract and retain executives, executive rewards are designed to:
reward capability and experience; –reflect contribution to growth in shareholder wealth; –provide a clear structure for earning benefits; and –provide recognition for performance and contribution to meeting –business objectives.
The framework provides a mix of fixed and variable pay, and a blend of short- and long-term incentives.
As executives gain seniority within the Group, the balance of this mix shifts to a higher proportion of ‘at risk’ rewards.
Nomination of DirectorsWith respect to nominations, the responsibilities of the Committee are as follows: a) review and recommend to the Board the size and composition
of the Board, including review of Board succession plans and the succession of the Chairman and CEO;
b) review and recommend to the Board the criteria for Board membership, including assessment of necessary and desirable competencies of Board members;
c) assist the Board as required to identify individuals who are qualified to become Board members (including in respect of Executive Directors), in accordance with the following factors:
– the skills, experience, expertise and personal qualities that will best complement Board effectiveness; and
– the capability of the candidate to devote the necessary time and commitment to the role. This involves a consideration of matters such as other Board or executive appointments, potential conflicts of interest, and independence.
d) review and recommend to the Board membership of the Board, including recommendations for the appointment and re-election of Directors, and where necessary propose candidates for consideration by the Board, subject to the principle that a Committee member must not be involved in making recommendations to the Board in respect of themselves;
e) assist the Board as required in relation to the performance evaluation of the Board, its committees and individual Directors, and in developing and implementing plans for identifying, assessing and enhancing Director competencies;
f) review and make recommendations in relation to any corporate governance issues as requested by the Board from time to time;
g) review the Board Charter on a periodic basis, and recommend any amendments for Board consideration;
h) review the time expected to be devoted by Non-Executive Directors in relation to the Company’s affairs; and
i) ensure that an effective induction process is in place for any newly appointed Directors and regularly review its effectiveness.
Remuneration Report
remuneration report

16
principles used to determine the nature and amount of remuneration (continued)Non-Executive Directors’ Remuneration PolicyWith respect to remuneration practices, the responsibilities of the Committee are set out in the Nomination and Remuneration Committee Charter, a copy of which is on the Myer website.
Members of the CommitteeThe current members of the Nomination and Remuneration Committee are:
R Myer (Chair) –A Brennan –H McDonald –
Fees for Non-Executive DirectorsFees and payments to Non-Executive Directors reflect the demands which are made on, and the responsibilities of, the Directors. The Board will review Non-Executive Directors’ fees and payments at least once a year. As part of that review the Board has also determined that it will consider the advice of independent remuneration consultants in relation to both the Chairman’s fees and payments and separately the Non-Executive Directors’ fees and payments.
Non-Executive Directors’ fees are determined within an aggregate Directors’ fee pool limit as approved from time to time by Myer shareholders in general meeting. The maximum aggregate sum excludes special and additional remuneration for special exertions and additional services performed by a Director as determined appropriate by the Board. The Constitution also makes provision for Myer to pay all expenses incurred by Directors in attending meetings and carrying out their duties. The current maximum aggregate fee pool limit is $2.150 million per annum.
The current base fees for Non-Executive Directors were last reviewed in September 2009. Remuneration is inclusive of Committee fees. Non-Executive Directors who chair a Committee receive additional yearly fees.
The following fees currently apply:
Base annual feesChair $500,000Other Non-Executive Directors $150,000
additional annual feesAudit Finance and Risk Committee – Chair $30,000Audit Finance and Risk Committee – member – Nomination and Remuneration Committee – Chair $15,000Nomination and Remuneration Committee –member –
Non-Executive Directors do not receive performance-based pay. However, they are able to purchase shares in Myer Holdings Limited, which would be acquired on market during approved ‘windows’ for share trading consistent with the Company’s Guidelines for dealing in securities. Howard McDonald and Tom Flood hold unvested options they received when engaged as consultants and Directors prior to the listing of Myer. There are no performance conditions attached to these options.
Retirement allowances for Non-Executive DirectorsNon-Executive Directors are not entitled to any additional remuneration upon retirement. Superannuation contributions required by legislation are made from the fee paid to Directors and fall within the aggregate fee pool limit.
Linking remuneration and Company performanceGiven the limited period of time since Myer’s listing and the substantially lower number of shares that were on issue before Myer was listed, there is no meaningful and relevant information on the relationship between remuneration and performance that would allow for comparisons to be made to previous years.
Executive payThe executive pay and reward framework has three components:
base pay and benefits, including superannuation; –short-term performance incentives; and –long-term incentives through participation in the Myer Equity –Incentive Plan.
The combination of these three components comprises an executive’s total remuneration. The Company has commenced a review of executive pay including base pay as well as the structure and application of short- and long-term incentive plans to determine if the approach followed best meets the objectives established by the Board for executive reward.
Executive reward across base, short- and long-term outcomes has regard to the performance of the business on a range of objectives, particularly earnings generated, and, as a consequence, shareholder returns. In this reporting period the Board has had regard to:
the performance of the business leading into and after listing; –the record profit generated in difficult trading circumstances; –strong dividend and earnings per share performance; –the continuation of good cost control; and –the establishment of the first elements of delivery of the growth –phase of the business reflected in the recent opening of our Top Ryde store in New South Wales and the soon to open Robina store in Queensland.
Overall the Board has been very satisfied with the performance of the Myer management team on all these aspects of business performance.
Remuneration Report continued
remuneration report

Myer Holdings Limited Annual Report 2010 17
Cash payments and benefitsThese are structured as a fixed cost, which may be delivered as a combination of cash, superannuation and other approved salary packaged benefits at the executive’s discretion.
Executives are offered a competitive base pay that comprises a fixed component of pay and benefits.
In determining the base pay for executives, including the CEO, the Board has regard to the market rate for a comparable role as well as the experience, skill and proven performance of the executive. Base pay for executives is also reviewed annually having regard to performance against set objectives. An executive’s pay is also reviewed on promotion. The Company entered into new contracts with its KMPs, including the CEO, at the time of the IPO. Pursuant to these contracts, base pay was adjusted from the 2009 reported level to reflect the accountabilities and performance of those executives.
SuperannuationMyer makes superannuation contributions on behalf of employees consistent with its obligations under relevant legislation.
Retention arrangementsIn November 2009, the Board approved retention incentives for a select number of executives other than the CEO to ensure, to the extent possible, that the executive team in place prior to the listing of Myer on the ASX remained in place and continued to deliver on the business objectives established by the Board. The retention arrangements are in the form of cash incentives and are conditional on continued employment with the Group and maintaining certain required performance conditions. Part-payment under the retention arrangements commences at the first anniversary of the listing of Myer on the ASX. However, the larger component of payment is weighted to the second anniversary of the listing to further encourage retention and stability within the executive team. Generally the payment to an individual over the retention period represents approximately one year of base pay.
Short-term incentivesA short-term incentive plan (STIP) operates on an annual basis subject to Board review and approval. The STIP applies to all eligible management team members subject to certain conditions and performance criteria being met. The metrics assessed as prerequisites for any payment are reviewed and approved annually by the Board. While the metrics may vary (in part) on an annual basis they are primarily focused on the achievement of the business’s operating plans and budgets with a significant weighting to profit and sales objectives.
The current quantum of STIP reward varies from level to level of team member roles from 100% of base pay at the CEO level for ‘at target’ performance through to 5% of base pay for ‘at target’ performance for entry level management roles. If the Group achieves the pre-determined performance targets set by the Board, a short-term incentive is payable.
STIP bonuses are generally payable in September each year after the final determination and release of full-year results. Current plans use a profit target as a threshold to ensure variable reward is only available when value has been created for shareholders and when profit is consistent with or in excess of the business plan approved by the Board. The STIP is leveraged for performance above the target to provide an incentive for executive out-performance.
Each executive has a target STIP opportunity depending on the accountabilities of the role and impact on the organisation or business unit performance. The maximum total bonus opportunity for out-performance above target objectives is two times the relevant level paid for at target performance and conversely zero below a set threshold minimum performance.
Each year, the Nomination and Remuneration Committee considers the appropriate targets and key performance indicators (KPIs) to link the STIP and the level of payout if targets are met for Board approval. This includes setting any maximum payout under the STIP, eligibility conditions and minimum levels of performance to trigger payment of any short-term incentives
For the period ended 31 July 2010, the KPIs linked to STIP (for non-KMPs) were based on group and area (where applicable) sales and profit performance, area specific KPIs such as stock turn and reduced inventory shrinkage, and certain non-financial objectives such as safety and service levels. Group or area performance is based on various scorecards that reflect ‘financial’, ‘employee and safety’, ‘key operational’ and ‘service’ metrics appropriate to the target group. For the CEO and other KMPs, the STIP result for the year was determined against targets set for sales and EBIT performance with a weighting between sales (30% of target) and EBIT (70% of target). As a result, based on the FY10 results, STIP was earned for the EBIT result realised, however, no STIP was earned for results for sales against the targets set. As a consequence the Board approved the bonus payments referred to on page 24 of this report for the CEO and KMPs (as well as other senior executives).
The Nomination and Remuneration Committee is responsible for assessing whether the KPIs are met. To help make this assessment, the Committee receives reports on performance from management. All proposed STIP payments are verified by internal audit review. The Nomination and Remuneration Committee has the discretion to adjust short-term incentives in light of unexpected or unintended circumstances.

18
principles used to determine the nature and amount of remuneration (continued)Long-term incentivesThe Myer Equity Incentive Plan (MEIP) is Myer’s Long Term Incentive (LTI) scheme for selected senior executives. Under the MEIP, eligible senior executives have been granted options (each being an entitlement to purchase one fully paid ordinary share in the Company, subject to the satisfaction of vesting conditions) on terms and conditions determined by the Board. If the vesting conditions are satisfied, the options vest and shares will be delivered to the senior executives participating in the plan upon exercise of any vested options at the relevant exercise price. Option holders do not have the right to participate in any securities issue by the Company. Since 2006 six tranches of options have been granted to selected executives under the MEIP. Details of the outstanding unvested options at 31 July 2010 under the MEIP are set out below.
Vesting date Value per (if option holder Number of Exercise option at remains employed by a Tranche Grant date unvested options price grant date Myer Group company) Expiry date
Tranche 1 1 Dec 2006 960,000 $0.01 $0.21 6 Nov 2010 15 Oct 2011Tranche 1 1 Dec 2006 327,475 $0.01 $0.21 31 Jul 2011 15 Oct 2011Tranche 2 1 Aug 2007 90,338 $1.27 $0.50 31 Jul 2011 15 Oct 2011Tranche 3 23 Jan 2008 3,009,404 $3.00 $0.37 31 Jul 2011 21 Dec 2012Tranche 3 23 Jan 2008 3,009,404 $3.00 $0.37 31 Jul 2012 21 Dec 2012Tranche 4 17 Dec 2008 608,600 $2.14 $0.43 31 Jul 2011 24 Oct 2013Tranche 4 17 Dec 2008 608,600 $2.14 $0.43 31 Jul 2012 24 Oct 2013Tranche 4 17 Dec 2008 3,085,663 $2.14 $0.43 31 Jul 2013 24 Oct 2013Tranche 5 30 Jun 2009 317,800 $2.34 $0.49 31 Jul 2012 24 Oct 2014Tranche 5 30 Jun 2009 317,800 $2.34 $0.49 31 Jul 2013 24 Oct 2014Tranche 5 30 Jun 2009 4,067,300 $2.34 $0.49 31 Jul 2014 24 Oct 2014Tranche 6 (CEO only) 6 Nov 2010 5,152,671 $4.10 $1.31 End of Perf. Periods 31 Dec 2013Tranche 6 (CEO only) 6 Nov 2010 2,227,723 $5.74 $1.01 End of Perf. Periods 31 Dec 2013Tranche 6 (Snr Execs) 6 Nov 2010 3,445,379 $4.10 $1.19 End of Perf. Period 31 Dec 2012
Total 27,228,158
Tranches 1 and 2 – grants to senior executivesIn late 2006 and mid-2007, Myer granted options to a number of Myer’s senior executives (including the CEO) under the terms of the MEIP. –The options were subject to performance and time-based vesting conditions, as well as an IPO trigger. As a result of these conditions being met, 95% of Tranche 1 and 93% of Tranche 2 options have vested.The balance of the unvested options will remain unvested subject to a time based service condition. They will vest if the relevant senior –executives remain employed by the Myer Group at 31 July 2011. In the case of the CEO, the remaining options will vest on the date of the first anniversary of listing of Myer if he remains employed by Myer. All Tranche 1 and 2 options have an expiry date of 15 October 2011.The Tranche 1 options have an exercise price of $0.01 and the Tranche 2 options have an exercise price of $1.27. The Tranche 1 and 2 options –were originally issued with an exercise price of $1.26 (now $0.01) and $2.52 (now $1.27), respectively. As a result of the dividend and capital return totalling $1.25 per share paid on 24 August 2007, the exercise price of options outstanding at that date was reduced by $1.25 to ensure option holders would not be disadvantaged by the capital return and dividend paid. Tranche 1 and 2 performance-based conditions have all been achieved and as a result all performance-based options have vested. –
Tranches 3, 4 and 5 In January 2008, December 2008 and June 2009, Myer granted options to a number of its senior executives under the terms of the MEIP. –The January 2008 options were subject to a service condition, which allows eligible senior executives, employed at the time to exercise a portion of their options at 31 July 2010. All remaining unvested options will vest on the vesting dates established in those plans if those executives remain employed with Myer.Options issued under these tranches were not subject to performance conditions (other than time-based service conditions) as part of –those offers rather they were designed more around the desire to incentivise the larger group of managers to whom they were offered to work towards the continuing improvement of the business both leading into the IPO and then beyond that time. Given this primary intention it was not considered necessary or appropriate at that time to have performance conditions applied, particularly given that the Company was not listed at the time the options were granted.
Tranches 6 A, B, C, and D (CEO only)In September 2009 the Board approved an additional grant of options under the MEIP to Mr Brookes to the value of $9,000,000 (at grant –date being 6 November 2009). The options were granted in four tranches, at no cost to Mr Brookes, and form the long-term incentive portion of Mr Brookes’ remuneration. The independent valuation placed on these Options for each Tranche and the resulting number of options is shown in the following table. In total Mr Brookes was granted 7,380,394 options.
Remuneration Report continued
remuneration report

Myer Holdings Limited Annual Report 2010 19
In summary, three-quarters of the options are subject to a performance hurdle based on Myer’s fully diluted earnings per share (EPS) (EPS –Options) and one quarter of the options will be subject to a performance hurdle based on Myer’s share price (Share Price Options). Vesting of the options is also subject to a service condition – vesting will be subject to Mr Brookes remaining employed by the Myer Group until the end of the relevant performance period. Each option is an entitlement to one share upon payment of the exercise price. For the EPS Options, the exercise price will be $4.10 and for the Share Price Options, the exercise price will be $5.74. Options which do not satisfy the vesting conditions will lapse. EPS was chosen at the time as a better measure for assessing the performance of the business over such other alternatives as comparable –Total Shareholder Return (TSR) based on a review of both the practice of other businesses in the use of the measure and the desire of the Board to further consider the adequacy of a valid peer group for such a measure for the Myer business. Many of the most relevant Australian comparator businesses to Myer are unlisted divisions of larger retail businesses such as Target and Kmart within the larger Wesfarmers group and Big W within the Woolworths group, making their inclusion in a TSR index impossible other than at a group level, both group businesses having aspects of their business unrelated to the nature of the Myer retail business. The Board will, however, continue to review such measurement options for any future equity reward plans. Applying international benchmark businesses was not considered appropriate at the time the allotment was made. Share price growth was selected as the second trigger for a proportion of the option allotment on the basis that the Board was of the view that a reasonable incentive should exist against that proportion of options aligned to the share price trigger to provide a focus on delivering results that lead to an improvement in the share price of Myer post the IPO price.
Performance hurdles for Tranche 6 – CEO options Summary of performance hurdles and performance periods applicable to each component of the CEO’s Tranche 6 options.
Value of Valuation of Number of options at each option options Exercise Tranche 6 grant date at grant date granted price Applicable hurdles Potential time of vesting
Tranche A $5,400,000 $1.31 4,122,137 $4.10 EPS Hurdle1 End of First Performance Period. Re-testing at end of Second Performance PeriodTranche B $1,350,000 $1.31 1,030,534 $4.10 EPS Hurdle1 and extended End of Second Performance Period 12 month service condition Tranche C $1,800,000 $1.01 1,782,178 $5.74 Share Price Hurdle2 End of First Performance Period Re-testing at end of Second Performance PeriodTranche D $450,000 $1.01 445,545 $5.74 Share Price Hurdle3 and End of Second Performance Period extended 12 month service condition
1 For both Tranche 6A and 6B options, performance against the EPS Hurdle will be measured at the end of the First Performance Period. If the EPS Hurdle is not met at the end of the First Performance Period, the Tranche 6A and 6B options will be re-tested at the end of the Second Performance Period, measuring the Company’s annual compound growth in EPS over the Second Performance Period applying the vesting schedule.
2 For Tranche 6C options, performance against the Share Price Hurdle will be measured at the end of the First Performance Period. If the Share Price Hurdle is not met at the end of the First Performance Period, the Tranche 6C options will be re-tested at the end of the Second Performance Period.
3 For Tranche 6D options, performance against the Share Price Hurdle will be measured at the end of the Second Performance Period.
Performance periods for the CEO’s Tranche 6 options are as follows: – The First Performance Period is the three financial years ending July 2012; and – The Second Performance Period is the four financial years ending July 2013.
The vesting schedule and performance hurdles for the CEO’s Tranche 6 EPS options are as follows:
Compound annual growth rate in EPS over the performance period % of EPS Options that will vest
At 10% 33.33%Between 10% and 12.5% Pro rata vesting between 33.33% and 66.66%At 12.5% 66.66%Between 12.5% and 15% Pro rata vesting between 66.66% and 100%At or above 15% 100%
The base EPS used for the purpose of determining the compound annual growth rate is 23.5 cents, representing FY09 fully diluted EPS, adjusted to a proforma basis consistent with the capital structure of the Group post IPO.
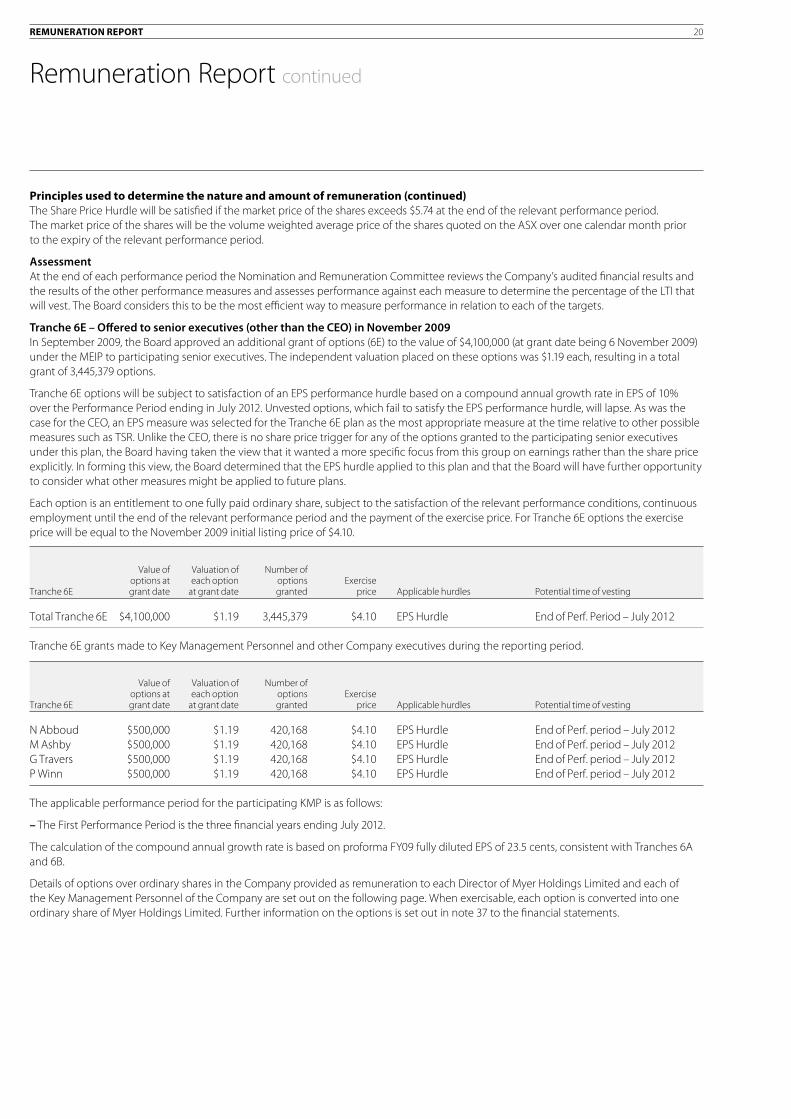
20
principles used to determine the nature and amount of remuneration (continued)The Share Price Hurdle will be satisfied if the market price of the shares exceeds $5.74 at the end of the relevant performance period. The market price of the shares will be the volume weighted average price of the shares quoted on the ASX over one calendar month prior to the expiry of the relevant performance period.
AssessmentAt the end of each performance period the Nomination and Remuneration Committee reviews the Company’s audited financial results and the results of the other performance measures and assesses performance against each measure to determine the percentage of the LTI that will vest. The Board considers this to be the most efficient way to measure performance in relation to each of the targets.
Tranche 6E – Offered to senior executives (other than the CEO) in November 2009 In September 2009, the Board approved an additional grant of options (6E) to the value of $4,100,000 (at grant date being 6 November 2009) under the MEIP to participating senior executives. The independent valuation placed on these options was $1.19 each, resulting in a total grant of 3,445,379 options.
Tranche 6E options will be subject to satisfaction of an EPS performance hurdle based on a compound annual growth rate in EPS of 10% over the Performance Period ending in July 2012. Unvested options, which fail to satisfy the EPS performance hurdle, will lapse. As was the case for the CEO, an EPS measure was selected for the Tranche 6E plan as the most appropriate measure at the time relative to other possible measures such as TSR. Unlike the CEO, there is no share price trigger for any of the options granted to the participating senior executives under this plan, the Board having taken the view that it wanted a more specific focus from this group on earnings rather than the share price explicitly. In forming this view, the Board determined that the EPS hurdle applied to this plan and that the Board will have further opportunity to consider what other measures might be applied to future plans.
Each option is an entitlement to one fully paid ordinary share, subject to the satisfaction of the relevant performance conditions, continuous employment until the end of the relevant performance period and the payment of the exercise price. For Tranche 6E options the exercise price will be equal to the November 2009 initial listing price of $4.10.
Value of Valuation of Number of options at each option options Exercise Tranche 6E grant date at grant date granted price Applicable hurdles Potential time of vesting
Total Tranche 6E $4,100,000 $1.19 3,445,379 $4.10 EPS Hurdle End of Perf. Period – July 2012
Tranche 6E grants made to Key Management Personnel and other Company executives during the reporting period.
Value of Valuation of Number of options at each option options Exercise Tranche 6E grant date at grant date granted price Applicable hurdles Potential time of vesting
N Abboud $500,000 $1.19 420,168 $4.10 EPS Hurdle End of Perf. period – July 2012M Ashby $500,000 $1.19 420,168 $4.10 EPS Hurdle End of Perf. period – July 2012G Travers $500,000 $1.19 420,168 $4.10 EPS Hurdle End of Perf. period – July 2012P Winn $500,000 $1.19 420,168 $4.10 EPS Hurdle End of Perf. period – July 2012
The applicable performance period for the participating KMP is as follows:
The First Performance Period is the three financial years ending July 2012. –
The calculation of the compound annual growth rate is based on proforma FY09 fully diluted EPS of 23.5 cents, consistent with Tranches 6A and 6B.
Details of options over ordinary shares in the Company provided as remuneration to each Director of Myer Holdings Limited and each of the Key Management Personnel of the Company are set out on the following page. When exercisable, each option is converted into one ordinary share of Myer Holdings Limited. Further information on the options is set out in note 37 to the financial statements.
Remuneration Report continued
remuneration report

Myer Holdings Limited Annual Report 2010 21
Summary of options granted, vested and lapsed for the reporting period
Number of Value of Number of Number of options granted options at options vested options lapsed Value at Name during the period grant date1 during the period during the period lapsed date2
Directors of myer holdings limitedH McDonald5 - - 262,222 – –B Brookes 7,380,394 $9,000,000 5,120,000 – –A Brennan – – – – –T Flood5 – – 98,333 – –P Hay – – – – –R Myer – – – – –W Wavish3 – – 5,120,000 – –
other Key management personnel of the companyN Abboud 420,168 $500,000 92,576 – –M Ashby 420,168 $500,000 333,333 – –G Travers 420,168 $500,000 625,778 – –P Winn 420,168 $500,000 166,667 – –
other company executivesJ Hawker4 – – 625,777 – –
1 The value at grant date of options granted during the year as part of remuneration has been calculated in accordance with AASB 2 Share-based Payments.2 The value at lapse date of options that were granted as part of the remuneration and that lapsed during the year because a vesting condition was not satisfied.
The value is determined at the time of lapsing, but assuming the condition was satisfied.3 Options granted to W Wavish were granted prior to his resignation as an Executive Director.4 J Hawker is not a KMP but is included in the top five paid executives in the Company.5 The options held by H McDonald and T Flood were granted to them during the period that they were engaged as consultants and Directors to the Group prior to the
listing of Myer.
The assessed fair value at grant date of options granted to the individuals is allocated equally over the period from grant date to vesting date, and the amount is included in the remuneration tables below. Fair values at grant date are independently determined using a binomial option pricing model that takes into account the exercise price, the term of the option, the impact of dilution, the share price at grant date and expected price volatility of the underlying share, the expected dividend yield and the risk-free interest rate for the term of the option.
Shares provided on exercise of options Details of ordinary shares in the Company provided as a result of the exercise of options to each Director of Myer Holdings Limited and other Key Management Personnel of the Company are set out below.
Number of ordinary shares provided on exercise of options Value at Name during the period exercise date1
Directors of myer holdings limitedH McDonald 373,333 $1,101,332B Brookes 5,120,000 $21,267,200A Brennan – –T Flood 140,000 $413,000P Hay – –R Myer – –W Wavish2 5,120,000 $19,011,200
other Key management personnel of the companyN Abboud 62,576 $259,926M Ashby – –G Travers 625,778 $2,599,326P Winn – –
other company executivesJ Hawker3 625,777 $2,599,321
1 The value at exercise date of options that were granted in prior periods as part of remuneration and were exercised during the year has been determined as the intrinsic value of the options at that date. This represents the excess of market value of the share acquired over the exercise price paid.
2 Options granted to W Wavish were granted prior to his resignation as an Executive Director.3 J Hawker is not a KMP but is included in the top five paid executives in the Company.

22
principles used to determine the nature and amount of remuneration (continued)Summary of options granted, vested and lapsed for the reporting period (continued)The amounts paid per ordinary share by each Director, other Key Management Personnel and other Company executives on the exercise of options at the date of exercise were as follows:
Number of ordinary shares provided on exercise of options Amount paid Tranche during the period per share
Tranche 1 11,554,131 $0.01Tranche 2 513,333 $1.27
No amounts are unpaid on any shares provided on the exercise of options.
Details of remuneration: bonuses and share-based compensation benefitsFor each bonus and grant of options included in this report, the percentage of the available bonus or grant that was paid, or that vested, in the financial year, and the percentage that was forfeited because the person did not meet the service and performance criteria is set out below. Bonuses are payable in the year following the period in which they are earned. Options vest provided the vesting conditions are met (see page 18). No options will vest if the conditions (either service or performance) are not satisfied, hence the minimum value of the option yet to vest is nil. The maximum value of the options yet to vest has been determined as the amount of the grant date fair value of the options that is yet to be expensed.
STI/Bonus1 Share-based compensation benefits (options) Maximum The remaining total value Achieved Forfeited financial years of grant 2010 2010 Year Vested Forfeited in which options yet to vest Name % % granted % % may vest $
H McDonald 2008 93% – 2012 3,178B Brookes 51% 49% 2010 0% – 2013–2014 6,676,363 2007 95% – 2011 20,777T Flood 2008 93% – 2012 2,500W Wavish 2007 95% – 2011 20,777N Abboud 51% 49% 2010 0% – 2013 363,636 2009 0% – 2014–2015 163,312 2008 33% – 2012–2013 7,993 2007 95% – 2012 254M Ashby 51% 49% 2010 0% – 2013 363,636 2008 33% – 2012–2013 88,815G Travers 51% 49% 2010 0% – 2013 363,636 2007 95% – 2012 2,539P Winn 51% 49% 2010 0% – 2013 363,636 2009 0% – 2014–2015 136,541 2008 33% – 2012–2013 44,407J Hawker 51% 49% 2010 – – – – 2007 95% – 2012 2,539
1 The % of STIs achieved and forfeited for 2010 are based on performance against ‘at target’ performance as explained on page 17.
Loans to Directors and executivesInformation on any loans to Directors and executives, including amounts, interest rates and repayment terms are set out in note 26(c) to the financial statements.
Dealing in securitiesUnder the Company’s Guidelines for dealing in securities, Directors and senior executives are prohibited from entering into hedging arrangements with respect to the Company’s securities. A copy of the Guidelines for dealing in securities is available on the Myer website.
Remuneration Report continued
remuneration report

Myer Holdings Limited Annual Report 2010 23
Escrow arrangements for Myer Chairman and management Each of the Chairman, the CEO and certain specified executives who report directly to the CEO (Reporting Managers) have agreed to a voluntary escrow arrangement with Myer under which they are restricted from dealing in a specified number of shares held by them, as follows. – The CEO and certain Reporting Managers were restricted from dealing in their shares from the date of listing of Myer until the
commencement of the first Board approved trading window following the release to ASX of the Company’s audited results for the financial year ending 31 July 2010. The CEO has the same arrangement, save that he has agreed to an extended escrow period of 18 months from the listing of Myer. During the period starting from the date of the first Board approved trading window following the release to the ASX of the Company’s audited results for the financial year ending 31 July 2010 until the date that is 18 months from listing, the CEO may sell up to 25% of his shares.
– Shares held by the Chairman are subject to an escrow period ending 18 months from listing of Myer. – The restrictions will cease to apply in the event that: – a takeover bid is made for all shares; or – a scheme of arrangement relating to the shares becomes effective. – With prior consent from the Board the escrowed shares may be pledged for money borrowed by the shareholder.
Details of remuneration Amounts of remunerationDetails of the remuneration of the Directors and the Key Management Personnel (as defined in AASB 124 Related Party Disclosures) of Myer Holdings Limited are set out in the following tables.
The Key Management Personnel (KMP) of the Company include each of the Directors and each of the following Executives, who report directly to the CEO:
Nick Abboud – – Director of Store OperationsMark Ashby – – Chief Financial OfficerGreg Travers – – Director of Strategic Planning and Human ResourcesPenny Winn – – Director of Buying Operations
In addition, the following person must be disclosed under the Corporations Act 2001 as he is among the five highest remunerated Group and/or Company executives.
John Hawker – – Director of Business Development
Prior to the listing of Myer Holdings Limited, the Company paid management fees of $63,000 to Newbridge Capital LLC for FY10 (up to the date of listing) (FY09 $1,782,588). Myer is not aware of the remuneration arrangements for the former Directors appointed by NB Swanston BV (being D Carroll, P Chen, S Schneider and R Blum), all of whom resigned as Directors on 27 September 2009 (prior to the IPO). These former Directors did not receive any Directors’ fees from Myer.
Payments made to W Wavish during the year are also set out in the following table. The payments include salary paid to W Wavish for the period from 25 July 2009 to 4 August 2009, payments made in lieu of notice, for termination and in relation to W Wavish providing consulting services to Myer to 31 July 2010. The terms of the agreement with W Wavish and payments to him continue through to 31 July 2011 and the entirety of the payments made, and to be made, is disclosed accordingly.

24
the remuneration of executive and non-executive Directors, Kmps and other company executives The following table shows the remuneration amounts recorded in the financial statements in the period.
Post-employment Share-based Short-term employee benefits benefits Long-term benefits payments
Bonus/ Non Long Termination Total Cash salary incentive monetary Super- service Retention & other remuneration & fees1 STI2 Other3 benefits annuation4 leave bonus5 payments Options6 expense Name $ $ $ $ $ $ $ $ $ $
non-executive DirectorsH McDonald2010 486,565 – 1,900,000 – 14,763 – – – 35,453 2,436,781 2009 254,849 – – – 13,609 – – – 52,320 320,778 A Brennan2010 116,108 – – – 41,392 – – – – 157,500 2009 – – – – – – – – – – T Flood 2010 138,973 – – – 13,745 – – – 13,295 166,013 2009 136,665 – – – 13,516 – – – 19,620 169,801 P Hay 2010 67,113 – – – 6,638 – – – – 73,751 2009 – – – – – – – – – –R Myer2010 149,243 – – – 14,725 – – – – 163,968200910 180,846 – – – 17,886 – – – – 198,732 G Kusin2010 61,338 – – – – – – – – 61,338 2009 42,021 – – – – – – – – 42,021
executive DirectorsB Brookes2010 1,600,362 835,177 376,256 – 50,906 17,863 – – 2,568,922 5,449,486 2009 1,388,659 1,058,166 124,198 – 49,819 24,401 – – 341,586 2,986,829 W Wavish7 2010 26,608 – 1,165 – 3,982 (26,709) – 3,212,616 245,286 3,462,948 2009 1,040,182 839,235 72,666 – 93,732 16,687 – – 341,586 2,404,088
Key management personnelN Abboud2010 409,386 165,810 (31,074) – 24,636 13,032 251,250 – 194,750 1,027,790 2009 280,267 149,492 108,963 – 32,823 26,640 – – 26,971 625,156 M Ashby2010 434,507 195,097 2,292 – 47,739 2,784 251,250 – 248,571 1,182,240 2009 349,081 274,377 2,244 – 34,524 2,590 – – 112,207 775,023 G Travers2010 525,070 218,415 2,292 – 14,785 6,121 251,250 – 166,343 1,184,276 2009 459,537 424,312 2,244 – 13,742 6,441 – – 41,749 948,025 P Winn2010 486,866 210,252 2,292 – 32,880 3,271 251,250 – 228,834 1,215,645 2009 359,898 233,325 2,244 – 38,652 2,352 – – 63,596 700,067
other company executivesJ Hawker8
2010 407,857 185,382 2,292 – 50,295 6,421 – – 29,979 682,226 2009 386,239 283,636 2,244 – 62,131 (8,274) – – 41,749 767,725
Totals 2010 4,909,996 1,810,133 2,255,515 – 316,486 22,783 1,005,000 3,212,616 3,731,433 17,263,962
Totals 20099 4,878,244 3,262,543 314,803 – 370,434 70,837 – – 1,041,384 9,938,245
Remuneration Report continued
remuneration report

Myer Holdings Limited Annual Report 2010 25
1 Cash salary includes short-term compensated absences, consideration for vehicle salary sacrifice and fees including allowances for Committee ‘chair’ responsibilities for A Brennan and R Myer.
2 Short Term Incentive (STI) payments relate to program performance and conditions for the year they were earned, not the year of actual payment. The 2010 STI was paid in September 2010.
3 Other payments for B Brookes, W Wavish and N Abboud include payments for rental subsidy and certain other services in relation to provision of accommodation. In 2010 N Abboud made repayments of his subsidy as a result of overpayments in 2009. Other payments also includes Company-paid FBT expenses. B Brookes received a discretionary bonus of $247,000 in 2010 for his contribution during the IPO process. On the listing of Myer H McDonald received a payment of $1.5 million recognising his contribution to the IPO, his taking on the role of chairman and in relation to the establishment of the Myer Holdings Limited Board. Under the terms of this arrangement H McDonald agreed to certain conditions including that he acquire $100,000 worth of shares in the Company through the IPO and to have the entirety of his shareholding subject to escrow (see page 23). In addition, a special exertion fee of $400,000 was paid in recognition of the additional work he performed during the IPO process. These payments did not form part of the Non-Executive Director’s aggregate fee pool, and are provided for by Clause 8.3(g) of the Company’s Constitution.
4 There were no post-employment benefits paid other than superannuation.5 N Abboud, M Ashby, G Travers and P Winn had retention incentives incorporated into their employment contracts in September 2009 to apply after the listing of
Myer. The amount shown represents the proportion of the total bonus payable that has been expensed in the current financial year in accordance with Accounting Standards. These incentives will be paid only in the event the executive meets the conditions of the retention arrangements, which include continuing service, and meeting performance standards as established by the Company. The incentives are scheduled to be paid in two parts totalling $500,000. The first payment of $170,000 is scheduled to be paid 1 November 2010 and the second payment of $330,000 on 1 November 2011.
6 Option valuations are based on the amount expensed for the period under AASB 2 Share-based Payments. There were no other equity-settled share-based payments and there were no cash-settled share-based payments.
7 W Wavish ceased employment with Myer at 4 August 2009. He was paid a cash salary between 25 July 2009 and 4 August 2009. As part of the terms agreed on his separation, he was paid amounts including: payment in lieu of notice, payment for termination and in relation to the provision of consultancy services to Myer, and in relation to other obligations under the settlement and release agreement. The amounts disclosed cover a 24 month period from 4 August 2009 to 31 July 2011. The consultancy period concluded on 31 July 2010. The terms of his settlement and release agreement continue to operate until 31 July 2011.
8 Denotes one of the five highest paid executives of the company, as required to be disclosed under the Corporations Act 2001.9 For the current financial year the Company has reassessed its application of the definition of KMP, as a result of changes to responsibilities effective for the current
year. As a result the amounts shown for 2009 are below the amounts presented in the 2009 Financial Report for KMP remuneration. The amount reported for 2009 for total remuneration expense was $13,803,282, including executives no longer considered KMP, compared to $9,938,245 shown above.
10 R Myer’s FY09 Director’s fee includes a retrospective adjustment of $50,000 to his FY08 Director’s fee, which was paid in FY09.
The relative proportions of remuneration that are linked to performance and those that are fixed are as follows for the Executive Directors, KMP and other executives:
Total remuneration expense Total fixed remuneration At risk – STI At risk – LTI1
Name $ $ % $ % $ %
executive DirectorsB Brookes2
2010 5,449,486 1,798,387 35% 835,177 16% 2,568,922 49%2009 2,986,829 1,587,077 53% 1,058,166 36% 341,586 11%W Wavish2
2010 3,462,948 5,046 2% – – 245,286 98%2009 2,404,088 1,223,267 51% 839,235 35% 341,586 14%
Key management personnelN Abboud2010 1,027,790 415,980 41% 165,810 16% 446,000 43%2009 625,156 448,693 72% 149,492 24% 26,971 4%M Ashby2010 1,182,240 487,322 41% 195,097 17% 499,821 42%2009 775,023 388,439 50% 274,377 35% 112,207 15%G Travers2010 1,184,276 548,268 46% 218,415 18% 417,593 36%2009 948,025 481,964 51% 424,312 45% 41,749 4%P Winn2010 1,215,645 525,309 43% 210,252 17% 480,084 40%2009 700,067 403,146 58% 233,325 33% 63,596 9%
other company executivesJ Hawker2010 682,226 466,865 68% 185,382 27% 29,979 5%2009 767,725 442,340 58% 283,636 37% 41,749 5%
Totals 2010 14,204,611 4,247,177 40% 1,810,133 17% 4,687,685 43%
Totals 2009 9,206,913 4,974,926 54% 3,262,543 35% 969,444 11%
1 Long Term Incentive (LTI) was provided through the issue of options to individual executives. LTI allotments have been independently valued as at the date the option was granted to the executive. The proportions shown represent the amount expensed for the period under AASB 2 Share-based Payments as a proportion of total remuneration expense for the period. This amount also includes the current expense in relation to the retention bonuses.
2 The relative % proportions of remuneration for 2010 for W Wavish exclude his termination & other payments, and for B Brookes excludes his discretionary bonus payment of $247,000. These payments are included in their total remuneration expense, but do not form part of their Total fixed remuneration, STI or LTI.

26
the remuneration of executive and non executive Directors, Kmps and other company executives (continued)Service agreementsOn appointment to the Board, all Non-Executive Directors sign a letter of appointment. The letter summarises the Board policies and terms, including compensation, relevant to the office of Director.
Remuneration and other terms of employment for the CEO and the other executive KMPs are also formalised in service agreements. Each of these agreements provide for the provision of performance-related cash bonuses, other benefits including salary sacrificing for vehicle leasing and, when eligible, participation in the Myer Equity Incentive Plan. Other major provisions of the agreements relating to remuneration are set out below.
For certain senior executives including all KMP executives other than the CEO, retention incentives have been incorporated into employment contracts prior to listing to ensure the continuity of the management team following the listing of Myer. These incentives include the payment of a cash incentive over a two-year period from the date of listing, and/or a grant of equity incentives based on a three-year period from listing. The incentives are conditional on continued employment with the Myer Group for the specified period and performance conditions.
Termination of contracts with executives is subject to the conditions and payments as detailed below:
Termination Termination Termination notice period notice period benefit where Base salary including initiated initiated initiated by Name Contract type superannuation* by KMP by Company the Company
B Brookes Fixed term – ending on 21 Aug 2012 $1,650,000 3 months 5 weeks **
N Abboud Rolling Contract $450,000 3 months 6 months 6 monthsM Ashby Rolling Contract $500,000 3 months 6 months 6 monthsG Travers Rolling Contract $550,000 3 months 6 months 6 monthsP Winn Rolling Contract $550,000 3 months 6 months 6 months
* Base salaries quoted are as at year ended 31 July 2010.** Termination benefits for B Brookes where the Company initiates the termination without cause are, subject to certain conditions, including the execution of a
general release and wavier of all claims, that he is not employed or engaged by any other business or entity, continues to comply with certain provisions of his contract of employment, as follows:
– each month for 18 months on amounts equal to the monthly base salary; and – any short-term incentive earned on a prorata basis but not yet paid for in a prior financial year, paid in accordance with the Company’s ordinary procedures.
Remuneration Report continued
remuneration report

Myer Holdings Limited Annual Report 2010 27
28 Income statement 29 Statement of comprehensive income 30 Balance sheet 31 Statement of changes in equity 32 Statement of cash flows 33 Notes to the financial statements 76 Directors’ declaration 77 Auditor’s report 79 Auditor’s Independence Declaration 80 Shareholder Information
contents
annual financial report for the period ended 31 July 2010These financial statements covers Myer Holdings Limited as an individual entity and the consolidated entity consisting of Myer Holdings Limited and its subsidiaries. The financial statements are presented in the Australian currency.
Myer Holdings Limited is a company limited by shares, incorporated and domiciled in Australia. Its registered office is:Myer Holdings LimitedLevel 7, 800 Collins StreetDocklands VIC 3008
A description of the nature of the Company’s operations and its principal activities is included in the Directors’ Report on pages 8–14, which is not part of these financial statements.
The financial statements were authorised for issue by the Directors on 27 September 2010. The Company has the power to amend and reissue the financial statements.
Financial Report

Financial report 28
Consolidated 2010 2009 53 weeks 52 weeks Notes $’000 $’000
Total sales value (excluding GST) 5 3,324,240 3,260,812 Concession Sales (449,950) (417,954)
Sale of goods (excluding GST) 5 2,874,290 2,842,858 Sales revenue deferred under customer loyalty program (49,256) (43,942)
Revenue from sale of goods (excluding GST) 5 2,825,034 2,798,916 Other operating revenue (excluding finance revenue) 5 103,822 95,499 Cost of goods sold (1,672,073) (1,669,351)Other income 5 60,927 52,468
Operating gross profit 1,317,710 1,277,531 Selling expenses (729,956) (724,151)Administration expenses (317,449) (317,520)
Earnings before interest and tax before non-recurring IPO transaction costs and related charges 270,305 235,861 Finance revenue 5 2,725 5,449 Finance costs 6 (44,570) (87,626)
Net finance costs (41,845) (82,177)
Profit before income tax before non-recurring IPO transaction costs and related charges 228,460 153,684 Income tax expense 7 (64,926) (44,935)
Profit for the period before non-recurring IPO transaction costs and related charges 163,534 108,749
Initial Public Offering (IPO) transaction costs and other non-recurring IPO related charges (after tax) 6 (96,352) –
Profit for the period 67,182 108,749
Cents Cents
Earnings per share for profit from continuing operations attributable to the ordinary equity holders of the company:Basic earnings per share 12.3 23.8Diluted earnings per share 12.1 22.9
Income statementFor the period ended 31 July 2010
The above income statement should be read in conjunction with the accompanying notes.

Myer Holdings Limited Annual Report 2010 29
The above statement of comprehensive income should be read in conjunction with the accompanying notes.
Statement of comprehensive incomeFor the period ended 31 July 2010
Consolidated 2010 2009 53 weeks 52 weeks Notes $’000 $’000
Profit for the period 67,182 108,749
other comprehensive incomeCash flow hedges 24(b) 8,478 (37,372)Non-recurring IPO related transfers to profit and loss 24(b) 29,019 –Actuarial gains/(losses) on retirement benefit obligation 22(f) (127) (2,128)Income tax relating to components of other comprehensive income 7(d) (11,249) 11,212
Other comprehensive income for the period, net of tax 26,121 (28,288)
Total comprehensive income for the period 93,303 80,460

Financial report 30
Consolidated 2010 2009 Notes $’000 $’000
assetscurrent assets Cash and cash equivalents 8 105,834 184,773 Trade and other receivables 9 24,045 32,897 Inventories 10 352,813 355,572
482,692 573,242 Non-current assets classified as held for sale 12 – 28,544
Total current assets 482,692 601,786
non current assets Other financial assets 13 6,004 7,635 Derivative financial instruments 11 549 –Property, plant and equipment 14 468,050 371,699 Deferred tax assets 15 70,837 91,200 Intangible assets 16 921,020 908,862 Other 4,762 5,593
Total non-current assets 1,471,222 1,384,989
Total assets 1,953,914 1,986,775
liabilitiescurrent liabilities Trade and other payables 17 437,568 467,700 Derivative financial instruments 11 1,208 10,406 Current tax liabilities 9,446 6,953 Provisions 18 104,451 106,303 Other 4,741 2,853
Total current liabilities 557,414 594,215
non current liabilities Borrowings 19 419,919 879,005 Derivative financial instruments 11 – 22,482 Deferred tax liabilities 20 – –Provisions 21 60,494 69,395 Deferred income 57,792 38,852 Other 22 855 2,704
Total non-current liabilities 539,060 1,012,438
Total liabilities 1,096,474 1,606,653
Net assets 857,440 380,122
equity Contributed equity 23 517,128 84,946 Retained profits/(losses) 24 320,470 314,446 Reserves 24 19,842 (19,270)
Total equity 857,440 380,122
Balance sheetAs at 31 July 2010
The above balance sheet should be read in conjunction with the accompanying notes.

Myer Holdings Limited Annual Report 2010 31
The above statement of changes in equity should be read in conjunction with the accompanying notes.
Statement of changes in equityFor the period ended 31 July 2010
Contributed Retained equity Reserves earnings Total Consolidated Notes $’000 $’000 $’000 $’000
Balance as at 27 July 2008 84,872 4,390 207,825 297,087 Total comprehensive income for the period – (26,160) 106,621 80,460
transactions with owners in their capacity as owners:Contributions of equity, net of transaction costs 23 74 – – 74 Dividends provided for or paid 24 – – – –Employee share options 24 – 2,500 – 2,500
74 2,500 – 2,574 Balance as at 25 July 2009 84,946 (19,270) 314,446 380,122 Total comprehensive income for the period – 26,248 67,055 93,303
transactions with owners in their capacity as owners:Contributions of equity, net of transaction costs 23 432,182 – – 432,182 Dividends provided for or paid 24 – – (61,031) (61,031)Employee share options 24 – 12,864 – 12,864
432,182 12,864 (61,031) 384,015
Balance as at 31 July 2010 517,128 19,842 320,470 857,440

Financial report 32
Consolidated 2010 2009 53 weeks 52 weeks Notes $’000 $’000
cash flows from operating activities Receipts from customers (inclusive of goods and services tax) 3,260,846 3,226,539 Payments to suppliers and employees (inclusive of goods and services tax) (3,027,872) (2,982,932)
232,974 243,607 Other revenue 70,739 61,221 Interest paid (59,257) (81,511)Tax paid (3,405) (56,657)
Net cash (outflow)/inflow from operating activities 34 241,051 166,660
cash flows from investing activitiesPayments for property, plant and equipment (104,582) (118,765)Payments for intangible assets (29,955) (28,989)Payments for other assets – (10)Lease incentives received 23,700 22,000 Return of capital received from investment 1,196 800 Dividend received – –Interest received 2,979 5,606
Net cash (outflow)/inflow from investing activities (106,662) (119,358)
cash flows from financing activities Proceeds from borrowings 418,225 –Repayment of borrowings (645,000) –Repayment of Myer Notes (139,052) –Funding paid to related party – (116)Repayments of employee share loans 1,905 659 Funding of employee share loans – (2,301)Payment for shares acquired by the Myer Equity Plans Trust (823) –Proceeds from the issue of shares 314,632 74 Non-recurring finance costs associated with Initial Public Offering (22,526) –Payment of costs of Initial Public Offering (79,658) –Dividend paid 25 (61,031) –
Net cash (outflow) from financing activities (213,328) (1,684)
Net increase (decrease) in cash and cash equivalents (78,939) 45,618 Cash and cash equivalents at the beginning of the financial period 184,773 139,155
Cash and cash equivalents at end of period 8 105,834 184,773
Statement of cash flowsFor the period ended 31 July 2010
The above statement of cash flows should be read in conjunction with the accompanying notes.

Myer Holdings Limited Annual Report 2010 33
contents oF notes to Financial statements
34 1 Summary of significant accounting policies 42 2 Financial risk management 46 3 Critical accounting estimates and judgements 47 4 Segment information 47 5 Revenue and Other Income 48 6 Expenses 49 7 Income tax expense 50 8 Current assets – Cash and cash equivalents 50 9 Current assets – Trade and other receivables 51 10 Current assets – Inventories 51 11 Derivative financial instruments 52 12 Current assets – Non-current assets classified as held for sale 53 13 Non-current assets – Other financial assets 53 14 Non-current assets – Property, plant and equipment 54 15 Non-current assets – Deferred tax assets 55 16 Non-current assets – Intangible assets 56 17 Current liabilities – Trade and other payables 56 18 Current liabilities – Provisions 57 19 Borrowings 58 20 Non-current liabilities – Deferred tax liabilities 59 21 Non-current liabilities – Provisions 59 22 Non-current liabilities – Retirement benefit obligations 62 23 Contributed equity 63 24 Reserves and retained profits 65 25 Dividends 65 26 Key Management Personnel 68 27 Remuneration of auditors 69 28 Contingencies 69 29 Commitments 69 30 Related party transactions 70 31 Subsidiaries 70 32 Deed of cross guarantee 70 33 Events occurring after the reporting period 71 34 Reconciliation of profit after income tax to net cash inflow from operating activities 71 35 Parent entity financial information 72 36 Earnings per share 73 37 Share-based payments
Notes to financial statements31 July 2010

34Financial report
1 summary of significant accounting policiesThe principal accounting policies adopted in the preparation of these financial statements are set out below. These policies have been consistently applied to all the periods presented, unless otherwise stated.
The financial statements include separate financial statements for Myer Holdings Limited as an individual entity and the consolidated entity consisting of Myer Holdings Limited and its subsidiaries.
(a) Basis of preparationThese general purpose financial statements have been prepared in accordance with Australian Accounting Standards, other authoritative pronouncements of the Australian Accounting Standards Board, Urgent Issues Group Interpretations and the Corporations Act 2001.
Financial periodsThe 2010 financial period represents 53 weeks ended 31 July 2010, the comparative financial period represents 52 weeks ended 25 July 2009.
Compliance with IFRSThe consolidated financial statements of Myer Holdings Limited Group and the separate financial statements of Myer Holdings Limited also complies with International Financial Reporting Standards (IFRS) as issued by the International Accounting Standards Board (IASB).
Historical cost conventionThese financial statements have been prepared under the historical cost convention, as modified by the revaluation of available for sale financial assets and financial assets and liabilities (including derivative instruments) at fair value through profit or loss and certain classes of property, plant and equipment.
Critical accounting estimatesThe preparation of financial statements in conformity with accounting standards requires the use of certain critical accounting estimates. It also requires management to exercise its judgement in the process of applying the Group’s accounting policies. The areas involving a higher degree of judgement or complexity, or areas where assumptions and estimates are significant to the financial statements, are disclosed in note 3.
Financial statement presentationThe Group has applied the revised AASB 101 Presentation of Financial Statements which became effective for reporting periods on or after 1 January 2009. The revised standard requires the separate presentation of a statement of comprehensive income and a statement of changes in equity. All non-owner changes in equity must now be presented in the statement of comprehensive income. As a consequence, the Group had to change the presentation of its financial statements. Comparative information has been re-presented so that it is also in conformity with the revised standard.
(b) Principles of consolidation(i) SubsidiariesThe consolidated financial statements incorporate the assets and liabilities of all subsidiaries of Myer Holdings Limited (Company or parent entity) as at 31 July 2010 and the results of all subsidiaries for the period then ended. Myer Holdings Limited and its subsidiaries together are referred to in this financial report as the Group or the consolidated entity.
Subsidiaries are all those entities (including special purpose entities) over which the Company has the power to govern the financial and operating policies, generally accompanying a shareholding of more than one-half of the voting rights. The existence and effect of potential voting rights that are currently exercisable or convertible are considered when assessing whether the Company controls another entity.
Subsidiaries are fully consolidated from the date on which control is transferred to the Group. They are deconsolidated from the date that control ceases.
The purchase method of accounting is used to account for the acquisition of subsidiaries by the Group.
Intercompany transactions, balances and unrealised gains on transactions between Group companies are eliminated. Unrealised losses are also eliminated unless the transaction provides evidence of the impairment of the asset transferred. Accounting policies of subsidiaries have been changed where necessary to ensure consistency with the policies adopted by the Group.
(ii) Employee Share TrustThe Group has formed a trust to administer the Group’s employee share scheme. This trust is consolidated, as the substance of the relationship is that the trust is controlled by the Group.
Shares in Myer Holdings Limited held by the Myer Equity Plans Trust are disclosed as treasury shares and deducted from contributed equity.
(c) Segment reportingOperating segments are reported in a manner consistent with the internal reporting provided to the chief operating decision maker. The chief operating decision maker, who is responsible for allocating resources and assessing performance of the operating segments, has been identified as the Chief Executive Officer.
Change in accounting policyThe Group has adopted AASB 8 Operating Segments from 26 July 2009. AASB 8 replaces AASB 114 Segment Reporting. The new standard requires a ‘management approach’, under which segment information is presented on the same basis as that used for internal reporting purposes. This has not resulted in an increase in the number of reported segments presented. There has been no impact on the measurement of the Company’s assets and liabilities.
Notes to financial statements continued31 July 2010

Myer Holdings Limited Annual Report 2010 35
(d) Foreign currency translation(i) Functional and presentation currencyThe financial statements are presented in Australian dollars, which is the Group’s functional and presentation currency.
(ii) Transactions and balancesForeign currency transactions are translated into the functional currency using the exchange rates prevailing at the dates of the transactions. Foreign exchange gains and losses resulting from the settlement of such transactions and from the translation at period end exchange rates of monetary assets and liabilities denominated in foreign currencies are recognised in profit or loss, except when they are deferred in equity as qualifying cash flow hedges.
(e) Revenue recognitionTotal sales value presented on the income statement represents proceeds from sale of goods from sales (both by Myer and concession operators) generated in Myer stores and prior to the deferral of revenue under the customer loyalty program. Concession sales presented in income statement represents sales proceeds of concession operators within Myer stores. Total sales value is disclosed to show the total sales generated in Myer stores and provide a basis of comparison with similar department stores.
Revenue from the sale of goods, excluding lay-by transactions, is recognised at the point of sale and is after deducting taxes paid, and does not include concession sales. Allowance is made for expected sales returns based on past experience of returns and expectations about the future. A provision for sales returns is recognised based on this assessment. Revenue from lay-by transactions is recognised as part of revenue from the sale of goods at the date upon which the customer satisfies all payment obligations and takes possession of the merchandise.
Revenue from sale of goods excludes concession sales on the basis that the inventory sold is owned by the concession operator at the time of sale and not Myer. Myer’s share of concession sales is recognised as income within other operating revenue at the time the sale is made.
Interest income is recognised on a time proportion basis using the effective interest method. Dividends are recognised as revenue when the right to receive payment is established.
Customer loyalty programThe Group operates a loyalty program where customers accumulate points for purchases made which entitle them to discounts on future purchases. The award points are recognised as a separately identifiable component of the initial sale transaction, by allocating the fair value of the consideration received between the award points and the other components of the sale such that the award points are recognised at their fair value. Revenue from the award points is recognised when the points are redeemed. The amount of revenue is based on the number of points redeemed relative to the total number expected to be redeemed. Award points expire 24 months after the initial sale.
(f) Income taxThe income tax expense or revenue for the period is the tax payable on the current period’s taxable income based on the national income tax rate adjusted by changes in deferred tax assets and liabilities attributable to temporary differences between the tax bases of assets and liabilities and their carrying amounts in the financial statements, and to unused tax losses.
Deferred tax assets and liabilities are recognised for temporary differences at the tax rates expected to apply when the assets are recovered or liabilities are settled, based on those tax rates which are enacted or substantively enacted. The relevant tax rates are applied to the cumulative amounts of deductible and taxable temporary differences to measure the deferred tax asset or liability. An exemption is made for certain temporary differences if they arose in a transaction, other than a business combination, that at the time of the transaction did not affect accounting profit or taxable profit or loss.
Deferred tax assets are recognised for deductible temporary differences and unused tax losses only if it is probable that future taxable amounts will be available to utilise those temporary differences and losses.
Deferred tax assets and liabilities are offset when there is a legally enforceable right to offset current tax assets and liabilities and when the deferred tax balances relate to the same taxation authority. Current tax assets and tax liabilities are offset where the entity has a legally enforceable right to offset and intends either to settle on a net basis, or to realise the asset and settle the liability simultaneously.
Current and deferred tax balances attributable to amounts recognised in other comprehensive income or directly in equity are also recognised directly in other comprehensive income or equity.
(g) LeasesLeases of property, plant and equipment in which a significant portion of the risks and rewards of ownership are retained by the lessor are classified as operating leases (note 29). Lease incentives received on entering into operating leases are recognised as deferred income and are amortised over the lease term. Payments made under operating leases (net of any amortised deferred income) are charged to the income statement on a straight-line basis over the period of the lease.
Leases where the Group has substantially all the risks and rewards of ownership are classified as finance leases. There were no finance leases in place during the reporting period.

36Financial report
1 summary of significant accounting policies (continued)(h) Impairment of assetsGoodwill and intangible assets that have an indefinite useful life are not subject to amortisation and are tested annually for impairment, or more frequently if events or changes in circumstances indicate that they might be impaired. Other assets are reviewed for impairment whenever events or changes in circumstances indicate that the carrying amount may not be recoverable. An impairment loss is recognised for the amount by which the asset’s carrying amount exceeds its recoverable amount. The recoverable amount is the higher of an asset’s fair value less costs to sell and value in use. For the purposes of assessing impairment, assets are grouped at the lowest levels for which there are separately identifiable cash inflows which are largely independent of the cash inflows from other assets or groups of assets (cash-generating units). For store assets, the appropriate cash-generating unit is an individual store. Non financial assets other than goodwill that have previously suffered an impairment are reviewed for possible reversal of the impairment at each reporting date.
(i) Cash and cash equivalentsFor the purpose of presentation in the statement of cash flows, cash and cash equivalents includes cash on hand, deposits held at call with financial institutions, other short-term, highly liquid investments with original maturities of three months or less that are readily convertible to known amounts of cash and which are subject to an insignificant risk of changes in value, and bank overdrafts.
(j) Trade receivablesCollectibility of trade receivables is reviewed on an ongoing basis. Debts which are known to be uncollectible are written off by reducing the carrying amount directly. An allowance account (provision for impairment of trade receivables) is established when there is objective evidence that the Group will not be able to collect all amounts due according to the original terms of receivables. Cash flows relating to short-term receivables are not discounted if the effect of discounting is immaterial.
The amount of the impairment loss is recognised in the income statement within other expenses. When a trade receivable for which an impairment allowance had been recognised becomes uncollectible in a subsequent period, it is written off against the allowance account. Subsequent recoveries of amounts previously written off are credited against other expenses in the income statement.
(k) InventoriesAt the end of the reporting period, all inventories are valued at the lower of cost and net realisable value. Cost is determined using the weighted average cost method, after deducting any purchase settlement discount and including logistics expenses incurred in bringing the inventories to their present location and condition.
Volume-related supplier rebates and supplier promotional rebates are recognised as a reduction in the cost of inventory and are recorded as a reduction of cost of goods sold when the inventory is sold.
(l) Investments and other financial assetsThe Group classifies its investments in the following categories: financial assets at fair value through profit or loss, loans and receivables, held to maturity investments, and available for sale financial assets. The classification depends on the purpose for which the investments were acquired. Management determines the classification of its investments at initial recognition and, in the case of assets classified as held to maturity, re-evaluates this designation at the end of each reporting period.
(i) Financial assets at fair value through profit or loss Financial assets at fair value through profit or loss are financial assets held for trading which are acquired principally for the purpose of selling in the short term with the intention of making a profit. Derivatives are also categorised as held for trading unless they are designated as hedges.
(ii) Loans and receivablesLoans and receivables are non-derivative financial assets with fixed or determinable payments that are not quoted in an active market. They arise when the Group provides money, goods or services directly to a debtor with no intention of selling the receivable. They are included in current assets, except for those with maturities greater than 12 months after the reporting period which are classified as non-current assets. Loans and receivables are included in receivables in the balance sheet (note 9).
(iii) Held to maturity investmentsHeld to maturity investments are non-derivative financial assets with fixed or determinable payments and fixed maturities that the Group’s management has the positive intention and ability to hold to maturity.
(iv) Available for sale financial assetsAvailable for sale financial assets are non-derivatives that are either designated in this category or not classified in any of the other categories. They are included in non-current assets unless management intends to dispose of the investment within 12 months of the end of the reporting period.
Purchases and sales of investments are recognised on trade-date – the date on which the Group commits to purchase or sell the asset. Investments are initially recognised at fair value plus transaction costs for all financial assets not carried at fair value through profit or loss. Financial assets carried at fair value through profit or loss are initially recognised at fair value and transaction costs are expensed in profit or loss. Financial assets are derecognised when the rights to receive cash flows from the financial assets have expired or have been transferred and substantially all the risks and rewards of ownership have been transferred.
Available for sale financial assets and financial assets at fair value through profit or loss are subsequently carried at fair value, unless they are equity securities that do not have a market price quoted in an active market and whose fair value cannot be reliably measured. In that case they are carried at cost.
Notes to financial statements continued31 July 2010

Myer Holdings Limited Annual Report 2010 37
Loans and receivables and held to maturity investments are carried at amortised cost using the effective interest method. Gains or losses arising from changes in the fair value of the ‘financial assets at fair value through profit or loss’ category, including interest and dividend income, are presented in profit or loss within other income or other expenses in the period in which they arise.
Changes in the fair value of monetary securities denominated in a foreign currency and classified as available for sale are analysed between translation differences resulting from changes in amortised cost of the security and other changes in the carrying amount of the security. The translation differences are recognised in profit or loss and other changes in carrying amount are recognised in equity. Changes in the fair value of other monetary and non-monetary securities classified as available for sale are recognised in equity.
When securities classified as available for sale are sold or impaired, the accumulated fair value adjustments recognised in equity are included in profit or loss as gains and losses from investment securities.
Details on how the fair value of financial instruments is determined are disclosed in note 2.
The Group assesses at each reporting period whether there is objective evidence that a financial asset or group of financial assets is impaired. In the case of equity securities classified as available for sale, a significant or prolonged decline in the fair value of a security below its cost is considered in determining whether the security is impaired. If any such evidence exists for available for sale financial assets, the cumulative loss – measured as the difference between the acquisition cost and the current fair value, less any impairment loss on that financial asset previously recognised in profit or loss – is reclassified from equity and recognised in profit or loss as a reclassification adjustment. Impairment losses recognised in profit or loss on equity instruments classified as available for sale are not reversed through profit or loss.
(m) Derivatives and hedging activitiesDerivatives are initially recognised at fair value on the date a derivative contract is entered into and are subsequently remeasured to their fair value at the end of each reporting period. The accounting for subsequent changes in fair value depends on whether the derivative is designated as a hedging instrument, and if so, the nature of the item being hedged. The Group designates certain derivatives as either:
hedges of the fair value of recognised assets or liabilities or –a firm commitment (fair value hedges); orhedges of the cash flows or recognised assets or liabilities –and highly probable forecast transactions (cash flow hedges)
The Group documents at the inception of the hedging transaction the relationship between hedging instruments and hedged items, as well as its risk management objective and strategy for undertaking various hedge transactions. The Group also documents its assessments, both at hedge inception and on an ongoing basis, of whether the derivatives that are used in hedging transactions have been and will continue to be highly effective in offsetting changes in fair values or cash flows of hedged items.
The full fair value of a hedging derivative is classified as a non-current asset or liability when the remaining maturity of the hedged item is more than 12 months. It is classified as a current asset or liability when the remaining maturity of the hedged item is less than 12 months.
(i) Fair value hedgeChanges in the fair value of derivatives that are designated and qualify as fair value hedges are recorded in the income statement, together with any changes in the fair value of the hedged asset or liability that are attributable to the hedged risk. The gain or loss relating to the effective portion of interest rate swaps hedging fixed rate borrowings is recognised in profit or loss within finance costs, together with changes in the fair value of the hedged fixed rate borrowings attributable to interest rate risk. The gain or loss relating to the ineffective portion is recognised in profit or loss.
If the hedge no longer meets the criteria for hedge accounting, the adjustment to the carrying amount of a hedge item for which the effective interest method is used is amortised to profit or loss over the period to maturity using a recalculated effective interest rate.
(ii) Cash flow hedgeThe effective portion of changes in the fair value of derivatives that are designated and qualify as cash flow hedges is recognised in equity in the hedging reserve. The gain or loss relating to the ineffective portion is recognised immediately in profit or loss.
Amounts accumulated in equity are reclassified to profit or loss in the periods when the hedged item affects profit or loss. The gain or loss relating to the effective portion of the interest rate swaps hedging variable rate borrowings is recognised in profit or loss within finance costs. When the forecast transaction that is hedged results in the recognition of a non-financial asset (for example, inventory or fixed assets) the gains and losses previously deferred in equity are transferred from equity and included in the initial measurement of the cost of the asset. The deferred amounts are ultimately recognised in profit or loss as cost of goods sold in the case of inventory, or as depreciation in the case of fixed assets.
When a hedging instrument expires or is sold or terminated, or when a hedge no longer meets the criteria for hedge accounting, any cumulative gain or loss existing in equity at that time remains in equity and is recognised when the forecast transaction is ultimately recognised in profit or loss. When a forecast transaction is no longer expected to occur, the cumulative gain or loss that was reported in equity is immediately reclassified to profit or loss.
(iii) Derivatives that do not qualify for hedge accountingCertain derivative instruments do not qualify for hedge accounting. Changes in the fair value of any derivative instrument that does not qualify for hedge accounting are recognised immediately in profit or loss.

38Financial report
1 summary of significant accounting policies (continued)(n) Property, plant and equipmentProperty, plant and equipment is stated at cost less depreciation. Cost includes expenditure that is directly attributable to the acquisition of the items. Cost may also include transfers from equity of any gains/losses on qualifying cash flow hedges of foreign currency purchases of property, plant and equipment.
Subsequent costs are included in the asset’s carrying amount or recognised as a separate asset, as appropriate, only when it is probable that future economic benefits associated with the item will flow to the Group and the cost of the item can be measured reliably. All other repairs and maintenance are charged to profit or loss during the financial period in which they are incurred.
Land is not depreciated. Depreciation on other assets is calculated using the straight-line method to allocate their cost net of their residual values, over their estimated useful lives, as follows:
Buildings 40 years –Fixtures and fittings 3 – 12.5 years –Plant and equipment 15 – 20 years –Leasehold improvements 20 years –
The assets’ residual values and useful lives are reviewed, and adjusted if appropriate, at the end of each reporting period.
An asset’s carrying amount is written down immediately to its recoverable amount if the asset’s carrying amount is greater than its estimated recoverable amount (note 1(h)).
Gains and losses on disposals are determined by comparing proceeds with carrying amount. These are included in profit or loss.
Non-current assets held for saleNon-current assets are classified as held for sale and stated at the lower of their carrying amount and fair value less costs to sell if their carrying amount will be recovered principally through a sale transaction rather than through continuing use.
Non-current assets are not depreciated or amortised while they are classified as held for sale. Non-current assets classified as held for sale are presented separately from the other assets in the balance sheet.
(o) Intangible assets(i) GoodwillGoodwill represents the excess of the cost of an acquisition over the fair value of the Group’s share of the net identifiable assets of the acquired business at the date of acquisition. Goodwill on acquisitions of businesses is included in intangible assets. Goodwill is not amortised. Instead, goodwill is tested for impairment annually, or more frequently if events or changes in circumstances indicate that it might be impaired, and is carried at cost less accumulated impairment losses. Gains and losses on the disposal of an entity include the carrying amount of goodwill relating to the entity sold.
(ii) Brand names and trademarksThe Myer Brand is considered to have an indefinite life. The Brand is not considered to have a foreseeable brand maturity date, and has accordingly been assessed as having an indefinite useful life and is therefore not amortised. Instead, the brand name is tested for impairment annually, or more frequently if events or changes in circumstances indicate that it might be impaired, and is carried at cost less accumulated impairment losses.
Other brands have a finite useful life and are carried at cost less accumulated amortisation and impairment losses. Amortisation is calculated using the straight-line method to allocate the cost of brands over their estimated useful life of 20 years.
(iii) Computer softwareAll costs directly incurred in the purchase or development of major computer software or subsequent upgrades and material enhancements, which can be reliably measured and are not integral to a related asset, are capitalised as intangible assets. Direct costs may include internal payroll and on-costs for employees directly associated with the project. Costs incurred on computer software maintenance or during the planning phase are expensed as incurred. Computer software is amortised over the period of time during which the benefits are expected to arise, being 5 to 10 years.
(iv) Lease rightsLease rights represent the amount paid up-front to take over store site leases from the existing lessee where such payments are in addition to the ongoing payment of normal market lease rentals. Lease rights are amortised over the term of the lease plus any renewal options reasonably certain to be utilised at the time of acquisition of the lease rights, being 13 to 17 years.
(p) Trade and other payablesThese amounts represent liabilities for goods and services provided to the Group prior to the end of financial period which are unpaid. The amounts are unsecured and are usually paid within 30 to 60 days of recognition.
(q) BorrowingsBorrowings are initially recognised at fair value, net of transaction costs incurred. Borrowings are subsequently measured at amortised cost. Any difference between the proceeds (net of transaction costs) and the redemption amount is recognised in profit or loss over the period of the borrowings using the effective interest method. Fees paid on the establishment of loan facilities are recognised as transaction costs of the loan to the extent that it is probable that some or all of the facility will be drawn down. In this case, the fee is deferred until the draw down occurs. To the extent there is no evidence that it is probable that some or all of the facility will be drawn down, the fee is capitalised as a prepayment for liquidity services and amortised over the period of the facility to which it relates.
Borrowings are classified as current liabilities unless the Group has an unconditional right to defer settlement of the liability for at least 12 months after the reporting period.
Notes to financial statements continued31 July 2010

Myer Holdings Limited Annual Report 2010 39
(r) Borrowing costsBorrowing costs incurred for the construction of any qualifying asset are capitalised during the period of time that is required to complete and prepare the asset for its intended use or sale. Other borrowing costs are expensed.
(s) ProvisionsProvisions are recognised when the Group has a present legal or constructive obligation as a result of past events, it is probable that an outflow of resources will be required to settle the obligation and the amount has been reliably estimated. Provisions are not recognised for future operating losses.
Where there are a number of similar obligations, the likelihood that an outflow will be required in settlement is determined by considering the class of obligations as a whole. A provision is recognised even if the likelihood of an outflow with respect to any one item included in the same class of obligations may be small.
Provisions are measured at the present value of management’s best estimate of the expenditure required to settle the present obligation at the end of the reporting period. The discount rate used to determine the present value reflects current market assessments of the time value of money and the risks specific to the liability.
The Group is self-insured for costs relating to workers’ compensation and general liability claims in certain states. Provisions are recognised based on claims reported, and an estimate of claims incurred but not yet reported, prior to balance date. These provisions are determined utilising an actuarially determined method, which is based on various assumptions including but not limited to future inflation, average claim size and claim administrative expenses. These assumptions are reviewed annually and any reassessment of these assumptions will affect the workers’ compensation expense.
(t) Employee benefits(i) Short-term obligationsLiabilities for wages and salaries, including non-monetary benefits and annual leave expected to be settled within 12 months after the end of the period in which the employees render the related service are recognised in respect of employees’ services up to the end of the reporting period and are measured at the amounts expected to be paid when the liabilities are settled. The liability for annual leave is recognised in the provision for employee benefits. All other short-term employee benefit obligations are presented as payables.
(ii) Other long-term employee benefit obligationsThe liability for long service leave which is not expected to be settled within 12 months after the end of the period in which the employees render the related service is recognised in the provision for employee benefits and measured as the present value of expected future payments to be made in respect of services provided by employees up to the end of the reporting period using the projected unit credit method. Consideration is given to expected future wage and salary levels, experience of employee departures and periods of service. Expected future payments are discounted using market yields at the end of the reporting period on national government bonds with terms to maturity and currency that match, as closely as possible, the estimated future cash outflows.
(iii) Retirement benefit obligationsThe Group contributes to a number of superannuation funds that have been established to provide benefits for employees. Apart from one defined benefit fund, with a range of member categories, all funds are defined contribution funds, and contributions to them are recognised as an expense as they become payable.
The defined benefit fund that the Group contributes to is currently administered through Mercer Human Resource Consulting within a Mercer Master Trust arrangement on behalf of Myer. The defined benefit fund provides defined lump sum pension benefits based on years of service and final average salary. Myer defined benefit members who were members of the Coles Myer Defined Benefit Fund were transferred to the Myer Fund effective 2 June 2006. The Fund is closed to new members and only existing defined benefit members were eligible for membership.
A liability or asset in respect of the defined benefit fund is recognised in the balance sheet, and is measured as the present value of the defined benefit obligation at the end of the reporting period less the fair value of the fund’s assets at that date and any unrecognised past service cost. The present value of the defined benefit obligation is based on expected future payments that arise from membership of the fund to the end of the reporting period, calculated annually by independent actuaries using the projected unit credit method. Consideration is given to expected future wage and salary levels, experience of employee departures and periods of service.
Expected future payments are discounted using market yields at the end of the reporting period on government bonds with terms to maturity and currency that match, as closely as possible, the estimated future cash outflows.
Actuarial gains and losses arising from experience adjustments and changes in actuarial assumptions are recognised in the period in which they occur, outside profit or loss directly in the statement of comprehensive income.
(iv) Profit sharing and bonus plansThe Group recognises a liability and an expense for bonuses and profit sharing based on a formula that takes into consideration the profit attributable to the Group’s shareholders after certain adjustments. The Group recognises a provision where contractually obliged or where there is a past practice that has created a constructive obligation.
(v) Termination benefitsTermination benefits are payable when employment is terminated before the normal retirement date, or when an employee accepts voluntary redundancy in exchange for these benefits. The Group recognises termination benefits when it is demonstrably committed to either terminating the employment of current employees according to a detailed formal plan without possibility of withdrawal or providing termination benefits as a result of an offer made to encourage voluntary redundancy. Benefits falling due more than 12 months after the end of the reporting period are discounted to present value.

40Financial report
1 summary of significant accounting policies (continued)(t) Employee benefits (continued)(vi) Share-based paymentsShare-based compensation benefits are provided to employees via the Myer Equity Incentive Plan. Information relating to these schemes is set out in note 37.
The fair value of options granted under the plan is recognised as an employee benefit expense with a corresponding increase in equity. The total amount to be expensed is determined by reference to the fair value of the options granted, which includes any market performance conditions but excludes the impact of any services and non-market performance vesting conditions and the impact of any non-vesting conditions.
Non-market vesting conditions are included in assumptions about the number of options that are expected to vest. The total expense is recognised over the vesting period, which is the period over which all the specified vesting conditions are to be satisfied. At the end of each period, the entity revises its estimates of the number of options that are expected to vest based on the non-market vesting conditions. It recognises the impact of revisions to original estimates, if any, in profit or loss, with a corresponding adjustment to equity.
Since the start of the financial period, the Myer Equity Incentive Plan is administered by the Myer Equity Plans Trust; see note 1(b)(ii).
(vii) Employee Share Acquisition Plan – Gift sharesAt the time of the IPO and as disclosed in the associated Prospectus, eligible employees were entitled to participate in the Employee Gift Offer. Eligible employees were offered the opportunity to acquire, at no cost, the nearest number of shares up to the value of $725. The cost of the shares issued has been expensed to the Income Statement.
(u) Contributed equityOrdinary shares are classified as equity.
Incremental costs directly attributable to the issue of new shares are shown in equity as a deduction, net of tax, from the proceeds. Incremental costs directly attributable to the issue of new shares for the acquisition of a business are not included in the cost of the acquisition as part of the purchase consideration.
(v) DividendsProvision is made for the amount of any dividend declared, being appropriately authorised and no longer at the discretion of the entity, on or before the end of the financial period but not distributed at balance date.
(w) Earnings per share(i) Basic earnings per shareBasic earnings per share is calculated by dividing:
the profit attributable to owners of the Company, excluding –any costs of servicing equity other than ordinary sharesby the weighted average number of ordinary shares outstanding –during the financial period, adjusted for bonus elements in ordinary shares issued during the period and excluding treasury shares (note 23).
(i) Diluted earnings per shareDiluted earnings per share adjusts the figures used in the determination of basic earnings per share to take into account:
the after income tax effect of interest and other financing costs –associated with dilutive potential ordinary shares, andthe weighted average number of additional ordinary shares that –would have been outstanding assuming the conversion of all dilutive potential ordinary shares.
(x) Goods and services tax (GST)Revenues, expenses and assets are recognised net of the amount of associated GST, unless the GST incurred is not recoverable from the taxation authority. In this case it is recognised as part of the cost of acquisition of the asset or as part of the expense.
Receivables and payables are stated inclusive of the amount of GST receivable or payable. The net amount of GST recoverable from, or payable to, the taxation authority is included with other receivables or payables in the balance sheet.
Cash flows are presented on a gross basis. The GST components of cash flows arising from investing or financing activities, which are recoverable from, or payable to the taxation authority, are presented as operating cash flow.
(y) Rounding of amountsThe Group has taken advantage of Class Order 98/100, issued by the Australian Securities and Investments Commission, relating to the ‘rounding off’ of amounts in the financial statements. Amounts in the financial statements have been rounded off to the nearest thousand dollars, or in certain cases, to the nearest dollar.
(z) New accounting standards and interpretationsCertain new accounting standards and interpretations have been published that are not mandatory for 31 July 2010 reporting periods. The Group’s and the parent entity’s assessment of the impact of these new standards and interpretations, that were considered relevant for the consolidated entity, is set out below.
(i) AASB 2009-8 Amendments to Australian Accounting Standards – Group Cash-Settled Share-based Payment Transactions [AASB 2] (effective from 1 January 2010)The amendments made by the AASB to AASB 2 confirm that an entity receiving goods or services in a group share-based payment arrangement must recognise an expense for those goods or services regardless of which entity in the group settles the transaction or whether the transaction is settled in shares or cash. They also clarify how the group share-based payment arrangement should be measured, that is, whether it is measured as an equity – or a cash-settled transaction. The group will apply these amendments retrospectively for the financial reporting period commencing on 1 July 2010. There will be no impact on the Group’s or the parent entity’s financial statements.
Notes to financial statements continued31 July 2010

Myer Holdings Limited Annual Report 2010 41
(ii) AASB 2009-10 Amendments to Australian Accounting Standards – Classification of Rights Issues [AASB 132] (effective from 1 February 2010)In October 2009 the AASB issued an amendment to AASB 132 Financial Instruments: Presentation which addresses the accounting for rights issues that are denominated in a currency other than the functional currency of the issuer. Provided certain conditions are met, such rights issues are now classified as equity regardless of the currency in which the exercise price is denominated. Previously, these issues had to be accounted for as derivative liabilities. The amendment must be applied retrospectively in accordance with AASB 108 Accounting Policies, Changes in Accounting Estimates and Errors. The Group will apply the amended standard from 1 July 2010. As the Group has not made any such rights issues, the amendment will not have any effect on the Group’s or the parent entity’s financial statements.
(iii) AASB 9 Financial Instruments and AASB 2009-11 Amendments to Australian Accounting Standards arising from AASB 9 (effective from 1 January 2013)AASB 9 Financial Instruments addresses the classification and measurement of financial assets and is likely to affect the Group’s accounting for its financial assets. The standard is not applicable until 1 January 2013 but is available for early adoption. The Group is yet to assess its full impact. However, initial indications are that it may affect the group’s accounting for its available for sale financial assets, since AASB 9 only permits the recognition of fair value gains and losses in other comprehensive income if they relate to equity investments that are not held for trading. The Group has not yet decided when to adopt AASB 9.
(iv) AASB 2009-14 Amendments to Australian Interpretation – Prepayments of a Minimum Funding Requirement (effective from 1 January 2011)In December 2009, the AASB made an amendment to Interpretation 14 The Limit on a Defined Benefit Asset, Minimum Funding Requirements and their Interaction. The amendment removes an unintended consequence of the interpretation related to voluntary prepayments when there is a minimum funding requirement in regard to the entity’s defined benefit scheme. It permits entities to recognise an asset for a prepayment of contributions made to cover minimum funding requirements. The Group does not make any such prepayments. The amendment is therefore not expected to have any impact on the Group’s or the parent entity’s financial statements. The Group intends to apply the amendment from 1 July 2011.
(aa) Parent entity financial informationThe financial information for the parent entity, Myer Holdings Limited, disclosed in note 35 has been prepared on the same basis as the consolidated financial statements, except as set out below.
(i) Investments in subsidiariesInvestment in subsidiaries are accounted for at cost in the financial statements of Myer Holdings Limited.
(ii) Tax consolidation legislationMyer Holdings Limited and its wholly owned Australian controlled entities have implemented the tax consolidation legislation.
The head entity, Myer Holdings Limited, and the controlled entities in the tax consolidated group continue to account for their own current and deferred tax amounts. These tax amounts are measured as if each entity in the tax consolidated group continues to be a stand-alone taxpayer in its own right.
In addition to its own current and deferred tax amounts, Myer Holdings Limited also recognises the current tax liabilities (or assets) and the deferred tax assets arising from unused tax losses and unused tax credits assumed from controlled entities in the tax consolidated Group.
The entities have also entered into a tax funding agreement under which the wholly owned entities fully compensate Myer Holdings Limited for any current tax payable assumed and are compensated by Myer Holdings Limited for any current tax receivable and deferred tax assets relating to unused tax losses or unused tax credits that are transferred to Myer Holdings Limited under the tax consolidation legislation. The funding amounts are determined by reference to the amounts recognised in the wholly owned entities’ financial statements.
The funding amounts are recognised as current intercompany receivables or payables.
Assets or liabilities arising under tax funding agreements with the tax consolidated entities are recognised as amounts receivable from or payable to other entities in the group.
Any difference between the amounts assumed and amounts receivable or payable under the tax funding agreement are recognised as a contribution to (or distribution from) wholly owned tax consolidated entities.
(ab) Comparative amountsWhere current period balances have been classified differently within current period disclosures when compared to the prior period, comparative disclosures have been restated to ensure consistency of presentation between periods.

42Financial report
2 Financial risk managementThe Group’s activities expose it to a variety of financial risks: market risk (including currency risk and cash flow and fair value interest rate risk), credit risk and liquidity risk. The Group’s overall risk management program focuses on the unpredictability of financial markets and seeks to minimise potential adverse effects on the financial performance of the Group. The Group uses derivative financial instruments such as foreign exchange contracts and interest rate swaps to hedge certain risk exposures. Derivatives are exclusively used for hedging purposes, i.e. not as trading or other speculative instruments. The Group uses different methods to measure different types of risk to which it is exposed. These methods include sensitivity analysis in the case of interest rate and foreign exchange risk, and an ageing analysis for credit risk.
Risk management is carried out by the Company under policies approved by the Board of Directors. The Company identifies, evaluates and hedges financial risks. The Board provides written principles for overall risk management, as well as policies covering specific areas, such as foreign exchange risk, interest rate risk, and use of financial instruments and non-derivative financial instruments.
(a) Market risk(i) Foreign exchange riskForeign exchange risk arises when future commercial transactions and recognised assets and liabilities are denominated in a currency that is not the entity’s functional currency.
The Group sources inventory purchases overseas and is exposed to foreign exchange risk, particularly in relation to currency exposures to the US dollar.
To minimise the effects of a volatile and unpredictable exchange rate Group policy is to enter into forward exchange contracts in relation to the Group’s overseas purchases for any 12-month period. The actual level of cover taken fluctuates depending on the period until settlement of the foreign currency transaction, within the Board-approved hedging policy. This policy allows cover to be taken on a sliding scale between 25 – 100% depending on the period to maturity (up to 12 months).
The Group’s exposure to foreign currency risk at the end of the reporting period was as follows:
31 July 2010 25 July 2009 USD Euro HKD USD Euro HKD $’000 $’000 $’000 $’000 $’000 $’000
Trade payables 9,946 235 25 10,430 153 –Forward exchange contracts 82,300 1,490 – 77,300 – –
The parent entity’s financial assets and liabilities are denominated in Australian dollars.
Group sensitivityBased on the financial instruments held at 31 July 2010, had the Australian dollar weakened/strengthened by 10% against the US dollar with all other variables held constant, the Group’s post-tax profit for the period would have been $0.7 million higher/$0.9 million lower (2009: $0.8 million higher/$1.0 million lower), mainly as a result of foreign exchange gains/losses on translation of US dollar denominated financial instruments as detailed in the above table.
Other components of equity would have been $5.3 million higher/$6.5 million lower (2009: $5.2 million higher/$6.4 million lower) had the Australian dollar weakened/strengthened by 10% against the US dollar, arising from foreign exchange contracts designated as cash flow hedges. The Group’s exposure to other foreign exchange movements is not material.
These sensitivities were calculated based on the Group’s period end spot rate for the applicable reporting period.
Notes to financial statements continued31 July 2010
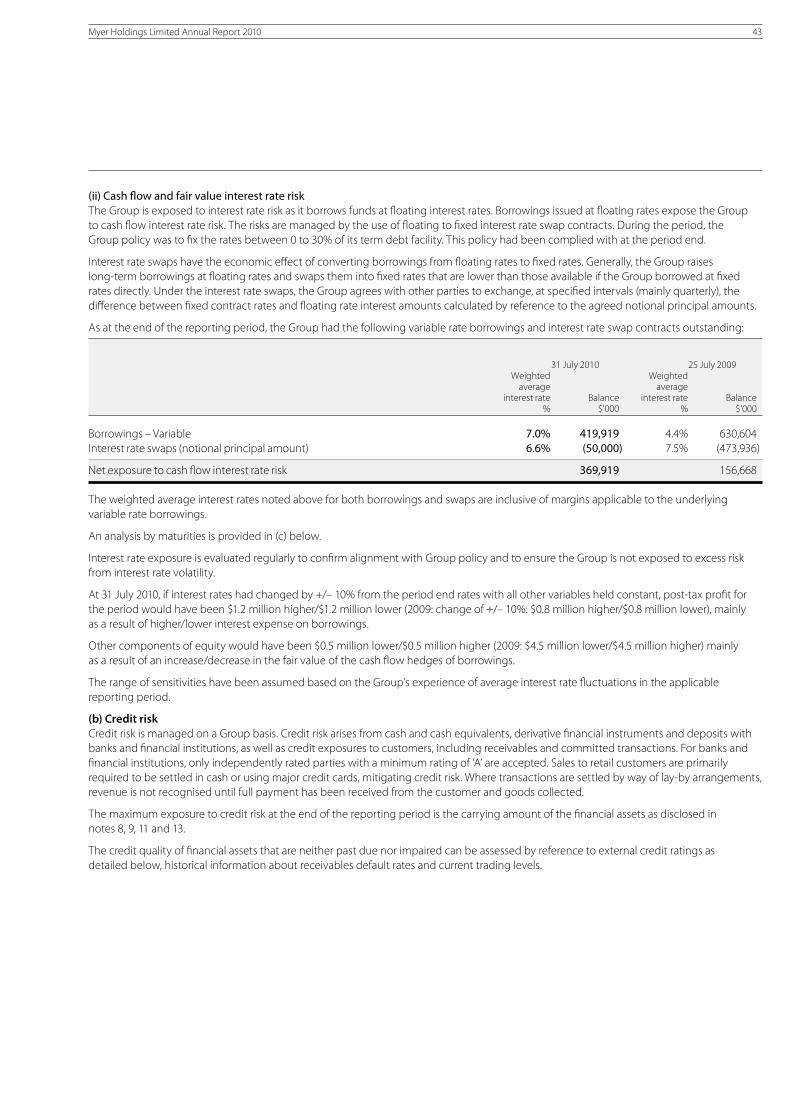
Myer Holdings Limited Annual Report 2010 43
(ii) Cash flow and fair value interest rate riskThe Group is exposed to interest rate risk as it borrows funds at floating interest rates. Borrowings issued at floating rates expose the Group to cash flow interest rate risk. The risks are managed by the use of floating to fixed interest rate swap contracts. During the period, the Group policy was to fix the rates between 0 to 30% of its term debt facility. This policy had been complied with at the period end.
Interest rate swaps have the economic effect of converting borrowings from floating rates to fixed rates. Generally, the Group raises long-term borrowings at floating rates and swaps them into fixed rates that are lower than those available if the Group borrowed at fixed rates directly. Under the interest rate swaps, the Group agrees with other parties to exchange, at specified intervals (mainly quarterly), the difference between fixed contract rates and floating rate interest amounts calculated by reference to the agreed notional principal amounts.
As at the end of the reporting period, the Group had the following variable rate borrowings and interest rate swap contracts outstanding:
31 July 2010 25 July 2009 Weighted Weighted average average interest rate Balance interest rate Balance % $’000 % $’000
Borrowings – Variable 7.0% 419,919 4.4% 630,604 Interest rate swaps (notional principal amount) 6.6% (50,000) 7.5% (473,936)
Net exposure to cash flow interest rate risk 369,919 156,668
The weighted average interest rates noted above for both borrowings and swaps are inclusive of margins applicable to the underlying variable rate borrowings.
An analysis by maturities is provided in (c) below.
Interest rate exposure is evaluated regularly to confirm alignment with Group policy and to ensure the Group is not exposed to excess risk from interest rate volatility.
At 31 July 2010, if interest rates had changed by +/– 10% from the period end rates with all other variables held constant, post-tax profit for the period would have been $1.2 million higher/$1.2 million lower (2009: change of +/– 10%: $0.8 million higher/$0.8 million lower), mainly as a result of higher/lower interest expense on borrowings.
Other components of equity would have been $0.5 million lower/$0.5 million higher (2009: $4.5 million lower/$4.5 million higher) mainly as a result of an increase/decrease in the fair value of the cash flow hedges of borrowings.
The range of sensitivities have been assumed based on the Group’s experience of average interest rate fluctuations in the applicable reporting period.
(b) Credit riskCredit risk is managed on a Group basis. Credit risk arises from cash and cash equivalents, derivative financial instruments and deposits with banks and financial institutions, as well as credit exposures to customers, including receivables and committed transactions. For banks and financial institutions, only independently rated parties with a minimum rating of ‘A’ are accepted. Sales to retail customers are primarily required to be settled in cash or using major credit cards, mitigating credit risk. Where transactions are settled by way of lay-by arrangements, revenue is not recognised until full payment has been received from the customer and goods collected.
The maximum exposure to credit risk at the end of the reporting period is the carrying amount of the financial assets as disclosed in notes 8, 9, 11 and 13.
The credit quality of financial assets that are neither past due nor impaired can be assessed by reference to external credit ratings as detailed below, historical information about receivables default rates and current trading levels.
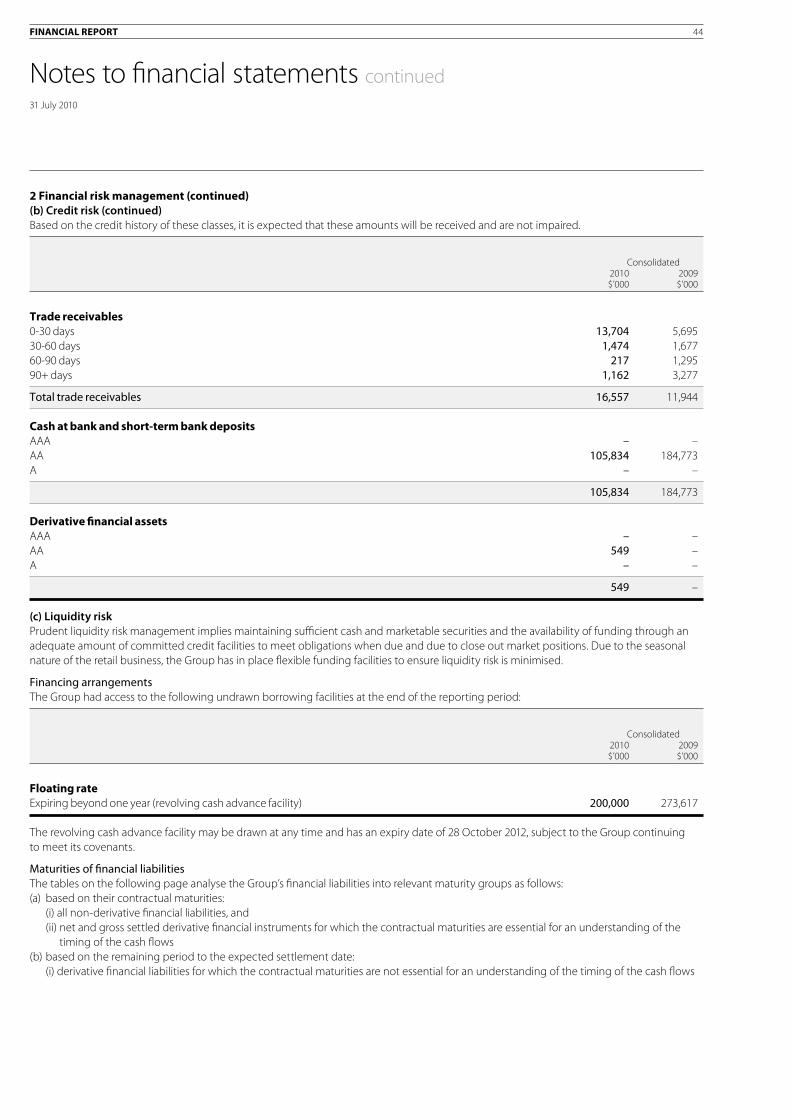
Financial report 44
2 Financial risk management (continued)(b) Credit risk (continued)Based on the credit history of these classes, it is expected that these amounts will be received and are not impaired.
Consolidated 2010 2009 $’000 $’000
trade receivables 0-30 days 13,704 5,695 30-60 days 1,474 1,677 60-90 days 217 1,295 90+ days 1,162 3,277
Total trade receivables 16,557 11,944
cash at bank and short-term bank depositsAAA – – AA 105,834 184,773 A – –
105,834 184,773
Derivative financial assetsAAA – – AA 549 – A – –
549 –
(c) Liquidity riskPrudent liquidity risk management implies maintaining sufficient cash and marketable securities and the availability of funding through an adequate amount of committed credit facilities to meet obligations when due and due to close out market positions. Due to the seasonal nature of the retail business, the Group has in place flexible funding facilities to ensure liquidity risk is minimised.
Financing arrangementsThe Group had access to the following undrawn borrowing facilities at the end of the reporting period:
Consolidated 2010 2009 $’000 $’000
Floating rateExpiring beyond one year (revolving cash advance facility) 200,000 273,617
The revolving cash advance facility may be drawn at any time and has an expiry date of 28 October 2012, subject to the Group continuing to meet its covenants.
Maturities of financial liabilitiesThe tables on the following page analyse the Group’s financial liabilities into relevant maturity groups as follows:(a) based on their contractual maturities: (i) all non-derivative financial liabilities, and (ii) net and gross settled derivative financial instruments for which the contractual maturities are essential for an understanding of the
timing of the cash flows(b) based on the remaining period to the expected settlement date: (i) derivative financial liabilities for which the contractual maturities are not essential for an understanding of the timing of the cash flows
Notes to financial statements continued31 July 2010

Myer Holdings Limited Annual Report 2010 45
The amounts disclosed in the tables are the contractual undiscounted cash flows. Balances due within 12 months equal their carrying amounts as the impact of discounting is not significant. For interest rate swaps the cash flows have been estimated using forward interest rates applicable at the end of the reporting period.
Carrying Between Between Total amount Less than 6 – 12 1 and 2 2 and 5 Over contractual (assets)/ 6 months months years years 5 years cash flows liabilities Group – 31 July 2010 $’000 $’000 $’000 $’000 $’000 $’000 $’000
non-derivativesNon-interest bearing 437,568 – – – – 437,568 437,568 Variable rate 15,094 15,784 33,084 439,753 – 503,715 419,919 Fixed rate – – – – – – –
Total non-derivatives 452,662 15,784 33,084 439,753 – 941,283 857,487
DerivativesNet settled (interest rate swaps) (91) (125) (275) – – (491) (549)Gross settled– (inflow) (66,825) (28,378) – – – (95,203) – – outflow 67,893 28,518 – – – 96,411 1,208
Total derivatives 977 15 (275) – – 717 659
Carrying Between Between Total amount Less than 6 – 12 1 and 2 2 and 5 Over contractual (assets)/ 6 months months years years 5 years cash flows liabilities Group – 25 July 2009 $’000 $’000 $’000 $’000 $’000 $’000 $’000
non-derivativesNon-interest bearing 467,700 – – – – 467,700 467,700 Variable rate 14,183 14,966 36,679 710,016 – 775,844 630,604 Fixed rate 13,104 12,890 25,994 294,169 – 346,157 248,401
Total non-derivatives 494,987 27,856 62,673 1,004,185 – 1,589,701 1,346,705
DerivativesNet settled (interest rate swaps) 7,302 8,354 11,191 2,212 – 29,059 22,482 Gross settled– (inflow) (66,115) (29,752) – – – (95,867) –– outflow 74,690 31,582 – – – 106,272 10,406
Total derivatives 15,877 10,184 11,191 2,212 – 39,464 32,888

Financial report 46
2 Financial risk management (continued)(d) Fair value measurementsThe fair value of financial assets and financial liabilities must be estimated for recognition and measurement or for disclosure purposes.
As of 26 July 2009, Myer Holdings Limited has adopted the amendment to AASB 7 Financial Instruments: Disclosures which requires disclosure of fair value measurement by level of the following fair value measurement hierarchy:(a) quoted prices (unadjusted) in active markets for identical assets or liabilities (level 1)(b) inputs other than quoted prices included within level 1 that are observable for the asset or liabilities either directly (as prices) or indirectly
(derived from prices) (level 2), and(c) inputs for the asset or liability that are not based on observable market data (unobservable inputs) (level 3).
The following table presents the Group’s assets and liabilities measured and recognised at fair value at 31 July 2010. Comparative information has not been provided as permitted by the transitional provisions of the new rules.
Level 1 Level 2 Level 3 Total Group – at 31 July 2010 $’000 $’000 $’000 $’000
assetsDerivatives used for hedging – 549 – 549
Total assets – 549 – 549
liabilitiesDerivatives used for hedging – 1,208 – 1,208
Total liabilities – 1,208 – 1,208
The fair value of financial instruments that are not traded in an active market (for example, over-the-counter derivatives) is determined using valuation techniques. The Group uses quoted market prices or dealer quotes of similar instruments in order to estimate fair value for long-term debt instruments held. The fair value of interest rate swaps is calculated as the present value of the estimated future cash flows. The fair value of forward exchange contracts is determined using forward exchange market rates at the end of the reporting period. These instruments are included in level 2 and comprise derivative financial instruments.
The carrying amounts of trade receivables and payables are assumed to approximate their fair values due to their short-term nature. The fair value of financial liabilities for disclosure purposes is estimated by discounting the future contractual cash flows at the current market interest rate that is available to the Group for similar financial instruments.
3 critical accounting estimates and judgementsEstimates and judgements are continually evaluated and are based on historical experience and other factors, including expectations of future events that may have a financial impact on the entity and that are believed to be reasonable under the circumstances.
(a) Critical accounting estimates and assumptionsThe Group makes estimates and assumptions concerning the future. The resulting accounting estimates will, by definition, seldom equal the related actual results. The estimates and assumptions that have a significant risk of causing a material adjustment to the carrying amounts of assets and liabilities within the next financial period are discussed below.
(i) Income taxesThe Group is subject to income taxes in Australia. Significant judgement is required in determining the provision for income taxes. There are many transactions and calculations undertaken during the ordinary course of business for which the ultimate tax determination is uncertain. The Group recognises tax assets and liabilities based on its best estimate of the tax implications of the underlying transactions. Where the final tax outcome is different from the amounts that were initially recorded, such differences will impact the current tax provision and deferred tax assets and liabilities in the period in which the final determination is made.
(ii) ImpairmentThe Group tests annually whether goodwill and indefinite lived intangibles have suffered any impairment, in accordance with the accounting policy stated in note 1(h). The recoverable amount of cash generating units have been determined based on value in use calculations at a store level. Goodwill and certain intangibles can only be tested for impairment at the level of the Myer Group as a whole. These calculations require the use of assumptions. Refer to note 16 for details of these assumptions. Should assumptions about future cash flows prove incorrect, the Group may be at risk of impairment write-downs.
(iii) Recoverable amount of inventoryManagement have assessed the value of inventory that is likely to be sold below cost using past experience and judgement on the likely sell through rates of various items of inventory, and booked a provision for this amount. To the extent that these judgements and assumptions prove incorrect, the Company may be exposed to potential additional inventory write-downs in future periods.
Notes to financial statements continued31 July 2010

Myer Holdings Limited Annual Report 2010 47
4 segment informationManagement has determined the operating segments based on the reports reviewed by the Chief Executive Officer that are used to make strategic decisions about the allocation of resources.
The Chief Executive Officer considers the business based on the total store and product portfolio, and has identified that the Group operates in one business segment, department store retail, and one geographical segment, Australia.
5 revenue and other income
Consolidated 2010 2009 53 weeks 52 weeks $’000 $’000
revenue from continuing operationsSales revenueTotal sales value (excluding GST) 3,324,240 3,260,812 Concession sales (449,950) (417,954)
Sale of goods (excluding GST) 2,874,290 2,842,858 Sales revenue deferred under customer loyalty program (49,256) (43,942)
Revenue from sale of goods (excluding GST) 2,825,034 2,798,916
Other revenueConcessions revenue 103,712 95,347 Rental revenue 110 152
103,822 95,499 Finance revenue 2,725 5,449
Total revenue 2,931,581 2,899,864
other income from continuing operationsInsurance proceeds – 9,539 Other 60,927 42,929
60,927 52,468
Other income from continuing operations includes revenue in relation to the financial services business, forfeited lay-by deposits, customer delivery fees, commission on EFT transactions, gift card non-redemption income and profit underpinning received in relation to the Myer Melbourne store redevelopment.

Financial report 48
6 expenses
Consolidated 2010 2009 53 weeks 52 weeks $’000 $’000
profit before income tax includes the following specific expenses:Total depreciation, amortisation, write off expense 65,465 65,199
Finance costsInterest and finance charges paid/payable 44,297 82,176 Fair value (gains)/losses on interest rate swap cash flow hedges – transfer from equity 273 5,450
Finance costs expensed 44,570 87,626
Rental expense relating to operating leasesMinimum lease payments 167,443 159,062 Contingent rentals 8,537 10,222
Total rental expense relating to operating leases 175,980 169,284
Foreign exchange (gains)/lossesNet foreign exchange (gains)/losses (9,449) (5,193)Net loss/(gain) on foreign currency derivatives not qualifying as hedges – (2,465)
(9,449) (7,658)
Defined contribution superannuation expense 33,944 34,194
Impairment of assets – inventory 16,211 15,234
Employee benefits expense including defined contribution superannuation expense 456,116 454,750
profit for the period includes the following items that are unusual because of their nature, size or incidence:Expenses incurred in relation to the Initial Public Offering of shares in the Company, classified as:– Administration expenses 78,094 –– Net Finance Costs 56,785 –
Total expenses incurred in relation to the Initial Public Offering of shares in the Company 134,879 –Less: Applicable income tax benefit (38,527)
96,352 –
On 2 November 2009, the Company was listed on the Australian Securities Exchange (ASX). This process combined with the Initial Public Offer of shares in the Company, resulted in the Company incurring significant one-off expenses during the current period that do not form part of the ongoing operations of the business. Costs categorised as administration expenses represent costs incurred in executing the float process ($65.8 million, comprising advisors fees, registry fees, prospectus costs, offer advertising costs, etc.), as well as internal costs, including an expense on the issue of gift shares to employees at listing ($6.3 million) and the current period charge to the income statement in relation to retention bonuses payable to key staff ($6.0 million). IPO transaction costs have been capitalised against share capital to the extent that they relate to the raising of new equity. Costs categorised as net finance costs represent the expense recognised on cancellation of interest rate swaps at refinancing, the write-off of capitalised borrowing costs related to refinanced debt, and the recognition of the discount/premium on exchange/redemption of Myer Notes.
Notes to financial statements continued31 July 2010

Myer Holdings Limited Annual Report 2010 49
7 income tax expense
Consolidated 2010 2009 53 weeks 52 weeks $’000 $’000
(a) income tax expenseCurrent tax 13,013 27,989 Deferred tax 13,386 16,946
26,399 44,935
Income tax expense is attributable to:Profit from continuing operations 26,399 44,935
Aggregate income tax expense 26,399 44,935
Income tax expense from operations before IPO costs 64,926 44,935 Income tax benefit on IPO costs (38,527) –
26,399 44,935
Deferred income tax (revenue) expense included in income tax expense comprises:(Increase) decrease in deferred tax assets (note 15) 9,067 15,991 (Decrease) increase in deferred tax liabilities (note 20) 4,319 955
13,386 16,946
(b) numerical reconciliation of income tax expense to prima facie tax payableProfit/(loss) from continuing operations before income tax expense including IPO transaction costs and other non-recurring IPO related charges and before income tax expense 93,581 153,684
Tax at the Australian tax rate of 30% (2009: 30%) 28,074 46,105 Tax effect of amounts which are not deductible (taxable) in calculating taxable income: Non-deductible legal fees – 36 Non-deductible entertainment 87 97 Sundry items 24 151
28,185 46,389 Adjustments for current tax of prior periods (1,786) (1,454)
Income tax expense 26,399 44,935
(c) amounts recognised directly in equityAggregate current and deferred tax arising in the reporting period and not recognised in net profit or loss or other comprehensive income but directly debited or credited to equity: Net deferred tax – debited/(credited) directly to equity (notes 23 & 24(b)) 11,387 –
11,387 –
(d) tax expense/(income) relating to items of other comprehensive incomeCash flow hedges (11,249) 11,212
(11,249) 11,212
During the prior financial period, the Group was advised by the Australian Tax Office that they were undertaking an audit of the Group’s income tax affairs in relation to the 2006 and 2007 income tax years. This audit is currently still in progress, however the Company does not believe that a material exposure exists.

Financial report 50
8 current assets – cash and cash equivalents
Consolidated 2010 2009 $’000 $’000
Cash on hand 3,165 3,289 Cash at bank 102,669 181,484
105,834 184,773
(a) Risk exposureThe Group’s exposure to interest rate risk is discussed in note 2. The maximum exposure to credit risk at the end of the reporting period is the carrying amount of each class of cash and cash equivalents mentioned above.
9 current assets – trade and other receivables
Consolidated 2010 2009 $’000 $’000
Trade receivables 16,847 12,497 Provision for impairment of receivables (note(a)) (290) (553)
16,557 11,944 Receivables from related entities – –Employee share loans 285 2,136 Other receivables 3,072 3,364 Prepayments 4,131 15,453
7,488 20,953
24,045 32,897
Further information relating to loans to Key Management Personnel is set out in note 26.
(a) Impaired trade receivablesAs at 31 July 2010 current trade receivables of the Group with a nominal value of $279 thousands (2009: $561 thousands) were impaired. The amount of the provision was $290 thousands (2009: $553 thousands). The individually impaired receivables mainly relate to wholesalers.
The ageing of these receivables is as follows:
Consolidated 2010 2009 $’000 $’000
0-30 days – 3 30-60 days – 2 60-90 days – 38 90+ days 279 518
279 561
Movements in the provision for impairment of receivables are as follows:
Consolidated 2010 2009 $’000 $’000
At 25 July 2009 553 526 Provision for impairment recognised during the period 79 303 Receivables written off during the period as uncollectible (342) (276)Unused amount reversed – –
290 553
Notes to financial statements continued31 July 2010

Myer Holdings Limited Annual Report 2010 51
The creation and release of the provision for impaired receivables has been included in ‘administration expenses’ in profit or loss. Amounts charged to the allowance account are generally written off when there is no expectation of recovering additional cash.
(b) Past due but not impairedAs of 31 July 2010, trade receivables of $5,241 thousands (2009: $8,756 thousands) were past due but not impaired. These relate to a number of independent customers for whom there is no recent history of default. The ageing analysis of these trade receivables is as follows:
Consolidated 2010 2009 $’000 $’000
Up to 3 months 3,787 4,914 3 to 6 months 1,454 3,842
5,241 8,756
Based on the credit history of these classes, it is expected that these amounts will be received and are not impaired.
(c) Foreign exchange and interest rate riskInformation about the Group’s exposure to foreign currency risk and interest rate risk in relation to trade and other receivables is provided in note 2.
(d) Fair values and credit riskDue to the short-term nature of these receivables, their carrying amount is assumed to approximate their fair value.
The maximum exposure to credit risk at the end of the reporting period is the carrying amount of each class of receivables mentioned above. Refer to note 2 for more information on the risk management policy of the Group and the credit quality of the entities trade receivables.
10 current assets – inventories
Consolidated 2010 2009 $’000 $’000
Retail inventories 352,813 355,572
11 Derivative financial instruments
Consolidated 2010 2009 $’000 $’000
current assetsInterest rate swap contracts – –Forward foreign exchange contracts – –
Total current derivative financial instrument assets – –
non current assetsInterest rate swap contracts 549 –
Total non current derivative financial instrument assets 549 –
current liabilitiesForward foreign exchange contracts 1,208 10,406
Total current derivative financial instrument liabilities 1,208 10,406
non current liabilitiesInterest rate swap contracts – 22,482
Total non current derivative financial instrument liabilities – 22,482
(a) Instruments used by the GroupThe Group is party to derivative financial instruments in the normal course of business in order to hedge exposure to fluctuations in interest and foreign exchange rates in accordance with the Group’s financial risk management policies (refer to note 2).

Financial report 52
11 Derivative financial instruments (continued)(i) Interest rate swap contractsBank loans of the Group currently bear an average variable interest rate of 6.97% (2009: 4.41%). It is policy to protect part of the loans from exposure to increasing interest rates. Accordingly, the Group has entered into interest rate swap contracts under which it is obliged to receive interest at variable rates and to pay interest at fixed rates.
Swaps currently in place cover approximately 12% (2009: 75%) of the Group’s debt facility (refer to note 19 for details of the Group’s borrowings). The notional principal amounts used in the swap agreements match the terms of the debt facilities. In relation to the debt facilities the fixed interest rates range between 4.35% and 4.75% (2009: 4.29% and 7.29%) and the variable rates under the swap agreements are the Bank Bill Swap Rate bid (BBSY Bid).
The contracts require settlement of net interest receivable or payable each three months. The contracts are settled on a net basis.
The gain or loss from remeasuring the hedging instruments at fair value is deferred in equity in the hedging reserve, to the extent that the hedge is effective, and reclassified into profit and loss when the hedged interest expense is recognised. In the period ended 31 July 2010, $29.3 million was reclassified in profit and loss (2009: $5.4 million) and included in finance cost or IPO costs. There was no hedge ineffectiveness in the current period.
(ii) Forward exchange contracts – cash flow hedgesThe Group makes purchases in numerous currencies primarily US dollars. In order to protect against exchange rate movements, the Group has entered into forward exchange contracts to purchase US dollars.
These contracts are hedging highly probable forecasted purchases for the ensuing financial period. The contracts are timed to mature when payments for shipments of inventory are scheduled to be made.
The portion of the gain or loss on the hedging instrument that is determined to be an effective hedge is recognised directly in equity. When the cash flows occur, the Group adjusts the initial measurement of the inventory recognised in the balance sheet by the related amount deferred in equity.
During the period ended 31 July 2010, a gain of $1.6 million (2009: loss $2.3 million) was reclassified from equity and included in the cost of inventory. There was no hedge ineffectiveness in the current or prior period.
(iii) Forward exchange contracts – held for tradingIn the prior period the Group had further entered into forward exchange contracts which were economic hedges but did not satisfy the requirements for hedge accounting. These contracts were subject to the same risk management policies as all other derivative contracts, see note 2 for details. However, they are accounted for as held for trading.
The documentation supporting these contracts did not meet the requirements for hedge accounting under AASB 139 Financial Instruments: Recognition and Measurement. As a result, the contracts were fair valued by comparing the contracted rate to the current market rate for a contract with the same remaining period to maturity, and any changes in fair values are taken to profit or loss immediately.
At balance date the fair value of these contracts were nil (2009: nil). There was no gain or loss (2009: $2.5 million gain) recognised in the consolidated current period profit or loss for the movement in the fair value from the prior period.
(b) Risk exposuresInformation about the Group’s exposure to credit risk, foreign exchange and interest rate risk is provided in note 2. The maximum exposure to credit risk at the end of the reporting period is the carrying amount of each class of derivative financial assets mentioned above.
12 current assets – non-current assets classified as held for sale
Consolidated 2010 2009 $’000 $’000
Land and buildings – 28,544
Total Non-current assets classified as held for sale – 28,544
In a prior period the Group announced it was seeking expressions of interest in relation to the disposal of the three regional store properties owned in Bendigo, Dubbo and Wagga. As a result, these properties were classified as held for sale. As these properties are yet to be sold they have now been reclassified back into property, plant and equipment.
Notes to financial statements continued31 July 2010

Myer Holdings Limited Annual Report 2010 53
13 non current assets – other financial assets
Consolidated 2010 2009 $’000 $’000
Available for sale financial assets 6,004 7,635
6,004 7,635
Available for sale financial assets represent the consolidated entity’s interest in equity securities of Harsyn Pty Ltd (holding company of Harris Scarfe Australia Pty Ltd) and Australian Geographic Retail Pty Ltd. These equity securities do not have a quoted market price or active market, and therefore their fair value cannot be reliably measured. As a result they are carried at cost.
14 non-current assets – property, plant and equipment
Freehold Freehold Fixtures Plant & Capital works land buildings and fittings equipment in progress Total consolidated $’000 $’000 $’000 $’000 $’000 $’000
at 26 July 2008Cost – – 215,982 118,545 41,180 375,707 Accumulated depreciation – – (54,317) (26,525) – (80,842)
Net book amount – – 161,665 92,020 41,180 294,865
period ended 25 July 2009Opening net book amount – – 161,665 92,020 41,180 294,865 Additions – – 26,666 33,471 64,306 124,443 Transfer between classes – – (9,438) 40,855 (31,417) –Assets written off (407) (2) – (409)Depreciation charge – – (27,854) (19,346) – (47,200)
Closing net book amount – – 150,632 146,998 74,069 371,699
at 25 July 2009Cost – – 241,454 192,868 74,069 508,391 Accumulated depreciation – – (90,822) (45,870) – (136,692)
Net book amount – – 150,632 146,998 74,069 371,699
period ended 31 July 2010Opening net book amount – – 150,632 146,998 74,069 371,699 Assets reclassified from held for sale – cost 10,100 19,500 – – – 29,600 Assets reclassified from held for sale – accumulated depreciation – (1,056) – – – (1,056)Additions – – 871 6,431 106,751 114,053 Transfer between classes – – 104,149 2,462 (106,997) (386)Assets written off – cost – – (3,439) (8,636) – (12,075)Assets written off – accumulated depreciation – – 2,840 5,263 – 8,103 Depreciation charge – (975) (26,224) (14,689) – (41,888)
Closing net book amount 10,100 17,469 228,829 137,829 73,823 468,050
at 31 July 2010Cost 10,100 19,500 343,035 193,125 73,823 639,583 Accumulated depreciation – (2,031) (114,206) (55,296) – (171,533)
Net book amount 10,100 17,469 228,829 137,829 73,823 468,050

Financial report 54
15 non-current assets – Deferred tax assets
Consolidated 2010 2009 $’000 $’000
the balance comprises temporary differences attributable to:Property, plant, equipment and software – 9,891 Employee benefits 18,544 19,471 Non-employee provisions 26,708 32,716 Deferred income 3,636 11,943 Amortising deductions 19,404 –Other 11,822 22,138
80,114 96,158 Set off of deferred tax liabilities pursuant to set-off provisions (note 20) (9,277) (4,958)
Net deferred tax assets 70,837 91,200
movements:Opening balance at 25 July 2009 96,158 102,794 Credited/(charged) to profit or loss (note 7) (9,067) (15,991)Credited/(charged) directly to equity 4,272 –Credited/(charged) to other comprehensive income (11,249) 12,124 Reallocation from deferred tax liabilities – (2,767)
Closing balance at 31 July 2010 80,114 96,158
Notes to financial statements continued31 July 2010

Myer Holdings Limited Annual Report 2010 55
16 non-current assets – intangible assets
Brand names and Goodwill trademarks1 Software Lease rights Total consolidated $’000 $’000 $’000 $’000 $’000
at 26 July 2008Cost 349,534 391,900 122,424 48,540 912,398 Accumulated amortisation – (805) (11,395) (3,240) (15,440)
Net book amount 349,534 391,095 111,029 45,300 896,958
period ended 25 July 2009Opening net book amount 349,534 391,095 111,029 45,300 896,958 Acquisition of business – – – – –Other additions – – 28,989 – 28,989 Assets written off – – – – –Amortisation charge2 – (345) (11,637) (5,103) (17,085)
Closing net book amount 349,534 390,750 128,381 40,197 908,862
at 25 July 2009Cost 349,534 391,900 151,413 48,540 941,387 Accumulated amortisation – (1,150) (23,032) (8,343) (32,525)
Net book amount 349,534 390,750 128,381 40,197 908,862
period ended 31 July 2010Opening net book amount 349,534 390,750 128,381 40,197 908,862 Acquisition of business – – – – –Other additions – 120 29,449 – 29,569 Transfer between classes – – 386 – 386 Assets written off – – – – –Amortisation charge2 – (345) (12,525) (4,927) (17,797)
Closing net book amount 349,534 390,525 145,691 35,270 921,020
at 31 July 2010Cost 349,534 392,020 181,248 48,540 971,342 Accumulated amortisation – (1,495) (35,557) (13,270) (50,322)
Net book amount 349,534 390,525 145,691 35,270 921,020
1 Brand names and trademarks include the Myer brand name, which has an indefinite useful life. The carrying amount of the Myer brand name at 31 July 2010 was $385 million (2009: $385 million).
2 Amortisation of $17.8 million (2009: $17.1 million) is included in administration and selling expenses in profit or loss.
(a) Impairment tests for goodwill and intangibles with an indefinite useful lifeThe goodwill arising on the acquisition of the Myer business cannot be allocated to the Group’s individual cash generating units (the Group’s stores), and hence has been allocated to the business as a whole. Similarly, the Myer brand name, which has an indefinite useful life, has been allocated to the business as a whole.
AASB 136 Impairment of Assets requires goodwill and intangible assets with an indefinite useful life to be tested annually for impairment. In testing these assets for impairment, the recoverable amount of the business has been determined using a value in use calculation. This calculation uses cash flow projections based on financial budgets approved by management covering a five-year period. Cash flows beyond five periods are extrapolated using an estimated growth rate of 3%. Key assumptions used in the calculation were as follows:
discount rate (pre-tax) 12.7% –terminal growth rate 3% –operating gross profit margin 40% –
Neither goodwill nor the Myer brand were impaired at the end of the reporting period. Sensitivity analysis on reasonably possible changes in assumptions did not result in an outcome where an impairment would be required.

Financial report 56
17 current liabilities – trade and other payables
Consolidated 2010 2009 $’000 $’000
Trade payables 216,588 224,471 Payables to related entities – 2,778 Other payables 220,980 240,451
437,568 467,700
Trade and other payables are non-interest bearing.
18 current liabilities – provisions
Consolidated 2010 2009 $’000 $’000
Employee benefits 77,542 81,953 Workers’ compensation 17,324 15,153 Sales returns 3,446 3,285 Other 6,139 5,912
104,451 106,303
(a) Workers’ compensationThe amount represents a provision for potential workers’ compensation claims in certain states.
(b) Sales returnsThe amount represents a provision for potential sales returns under the Group’s returns policy.
(c) Movements in provisionsMovements in each class of provision during the financial period, other than employee benefits, are set out below.
Workers’ Sales compensation returns Other Total $’000 $’000 $’000 $’000
2010 consolidatedcurrentCarrying amount at start of period 15,153 3,285 5,912 24,350 Additional provisions recognised during the period 5,983 3,446 3,233 12,662 Amounts utilised during the period (3,812) (3,285) (3,006) (10,103)
Carrying amount at end of period 17,324 3,446 6,139 26,909
Workers’ Sales compensation returns Other Total $’000 $’000 $’000 $’000
2009 consolidatedcurrentCarrying amount at start of period 9,365 3,488 14,895 27,748 Additional provisions recognised during the period 9,222 3,285 7,708 20,215 Amounts utilised during the period (3,434) (3,488) (16,691) (23,613)
Carrying amount at end of period 15,153 3,285 5,912 24,350
Notes to financial statements continued31 July 2010

Myer Holdings Limited Annual Report 2010 57
19 Borrowings
Consolidated 2010 2009 $’000 $’000
non-current borrowingsBank loans 419,919 630,604 Myer Notes – 248,401
Total borrowings 419,919 879,005
(a) Structure of debtThe debt funding of the Group at 31 July 2010 comprised bank loan facilities. The loan facilities comprise the following:
Term cash advance facility: $425 million; and –Revolving cash advance facility: $200 million –
These loans were established on 29 October 2009, and drawn down for the first time on 6 November 2009. At balance date, the following amounts remain drawn down:
2010 2009 $’000 $’000
Term cash advance facility 425,000 –Senior term debt – 645,000 Myer Notes – 255,000
425,000 900,000 Less borrowing costs (5,081) (20,995)
Net borrowings per balance sheet 419,919 879,005
(i) Bank loan facilitiesThe terms and conditions of the Group’s bank loan facilities are as follows:
Loan facilities Description Term
Term cash advance facility Term loan facility 3 years from 29 October 2009Revolving cash advance facility Revolving facility 3 years from 29 October 2009
The Term cash advance facility is a term loan facility repayable at maturity on 29 October 2012. Any amounts repaid during the term may not be redrawn. The Revolving cash advance facility is revolving, so that amounts repaid may be redrawn during its term.
During the current period the previous Senior term debt facility was repaid.
(ii) Myer NotesIn a prior period, the Group issued 2,550,000 Myer Notes at an issue price of $100 to fund the repayment of existing Subordinated Debt of $225 million. The notes were listed on the Australian Securities Exchange with a maturity date of 15 March 2013.
As part of the Initial Public Offer of shares in the Company and the listing of shares on the Australian Securities Exchange, Myer Noteholders were able to exchange Myer Notes for shares at 97.5% of the final share price under the offer. Any outstanding Notes were redeemed by Myer at a premium of 2.5% to the principal amount outstanding on the Myer Notes. On 6 November 2009, $119.4 million Notes were exchanged for Myer shares and on 4 December 2009 the remaining Notes of $135.6 million were redeemed.
(b) SecurityThe loan facilities in place at 31 July 2010 are unsecured, subject to various representations, undertakings, events of default and review events, which are usual for facilities of this nature.
The Senior term debt facilities and the Myer Notes repaid during the current period were secured by fixed and floating charges over the shares and assets of certain Group companies, and real property mortgages over the Group’s property assets. These securities were discharged on 4 December 2009 upon repayment of the relevant facilities.

Financial report 58
19 Borrowings (continued)(c) Fair valueThe carrying amounts and fair values of borrowings at balance date are:
2010 2009 Carrying Fair Carrying Fair amount value amount value Group $’000 $’000 $’000 $’000
Bank loans 419,919 419,919 630,604 630,604 Myer Notes – – 248,401 248,401
419,919 419,919 879,005 879,005
The fair value of existing borrowings equals their carrying amount, as the impact of discounting is not significant.
(d) Risk exposuresDetails of the Group’s exposure to risks arising from current and non-current borrowings are set out in note 2.
20 non-current liabilities – Deferred tax liabilities
Consolidated 2010 2009 $’000 $’000
the balance comprises temporary differences attributable to:Amounts recognised in profit or lossProperty, plant, equipment and software 5,091 –Deferred stamp duty 1,424 1,557 Brand name 1,622 1,725 Derivative financial instruments 165 1,014 Sundry items 975 662
9,277 4,958
Set off of deferred tax liabilities pursuant to set-off provisions (note 15) (9,277) (4,958)
Net deferred tax liabilities – –
movements:Balance at beginning of period 4,958 6,770 Charged/(credited) to profit or loss (note 7) 4,319 955 Reallocation to deferred tax assets – (2,767)
Balance at end of period 9,277 4,958
Notes to financial statements continued31 July 2010

Myer Holdings Limited Annual Report 2010 59
21 non-current liabilities – provisions
Consolidated 2010 2009 $’000 $’000
Employee benefits 4,331 5,363 Fixed lease rental increases 45,841 51,257 Unfavourable lease contracts 5,322 7,775 Other 5,000 5,000
60,494 69,395
(b) Fixed lease rental increasesThe Group is a party to a number of leases that include fixed rental increases during their term. In accordance with AASB 117 Leases, the total rentals over these leases are being expensed over the lease term on a straight-line basis. The above provision reflects the difference between the future committed payments under these leases and the total future expense.
(c) Unfavourable lease contractsAt the date the Myer business was acquired, the business was party to a number of unfavourable lease contracts compared to market rentals payable at the time. As part of the acquisition accounting, a provision was raised for the difference between the rentals committed under these leases and the market value of these leases.
(d) Movements in provisionsMovements in each class of provision during the financial period, other than employee benefits, are set out below.
Fixed lease Unfavourable rental increases lease contracts Other Total $’000 $’000 $’000 $’000
2010 consolidatedCarrying amount at start of period 51,257 7,775 5,000 64,032 Additional amounts recognised 856 – – 856 Amounts utilised during the period (6,272) (2,453) – (8,725)
Carrying amount at end of period 45,841 5,322 5,000 56,163
2009 consolidatedCarrying amount at start of period 57,289 10,761 5,000 73,050 Additional amounts recognised – – – –Amounts utilised during the period (6,032) (2,986) – (9,018)
Carrying amount at end of period 51,257 7,775 5,000 64,032
22 non-current liabilities – retirement benefit obligations(a) Superannuation planThe Group currently contributes to a number of superannuation funds, most of which are defined contribution funds, with one defined benefit fund. The defined benefit fund is currently administered through Mercer Human Resource consulting within a Mercer Master Trust arrangement. Myer employees who were members of the Coles Myer Defined Benefit Fund were transferred to the Myer Fund effective 2 June 2006 as a consequence of the acquisition of the Myer business. On transfer of Myer employees to the new fund, assets representing the employees’ benefit entitlements at the date of transfer were transferred with the employees’ entitlements.
The following sets out details in respect of the defined benefit section only. The expense recognised in relation to the defined contribution plans is disclosed in note 6.
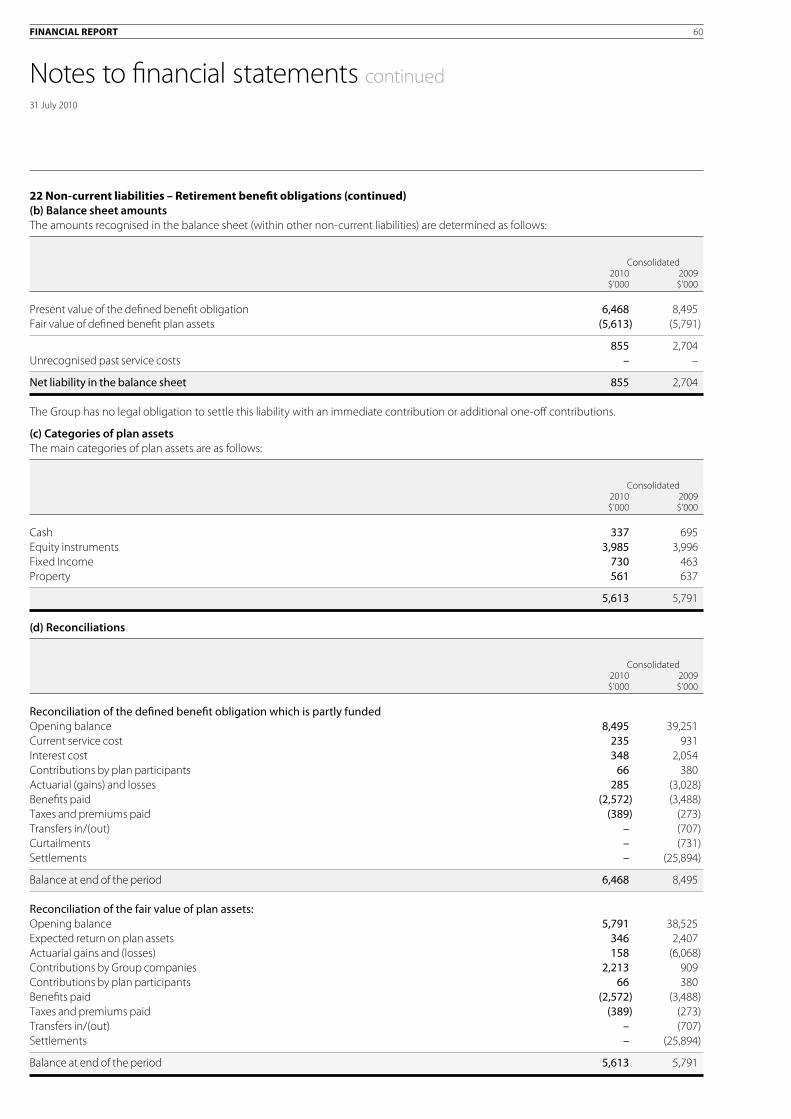
Financial report 60
22 non-current liabilities – retirement benefit obligations (continued)(b) Balance sheet amountsThe amounts recognised in the balance sheet (within other non-current liabilities) are determined as follows:
Consolidated 2010 2009 $’000 $’000
Present value of the defined benefit obligation 6,468 8,495 Fair value of defined benefit plan assets (5,613) (5,791)
855 2,704 Unrecognised past service costs – –
Net liability in the balance sheet 855 2,704
The Group has no legal obligation to settle this liability with an immediate contribution or additional one-off contributions.
(c) Categories of plan assetsThe main categories of plan assets are as follows:
Consolidated 2010 2009 $’000 $’000
Cash 337 695 Equity instruments 3,985 3,996 Fixed Income 730 463 Property 561 637
5,613 5,791
(d) Reconciliations
Consolidated 2010 2009 $’000 $’000
Reconciliation of the defined benefit obligation which is partly fundedOpening balance 8,495 39,251 Current service cost 235 931 Interest cost 348 2,054 Contributions by plan participants 66 380 Actuarial (gains) and losses 285 (3,028)Benefits paid (2,572) (3,488)Taxes and premiums paid (389) (273)Transfers in/(out) – (707)Curtailments – (731)Settlements – (25,894)
Balance at end of the period 6,468 8,495
Reconciliation of the fair value of plan assets:Opening balance 5,791 38,525 Expected return on plan assets 346 2,407 Actuarial gains and (losses) 158 (6,068)Contributions by Group companies 2,213 909 Contributions by plan participants 66 380 Benefits paid (2,572) (3,488)Taxes and premiums paid (389) (273)Transfers in/(out) – (707)Settlements – (25,894)
Balance at end of the period 5,613 5,791
Notes to financial statements continued31 July 2010

Myer Holdings Limited Annual Report 2010 61
(e) Amounts recognised in profit or lossThe amounts recognised in profit or loss are as follows:
Consolidated 2010 2009 $’000 $’000
Current service cost 235 931 Interest cost 348 2,054 Expected return on plan assets (346) (2,407)Effect of curtailments (gain)/loss – (731)
Total included in employee benefits expense 237 (153)
Actual return on plan assets 504 (3,661)
(f) Amounts recognised in other comprehensive incomeThe amounts recognised in other comprehensive income were as follows:
Consolidated 2010 2009 $’000 $’000
Actuarial (loss)/gain for the period (127) (3,040)
Cumulative actuarial (losses)/gains recognised in other comprehensive income (5,435) (5,308)
(g) Principal actuarial assumptionsThe principal actuarial assumptions used (expressed as weighted averages) were as follows:
Consolidated 2010 2009 $’000 $’000
Discount rate 4.20% 4.80%Expected return on plan assets 7.00% 6.80%Future salary increases 3.50% 4.00%
The expected rate of return on plan assets has been based on historical and future expectations of returns for each of the major categories of asset classes as well as the expected and actual allocation of plan assets to these major categories. This resulted in the selection of a 7.0% rate of return net of taxes and fees.
(h) Employer contributionsEmployer contributions to the defined benefit section of the plan are based on recommendations by the plan’s actuary. Actuarial assessments are made at no more than three-yearly intervals. However, due to the state of financial markets during the period, the Company commissioned the actuary to provide more regular updates on the funds financial position.
The objective of funding is to ensure that the benefit entitlements of members and other beneficiaries are fully funded by the time they become payable. To achieve this objective, the actuary has adopted a method of funding benefits known as the aggregate funding method. This funding method seeks to have benefits funded by means of a total contribution which is expected to be a constant percentage of members’ salaries over their working lifetimes.
Total employer contributions expected to be paid by Group companies for the period ending 30 July 2011 are $171 thousand.
The economic assumptions used by the actuary to make the funding recommendations were a long-term investment earning rate of 7.0% pa (net of fees and taxes), a salary increase rate of 3.5% pa and a discount rate of 4.2%.

Financial report 62
22 non-current liabilities – retirement benefit obligations (continued)(i) Historic summary
Consolidated 2010 2009 $’000 $’000
Defined benefit plan obligation (6,468) (8,495)Plan assets 5,613 5,791
Deficit (855) (2,704)
Experience adjustments (gain)/loss – plan assets (158) 6,068 Experience adjustments (gain) – plan liabilities 256 (3,208)
23 contributed equity
2010 2009 2010 2009 Number Number of shares of shares $’000 $’000
Opening balance 457,769,439 454,190,664 84,946 84,872 Ordinary shares issued under Initial Public Offering 76,387,581 – 313,189 –Ordinary shares issued under Myer Notes exchange 29,852,728 – 122,396 –Ordinary shares issued under employee gift offer 1,449,888 – 5,945 –Options exercised at $0.01 per ordinary share during the period 5,211,113 3,548,220 52 35 Options exercised at $1.27 per ordinary share during the period 513,333 30,555 652 39 Shares issued to Myer Equity Plans Trust at market value during the period 10,333,802 – 36,750 –
581,517,884 457,769,439 563,930 84,946 Less: Transaction costs arising on share issue net of tax – – (9,968) –
581,517,884 457,769,439 553,962 84,946
treasury sharesOpening balance – – – –Shares issued to Myer Equity Plans Trust (10,333,802) – (36,750) –Shares allocated on exercise of options at $0.01 during the period 9,551,905 – 96 –Shares allocated on exercise of options at $1.27 during the period 506,881 – 643 –Shares acquired by Employee Share Scheme Trust (262,000) – (823) –
Closing balance of Treasury shares (537,016) – (36,834) –
Closing balance 580,980,868 457,769,439 517,128 84,946
(a) Ordinary sharesOrdinary shares entitle the holder to participate in dividends and the proceeds on winding up of the Company in proportion to the number of and amounts paid on the shares held.
On a show of hands every holder of ordinary shares present at a meeting in person or by proxy, is entitled to one vote, and upon a poll each share is entitled to one vote.
(b) Treasury sharesTreasury shares are shares in Myer Holdings Limited that are held by the Myer Equity Plans Trust for the purposes of issuing shares under the Myer Equity Incentive Plan (see note 37 for further information).
(c) Employee share and option schemesInformation relating to the employee share and option schemes, including details of shares issued under the scheme, is set out in note 37.
Notes to financial statements continued31 July 2010

Myer Holdings Limited Annual Report 2010 63
(d) Share issue and exercise of optionsAt various dates during the 2010 reporting period, 5,211,113 share options that had vested were converted to ordinary shares at an exercise price of $0.01 per share. On 29 October 2009, the Company issued a further 513,333 new ordinary shares at $1.27 per share.
On 2 November 2009, the company was listed on the Australian Securities Exchange (ASX). At this time the company held an Initial Public Offer of shares in the Company and 76,387,581 shares were issued. Furthermore Myer Noteholders were given the opportunity to exchange Myer Notes at a 2.5 % discount and as a result a further 29,852,728 shares were issued under the Myer Notes exchange. During the IPO process eligible employees were offered the opportunity to acquire, at no cost, shares up to the value of $725. Under the gift scheme 1,449,888 shares were issued.
(e) Capital risk managementThe Group’s objectives when managing capital are to safeguard their ability to continue as a going concern, so that they can continue to provide returns for shareholders and benefits for other stakeholders and to maintain optimal capital structure to reduce the cost of capital.
In order to maintain or adjust the capital structure, the Group may adjust the amount of dividends paid to shareholders, return capital to shareholders, issue new shares or sell assets to reduce debt.
Consistently with others in the industry, the Group monitors capital on the basis of the gearing ratio. This ratio is calculated as net debt divided by total capital. Net debt is calculated as total borrowings less cash and cash equivalents. Total capital is calculated as ‘equity’ as shown in the balance sheet plus net debt.
The gearing ratios at 31 July 2010 and 25 July 2009 were as follows:
Consolidated 2010 2009 Notes $’000 $’000
Total borrowings 19 419,919 879,005 Less: cash and cash equivalents 8 (105,834) (184,773)
Net debt 314,085 694,232 Total equity 857,440 380,122
Total capital 1,171,525 1,074,354
Gearing ratio 27% 65%
The decrease in the gearing ratio during 2010 was driven primarily from the increase in equity as a result of listing the Company on the Australian Securities Exchange (ASX) and the Initial Public Offer of shares in the Company. The Company’s policy in relation to dividend payments to shareholders is to maintain a payment ratio of between 70 – 80% of net profit after tax.
24 reserves and retained profits(a) Retained profitsMovements in retained profits were as follows:
Consolidated 2010 2009 $’000 $’000
Balance at beginning of period 314,446 207,825 Items of other comprehensive income recognised directly in retained earnings: Actuarial (losses)/gains on retirement benefit obligation, net of tax (note 22 (f)) (127) (2,128)Dividends (61,031) –Net profit/(loss) for the period 67,182 108,749
Balance at end of period 320,470 314,446

Financial report 64
24 reserves and retained profits (continued)(b) Reserves
Consolidated 2010 2009 $’000 $’000
Share-based payments (i) 19,754 6,890 Cash flow hedges (ii) 88 (26,160)
19,842 (19,270)
Movements:Share-based paymentsBalance at beginning of period 6,890 4,390 Share-based payments expense recognised 5,749 2,500 Income tax (notes 7, 15 and 20) 7,115 –
Balance at end of period 19,754 6,890
Cash flow hedgesBalance at beginning of period (26,160) –Revaluation – gross 9,753 (42,690)Deferred tax (notes 15 and 20) (2,925) 12,807 Transfer to net profit – gross 352 2,985 Deferred tax (notes 15 and 20) (106) (895)Transfer to net profit IPO related – gross 29,019 –Deferred tax (notes 15 and 20) (8,706) –Transfer to inventory and other assets – gross (1,627) 2,333 Deferred tax (notes 15 and 20) 488 (700)
Balance at end of period 88 (26,160)
(i) Share-based paymentsThe Share-based payments reserve is used to recognise the fair value of options issued to employees but not exercised.
(ii) Cash flow hedgesThe hedging reserve is used to record gains or losses on a hedging instrument in a cash flow hedge that are recognised directly in equity, as described in note 1(m). Amounts are recognised in profit and loss when the associated hedged transaction affects profit and loss.
Notes to financial statements continued31 July 2010

Myer Holdings Limited Annual Report 2010 65
25 Dividends
Consolidated 2010 2009 $’000 $’000
(a) Ordinary sharesInterim dividend for the period ended 31 July 2010 of 10.5 cents (2009: nil) per fully paid share paid 6 May 2010 (2009: nil)
Fully franked based on tax paid at 30% 61,031 –
(b) Dividends not recognised at the end of the reporting periodIn addition to the above dividends, since period end the Directors have recommended the payment of a final dividend of 11.5 cents per fully paid ordinary share, (2009: nil) fully franked based on tax paid at 30%. The aggregate amount of the proposed dividend expected to be paid on 4 November 2010, but not recognised as a liability at period end, is: 66,813 –
(c) Franked dividendsThe franked portions of the final dividends recommended after 31 July 2010 will be franked out of existing franking credits or out of franking credits arising from the payment of income tax in the period ending 30 July 2011.
Consolidated 2010 2009 $’000 $’000
Franking credits available for subsequent financial periods based on a tax rate of 30% (2009: 30%) 73,500 67,612
The above amounts represent the balance of the franking account as at the reporting date, adjusted for:(a) franking credits that will arise from the payment of the amount of the provision for income tax(b) franking debits that will arise from the payment of dividends recognised as a liability at the reporting date, and(c) franking credits that will arise from the receipt of dividends recognised as receivables at the reporting date.
The consolidated amounts include franking credits that would be available to the parent entity if distributable profits of subsidiaries were paid as dividends.
The impact on the franking account of the dividend recommended by the Directors since the end of the reporting period, but not recognised as a liability at the reporting date, will be a reduction in the franking account of $29 million (2009: nil).
26 Key management personnel disclosures(a) Key Management Personnel compensationKey Management Personnel compensation for the period ended 31 July 2010 is set out below. The Key Management Personnel of the Group are persons having the authority and responsibility for planning, directing and controlling the Company’s activities directly or indirectly, including the Directors of Myer Holdings Limited.
Consolidated 2010 2009 $ $
Short-term employee benefits 8,380,113 7,783,471 Post-employment benefits 266,191 308,303 Long-term benefits 1,021,362 79,111 Termination and other benefits 3,212,616 – Share-based payments 3,701,454 999,635
16,581,736 9,170,520 Other personnel no longer Key Management Personnel1 – 4,632,762
16,581,736 13,803,282
1 Effective for the current financial period the Company has reassessed its KMP and as a result any personnel no longer meeting the definition of KMP have been included here.
Detailed remuneration disclosures are provided in the Remuneration Report on pages 15 to 26.

Financial report 66
26 Key management personnel disclosures (continued)(b) Equity instrument disclosures relating to Key Management Personnel(i) Options provided as remuneration and shares issued on exercise of such optionsDetails of options provided as remuneration and shares issued on the exercise of such options, together with terms and conditions of the options, can be found in the remuneration report on pages 15–26.
(ii) Option holdingsThe numbers of options over ordinary shares in the Company held during the financial period by each Director of Myer Holdings Limited and other Key Management Personnel of the Group, including their personally related parties, are set out below.
2010 Balance at start Granted as Other Balance at end Vested and Name of the period compensation Exercised changes of the period exercisable Unvested
Directors of myer holdings limitedHoward McDonald 400,000 – (373,333) – 26,667 – 26,667 Bernard Brookes 5,600,000 7,380,394 (5,120,000) – 7,860,394 – 7,860,394 Tom Flood 150,000 – (140,000) – 10,000 – 10,000 William Wavish 5,600,000 – (5,600,000) – – – Rupert Myer AM – – – – – – – Anne Brennan – – – – – – – Peter Hay – – – – – – –
other Key management personnel of the GroupMark Ashby 1,000,000 420,168 – – 1,420,168 333,333 1,086,835 Penny Winn 900,000 420,168 – – 1,320,168 166,667 1,153,501 Greg Travers 684,446 420,168 (625,778) – 478,836 – 478,836 Nick Abboud 658,444 420,168 (62,576) – 1,016,036 30,000 986,036
All vested options are exercisable at the end of the period.
William Wavish has been included as a director for the start of 2010 but due to his resignation as a Director on 4 August 2009 his option holdings have been removed in ‘Other changes’.
2009 Balance at start Granted as Other Balance at end Vested and Name of the period compensation Exercised changes of the period exercisable Unvested
Directors of myer holdings limitedHoward McDonald 400,000 – – – 400,000 111,111 288,889 Bernard Brookes 6,800,000 – (1,200,000) – 5,600,000 – 5,600,000 Tom Flood 150,000 – – – 150,000 41,667 108,333 William Wavish 6,800,000 – (1,200,000) 5,600,000 – 5,600,000 Rupert Myer AM – – – – – –
other Key management personnel of the GroupMark Ashby 1,000,000 – – – 1,000,000 – 1,000,000 Penny Winn 500,000 400,000 – – 900,000 – 900,000 Greg Travers 831,112 – (146,666) – 684,446 – 684,446 Nick Abboud 200,000 500,000 (41,556) – 658,444 – 658,444 Other personnel no longer Key Management Personnel 2,984,667 400,000 (752,889) – 2,631,778 282,109 2,349,669
Notes to financial statements continued31 July 2010

Myer Holdings Limited Annual Report 2010 67
(iii) Share holdingsThe number of shares in the Company held during the financial period by each Director of Myer Holdings Limited and other Key Management Personnel of the Group, including their personally related parties, are set out below. There were no shares granted during the reporting period as compensation.
Received during Other Balance at the period on changes Balance at 2010 the start of the exercise during the end of Name the period of options the period the period
Directors of myer holdings limitedordinary sharesHoward McDonald 1,650,000 373,333 24,390 2,047,723 Bernard Brookes 6,650,000 5,120,000 (703,370) 11,066,630 Tom Flood 250,000 140,000 – 390,000 William Wavish 6,650,000 – (6,650,000) –Rupert Myer AM – – 725,710 725,710 Anne Brennan – – 53,658 53,658 Peter Hay – – 12,195 12,195
other Key management personnel of the Groupordinary sharesMark Ashby 220,000 – (34,743) 185,257 Penny Winn 200,000 – – 200,000 Greg Travers 1,615,554 625,778 (224,192) 2,017,140 Nick Abboud 391,556 62,576 (166,000) 288,132
William Wavish has been included as a director for the start of 2010 but due to his resignation as a Director on 4 August 2009 his share holdings have been removed in ‘Other changes during the period’.
Received during Other Balance at the period on changes Balance at 2009 the start of the exercise during the end of Name the period of options the period the period
Directors of myer holdings limitedordinary sharesHoward McDonald 1,500,000 – 150,000 1,650,000 Bernard Brookes 4,950,000 1,200,000 500,000 6,650,000 Tom Flood 100,000 – 150,000 250,000 William Wavish 4,950,000 1,200,000 500,000 6,650,000 Rupert Myer AM – – – –John Lovering 1,666,667 – (1,666,667) –
other Key management personnel of the Groupordinary sharesMark Ashby 150,000 – 70,000 220,000 Penny Winn 200,000 – – 200,000 Greg Travers 1,268,888 146,666 200,000 1,615,554 Nick Abboud 150,000 41,556 200,000 391,556 Other personnel no longer Key Management Personnel 3,683,999 752,889 200,000 4,636,888

Financial report 68
26 Key management personnel disclosures (continued)(c) Loans to Key Management PersonnelDetails of loans made to Directors of Myer Holdings Limited and other Key Management Personnel of the Group, including their personally related parties, are set out below.
(i) Aggregates for Key Management Personnel
Balance Interest paid Balance Number in at the start and payable for Interest at the end group at the end of the period the period not charged of the period of the period Group $ $ $ $
2010 46,197 406 – – 12009 244,500 8,087 – 46,197 1
(ii) Individuals with loans above $100,000 during the financial period
Balance Interest paid Balance Highest at the start and payable Interest at the end indebtedness 2009 of the period for the period not charged of the period during the period Name $ $ $ $
Nick Abboud 244,500 8,087 – 46,197 244,500
In 2010 there were no loans to individuals that exceeded $100,000 at any time.
Certain Key Management Personnel obtained loans from the company and Myer Pty Ltd for the purpose of acquiring shares in the Company. These loans were made on terms equivalent to those that would prevail in arm’s-length transactions.
No write-down or allowances for doubtful receivables have been recognised in relation to any loans made to Key Management Personnel.
(d) Other transactions with Key Management PersonnelThere were no transactions with Key Management Personnel or entities related to them, other than compensation.
27 remuneration of auditorsDuring the period the following fees were paid or payable for services provided by the auditor of the Group, and its related practices:
Consolidated 2010 2009 53 weeks 52 weeks $ $
(a) Assurance servicesAudit services PricewaterhouseCoopers Australian firm Audit and review of financial statements and other audit work under the Corporations Act 2001 285,800 250,000
Total remuneration for audit services 285,800 250,000
Other assurance servicesPricewaterhouseCoopers Australian firm Audit of rent certificates 43,500 30,065 Other 105,570 97,500
Total remuneration for other assurance services 149,070 127,565
Total remuneration for assurance services 434,870 377,565
(b) Taxation services PricewaterhouseCoopers Australian firm Tax consulting and tax advice 248,516 321,167
Total remuneration for taxation services 248,516 321,167
(c) Initial Public Offering services PricewaterhouseCoopers Australian firm Initial Public Offering related services 1,966,156 –
Total remuneration for IPO services 1,966,156 –
Notes to financial statements continued31 July 2010

Myer Holdings Limited Annual Report 2010 69
28 contingenciesContingent liabilitiesThe Group had contingent liabilities at 31 July 2010 in respect of:
GuaranteesThe Group has issued bank guarantees amounting to $26.4 million, of which $23.8 million represents guarantees supporting workers’ compensation self-insurance licences in various jurisdictions.
While the amount and timing of any contingencies are uncertain, no material losses are anticipated in respect of the above contingent liabilities.
29 commitments(a) Capital commitmentsCapital expenditure contracted for at the end of the reporting period but not recognised as liabilities is as follows:
Consolidated 2010 2009 $’000 $’000
Property, plant, equipment and softwarePayable:Within one year 28,223 27,541 Later than one year but not later than five years – –Later than five years – –
28,223 27,541
(b) Lease commitments: Company as lesseeOperating leasesThe Group leases the majority of its stores and warehouses under non-cancellable operating leases expiring within 1 to 26 years. The leases have varying terms, escalation clauses and renewal rights. On renewal, the terms of the leases are renegotiated.
Consolidated 2010 2009 $’000 $’000
Commitments for minimum lease payments in relation to non-cancellable operating leases are payable as follows:Within one year 190,054 179,174 Later than one year but not later than five years 675,034 665,466 Later than five years 1,505,950 1,402,806
2,371,038 2,247,446
Not included in the above commitments are contingent rental payments that may arise in the event that sales made by certain leased stores exceed a pre-determined amount. The contingent rentals payable as percentage of sales revenue and the relevant thresholds vary from lease to lease.
30 related party transactions(a) Parent entitiesThe parent entity within the group is Myer Holdings Limited, a listed public company, incorporated in Australia.
(b) SubsidiariesInterests in subsidiaries are set out in note 31.
(c) Key Management PersonnelDisclosures relating to Key Management Personnel are set out in note 26.
(d) Transactions with other related partiesDuring the period the Group incurred a management fee of $63,000 with Newbridge Capital LLC, an entity associated with the Group’s previous ultimate parent entity for services provided to the Group.

Financial report 70
31 subsidiariesThe consolidated financial statements incorporate the assets, liabilities and results of the following subsidiaries in accordance with the accounting policy described in note 1(b):
Equity Equity Country of holdings4 holdings4
incorporation Class of shares 2010 2009 name of entity Notes % %
NB Elizabeth Pty Ltd 1, 3 Australia Ordinary 100 100NB Russell Pty Ltd 2, 3 Australia Ordinary 100 100NB Lonsdale Pty Ltd 2, 3 Australia Ordinary 100 100NB Collins Pty Ltd 1, 3 Australia Ordinary 100 100Warehouse Solutions Pty Ltd 2, 3 Australia Ordinary 100 100Myer Group Pty Ltd 1, 3 Australia Ordinary 100 100Myer Pty Ltd 1, 3 Australia Ordinary 100 100Myer Group Finance Limited 1, 3 Australia Ordinary 100 100The Myer Emporium Pty Ltd 1, 3 Australia Ordinary 100 100ACT Employment Services Pty Ltd 2 Australia Ordinary 100 100Myer Employee Share Plan Pty Ltd 2 Australia Ordinary 100 100Myer Travel Pty Ltd 2 Australia Ordinary 100 100
Notes:1 Each of these entities has been granted relief from the necessity to prepare financial statements in accordance with Class Order 98/1418
issued by the Australian Securities and Investments Commission.2 Each of these entities is classified as small proprietary and therefore relieved from the requirement to prepare and lodge financial reports
with ASIC.3 Each of these entities is party to a deed of cross guarantee, refer note 32.4 The proportion of ownership interest is equal to the proportion of voting power held.
32 Deed of cross guaranteeMyer Holdings Limited, NB Elizabeth Pty Ltd, NB Collins Pty Ltd, NB Russell Pty Ltd, Myer Group Pty Ltd, NB Lonsdale Pty Ltd, Warehouse Solutions Pty Ltd, Myer Group Finance Limited, Myer Pty Ltd and The Myer Emporium Pty Ltd are parties to a deed of cross guarantee under which each company guarantees the debts of the others. By entering into the deed, the wholly owned entities have been relieved from the requirement to prepare a financial report and directors’ report under Class Order 98/1418 (as amended) issued by the Australian Securities and Investments Commission.
Each of the members of the extended ‘closed group’ are considered to be solvent at 31 July 2010.
(a) Consolidated income statement, statement of comprehensive income and summary of movements in consolidated retained earningsThe above companies represent a ‘closed group’ for the purposes of the Class Order, and as there are no other parties to the deed of cross guarantee that are controlled by Myer Holdings Limited, they also represent the ‘extended closed group’.
Although certain Group entities are not members of the closed group, these entities do not represent a material difference between the income statement, balance sheet, and cash flows of the consolidated group and the closed group. As a result, no additional disclosure has been made in relation to the closed group.
33 events occurring after the reporting periodSubsequent to 31 July 2010, the Directors have determined to pay a final dividend of 11.5 cents per share, franked to 100% at the 30% corporate income tax rate, payable on 4 November 2010. The record date for this dividend is 30 September 2010.
The financial effect of the final ordinary dividend for 2010 has not been recognised in the annual financial statements for the period ended 31 July 2010 and will be recognised in subsequent financial statements.
Notes to financial statements continued31 July 2010

Myer Holdings Limited Annual Report 2010 71
34 reconciliation of profit after income tax to net cash inflow from operating activities
Consolidated 2010 2009 53 weeks 52 weeks $’000 $’000
Profit for the period 67,182 108,749 Depreciation and amortisation including lease inducements 62,705 64,501 Interest income (2,725) (5,449)Fair value adjustment to derivatives 79 (20)Interest expense – unwind of borrowing costs 1,694 6,771 IPO and related expenses 134,880 –Share-based payments expense 5,750 2,500 Defined benefits superannuation (67) (1,062)
Change in operating assets and liabilities Decrease/(increase) in trade and other receivables 6,703 (825) Decrease/(increase) in inventories 1,131 (8,083) Decrease/(increase) in deferred tax asset 20,501 16,946 Increase/(decrease) in trade and other payables (38,943) 25,588 (Decrease)/increase in current tax payable 2,493 (28,668) (Decrease)/increase in provisions (18,310) (12,862) (Decrease)/increase in other liabilities (2,022) (1,426)
Net cash (outflow)/inflow from operating activities 241,051 166,660
35 parent entity financial information(a) Summary financial informationThe individual financial statements for the parent entity show the following aggregate amounts:
2010 2009 $’000 $’000
Balance sheetCurrent assets 188,411 57,752 Total assets 1,054,934 114,718 Current liabilities 34,588 19,655 Total liabilities 454,507 19,655
Shareholders’ equityIssued capital 517,128 84,946 Reserves Cash flow hedges 384 – Share-based payments 12,640 6,890
Retained earnings 70,275 3,227
Profit for the period 128,078 503
Total comprehensive income 128,462 503

Financial report 72
35 parent entity financial information (continued)(b) Guarantees entered into by the parent entity
2010 2009 $’000 $’000
Carrying amount included in current liabilities – –
– –
The parent entity is the borrowing entity under the Group’s financing facilities. Under these facilities, the parent entity is party to a cross guarantee with various other Group entities, who guarantee the repayment of the facilities in the event that the parent entity is in default.
The parent entity is also party to a deed of cross guarantee entered into on 10 May 2010. The details of the deed of cross guarantee are set out in note 32. At balance date no liability has been recognised in relation to these guarantees on the basis that the potential exposure is not considered material.
The parent entity has issued bank guarantees amounting to $26.4 million, of which $23.8 million represents guarantees supporting workers’ compensation self-insurance licences in various jurisdictions.
(c) Contingent liabilities of the parent entityThe parent entity did not have any contingent liabilities as at 31 July 2010 or 25 July 2009. For information about guarantees given by the parent entity, please see above.
(d) Contractual commitments for the acquisition of property, plant or equipmentThe parent entity did not have any contractual commitments for the acquisition of property, plant or equipment as at 31 July 2010 or 25 July 2009.
36 earnings per share
Consolidated 2010 2009 $’000 $’000
(a) Basic earnings per shareTotal basic earnings per share attributable to the ordinary equity holders of the Company 12.3 23.8
(b) Diluted earnings per shareTotal diluted earnings per share attributable to the ordinary equity holders of the Company 12.1 22.9
(c) Reconciliations of earnings used in calculating earnings per shareBasic earnings per share Profit attributable to the ordinary equity holders of the Company used in calculating basic earnings per share 67,182 108,749
Diluted earnings per share Profit attributable to the ordinary equity holders of the Company used in calculating diluted earnings per share 67,182 108,749
Notes to financial statements continued31 July 2010

Myer Holdings Limited Annual Report 2010 73
(d) Weighted average number of shares used as the denominator
Consolidated 2010 2009 Number Number
Weighted average number of ordinary shares used as the denominator in calculating basic earnings per share 548,286,696 457,313,012 Adjustments for calculation of diluted earnings per share: Options 7,644,061 17,936,113
Weighted average number of ordinary shares and potential ordinary shares used as the denominator in calculating diluted earnings per share 555,930,757 475,249,125
(e) Information concerning the classification of securities(i) OptionsOptions granted to employees under the Myer Equity Incentive Plan are considered to be potential ordinary shares and have been included in the determination of diluted earnings per share to the extent to which they are dilutive. The options have not been included in the determination of basic earnings per share. Details relating to the options are set out in note 37.
The 10,825,773 options granted on 6 November are not included in the calculation of diluted earnings per share because they are antidilutive for the period ended 31 July 2010. These options could potentially dilute basic earnings per share in the future.
37 share-based payments(a) Employee option planThe Myer Equity Incentive Plan was established to help ensure retention of senior management and key staff and to provide incentives for the delivery of both short- and long-term shareholder returns. Under the plan, options have been issued in Myer Holdings Limited, the Group’s ultimate Australian parent, under six tranches since November 2006 as follows:
Tranche 1 Issued November – December 2006. Options were granted with time-based and performance-based components. Two-thirds of the options granted were to vest evenly over a five-year period provided the participant remained with the Group, with the other third vesting upon the achievement of certain EBITDA targets. Under the terms of the offer, as a result of the IPO, 80% of unvested options vested immediately on 6 November 2009, with the remainder vesting on the second anniversary of IPO with the exception of the CEO, whose remaining options under the tranche vest on the first anniversary of the IPO.
Tranche 2 Issued August 2007. Options were granted with time based and performance based components. Two-thirds of the options granted were to vest evenly over a four-year period provided the participant remained with the Group, with the other third vesting upon the achievement of certain EBITDA targets. Under the terms of the offer, as a result of the IPO, 80% of unvested options vested immediately on 6 November 2009, with the remainder vesting on the second anniversary of IPO.
Tranche 3 Issued January – July 2008. Options vest on a time basis evenly over the three-year period from 31 July 2010 to 31 July 2012.
Tranche 4 Issued 17 December 2008. Options vest on a time basis over the three-year period from 31 July 2011 to 31 July 2013.
Tranche 5 Issued 30 June 2009. Options vest on a time basis over the three-year period from 31 July 2012 to 31 July 2014.
Tranche 6 – Issued 6 November 2009. Options vest on an EPS performance basis over a three-year period from November 2009 EPS Mgt Plan to 31 July 2012, subject to performance hurdles being met.
Tranche 6 – Issued 6 November 2009. Options vest on an EPS performance basis over a four-year period from November 2009 EPS CEO Plan to 31 July 2013, subject to performance hurdles being met.
Tranche 6 – Issued 6 November 2009. Options vest on a share price performance basis over the four-year period from Share price CEO Plan November 2009 to 31 July 2013, the timing of which is subject to performance hurdles being met.

74Financial report
37 share-based payments (continued)(a) Employee Option Plan (continued)Options are granted under the plan for no consideration, and carry no dividend or voting rights. When exercisable, each option is convertible into one ordinary share in the company. Participation in the plan is at the Board’s discretion and no individual has a contractual right to participate in the plan or to receive any guaranteed benefits.
Set out below is a summary of options granted under the plan:
Granted Exercised Lapsed Vested and Balance at start during during during Balance at end exercisable at Expiry date Exercise price of the period the period the period the period of the period end of the period Grant Date Number Number Number Number Number Number
consolidated – 2010Tranche 1:Nov – Dec 2006 15 Oct 2011 $0.01 16,056,005 – (14,703,018) (65,512) 1,287,475 – Tranche 2:Aug – Nov 2007 15 Oct 2011 $1.27 1,476,110 – (1,080,214) (30,555) 365,341 275,003 Tranche 3:Jan – May 2008 21 Dec 2012 $3.00 9,939,013 – – (910,800) 9,028,213 3,009,404 Tranche 417 Dec 2008 24 Oct 2013 $2.14 4,880,863 – – (578,000) 4,302,863 – Tranche 5:30 Jun 2009 24 Oct 2014 $2.34 5,055,900 – – (353,000) 4,702,900 – Tranche 6: EPS Mgt Plan06 Nov 2009 19 Dec 2012 $4.10 3,445,379 – – 3,445,379 – Tranche 6: EPS CEO Plan06 Nov 2009 19 Dec 2013 $4.10 – 5,152,671 – – 5,152,671 – Tranche 6: Share Price CEO Plan06 Nov 2009 19 Dec 2013 $5.74 – 2,227,723 – – 2,227,723 –
37,407,891 10,825,773 (15,783,232) (1,937,867) 30,512,565 3,284,407
consolidated – 2009Tranche 1:Nov – Dec 2006 15 Oct 2011 $0.01 20,919,337 – (3,548,220) (1,315,112) 16,056,005 799,114 Tranche 2:Aug – Nov 2007 15 Oct 2011 $1.27 1,745,000 – (30,555) (238,335) 1,476,110 454,167 Tranche 3:Jan – May 2008 21 Dec 2012 $3.00 11,541,313 – – (1,602,300) 9,939,013 – Tranche 417 Dec 2008 24 Oct 2013 $2.14 – 5,113,863 – (233,000) 4,880,863 – Tranche 5:30 Jun 2009 24 Oct 2014 $2.34 – 5,075,900 – (20,000) 5,055,900 –
34,205,650 10,189,763 (3,578,775) (3,408,747) 37,407,891 1,253,281
No options expired during the periods covered by the above table. As a result of the dividend and capital return totalling $1.25 per share paid on 24 August 2007, the exercise price of options outstanding at that date was reduced by $1.25 to ensure that option holders would not be disadvantaged by the capital return.
The weighted average share price of the Company since listing on the ASX in November 2009 was $3.47. Prior to this date no share price information is available, other than market valuations performed at the time of option grants, as disclosed in this note and the corresponding note in 2009.
Notes to financial statements continued31 July 2010

75Myer Holdings Limited Annual Report 2010
Fair value of options grantedThe assessed fair value at grant date of options granted during the period is noted below. Fair value varies depending on the period to vesting date. The fair values at grant dates were independently determined using a binomial option pricing model that takes into account the exercise price, the term of the option, the impact of dilution, the fair value of shares in the Company at grant date and expected volatility of the underlying share, the expected dividend yield and the risk-free interest rate for the term of the option.
The fair values and model inputs for options granted during the period included:
Tranche 6 – Tranche 6 – Tranche 6 – Share price EPS Mgt Plan EPS CEO Plan CEO Plan
a) Fair value of options granted $1.19 $1.31 $1.01b) Exercise price at grant date $4.10 $4.10 $5.74c) Grant date 6-Nov-09 6-Nov-09 6-Nov-09d) Expiry date Dec-12 Dec-13 Dec-13e) Share price at grant date $3.77 $3.77 $3.77f) Expected price volatility of the Group’s shares 58% 58% 58%g) Expected dividend yield 5% 5% 5%h) Risk-free interest rate 4.94% 5.14% 5.14%
As shares in the Company were not listed, the fair value per share at grant date for Tranches 1 – 5 was based on an externally prepared share valuation prepared as at the grant date. The fair value per share at grant date for Tranche 6 was based on market prices as at the grant date.
The expected price volatility is based on estimates of price volatility of comparable listed companies. Expected dividend yield is based on expectations of dividend yield of the Company during the term of the options based on expected returns and dividend policy this period, combined with analysis of dividend yields of comparable listed companies.
Where options are issued to employees of subsidiaries within the Group, the subsidiaries compensate the Company for the amount recognised as expense in relation to these options.
(b) Employee share acquisition plan – employee gift offerThe Employee Share Acquisition Plan (ESAP) is designed as a broadly based plan to permit employees of the Myer Group to participate, at the invitation of the Board, in the acquisition of shares on terms and conditions determined by the Board. The initial offer under the ESAP, being the employee gift offer, issued shares on 6 November 2009 to eligible employees for no cash consideration. Eligible employees are permanent full-time and permanent part-time employees of the Myer Group who do not already participate in the Myer Employee Incentive Program (and are not eligible to participate in the MEIP) and were employed at 5.00pm on 2 October 2009 (and remained employed at 5 November 2009).
Under the scheme eligible employees who accepted the offer were granted 176 shares at a value of $721.60, at no cost. Shares issued under the ESAP are subject to a disposal restriction such that the participant cannot deal (i.e. sell or transfer) in the shares for a minimum period of three years (or earlier if their employment ceases).
Consolidated 2010 2009
Number of shares issued under the plan to participating employees on 6 November 2009 1,449,888 –
(c) Expenses arising from share-based payment transactionsTotal expenses arising from share-based payment transactions recognised during the period as part of employee benefit expense were as follows:
Consolidated 2010 2009 $’000 $’000
Options issued under employee option plan 5,749 2,500 Shares issued under Employee Share Acquisition Plan – employee gift offer 5,945 –
11,694 2,500
The expenses arising from the shares issued under the Employee Share Acquisition Plan have been recognised within IPO costs.

76
In the Directors’ opinion:(a) the financial statements and notes set out on pages 27 to 75 are in
accordance with the Corporations Act 2001, including: (i) complying with Accounting Standards, the Corporations Regulations 2001
and other mandatory professional reporting requirements; and (ii) giving a true and fair view of the consolidated entity’s financial position
as at 31 July 2010 and of their performance for the financial period ended on that date; and
(b) there are reasonable grounds to believe that the Company will be able to pay its debts as and when they become due and payable; and
(c) at the date of this declaration, there are reasonable grounds to believe that the members of the extended closed group identified in note 32 will be able to meet any obligations or liabilities to which they are, or may become, subject by virtue of the deed of cross guarantee described in note 32.
Note 1(a) confirms that the financial statements also comply with International financial reporting standards as issued by the International Accounting Standards Board.
The directors have been given the declarations by the Chief Executive Officer and Chief Financial Officer required by section 295A of the Corporations Act 2001.
This declaration is made in accordance with a resolution of the Directors.
Howard McDonald Melbourne Chairman 27 September 2010
Directors’ declaration27 September 2010
financial report

77
independent auditor’s report to the members of myer holdings limitedReport on the financial report We have audited the accompanying financial report of Myer Holdings Limited (the company), which comprises the balance sheet as at 31 July 2010, and the income statement, the statement of comprehensive income, statement of changes in equity and statement of cash flows for the period ended on that date, a summary of significant accounting policies, other explanatory notes and the directors’ declaration for the Myer Holdings Group (the consolidated entity). The consolidated entity comprises the company and the entities it controlled at the period’s end or from time to time during the financial period.
Directors’ responsibility for the financial reportThe directors of the company are responsible for the preparation and fair presentation of the financial report in accordance with Australian Accounting Standards (including the Australian Accounting Interpretations) and the Corporations Act 2001. This responsibility includes establishing and maintaining internal controls relevant to the preparation and fair presentation of the financial report that is free from material misstatement, whether due to fraud or error; selecting and applying appropriate accounting policies; and making accounting estimates that are reasonable in the circumstances. In Note 1, the directors also state, in accordance with Accounting Standard AASB 101 Presentation of Financial Statements, that the financial statements comply with International Financial Reporting Standards.
Auditor’s responsibility Our responsibility is to express an opinion on the financial report based on our audit. We conducted our audit in accordance with Australian Auditing Standards. These Auditing Standards require that we comply with relevant ethical requirements relating to audit engagements and plan and perform the audit to obtain reasonable assurance whether the financial report is free from material misstatement.
An audit involves performing procedures to obtain audit evidence about the amounts and disclosures in the financial report. The procedures selected depend on the auditor’s judgement, including the assessment of the risks of material misstatement of the financial report, whether due to fraud or error. In making those risk assessments, the auditor considers internal control relevant to the entity’s preparation and fair presentation of the financial report in order to design audit procedures that are appropriate in the circumstances, but not for the purpose of expressing an opinion on the effectiveness of the entity’s internal control. An audit also includes evaluating the appropriateness of accounting policies used and the reasonableness of accounting estimates made by the directors, as well as evaluating the overall presentation of the financial report.
Liability limited by a scheme approved under Professional Standards Legislation.
Auditor’s report27 September 2010
PricewaterhouseCoopersACN 003 311 617Freshwater Place2 Southbank BoulevardSouthbank Vic 3006GPO Box 1331Melbourne Vic 3001DX 77Telephone +61 3 8603 1000Facsimile +61 3 8603 1999www.pwc.com/au
Myer Holdings Limited Annual Report 2010

78
Our procedures include reading the other information in the Annual Report to determine whether it contains any material inconsistencies with the financial report.
Our audit did not involve an analysis of the prudence of business decisions made by directors or management.
We believe that the audit evidence we have obtained is sufficient and appropriate to provide a basis for our audit opinions.
IndependenceIn conducting our audit, we have complied with the independence requirements of the Corporations Act 2001.
Auditor’s opinion In our opinion:(a) the financial report of Myer Holdings Limited is in accordance with the
Corporations Act 2001, including: (i) giving a true and fair view of the consolidated entity’s financial position
as at 31 July 2010 and of its performance for the period ended on that date; and
(ii) complying with Australian Accounting Standards (including the Australian Accounting Interpretations) and the Corporations Regulations 2001; and
(b) the financial report and notes comply with International Financial Reporting Standards as disclosed in Note 1.
Report on the Remuneration ReportWe have audited the remuneration report included in the directors’ report for the period ended 31 July 2010. The directors of the company are responsible for the preparation and presentation of the remuneration report in accordance with section 300A of the Corporations Act 2001. Our responsibility is to express an opinion on the remuneration report, based on our audit conducted in accordance with Australian Auditing Standards.
Auditor’s opinion In our opinion, the remuneration report of Myer Holdings Limited for the period ended 31 July 2010, complies with section 300A of the Corporations Act 2001.
PricewaterhouseCoopers
Nadia Carlin Melbourne Partner 27 September 2010
Liability limited by a scheme approved under Professional Standards Legislation.
Auditor’s report continued27 September 2010
Financial report

79
As lead auditor for the audit of Myer Holdings Limited for the period ended 31 July 2010, I declare that to the best of my knowledge and belief, there have been:a) no contraventions of the auditor independence requirements of the
Corporations Act 2001 in relation to the audit; andb) no contraventions of any applicable code of professional conduct in relation
to the audit.This declaration is in respect of Myer Holdings Limited and the entities it controlled during the period.
PricewaterhouseCoopers
Nadia Carlin Melbourne Partner 27 September 2010
Liability limited by a scheme approved under Professional Standards Legislation.
Auditor’s Independence Declaration
PricewaterhouseCoopersACN 003 311 617Freshwater Place2 Southbank BoulevardSouthbank Vic 3006GPO Box 1331Melbourne Vic 3001DX 77Telephone +61 3 8603 1000Facsimile +61 3 8603 1999www.pwc.com/au
Myer Holdings Limited Annual Report 2010

80
Shareholder Information
shareholder information as at 22 september 2010Myer only has one class of shares on issue (being ordinary shares). All of Myer’s issued shares are listed on the Australian Securities Exchange. 9,882,096 shares are subject to voluntary escrow which will end when Myer’s audited financial results for the year ended 31 July 2010 are released. 10,875,223 shares are also subject to voluntary escrow which will end 18 months from the date of listing of Myer Holdings Limited.
Shareholder Number
Issued capital 581,517,884Number of shareholders 57,792Minimum parcel price $3.93 per unit Holders with less than a marketable parcel (less than 128 shares) 141 holders (4,793 total shares)
Distribution of shareholders and shareholdings Range Total holders Units % of issued capital
1–1,000 28,829 14,005,815 2.411,001–5,000 22,643 50,930,298 8.765,001–10,000 3,481 25,510,738 4.3910,001–100,000 2,683 59,746,246 10.27100,001 and over 156 431,324,787 74.17
Total 57,792 581,517,884 100.00
unmarketable parcels Minimum parcel size Holders Units
Minimum $500.00 parcel at $3.93 per unit 128 141 4,793
twenty largest shareholders Rank Name Units % of units
1. J P Morgan Nominees Australia Limited 103,904,906 17.872. HSBC Custody Nominees (Australia) Limited 87,890,991 15.113. National Nominees Limited 72,902,856 12.544. Citicorp Nominees Pty Limited 34,453,704 5.925. Cogent Nominees Pty Limited 13,213,651 2.276. HSBC Custody Nominees (Australia) Limited – A/C 2 12,647,340 2.17 7. M F Custodians Ltd 11,208,270 1.938. Myer Employee Share Plan Pty Ltd 9,246,648 1.599. JP Morgan Nominees Australia Limited 7,110,620 1.2210. AMP Life Limited 6,899,937 1.1911. ANZ Nominees Limited <Cash Income A/C> 4,354,367 0.7512. UBS Nominees Pty Ltd 3,815,301 0.6613. HSBC Custody Nominees (Australia) Limited 3,582,600 0.6214. RBC Dexia Investor Services Australia Nominees Pty Limited 2,824,132 0.4915. Bernard Joseph Brookes 2,700,000 0.4616. UBS Wealth Management Australia Nominees Pty Ltd 2,491,166 0.4317. Australian Reward Investment Alliance 2,257,748 0.3918. Cogent Nominees Pty Limited <SMP Accounts> 2,158,461 0.3719. CS Fourth Nominees Pty Ltd 2,058,320 0.3520. Invia Custodian Pty Limited 1,983,415 0.34
Totals: Top 20 holders of fully paid ordinary shares 387,704,433 66.67Total remaining holders balance 193,813,451 33.33
substantial shareholderAs at 22 September 2010, the only substantial shareholder that Myer is aware of is The Capital Group Companies, Inc. Based on the most recent notice that was provided to Myer on 1 June 2010, The Capital Group Companies, Inc. has a relevant interest of 36,897,442 Myer shares.
voting rights Shareholders may vote at a meeting of shareholders in person, directly or by proxy, attorney or representative, depending on whether the shareholder is an individual or a company. Subject to any rights or restrictions attaching to shares, on a show of hands each shareholder present in person or by proxy, attorney or representative has one vote and, on a poll, has one vote for each fully paid share held. Presently, Myer has only one class of fully paid ordinary shares and these do not have any voting restrictions. If shares are not fully paid, on a poll the number of votes attaching to the shares is pro-rated accordingly.
inDepenDent auDitor’s report to memBers

outside back cover 4.5 outside front cover
About this Annual reportMyer Holdings Limited’s Annual Report contains detailed financial information. A summary of the Company’s performance is contained in Myer’s Annual Review (pictured above) which is available in hard copy by contacting our share registry or can be viewed online at www.myer.com.au in the Investors section.
Annual general meetingThe Annual General Meeting for Myer Holdings Limited will be held at the Melbourne Convention and Exhibition Centre, Plenary 1, 1 Convention Centre Place, South Wharf, Victoria 3006 on Friday 12 November 2010, at 12 noon.
myer holdings limited ABn 14 119 085 602
myer holdings limited ABn 14 119 085 602 AnnuAl report 2010
myer holdings limitedABn 14 119 085 602 AnnuAl review 2010
shAreholder informAtion
Corporate directory
directorsH McDonald (Chairman) B Brookes (CEO) A Brennan T Flood P Hay R Myer
general Counsel and Company secretaryM Rodwell
senior leadership teamFinance and AuditM Ashby
Strategic Planning and Human ResourcesG Travers
Buying OperationsP Winn
Store OperationsN Abboud
principal registered office in AustraliaLevel 7 800 Collins Street Docklands VIC 3008 Telephone: +61 3 8667 6000
share registryComputershare Investor Services Pty Limited GPO Box 2975 Melbourne VIC 3001Within Australia: 1300 820 260 Outside Australia: +61 3 9415 4332 www.investorcentre.com
investor relationsD Gunn Telephone: +61 3 8667 7879 Email: [email protected]
AuditorPricewaterhouseCoopers Level 19, Freshwater Place 2 Southbank Boulevard Southbank VIC 3006
stock exchange listingMyer Holdings Limited (MYR) shares are listed on the Australian Securities Exchange (ASX).
Websitewww.myer.com.au
2 81

outside back cover 4.5 outside front cover
myer holdings limited ABn 14 119 085 602 AnnuAl report 2010
my
er ho
ldin
gs lim
ited A
nn
uA
l repo
rt 2010