nadir workshop 1 set solar ops requirements jb2008 nadir workshop october 27, 2010 w. kent tobiska...
TRANSCRIPT

NADIR workshop
1http://SpaceWx.com
SET solar ops requirements JB2008
NADIR Workshop
October 27, 2010W. Kent Tobiska
Space Environment Technologies
NADIR workshop
2http://SpaceWx.com
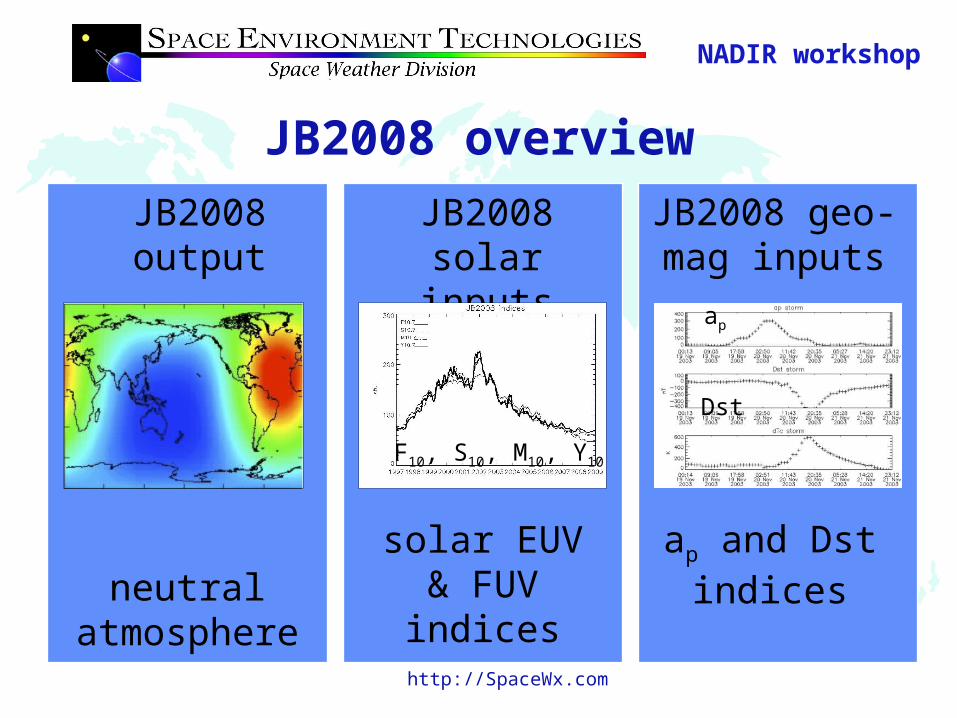
JB2008 solar inputs
solar EUV & FUV indices
JB2008 overview
JB2008 output
neutral atmosphere
JB2008 geo-mag inputs
ap and Dst indices
F10, S10, M10, Y10
ap
Dst

NADIR workshop
3http://SpaceWx.com
Uses of JB2008 in CIRA08, ISO 14222, and HASDM ASW
• CIRA08 is the scientific publication describing the Earth’s neutral atmosphere, especially above 120 km, and is compiled by authors in the COSPAR CIRA task group
• ISO 14222 is the Earth atmosphere density >120 km international standard developed by ISO TC20/SC14/WG4 project leads
• HASDM ASW is the operational system used to specify the JB2008 neutral atmosphere densities for debris avoidance and space situational awareness by Air Force Space Command. Solar and geomagnetic indices are provided with 72-hour forecast in real-time system.

NADIR workshop
4http://SpaceWx.com
EUV heating and photoionization
XE10

NADIR workshop
5http://SpaceWx.com
Compare fluxes
NADIR workshop
6http://SpaceWx.com
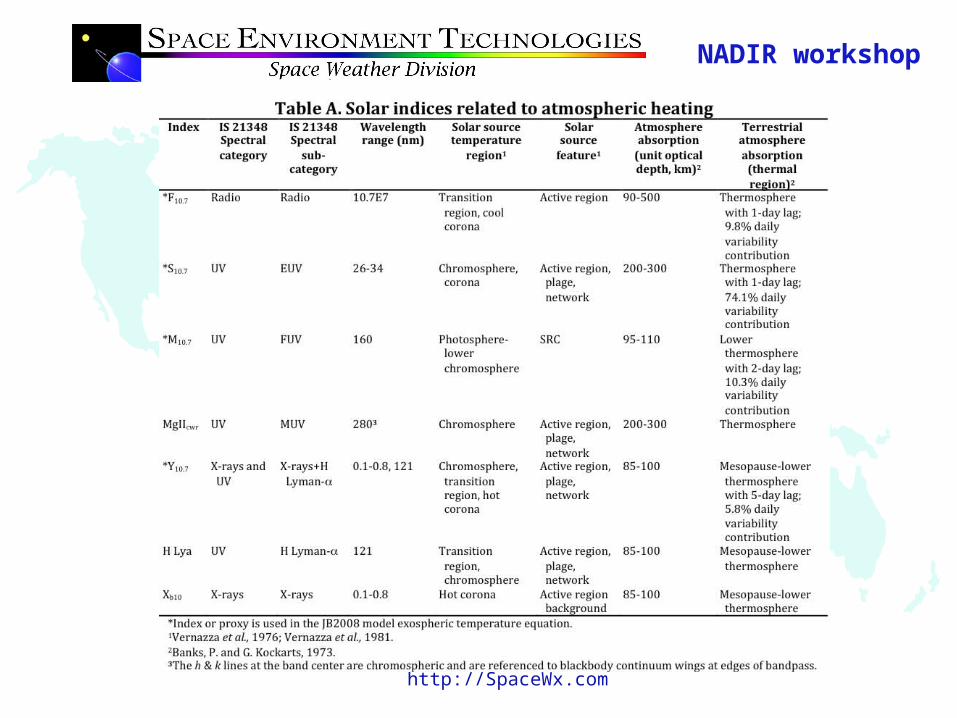
Indices’ summaries

NADIR workshop
7http://SpaceWx.com
Indices’ characteristics• By expressing the proxies and indices in common units, their contribution to the daily density variability in the JB2008 exospheric temperature equation for Tc can be determined; the F10.7 contribution to Tc daily variability is 9.8%, S10.7 is 74.1%, M10.7 is 10.3%, and Y10.7 is 5.8%

NADIR workshop
8http://SpaceWx.com
Indices for different solar activity conditions
Daily updated values are found at the JB2008 menu link on the SET http://spacewx.com website
NADIR workshop
9http://SpaceWx.com
F10 proxy• First daily measurements began February 14, 1947 – high value for legacy time series
• Measured by DRAO National Research Council Solar Radio Monitoring Programme in Penticton
• Observations of flux density values made at 17, 20 and 23 UTC each day
• 20 UTC observed values (not 1 AU) archived at World Data Center were used in JB2008 derivation
• Physical units are 10-22 W m-2 Hz-1 and their numerical value is used without the multiplier and called solar flux units (sfu); this has become defacto standard unit for solar indices
• F10.7 a useful proxy for the combination of chromospheric, transition region, and coronal solar EUV emissions modulated by bright solar active regions whose energies at Earth are deposited in the thermosphere
• It originates mostly in the solar cool (low) corona by electrons in thermal free-free (bremsstrahlung) emission in the vicinity of sunspots and in widely distributed areas associated with the hot complexes of solar activity

NADIR workshop
10http://SpaceWx.com
F10 proxy• The dependence on few processes, combined with its localized formation in the cool corona, i.e., a region that is closely coupled with magnetic structures responsible for creating the XUV–EUV irradiances, makes this a good generalized solar proxy for thermospheric heating
• The running 81-day centered smoothed F10.7 values, using the moving boxcar method, are referred to as F81
• The observed archival daily F10.7 values and their 81-day running center-smoothed values, F81, with a 1-day lag are used in JB2008
• The 1-day lag had the best correlation with satellite-derived density residuals
• A linear regression is used with daily F10.7 to scale and report all other JB2008 solar indices in units of sfu
• F10.7 is the recognized historical EUV proxy and, by reporting other proxies or indices in sfu, it is very easy to qualitatively identify similarities and differences between them
• For solar energy inputs, it is desirable to have solar indices and proxies that vary differently through time; this strategy of using multiple solar indices has significantly improved the accuracy of density modeling in JB2008

NADIR workshop
11http://SpaceWx.com
F10 proxyF10.7 daily and 81-day smoothed values for use by the JB2008 model from January 1, 1997 to January 1, 2009

NADIR workshop
12http://SpaceWx.com
S10 index• S10.7 index is an activity indicator of the integrated 26–34 nm solar irradiance measured by the Solar Extreme-ultraviolet Monitor (SEM) instrument on the NASA/ESA Solar and Heliospheric Observatory (SOHO) satellite
• SEM has been making observations since December 16, 1995 for the 26–34 nm solar EUV emission with 15-second time resolution in this first order broadband wavelength range
• S10.7 index is created by first normalizing the data, then converting it to sfu via a first degree polynomial fit with F10.7; spikes from abnormal flares and missing data were excluded from the fitting vectors; normalization is achieved using a mean value = 1.99551010 photons cm-2 s-1 for the time frame December 16, 1995 to June 12, 2005 (solar cycle 23)
• Corrections to S10.7 are made and identified with versions: versions 3.0–3.9 are used by JB2006 and after June 12, 2005 include a slight long-term trend removal to ensure that similar values at the minima of solar cycles 22 and 23 were achieved
• For JB2008, (S10.7 v4.0 and higher) a new derivation was completed using the equation as follows: S10.7 = (-2.90193) + (118.512) * (SOHO_SEM26_34/1.99551010)

NADIR workshop
13http://SpaceWx.com
S10 index• Chromospheric He II at 30.4 nm and coronal Fe XV at 28.4 nm dominate the broadband SEM 26-34 nm irradiances but that bandpass includes contributions from other chromospheric, transition region, and coronal lines
• When the SOHO SEM and TIMED SEE 26–34 nm integrated data are compared, there are differences in the time series particularly during active solar conditions; it is possible that the SOHO SEM measurements are slightly contaminated with 2nd order emissions from the coronal 17.1 nm Fe IX line that have not been removed; however, this topic needs further investigation
• The energy in this bandpass principally comes from solar active regions, plage, and network
• Once the photons reach the Earth, they are deposited (absorbed) in the terrestrial thermosphere mostly by atomic oxygen above 200 km
• We use the daily S10.7 index and it’s 81-day running center-smoothed values, S81, with a 1-day lag (the best correlation with satellite density residuals) in JB2008
• We infer the 1-day lag is consistent with the average atomic oxygen thermal conduction timescale in the thermosphere above 180 km

NADIR workshop
14http://SpaceWx.com
S10 indexS10.7 (v4.0) daily and 81-day smoothed values for use by the JB2008 model from January 1, 1997 to January 1, 2009

NADIR workshop
15http://SpaceWx.com
M10 proxy• The M10.7 index is derived from the Mg II core-to-wing ratio that originated from the NOAA series operational satellites, e.g., NOAA-16,-17,-18, which host the Solar Backscatter Ultraviolet (SBUV) spectrometer
• Although the NOAA data are from operational satellites, the SORCE/SOLSTICE and ERS-2/GOME research satellites also make the Mg II cwr measurements
• The 280 nm solar spectral band contains photospheric continuum and chromospheric line emissions; the Mg II h and k lines at 279.56 and 280.27 nm are chromospheric in origin while the weakly varying wings or continuum longward and shortward of the core line emission are photospheric in origin; the instruments from all satellites observe both features
• The ratio of the Mg II variable core lines to the nearly non-varying wings is calculated to provide a measure of chromospheric solar active region emission that is theoretically independent of instrument sensitivity change through time; however, long-term changes can occur in the index if instrument wavelength calibrations change in-flight or the solar incidence angle into the instrument changes
NADIR workshop
16http://SpaceWx.com
M10 proxy• The daily Mg II core-to-wing ratio (cwr) has historically been provided through the NOAA Space Weather Prediction Center (SWPC); SET has developed and provides an operational Mg II cwr data product (MgIIcwr_SET) available at the Products menu link of http://spacewx.com that uses the NOAA-16,-17-18, SORCE/SOLSTICE, and ERS-2/GOME data sources
• SET uses the DeLand algorithm to create the index
• The Mg II cwr is an especially good proxy for some solar FUV and EUV emissions; it well represents photospheric and lower chromospheric solar FUV Schumann-Runge Continuum emission near 160 nm that maps into lower thermosphere heating due to O2 photodissociation; since a 160 nm solar FUV emission photosphere index is not produced operationally, the MgIIcwr_SET proxy is used and modified into the M10.7 index for comparison with the other solar indices
• This derivation is performed by finding the relationship between long-term (multiple solar cycle) daily MgIIcwr_SET and F10.7 using a first-degree polynomial fit to produce a coefficient set that can translate Mg II cwr into sfu; the result is M*10.7
NADIR workshop
17http://SpaceWx.com
M10 proxy• Next, a correction is added for the decline of solar cycle 23 to account for NOAA 16 instrument degradation that may be related to its diffuser screen illumination geometry changing with time; this cause is unconfirmed; the correction is accomplished by using another first degree polynomial fit between a trend ratio and day number starting 2448542.0 JD (October 12, 1991 12:00 UT) near the peak of solar cycle 22; the trend ratio is formed from the 365-day center smoothed M*10.7 divided by the 365-day center smoothed F10.7
• The v4.0 formulation of the M10.7 index in sfu is: M10.7 = [-2107.6186 + (8203.0537)*(MgIIcwr_SET)] + [(M*10.7)*(1.2890589 + (-8.377723510-5)*x - 1)]
• The day number x = 0, 1, 2, ... with x = 0 equivalent to starting on 2448542.0 JD
• The daily M10.7 and its 81-day running center-smoothed values, M81, are used with a 2-day lag in JB2008 as a proxy for the Schumann-Runge continuum FUV emission
• A 2-day lag time is appropriate for M10.7, which represents O2 photodissociation, recombination, conduction, and transport processes at the 95–110 km level
• We infer this lag is consistent with the average molecular oxygen dissociation and thermal conduction timescale in the thermosphere above 95 km, although eddy and turbulent conduction processes may play a role

NADIR workshop
18http://SpaceWx.com
M10 proxyM10.7 (v4.0) daily and 81-day smoothed values for use by the JB2008 model from January 1, 1997 to January 1, 2009

NADIR workshop
19http://SpaceWx.com
Y10 index• The XL10.7 index was developed as a candidate index for the JB2006 model but was unused; while developing the JB2008 model, it was determined that a thermospheric energy contribution to satellite drag from the 80–95 km region was significantly correlated with the composite XL10.7 solar index
• Solar X-rays in the 0.1–0.8 nm wavelength range come from the cool and hot corona and are typically a combination of both very bright solar active region background that varies slowly (days to months) plus flares that vary rapidly (minutes to hours), respectively
• The photons arriving at Earth are absorbed in the lower thermosphere to mesopause and (85–100 km) by molecular oxygen (O2) and molecular nitrogen (N2) where they ionize those neutral constituents to create the ionospheric D-region
• The X-ray Spectrometer (XRS) instrument is part of the instrument package on the GOES series operational spacecraft. The GOES/XRS provides the historical through current epoch 0.1–0.8 nm solar X-ray emission data with a 1-minute cadence and as low as 5-minute latency. These data, which are particularly useful for flare detection, are continuously reported by NOAA SWPC at their website of http://www.swpc.noaa.gov/

NADIR workshop
20http://SpaceWx.com
Y10 index• SET uses the GOES/XRS 0.1–0.8 nm data for an index of the solar X-ray active region background, without the flare component, for operational use; this is called the Xb10 index and is used to represent the daily energy that is deposited into the mesosphere and lower thermosphere
• While the 0.1-0.8 nm X-rays are a major energy source in these atmospheric regions during high solar activity, they relinquish their dominance to another emission that reaches the same optical depth, i.e., the competing hydrogen (H) Lyman- emission that is the major energy source in this atmosphere region during moderate and low solar activity
• Lyman- is created in the solar upper chromosphere and transition region and demarcates the EUV from the FUV spectral regions; it is formed primarily in solar active regions, plage, and network; the photons, arriving at Earth, are absorbed in the mesosphere and lower thermosphere where they dissociate nitric oxide (NO) and participate in water (H2O) chemistry; Lyman- is regularly observed by the SOLSTICE instrument on the UARS and SORCE satellites as well as by the SEE instrument on TIMED and the EVE instrument on SDO

NADIR workshop
21http://SpaceWx.com
Y10 index• Since these two solar emissions are competing drivers to the mesosphere and lower thermosphere, we have developed a composite solar index of the Xb10 and Lyman-; it does not contain a flare component and is weighted to represent mostly Xb10 during solar maximum and to represent mostly Lyman- during moderate and low solar activity
• A normalized F81, F81norm, consisting of the 81-day centered smoothed F10.7 divided by it’s mean value for the time frame of January 1, 1991 through February 16, 2008 is used as the weighting function and multiplied with the Xb10 and Lyman- (Lya) expressed as ratios to their solar maximum values; the resulting index is called Y10.7 in sfu
• Y10.7 = F81norm * X10 + [(1- F81norm) * L10]
• L10 = -88.3926 + (3.3589110-10 * Lya) + (2.4048110-22 * Lya2)
• X10 = [(-42.5991 + (0.533669 * Xb10)]
• This daily index has a 5-day lag strongly correlated with the satellite drag density residuals after modeled density variations due to the other solar indices were removed; the 81-day running center-smoothed values, Y81, are also used with the 5-day lag
• We infer the 5-day lag is consistent with the average molecular oxygen and molecular nitrogen thermal conduction timescales in the lower thermosphere above 85 km, although eddy and turbulent conduction may also play a role

NADIR workshop
22http://SpaceWx.com
Y10 indexY10.7 (v4.0) daily and 81-day smoothed values for use by the JB2008 model from January 1, 1997 to January 1, 2009
NADIR workshop
23http://SpaceWx.com
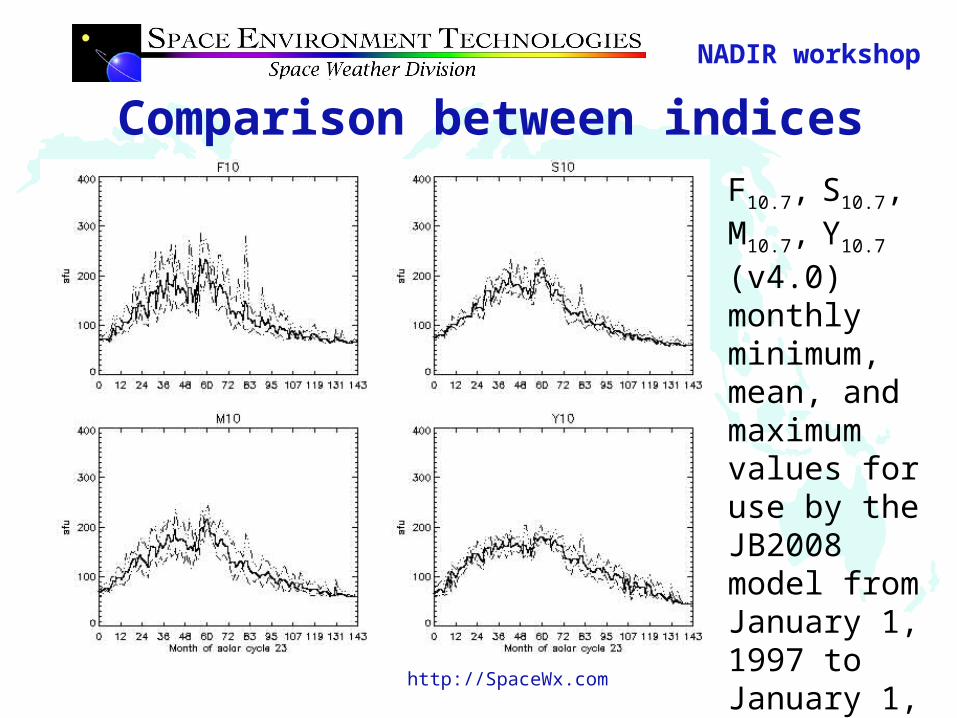
Comparison between indicesF10.7, S10.7, M10.7, Y10.7 (v4.0) monthly minimum, mean, and maximum values for use by the JB2008 model from January 1, 1997 to January 1, 2009

NADIR workshop
24http://SpaceWx.com
ap index• The ap index reports the amplitude of planetary geomagnetic activity for a given day (Mayaud, 1980); the official ap values are calculated at the GeoForschungsZentrum Potsdam Adolf-Schmidt-Observatory for Geomagnetism in Germany
• It is translated from the Kp index, which is derived from geomagnetic field measurements made at several locations around the world
• The daily Ap is obtained by averaging the eight 3-hour values of ap for each day. The U.S. Air Force Weather Agency also calculates an estimated ap from a different, smaller set of stations than are used in calculating the official ap values
• The AFWA ap index values are available through several products issued by NOAA SPWC
• Daily Ap and 3-hour ap indices were used in early orbit analyses and it was determined that the time scales of geomagnetically-induced variability represented by these indices were on the order of a few hours

NADIR workshop
25http://SpaceWx.com
Ap index
NADIR workshop
26http://SpaceWx.com
Dst index• The Disturbance Storm Time (Dst) index is an indicator of the strength of the storm-time ring current in the inner magnetosphere
• During the main phase of geomagnetic storms, the ring current becomes highly energized and produces a southward-directed magnetic field perturbation at low latitudes on the Earth’s surface; this is opposite to the normal northward-directed main field
• The quick-look Dst index is calculated hourly and released through the World Data Center (WDC) in Kyoto, Japan using measurements from four off-equatorial magnetic observatories
• Dst is an ‘absolute’ index and is reported in units of nT; magnetic observatory data are required for its calculation; magnetic observatories are specially designed and carefully operated facilities that provide stable-baseline magnetometer data over long periods of time; typically, an observatory supports the operation of fluxgate, proton-precession, and declination-inclination (theodolite) magnetometer systems; measurements from the various sensor systems can be combined to produce data that are extremely accurate
• Traditionally, four stations have been used for the Dst calculation: Hermanus (HER), South Africa; Kakioka (KAK), Japan; Honolulu (HON), Hawaii; and San Juan (SJG), Puerto Rico

NADIR workshop
27http://SpaceWx.com
Dst index• Most magnetic storms begin with sharp decreases (southward-directed negative values) in Dst, called the storm sudden commencement, in response to increased solar wind pressure. Following a southward turning of the interplanetary magnetic field, Dst decreases as ring current energy increases during the storm’s main phase. During the recovery phase the ring current energy decreases and Dst increases until the storm’s end when the magnetic field perturbation has ceased
• Use of Dst as an index for the energy deposited in the thermosphere during magnetic storms is more accurate than the use of the ap index. This is because Dst has higher temporal resolution with an ability to segregate storm phases with their corresponding magnitudes. On the other hand, the 3-hour ap index is an indicator of general magnetic activity over the Earth and responds primarily to currents flowing in the ionosphere and only secondarily to magnetospheric variations. The ap index is derived from measurements by observatories at high latitudes that can be blind to energy input during large storms and it can underestimate the effects of storms on the thermosphere
• An algorithm for determining the storm events was developed in JB2008 that locates the temporal start, minimum, recovery slope change, and final end of the storm as reflected in the Dst index

NADIR workshop
28http://SpaceWx.com
Dst index

NADIR workshop
29http://SpaceWx.com
Geomagnetic comparisons
The ap, Dst, and dTc geomagnetic, ring current, and delta temperature indices for use by the JB2008 model in solar cycle 23
The ap, Dst, and dTc geomagnetic, ring current, and delta temperature indices for use by the JB2008 model in a storm period between November 19–22, 2003

NADIR workshop
30http://SpaceWx.com
JB2008 output
JB2008 mean air density with altitude for low, moderate, and high long- and short-term solar and geomagnetic activity
JB2008 density at 400 km altitude for low solar and quiet geomagnetic activity on July 14, 2010

NADIR workshop
31http://SpaceWx.com
JB2008 Operations RecommendationsJB2008: solar irradiance surrogates for redundancy stream
(atmospheric drag)o S10 index (26-34 nm EUV calibrated to SOHO SEM
dataset) (F2-region ionosphere, >180 km thermosphere)
o M10 proxy (160 nm AIA irradiance or Mg II index) (E-region ionosphere, 100-120 km thermosphere)
o Y10 index (XRSL index is the 0.1-0.8 nm modeled X-ray; Lyman-a) (D-region ionosphere, 80-90 km mesosphere)
o F10 proxy (E10 index of 1-105 nm integrated flux) (residual ionosphere and thermosphere)
o time granularity (1-hour), cadence (1-hour)