nahms beef '97 study part iii: beef cow-calf ......on-farm forpart iii: reference of 1997 beef...
TRANSCRIPT

Part III: Reference of1997 Beef Cow-Calf Production
Management and Disease Control
National Animal Health Monitoring System January 1998
United StatesDepartmentof Agriculture
Animal andPlant HealthInspectionService
VeterinaryServices
Acknowledgements
This report has been prepared from material received and analyzed by the U.S. Department ofAgriculture (USDA), Animal and Plant Health Inspection Service (APHIS), Veterinary Services (VS)during a nationwide study of management and health on cow-calf operations.
The Beef ‘97 study was a cooperative effort between State and Federal agricultural statisticians,animal health officials, university researchers, and extension personnel. We want to thank the NationalAgricultural Statistics Service (NASS) enumerators and State and Federal Veterinary MedicalOfficers (VMO’s) and Animal Health Technician’s (AHT’s) who visited the operations and collectedthe data for their hard work and dedication to the National Animal Health Monitoring System(NAHMS).
The roles of the producer, Area Veterinarian in Charge (AVIC), NAHMS Coordinator, VMO, AHT,and NASS enumerator were critical in providing quality data for Beef ‘97 reports. Thanks also to thestaff at the Centers for Epidemiology and Animal Health (CEAH) for their efforts in generating timelyreports from Beef ‘97 data. All participants are to be commended for their efforts, particularly theproducers whose voluntary efforts made the study possible.
_________________________________________Dr. Nora Wineland, NAHMS Program Leader

Table of Contents
Introduction . . . . . . . . . . . . . . . . . . . . . . . . . . . . . . . . . . . . . . . . . . . . . . . . . . 1
Terms used in this report . . . . . . . . . . . . . . . . . . . . . . . . . . . . . . . . . . . . . . . . . . 2
Section I: Population Estimates . . . . . . . . . . . . . . . . . . . . . . . . . . . . . . . . . . . . . . . . 3
A. General Management . . . . . . . . . . . . . . . . . . . . . . . . . . . . . . . . . . . . . . . . . . 3
1. Breeding herd description . . . . . . . . . . . . . . . . . . . . . . . . . . . . . . . . . 32. Breed makeup . . . . . . . . . . . . . . . . . . . . . . . . . . . . . . . . . . . . . . . 43. Cow disposition . . . . . . . . . . . . . . . . . . . . . . . . . . . . . . . . . . . . . . 54. SPA participation . . . . . . . . . . . . . . . . . . . . . . . . . . . . . . . . . . . . . 55. Hours per beef cow managing and caring . . . . . . . . . . . . . . . . . . . . . . . . . 66. Low price impact . . . . . . . . . . . . . . . . . . . . . . . . . . . . . . . . . . . . . 87. Changes in environmental and grazing management practices . . . . . . . . . . . . . . 9
B. Calving and Breeding . . . . . . . . . . . . . . . . . . . . . . . . . . . . . . . . . . . . . . . . . . 9
1. Reproductive technologies . . . . . . . . . . . . . . . . . . . . . . . . . . . . . . . . 9
C. Health Management . . . . . . . . . . . . . . . . . . . . . . . . . . . . . . . . . . . . . . . . . . 12
1. Castration . . . . . . . . . . . . . . . . . . . . . . . . . . . . . . . . . . . . . . . . 122. Weaning management . . . . . . . . . . . . . . . . . . . . . . . . . . . . . . . . . . 143. Vaccinations administered . . . . . . . . . . . . . . . . . . . . . . . . . . . . . . . . 164. Type of vaccination . . . . . . . . . . . . . . . . . . . . . . . . . . . . . . . . . . . 175. Calf respiratory vaccination . . . . . . . . . . . . . . . . . . . . . . . . . . . . . . . 186. Brucellosis vaccination . . . . . . . . . . . . . . . . . . . . . . . . . . . . . . . . . 197. Economic impact of selected health conditions . . . . . . . . . . . . . . . . . . . . . 218. Problem diseases for the U.S. beef cattle industry . . . . . . . . . . . . . . . . . . . 22
D. Disease Control . . . . . . . . . . . . . . . . . . . . . . . . . . . . . . . . . . . . . . . . . . . . 23
1. Vaccination of cattle brought onto the operation . . . . . . . . . . . . . . . . . . . . 232. Distance to captive animals . . . . . . . . . . . . . . . . . . . . . . . . . . . . . . . 243. Frequency of wildlife sightings . . . . . . . . . . . . . . . . . . . . . . . . . . . . . 254. Access to dairy cattle . . . . . . . . . . . . . . . . . . . . . . . . . . . . . . . . . . 255. Type of grazing used . . . . . . . . . . . . . . . . . . . . . . . . . . . . . . . . . . 266. Distance to grazing areas . . . . . . . . . . . . . . . . . . . . . . . . . . . . . . . . 277. Carcass disposal . . . . . . . . . . . . . . . . . . . . . . . . . . . . . . . . . . . . . 288. Fly control . . . . . . . . . . . . . . . . . . . . . . . . . . . . . . . . . . . . . . . . 299. Rodent control . . . . . . . . . . . . . . . . . . . . . . . . . . . . . . . . . . . . . . 2910. Feed storage unit accessibility . . . . . . . . . . . . . . . . . . . . . . . . . . . . . 30

11. Females calving per acre . . . . . . . . . . . . . . . . . . . . . . . . . . . . . . . . 3012. Selected breeding and calving management practices . . . . . . . . . . . . . . . . . 3113. Travel to fairs or shows . . . . . . . . . . . . . . . . . . . . . . . . . . . . . . . . . 3114. Manure handling . . . . . . . . . . . . . . . . . . . . . . . . . . . . . . . . . . . . 3215. Familiarity with Johne’s disease . . . . . . . . . . . . . . . . . . . . . . . . . . . . 3216. Opinions on U.S. outbreak preparedness . . . . . . . . . . . . . . . . . . . . . . . . 33
E. Feed Management . . . . . . . . . . . . . . . . . . . . . . . . . . . . . . . . . . . . . . . . . . . 34
1. Creep feeding . . . . . . . . . . . . . . . . . . . . . . . . . . . . . . . . . . . . . . . 34
F. Marketing . . . . . . . . . . . . . . . . . . . . . . . . . . . . . . . . . . . . . . . . . . . . . . . 35
1. Marketing calves for feeding . . . . . . . . . . . . . . . . . . . . . . . . . . . . . . . 352. Marketing calves for breeding . . . . . . . . . . . . . . . . . . . . . . . . . . . . . . 393. Cull cows . . . . . . . . . . . . . . . . . . . . . . . . . . . . . . . . . . . . . . . . . 40
Section II: Sample Profile . . . . . . . . . . . . . . . . . . . . . . . . . . . . . . . . . . . . . . . . . . 41
Section III: U.S. Inventory of Beef Cows and Number of Operations Estimates . . . . . . . . . . . . . . 42

Introduction
The National Animal Health Monitoring System’s (NAHMS) Beef ‘97 study was designed to provide both par-ticipants and the industry with information on the nation’s cow-calf population for education and research.NAHMS is sponsored by the USDA:APHIS:Veterinary Services (VS).
The first NAHMS national study of the beef cow-calf industrywas the 1992-93 Beef Cow-Calf Health and Productivity Audit(CHAPA). Beef ‘97 was the second NAHMS national studyof that industry. NAHMS developed study objectives by ex-ploring existing literature and contacting industry membersabout their informational needs and priorities. The objectivesare listed inside the back cover of this report.
The USDA’s National Agricultural Statistics Service (NASS)collaborated with VS to select a statistically-valid sample from23 states for Beef ‘97 (see map at right). The 23-state targetpopulation represented 85.7 percent of U.S. beef cows onJanuary 1, 1997, and 77.6 percent of U.S. operations with beefcows.
Part I: Reference of 1997 Beef Cow-Calf Management Practiceswas released in June 1997. July’sPart II: Ref-erence of 1997 Beef Cow-Calf Health & Health Management Practicescontinued documenting Beef ‘97 studyresults. NASS enumerators collected data for these reports from 2,713 producers via a questionnaire adminis-tered on-farm from December 30, 1996, through February 3, 1997.
Federal and state Veterinary Medical Officers (VMO’s) and Animal Health Technicians (AHT’s) collected dataon-farm forPart III: Reference of 1997 Beef Cow-Calf Production Management and Disease ControlfromMarch 3 through May 23, 1997, from 1,190 operations that had five or more beef cows on January 1, 1997.Part IV: Changes in Beef Cow-Calf Management Practiceswill combine results of the 1992-93 CHAPA withthe Beef ‘97 results for comparable items and is expected to be released in February 1998.
The 23-state target population of operations with five or more beef cows:
• 85.9 percent of beef cows on U.S. operations with five or more beef cows (see table below).
• 79.7 percent of beef cow operations in the U.S. with five or more beef cows (see the table on the next page).
• 85.0 percent of all beef cows in the U.S.
• 66.3 percent of all beef cow operationsin the U.S.
Within the 23 Beef ‘97 states, the targetpopulation with 5 or more beef cows repre-sented: 99.2 percent of all beef cows and85.5 percent of all beef cow operations inthe 23 states.
Beef ‘97 reports are accessible on the WorldWide Web athttp://www.aphis.usda.gov/vs/ceah/cahm(menu choices: National Animal Health Monitoring System and Beef Cow/Calf).
Beef '97 Participating States
#3455*
*Identification numbers are assigned to each graph in this reportfor public reference.
Target Population - Beef Cows
Beef Cow Inventory - January 1, 1997
States
On All*Operations
(1,000 Head)
On Operationswith 5 or More
Beef Cows(1,000 Head)**
Percent AllBeef Cows
United States (50 states) 34,279.8 33,937.0 99.0Beef ‘97 (23 states) 29,375.0 29,140.0 99.223 states as apercent of United States 85.7 85.9 —
* Source: USDA’s National Agricultural Statistics Service (NASS).** NAHMS projection.
Introduction
USDA:APHIS:VS 1 NAHMS Beef '97

Discussions of selected topics are also accessible on the Internet through goher.aphis.usda.gov(menu choices: APHIS Information; Animal Health Information; Animal Health Monitoring, Risk Assessments,and Emerging Issues).
For questions about this report or additionalBeef ‘97 and NAHMS results, please contact:
Centers for Epidemiology and Animal HealthUSDA:APHIS:VS, attn. NAHMS555 South Howes; Fort Collins, CO 80521Telephone: (970) 490-8000Internet: [email protected]
Terms Used in This Report
Beef cow: Female that has calved at least once.
Beef heifer: Female that has not yet calved.
Herd size: Size groupings based on number of beef cows on hand January 1, 1997.
N/A: Not applicable.
Operation average: A single value for each operation is summed over all operations reporting divided by thenumber of operations reporting.
Population estimates: Averages and proportions weighted to represent the population. For this report, the refer-ence population was cow-calf operations with five or more beef cows in the 23 selected States. Most of theestimates in this report are provided with a measure of variability called thestandard error and denoted by (±). Chances are 95 out of 100 that the interval cre-ated by the estimate plus or minus two standard errors will contain the truepopulation value. In the example at right, an estimate of 7.5 with a standard errorof ±1.0 results in a range of 5.5 to 9.5 (two times the standard error above and be-low the estimate). The second estimate of 3.4 shows a standard error of ±0.3 andresults in a range of 2.8 and 4.0. Most estimates in this report are rounded to thenearest tenth.
Regions:West: California, Colorado, Montana, New Mexico, Oregon, and Wyoming.Northcentral : Kansas, Nebraska, North Dakota, and South Dakota.Southcentral: Oklahoma and Texas.Central: Arkansas, Illinois, Iowa, and Missouri.Southeast: Alabama, Florida, Georgia, Kentucky, Mississippi, Tennessee,and Virginia.
Sample profile: Information that describes characteristics of the operations fromwhich Beef ‘97 data were collected.
Target Population - Beef Cow Operations
Operations with Beef Cows, 1996
States
All* OperationsOn Operations with 5 or More
Beef Cows (1,000 Head)**
Number NumberPercent AllOperations
United States (50 states) 900,680 749,366 83.2Beef ‘97 (23 states) 698,600 597,303 85.523 states as apercent of United States 77.6 79.7 —
* Source: USDA’s National Agricultural Statistics Service (NASS).** NAHMS projection.
Examples of95% Confidence Intervals
(±1.0) (±0.3)Standard Errors
0
2
4
6
8
10
95% ConfidenceInterval
Introduction Terms Used in This Report
NAHMS Beef '97 2 USDA:APHIS:VS

Section I: Population Estimates
A. General Management
1. Breeding herd description
a. Percent of operations by best description of the beef breeding herd by herd size:Percent Operations
Number CowsBeef Breeding Less Standard Standard Standard 300 Standard All StandardHerd Description Than 50 Error 50-99 Error 100-299 Error or More Error Operations Error
Registered cattle only 6.6 (±2.3) 3.9 (±1.5) 3.6 (±1.0) 2.8 (±1.6) 5.8 (±1.7)Commercial cattle (including
composite breeds) 72.7 (±3.6) 75.8 (±3.2) 69.7 (±3.3) 70.4 (±5.9) 72.8 (±2.7)Both registered and commercial
cattle 20.7 (±3.1) 20.3 (±3.0) 26.7 (±3.2) 26.8 (±5.8) 21.4 (±2.3)
Total 100.0 100.0 100.0 100.0 100.0
Most operations (72.8 percent) were best characterized as having commercial cattle only. Slightly morethan one in five herds (21.4 percent) had both commercial and registered cattle. Relatively few opera-tions (5.8 percent) had registered cattle exclusively. The percentage of operations with the various typesof animals was consistent across herd sizes.
Registered only5.8%
Commercial72.8%
Registered & Commercial21.4%
Percent of Operations by Best Descriptionof the Beef Breeding Herd
#3680
A. General Management Section I: Population Estimates
USDA:APHIS:VS 3 NAHMS Beef '97
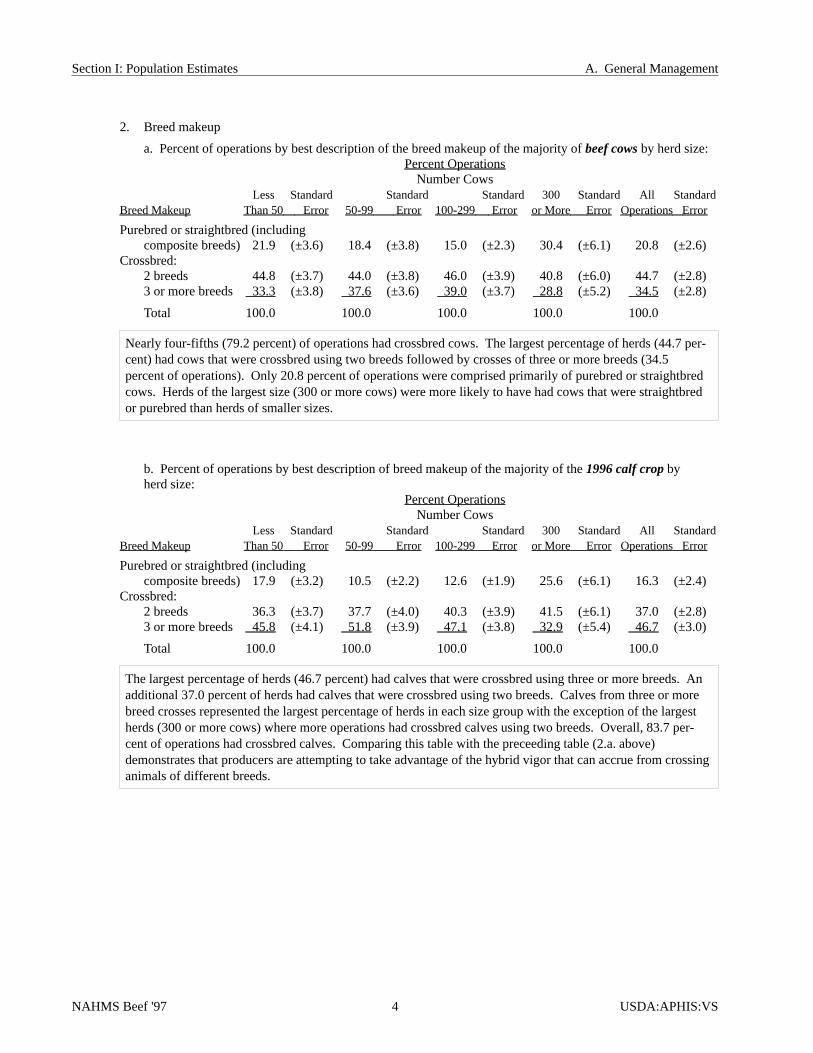
2. Breed makeup
a. Percent of operations by best description of the breed makeup of the majority ofbeef cowsby herd size:Percent Operations
Number CowsLess Standard Standard Standard 300 Standard All Standard
Breed Makeup Than 50 Error 50-99 Error 100-299 Error or More Error Operations Error
Purebred or straightbred (includingcomposite breeds) 21.9 (±3.6) 18.4 (±3.8) 15.0 (±2.3) 30.4 (±6.1) 20.8 (±2.6)
Crossbred:2 breeds 44.8 (±3.7) 44.0 (±3.8) 46.0 (±3.9) 40.8 (±6.0) 44.7 (±2.8)3 or more breeds 33.3 (±3.8) 37.6 (±3.6) 39.0 (±3.7) 28.8 (±5.2) 34.5 (±2.8)
Total 100.0 100.0 100.0 100.0 100.0
Nearly four-fifths (79.2 percent) of operations had crossbred cows. The largest percentage of herds (44.7 per-cent) had cows that were crossbred using two breeds followed by crosses of three or more breeds (34.5percent of operations). Only 20.8 percent of operations were comprised primarily of purebred or straightbredcows. Herds of the largest size (300 or more cows) were more likely to have had cows that were straightbredor purebred than herds of smaller sizes.
b. Percent of operations by best description of breed makeup of the majority of the1996 calf cropbyherd size:
Percent OperationsNumber Cows
Less Standard Standard Standard 300 Standard All StandardBreed Makeup Than 50 Error 50-99 Error 100-299 Error or More Error Operations Error
Purebred or straightbred (includingcomposite breeds) 17.9 (±3.2) 10.5 (±2.2) 12.6 (±1.9) 25.6 (±6.1) 16.3 (±2.4)
Crossbred:2 breeds 36.3 (±3.7) 37.7 (±4.0) 40.3 (±3.9) 41.5 (±6.1) 37.0 (±2.8)3 or more breeds 45.8 (±4.1) 51.8 (±3.9) 47.1 (±3.8) 32.9 (±5.4) 46.7 (±3.0)
Total 100.0 100.0 100.0 100.0 100.0
The largest percentage of herds (46.7 percent) had calves that were crossbred using three or more breeds. Anadditional 37.0 percent of herds had calves that were crossbred using two breeds. Calves from three or morebreed crosses represented the largest percentage of herds in each size group with the exception of the largestherds (300 or more cows) where more operations had crossbred calves using two breeds. Overall, 83.7 per-cent of operations had crossbred calves. Comparing this table with the preceeding table (2.a. above)demonstrates that producers are attempting to take advantage of the hybrid vigor that can accrue from crossinganimals of different breeds.
Section I: Population Estimates A. General Management
NAHMS Beef '97 4 USDA:APHIS:VS

3. Cow disposition
a. Percent of operations where, during the last 5 years, an increase in problems was perceived to beassociated with the temperament or disposition of cows by herd size:
Percent OperationsNumber Cows
Less Standard Standard Standard 300 Standard All StandardThan 50 Error 50-99 Error 100-299 Error or More Error Operations Error
8.4 (±1.8) 8.0 (±1.8) 8.4 (±1.9) 5.4 (±2.5) 8.3 (±1.3)
Animal temperament can affect the ease with which animals can be handled. In addition, temperament ofthe animals can lead to problems with beef quality if flighty animals injure themselves during the han-dling process. Concern has been raised that the proportion of animals with less than ideal temperamenthas been increasing. Only 8.3 percent of producers perceived an increase in problems associated withtemperament or disposition of cows.
b. Percent of operations where, during the last 5 years, an increase in problems was perceived to be associatedwith the temperament or disposition of cows by region:
Percent OperationsRegion
Standard North- Standard South- Standard Standard Standard All StandardWest Error central Error central Error Central Error Southeast Error Operations Error
4.5 (±1.4) 10.5 (±3.0) 4.2 (±1.1) 8.9 (±2.8) 11.9 (±3.7) 8.3 (±1.3)
Few producers reported temperament problems. Operations in the West and Southcentral regions wereless likely to report increasing problems with temperament of cows than operations in other regions.
4. SPA participation
a. Percent of operations that used the Standardized Performance Analysis (SPA) sponsored by theNational Cattlemen’s Beef Association and the USDA Extension Service to determine the profitability ofproducing beef calves by herd size:
Percent OperationsNumber Cows
Less Standard Standard Standard 300 Standard All StandardThan 50 Error 50-99 Error 100-299 Error or More Error Operations Error
4.7 (±1.5) 2.5 (±0.9) 3.0 (±1.0) 3.0 (±1.5) 4.2 (±1.1)
A Standardized Performance Analysis is a method to calculate financial and productivity measures forcow-calf operations on a consistent basis across operations and years. In spite of widespread availabilityof these analysis tools through local Extension personnel and even across the internet, relatively few op-erations (4.2 percent) have used them. There was little indication of differences in use of SPA by herdsize.
A. General Management Section I: Population Estimates
USDA:APHIS:VS 5 NAHMS Beef '97

b. Percent of operations that used the Standardized Performance Analysis (SPA) sponsored by the NationalCattlemen’s Beef Association and the USDA Extension Service to determine the profitability ofproducing beef calves by region:
Percent OperationsRegion
Standard North- Standard South- Standard Standard Standard All StandardWest Error central Error central Error Central Error Southeast Error Operations Error
4.0 (±2.2) 4.6 (±2.0) 4.8 (±2.7) 1.8 (±0.8) 5.1 (±2.4) 4.2 (±1.1)
There was little indication of differences in use of SPA across regions with the exception of the Central regionwhich had the smallest proportion of operations (1.8 percent) that reported having used SPA.
5. Hours per beef cow managing and caring
a. Operation average hours per beef cow per week allocated to the managing and caring for theanimals in the cow-calf operation by season and herd size:
Operation Average (Hours per beef cow per week)Number Cows
Less Standard Standard Standard 300 Standard All StandardSeason Than 50 Error 50-99 Error 100-299 Error or More Error Operations Error
Winter 0.88 (±0.06) 0.33 (±0.02) 0.24 (±0.01) 0.19 (±0.02) 0.72 (±0.04)Spring 0.86 (±0.06) 0.42 (±0.03) 0.33 (±0.02) 0.30 (±0.02) 0.73 (±0.05)Summer 0.66 (±0.07) 0.20 (±0.01) 0.18 (±0.01) 0.16 (±0.02) 0.53 (±0.06)Fall 0.70 (±0.06) 0.25 (±0.02) 0.18 (±0.01) 0.18 (±0.01) 0.57 (±0.05)
The largest number of hours per cow per week was spent on cow-calf operations in the winter (.72 hours) andthe spring (.73 hours). These results are to be expected since most calves are born in the spring months and inmany regions, winter is a time of supplementary feeding. Larger operations appeared to be more efficientwith labor than smaller operations since they had the lowest hours required per cow per week in each seasonof all the size groups. These findings may be, in part, due to a larger investment in labor-saving mechanizedequipment plus recognition that some amount of labor is fixed regardless of herd size.
0.7
0.250.18 0.18
0.66
0.2 0.18 0.16
0.86
0.420.33 0.3
0.88
0.330.24
0.19
Less than 50 50-99 100-299 300 or More
Number Cows
0
0.25
0.5
0.75
1
Percent Operations
WinterSpring
SummerFall
Operation Average Hours per Week per Beef CowAllocated to Managing and Caring for the Cow-calf
Operation by Season and Herd Size
#3681
Section I: Population Estimates A. General Management
NAHMS Beef '97 6 USDA:APHIS:VS
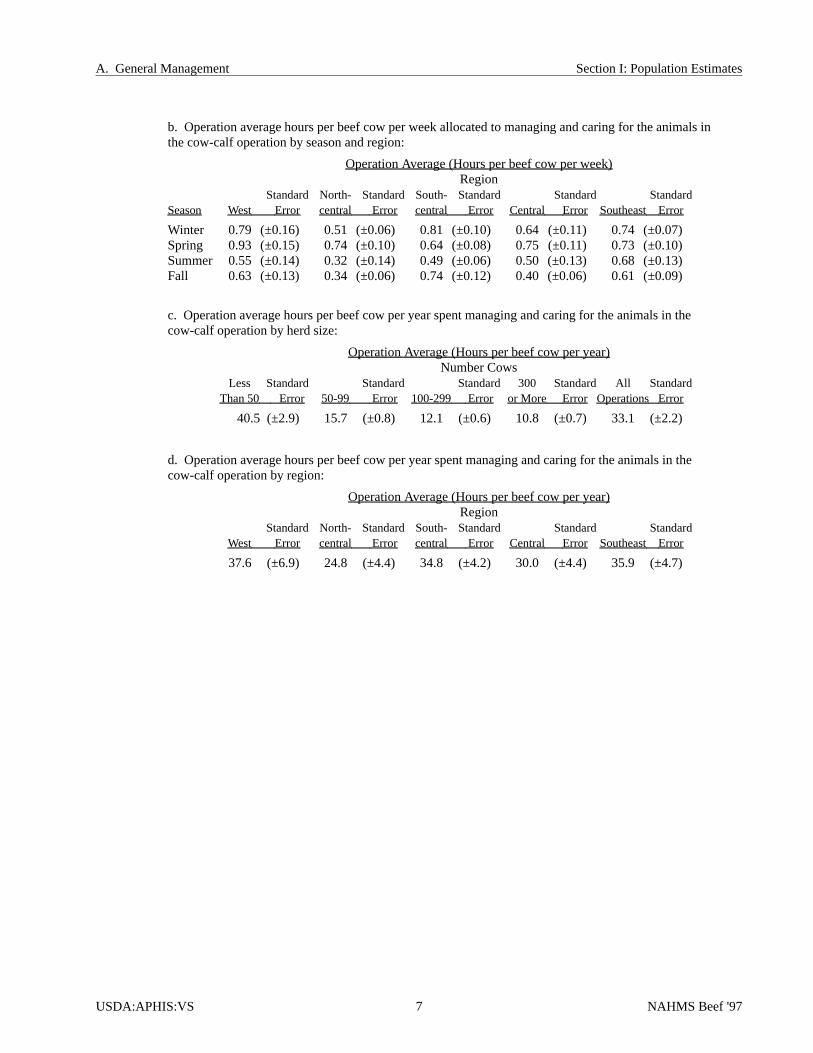
b. Operation average hours per beef cow per week allocated to managing and caring for the animals inthe cow-calf operation by season and region:
Operation Average (Hours per beef cow per week)Region
Standard North- Standard South- Standard Standard StandardSeason West Error central Error central Error Central Error Southeast Error
Winter 0.79 (±0.16) 0.51 (±0.06) 0.81 (±0.10) 0.64 (±0.11) 0.74 (±0.07)Spring 0.93 (±0.15) 0.74 (±0.10) 0.64 (±0.08) 0.75 (±0.11) 0.73 (±0.10)Summer 0.55 (±0.14) 0.32 (±0.14) 0.49 (±0.06) 0.50 (±0.13) 0.68 (±0.13)Fall 0.63 (±0.13) 0.34 (±0.06) 0.74 (±0.12) 0.40 (±0.06) 0.61 (±0.09)
c. Operation average hours per beef cow per year spent managing and caring for the animals in thecow-calf operation by herd size:
Operation Average (Hours per beef cow per year)Number Cows
Less Standard Standard Standard 300 Standard All StandardThan 50 Error 50-99 Error 100-299 Error or More Error Operations Error
40.5 (±2.9) 15.7 (±0.8) 12.1 (±0.6) 10.8 (±0.7) 33.1 (±2.2)
d. Operation average hours per beef cow per year spent managing and caring for the animals in thecow-calf operation by region:
Operation Average (Hours per beef cow per year)Region
Standard North- Standard South- Standard Standard StandardWest Error central Error central Error Central Error Southeast Error
37.6 (±6.9) 24.8 (±4.4) 34.8 (±4.2) 30.0 (±4.4) 35.9 (±4.7)
A. General Management Section I: Population Estimates
USDA:APHIS:VS 7 NAHMS Beef '97

6. Low price impact
a. Because of the low prices for weaned calves sold in 1995 and 1996, percent of operations that didmore, the same, or lessof the following management practices or they were not applicable:
Percent OperationsNumber Cows
Management Standard Standard Standard StandardPractices More Error Same Error Less Error N/A Error Total
Vaccinations 0.9 (±0.2) 66.0 (±3.0) 7.4 (±1.3) 25.7 (±3.0) 100.0Energy supplements 9.8 (±1.8) 63.6 (±2.9) 9.6 (±1.5) 17.0 (±2.2) 100.0Protein supplements 12.5 (±2.0) 63.3 (±3.0) 9.2 (±1.5) 15.0 (±2.3) 100.0Medications (herd) 0.6 (±0.2) 70.6 (±2.9) 7.7 (±1.7) 21.1 (±2.7) 100.0Medications (individual) 1.1 (±0.3) 75.8 (±2.9) 5.0 (±1.4) 18.1 (±2.7) 100.0Labor inputs 8.3 (±1.8) 78.1 (±2.6) 5.7 (±1.3) 7.9 (±2.0) 100.0Culling 20.9 (±2.0) 53.6 (±2.9) 12.0 (±2.0) 13.5 (±2.5) 100.0Veterinary services 1.1 (±0.3) 68.4 (±2.7) 14.1 (±1.8) 16.4 (±2.5) 100.0Forward pricing 1.5 (±0.4) 21.6 (±2.3) 1.1 (±0.4) 75.8 (±2.4) 100.0Retained ownership of
weaned calves 17.5 (±2.3) 36.3 (±2.8) 4.6 (±1.4) 41.6 (±2.9) 100.0
Prices for weaned calves in 1995 and 1996 were at a low point in the cattle cycle. Numerous mangement ac-tions are available to help producers cope with low prices received for their product. Some producers mayfocus on the cost side of the profit equation and attempt to trim costs in a variety of areas. Others may focuson the revenue side of the equation and attempt to increase productivity.
For the most part, producers did not alter their management based on decreased prices for weaned calves. Inaddition, with each management practice listed, some producers increased use and some decreased use indicat-ing no clear strategy with regard to the usefullness of each management practice in times of adverse prices.Among those producers that did indicate some changes, they tended to use less vaccination, less herd medica-tions, less individual medications, do more culling, use less veterinary services, and use more retainedownership. Not applicable (N/A) means the practice was not used previously (at any level) and still not used.
7.4
9.6
9.2
7.7
5
5.7
12
14.1
1.1
4.6
0.9
9.8
12.5
0.6
1.1
8.3
20.9
1.1
1.5
17.5
Vaccinations
Energy supplements
Protein supplements
Herd medications
Individual medications
Labor inputs
Culling
Veterinary services
Forward pricing
Retained ownership
0 10 20
Percent Operations
MoreLess
Percent of Operations that Did More or Lessof the Following Management Practices Because of Low Prices
for Weaned Calves, 1995-1996
#3682
Section I: Population Estimates A. General Management
NAHMS Beef '97 8 USDA:APHIS:VS
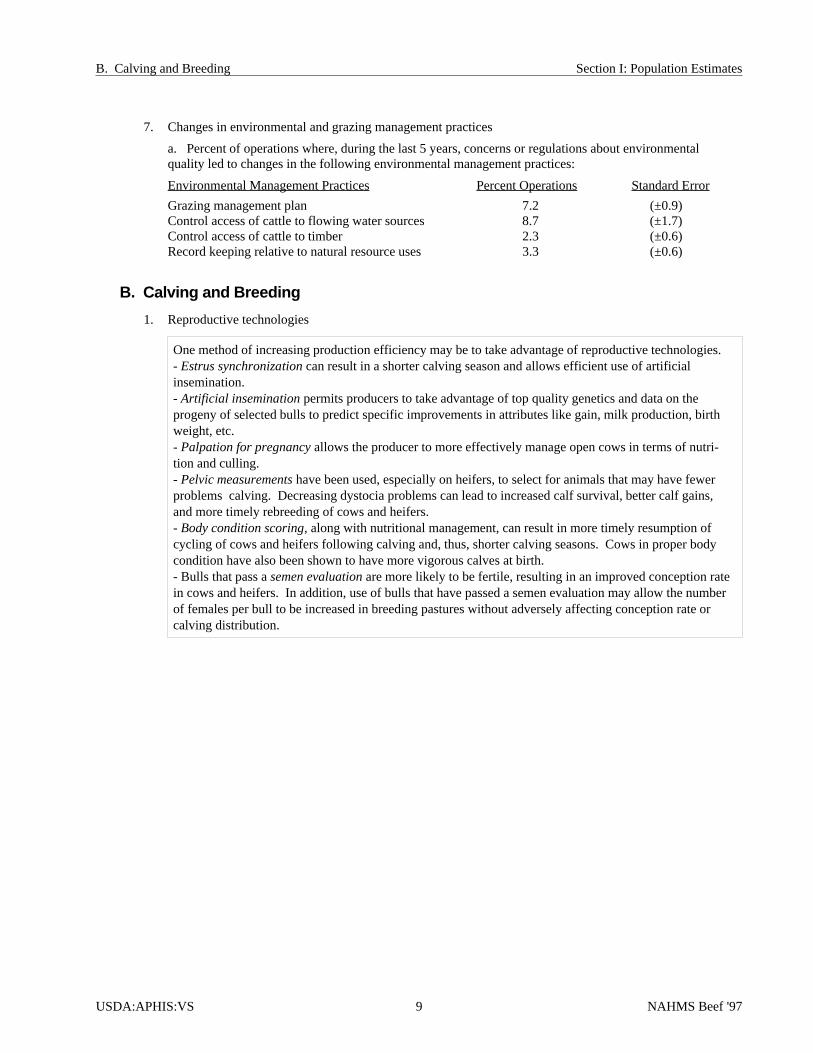
7. Changes in environmental and grazing management practices
a. Percent of operations where, during the last 5 years, concerns or regulations about environmentalquality led to changes in the following environmental management practices:
Environmental Management Practices Percent Operations Standard Error
Grazing management plan 7.2 (±0.9)Control access of cattle to flowing water sources 8.7 (±1.7)Control access of cattle to timber 2.3 (±0.6)Record keeping relative to natural resource uses 3.3 (±0.6)
B. Calving and Breeding
1. Reproductive technologies
One method of increasing production efficiency may be to take advantage of reproductive technologies.- Estrus synchronizationcan result in a shorter calving season and allows efficient use of artificialinsemination.- Artificial inseminationpermits producers to take advantage of top quality genetics and data on theprogeny of selected bulls to predict specific improvements in attributes like gain, milk production, birthweight, etc.- Palpation for pregnancyallows the producer to more effectively manage open cows in terms of nutri-tion and culling.- Pelvic measurementshave been used, especially on heifers, to select for animals that may have fewerproblems calving. Decreasing dystocia problems can lead to increased calf survival, better calf gains,and more timely rebreeding of cows and heifers.- Body condition scoring, along with nutritional management, can result in more timely resumption ofcycling of cows and heifers following calving and, thus, shorter calving seasons. Cows in proper bodycondition have also been shown to have more vigorous calves at birth.- Bulls that pass asemen evaluationare more likely to be fertile, resulting in an improved conception ratein cows and heifers. In addition, use of bulls that have passed a semen evaluation may allow the numberof females per bull to be increased in breeding pastures without adversely affecting conception rate orcalving distribution.
B. Calving and Breeding Section I: Population Estimates
USDA:APHIS:VS 9 NAHMS Beef '97
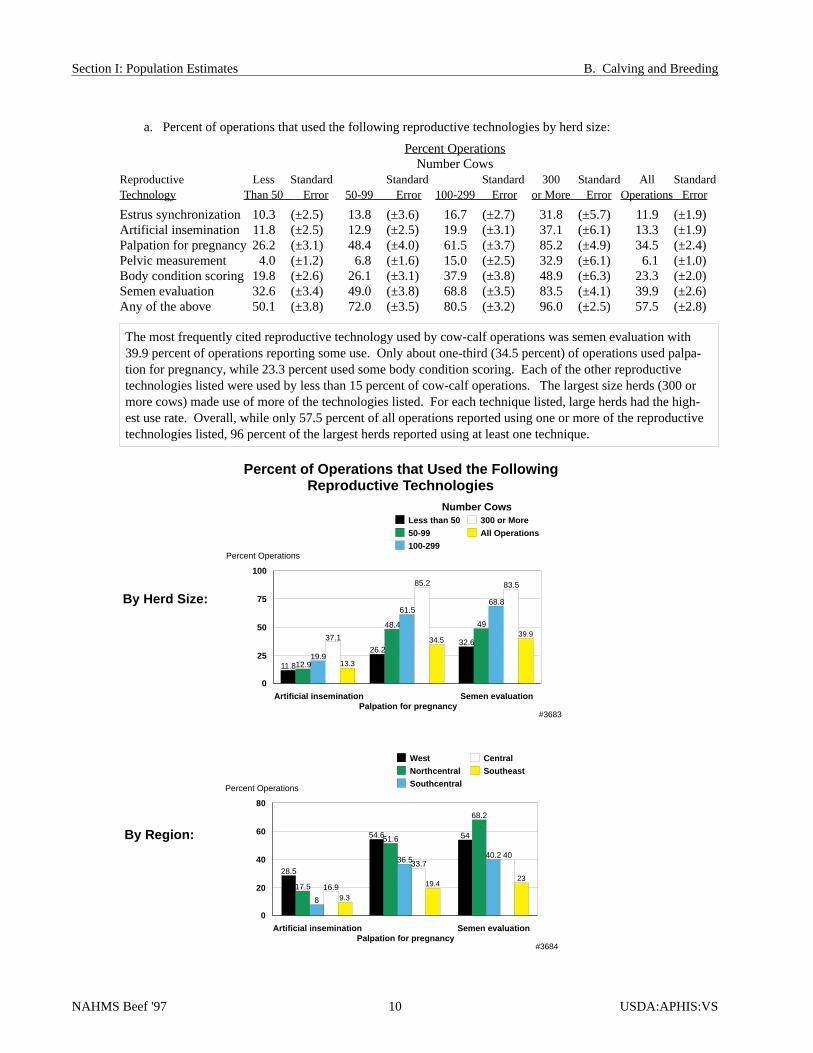
a. Percent of operations that used the following reproductive technologies by herd size:
Percent OperationsNumber Cows
Reproductive Less Standard Standard Standard 300 Standard All StandardTechnology Than 50 Error 50-99 Error 100-299 Error or More Error Operations Error
Estrus synchronization 10.3 (±2.5) 13.8 (±3.6) 16.7 (±2.7) 31.8 (±5.7) 11.9 (±1.9)Artificial insemination 11.8 (±2.5) 12.9 (±2.5) 19.9 (±3.1) 37.1 (±6.1) 13.3 (±1.9)Palpation for pregnancy 26.2 (±3.1) 48.4 (±4.0) 61.5 (±3.7) 85.2 (±4.9) 34.5 (±2.4)Pelvic measurement 4.0 (±1.2) 6.8 (±1.6) 15.0 (±2.5) 32.9 (±6.1) 6.1 (±1.0)Body condition scoring 19.8 (±2.6) 26.1 (±3.1) 37.9 (±3.8) 48.9 (±6.3) 23.3 (±2.0)Semen evaluation 32.6 (±3.4) 49.0 (±3.8) 68.8 (±3.5) 83.5 (±4.1) 39.9 (±2.6)Any of the above 50.1 (±3.8) 72.0 (±3.5) 80.5 (±3.2) 96.0 (±2.5) 57.5 (±2.8)
The most frequently cited reproductive technology used by cow-calf operations was semen evaluation with39.9 percent of operations reporting some use. Only about one-third (34.5 percent) of operations used palpa-tion for pregnancy, while 23.3 percent used some body condition scoring. Each of the other reproductivetechnologies listed were used by less than 15 percent of cow-calf operations. The largest size herds (300 ormore cows) made use of more of the technologies listed. For each technique listed, large herds had the high-est use rate. Overall, while only 57.5 percent of all operations reported using one or more of the reproductivetechnologies listed, 96 percent of the largest herds reported using at least one technique.
13.3
34.539.937.1
85.2 83.5
19.9
61.568.8
12.9
48.4 49
11.8
26.232.6
Artificial inseminationPalpation for pregnancy
Semen evaluation
0
25
50
75
100
Percent Operations
Less than 50
50-99
100-299
300 or More
All Operations
Percent of Operations that Used the FollowingReproductive Technologies
Number Cows
#3683
9.3
19.423
16.9
33.740
8
36.540.2
17.5
51.6
68.2
28.5
54.6 54
Artificial inseminationPalpation for pregnancy
Semen evaluation
0
20
40
60
80
Percent Operations
West
Northcentral
Southcentral
Central
Southeast
#3684
By Herd Size:
By Region:
Section I: Population Estimates B. Calving and Breeding
NAHMS Beef '97 10 USDA:APHIS:VS

b. Percent of operations that used the following reproductive technologies by region:
Percent OperationsRegion
Reproductive Standard North- Standard South- Standard Standard StandardTechnology West Error central Error central Error Central Error Southeast Error
Estrus synchronization 21.1 (±5.9) 14.5 (±3.3) 7.8 (±4.1) 19.3 (±5.5) 6.7 (±2.0)Artificial insemination 28.5 (±6.4) 17.5 (±3.7) 8.0 (±4.1) 16.9 (±4.9) 9.3 (±2.6)Palpation for pregnancy 54.6 (±5.7) 51.6 (±4.0) 36.5 (±5.9) 33.7 (±4.4) 19.4 (±3.8)Pelvic measurement 13.7 (±2.5) 12.8 (±2.5) 2.4 (±0.7) 4.8 (±1.6) 5.3 (±2.7)Body condition scoring 37.3 (±5.2) 31.2 (±4.4) 16.2 (±3.4) 37.7 (±5.7) 12.1 (±3.4)Semen evaluation 54.0 (±6.4) 68.2 (±4.3) 40.2 (±6.4) 40.0 (±4.7) 23.0 (±4.3)Any of the above 77.7 (±7.4) 77.3 (±4.1) 58.3 (±6.4) 67.1 (±6.1) 35.4 (±4.9)
There was some indication of regional differences in use of reproductive technologies in cow-calf herds.In general, operations in the Southcentral and Southeast were least likely to use any of the reproductivetechnologies listed. Only 35.4 percent of operations in the Southeast used any of the listed techniques.The West and Northcentral regions had the highest percentages using any of the technologies.
c. For operations that did not use a specific reproductive technology, percent of operations by reason for notusing it:
Percent OperationsReproductive Does Labor; Lack of Too difficult;Technology Not Work Time Facilities Cost Complicated Other Total
Estrus synchronization 2.4 36.0 7.8 13.5 19.5 20.8 100.0Standard Error (±0.6) (±2.8) (±1.6) (±2.3) (±2.5) (±2.7)
Artificial insemination 3.0 38.8 7.3 12.5 19.6 18.8 100.0Standard Error (±1.2) (±2.9) (±1.3) (±2.0) (±2.7) (±2.8)
Palpation for pregnancy 0.3 33.9 11.1 18.7 14.4 21.6 100.0Standard Error (±0.2) (±3.7) (±2.7) (±3.1) (±2.5) (±3.2)
Pelvic measurement 2.5 32.8 6.4 14.5 19.2 24.6 100.0Standard Error (±0.8) (±2.8) (±1.3) (±2.3) (±2.5) (±2.8)
Body condition scoring 2.4 32.2 3.9 8.3 22.6 30.6 100.0Standard Error (±0.8) (±3.1) (±0.9) (±1.9) (±2.9) (±3.6)
Semen evaluation 0.5 26.5 6.8 16.8 20.3 29.1 100.0Standard Error (±0.2) (±3.4) (±1.9) (±3.0) (±3.5) (±3.9)
For most operations that did not use the reproductive management techniques, labor was the critical fac-tor. Approximately one-third of producers cited labor as the reason for non-use in each of the techniquecategories. Roughly one-fifth of the producers said that the techniques were too complicated or difficultto perform. With the exceptions of semen evaluation and palpation, the categories oflabor andcompli-cated or difficult to performtogether accounted for over 50 percent of the non-use of each of thetechniques.
B. Calving and Breeding Section I: Population Estimates
USDA:APHIS:VS 11 NAHMS Beef '97

C. Health Management
1. Castration
Castration of calves not destined for breeding has been advocated. While bull calves may have improvedgains and feed efficiency without the need for growth promoting implants, they can be difficult to handle infeeding programs and can cause physical injury to each other as they become more aggressive. This can re-sult in significant bruising and loss of quality of the beef product. Castration later in life is thought to be morestressful for the animals and raises concern for humane treatment.
a. Percent of operations that castrated any male calves born in 1996 before sale by herd size:
Percent OperationsNumber Cows
Less Standard Standard Standard 300 Standard All StandardThan 50 Error 50-99 Error 100-299 Error or More Error Operations Error
69.8 (±4.0) 83.6 (±3.1) 88.6 (±2.9) 97.8 (±2.1) 74.5 (±3.0)
Most operations (74.5 percent) castrated male calves prior to sale. Therefore, 25.5 percent of operations didnot castrate male calves prior to sale. Although some of the operations not castrating prior to sale could havebeen selling breeding bulls, it is unlikely that all of these operations were offering breeding bulls for sale. Asherd size increased, the percentage of operations castrating male calves increased to a maximum of 97.8 per-cent of operations with 300 or more cows castrating some bull calves.
b. Percent of operations that castrated any male calves born in 1996 before sale by region:
Percent OperationsRegion
Standard North- Standard South- Standard Standard StandardWest Error central Error central Error Central Error Southeast Error
89.2 (±7.7) 95.8 (±2.6) 63.6 (±6.4) 82.8 (±5.7) 65.0 (±6.4)
Operations in the Southcentral and Southeast were less likely to castrate calves before sale than those in otherregions.
c. For operations that castrated male calves born in 1996 before sale, percent of operations by average age(in days) when male calves were castrated:
Average Age (Days) Percent Operations Standard Error
0 - 31 39.0 (±3.1)32 - 61 20.7 (±2.5)62 - 92 16.0 (±2.4)93 - 122 8.0 (±1.4)123 or more 16.3 (±2.1)
Total 100.0
Most operations (59.7 percent) castrated male calves at an average age of 61 days or less. Few operations(16.3 percent) castrated calves when their average age was 123 days or more.
Section I: Population Estimates C. Health Management
NAHMS Beef '97 12 USDA:APHIS:VS

d. Average age in days (and operation average age) of male calves when castrated before sale:
Average Standard Operation StandardAge (Days) Error Average Age (Days) Error
68.1 (±2.7) 70.9 (±4.2)
After adjusting for number of calves castrated on each operation, the average age of calves castrated was68.1 days. The average age for all operations where calves were castrated was 70.9 days. The fact thatthese ages are similar would indicate that there was not a marked difference in average age at castrationfor large and small operations.
e. For operations that castrated male calves before sale, percent of operations by primary method ofcastration and herd size:
Percent OperationsNumber Cows
Primary Less Standard Standard Standard 300 Standard All StandardMethod Than 50 Error 50-99 Error 100-299 Error or More Error Operations Error
Remove testicleswith a blade 49.4 (±4.2) 64.6 (±4.3) 69.6 (±3.6) 80.5 (±4.4) 55.4 (±3.0)
Rubber band (Elastrator band)at less than 3 monthsof age 43.7 (±4.2) 28.9 (±4.3) 23.6 (±3.4) 10.2 (±3.3) 37.8 (±3.0)
Clamp/Burdizzo(crush cords) 5.3 (±1.5) 6.3 (±1.6) 5.8 (±1.6) 8.5 (±3.1) 5.6 (±1.0)
Rubber tubing (E-Z-E castrator)at more than 3 monthsof age 1.6 (±0.9) 0.1 (±0.1) 0.1 (±0.1) 0.8 (±0.8) 1.1 (±0.6)
Other 0.0 (±0.0) 0.1 (±0.1) 0.9 (±0.5) 0.0 (±0.0) 0.1 (±0.1)
Total 100.0 100.0 100.0 100.0 100.0
The most common method of castration was to remove testicles with a blade (55.4 percent of operations).The second most common method of castration was use of rubber bands applied to the neck of the scro-tum at less than 3 months of age (37.8 percent of operations). Other methods were used relativelyinfrequently.
There were differences in the preferred method of castration by herd size. Larger herds used a blade to re-move testicles much more commonly (80.5 percent) than the smallest herds (49.4 percent). Small herdswere almost equally split between using a blade to remove the testicles (49.4 percent) and using a rubberband on young calves (43.7 percent).
Remove testicles with blade55.4%
Rubber band <3 months37.8%
Clamp/Burdizzo5.6%
Rubber tubing >3 months1.1%
Other0.1%
Percent of Operations by Primary Method of Castration
*For operations that castrated male calves before sale.USDA APHIS VS B f '97 #
#3685
C. Health Management Section I: Population Estimates
USDA:APHIS:VS 13 NAHMS Beef '97

2. Weaning management
Management of calves around the time of weaning can impact their subsequent health. For optimum calfhealth post-weaning, many would advocate some sort of vaccination program aimed at preventing illness asso-ciated with respiratory viruses as well as a program to minimize stress on the animals as they make thetransition from a milk and forage diet to a forage and concentrate based diet. This program might includeholding calves for a period of time after weaning but prior to sale to allow them to become accustomed to eat-ing from a feedbunk.
a. Percent of operations by number of days weaned calves (for purposes other than breeding) were heldbefore they were sold by region:
Percent OperationsRegion
Number Standard North- Standard South- Standard Standard Standard All StandardDays West Error central Error central Error Central Error Southeast Error Operations Error
0 25.1 (±4.2) 31.4 (±4.4) 50.9 (±6.4) 29.3 (±5.9) 53.5 (±6.5) 42.4 (±3.0)1-31 32.8 (±6.2) 5.8 (±1.9) 26.9 (±6.1) 14.2 (±4.9) 11.4 (±3.9) 17.5 (±2.4)32-61 6.7 (±2.6) 8.2 (±2.0) 7.8 (±4.3) 13.6 (±3.5) 5.4 (±1.6) 8.3 (±1.5)62-92 7.3 (±1.8) 16.3 (±3.9) 1.7 (±0.7) 11.1 (±3.6) 7.5 (±2.6) 7.7 (±1.2)93-122 5.6 (±1.6) 10.3 (±2.0) 0.8 (±0.3) 3.0 (±1.0) 10.2 (±4.6) 5.6 (±1.4)123 or more 22.5 (±4.6) 28.0 (±3.7) 11.9 (±3.2) 28.8 (±4.6) 12.0 (±3.7) 18.5 (±1.9)
Total 100.0 100.0 100.0 100.0 100.0 100.0
Nearly half (42.4 percent) of operations did not hold calves after weaning for any time prior to sale. Approxi-mately one-fifth (18.5 percent) of operations held calves for 123 days or more prior to sale, indicating thatcalves were placed into a stocker or backgrounding program or that ownership may have been retained all theway through the finishing period. Only 25.8 percent of operations held calves for a period of 1 to 61 daysprior to sale. The Southcentral and Southeastern regions were the least likely to hold weaned calves for anylength of time. Operators in the West, Northcentral, and Central regions tended to retain ownership of theircalves the longest.
042.4%
1-3117.5%
32-618.3%
62-927.7%
93-1225.6%
123 or more18.5%
Percent of Operations by Number of DaysWeaned Calves* Were Held Before Sold
*For purposes other than breeding.USDA APHIS VS #3686
#3686
Section I: Population Estimates C. Health Management
NAHMS Beef '97 14 USDA:APHIS:VS

b. Average weaning weight (lbs) over the previous 3 years by calf gender and region:
Average Weaning Weight (lbs)Region
Standard North- Standard South- Standard Standard Standard All StandardGender West Error central Error central Error Central Error Southeast Error Operations Error
Steers or bulls 561 (±6) 544 (±6) 510 (±7) 516 (±8) 493 (±7) 526 (±3)Heifers 521 (±6) 504 (±6) 472 (±5) 472 (±7) 447 (±6) 484 (±3)
The average weaning weight for steers and bulls over the previous 3 years on cow-calf operations repre-sented by the study was 526 pounds. For heifers, the 3-year average was 484 pounds. Weaning weightsof steers or bulls and heifers were greater in the West and Northcentral regions, while the Southeast re-ported the lightest weaning weights. Variations could be due to genetic, weaning age, or environmental(such as nutrition) differences.
c. Percent (and operation average percent) of cows that weighed less at weaning than they did 1 weekafter calving:
Percent Standard Operation Average StandardCows1 Error Percent Cows Error
42.4 (±2.4) 49.8 (±2.9)
Nearly half (42.4 percent) of cows lost weight between calving and weaning. The operation average per-centage of cows losing weight between calving and weaning was 49.8 percent.
d. Average (and operation average) weight (in pounds) of mature beef cows at the time calves were weaned:
Average Standard Operation Average StandardWeight (lbs.)2 Error Weight (lbs.) Error
1,057 (±5) 1,016 (±9)
With the introduction of exotic breeds with larger frame sizes into breeding programs, there has been con-cern that the size of the average cow is increasing. In addition, there has been some concern that thecarrying capacity of the operation may be negatively impacted with larger size animals and that producersmay not be accounting for these changes as they plan their nutrition programs. Average weight of maturebeef cows at the time of weaning was 1,057 pounds. Average of the reported weights (herd averages) forall operations was 1,016 pounds indicating a tendency for smaller operations to have slightly lighter cowsat weaning.
Producers estimated reported weights for cows, therefore estimates may not have represented the trueweights. Larger operations may have had more access to scales and thereby have had closer estimates oftheir cow weights.
C. Health Management Section I: Population Estimates
USDA:APHIS:VS 15 NAHMS Beef '97
1 Percent cows weighted by number of calves weaned in 1996.
2 Average weight weighted by number of calves weaned in 1996.

3. Vaccinations administereda. Percent of operations that used the following vaccines in the last 12 months by age group:
Percent OperationsAge Group
22 Days Weaned Replacement1-21 through Heifers Through Bred
Vaccine Days Weaning Breeding Heifers Cows Bulls
GENERAL (Respiratory and/or Reproductive):IBR (rednose, infectious bovine rhinotracheitis) 1.9 28.4 16.8 9.3 18.0 13.8
Standard Error (±0.6) (±2.5) (±1.8) (±1.5) (±2.1) (±2.0)BVD (bovine viral diarrhea) 1.5 25.3 16.3 9.2 17.4 13.2
Standard Error (±0.6) (±2.3) (±1.9) (±1.5) (±2.0) (±1.9)Hemophilussomnus 0.5 16.2 6.9 3.8 6.7 4.9
Standard Error (±0.2) (±1.6) (±1.0) (±0.7) (±1.2) (±1.1)RESPIRATORY:
PI3 (parainfluenza type 3) 0.9 22.8 13.1 7.0 13.7 9.7Standard Error (±0.3) (±2.2) (±1.4) (±0.9) (±1.6) (±1.5)
BRSV (bovine respiratory syncitial virus) 1.3 24.5 12.1 5.8 11.4 8.4Standard Error (±0.5) (±2.3) (±1.3) (±0.9) (±1.5) (±1.4)
Pasteurella 0.4 9.9 4.6 1.8 2.7 2.2Standard Error (±0.1) (±1.4) (±1.0) (±0.4) (±0.8) (±0.8)
REPRODUCTIVE:Brucellaabortus N/A 14.7 24.7 N/A N/A N/A
Standard Error N/A (±2.1) (±1.9) N/A N/A N/ALeptospira N/A 9.7 18.0 13.3 28.5 20.0
Standard Error N/A (±1.8) (±2.1) (±1.7) (±2.3) (±2.1)Campylobacter (vibrio) N/A N/A 11.0 8.9 20.1 12.8
Standard Error N/A N/A (±1.4) (±1.1) (±1.8) (±1.5)Trichomoniasis N/A N/A 0.2 0.2 1.1 0.9
Standard Error N/A N/A (±0.1) (±0.1) (±0.5) (±0.5)CLOSTRIDIAL:
C. chauvoei (blackleg) and/orC. septicum(malignant edema) 6.8 61.9 21.7 6.6 13.9 8.3Standard Error (±0.9) (±2.9) (±2.1) (±1.0) (±1.7) (±1.4)
C. perfringens C and D(enterotoxemia, overeating) 5.8 46.5 16.7 5.9 12.7 7.6Standard Error (±0.7) (±2.8) (±1.7) (±0.9) (±1.7) (±1.5)
Other clostridial vaccinations 4.5 37.2 11.6 4.3 8.2 5.7Standard Error (±0.6) (±2.7) (±1.4) (±0.7) (±1.3) (±1.2)
DIGESTIVE:Rota/Corona 1.1 0.1 0.3 3.7 4.0 N/A
Standard Error (±0.4) (±0.1) (±0.1) (±0.6) (±0.6) N/AE. coli 0.7 0.2 0.4 3.4 4.7 N/A
Standard Error (±0.3) (±0.1) (±0.2) (±0.6) (±0.6) N/ASalmonella 0.2 0.5 0.0 0.1 0.1 0.0
Standard Error (±0.1) (±0.4) (±0.0) (±0.0) (±0.1) (±0.0)OTHER:
Anaplasmosis 0.0 0.7 0.2 0.1 0.8 0.9Standard Error (±0.0) (±0.6) (±0.1) (±0.1) (±0.5) (±0.4)
Johne’s disease 0.0 0.1 N/A N/A N/A N/AStandard Error (±0.0) (±0.1) N/A N/A N/A N/A
Moraxellabovis (pinkeye) 1.2 8.4 4.0 0.1 5.0 4.5Standard Error (±0.7) (±1.5) (±1.1) (±0.1) (±1.1) (±1.1)
Wart virus 0.0 0.2 0.3 2.5 0.1 0.0Standard Error (±0.0) (±0.1) (±0.1) (±0.9) (±0.0) (±0.0)
Section I: Population Estimates C. Health Management
NAHMS Beef '97 16 USDA:APHIS:VS

The most commonly vaccinated age group was between 22 days of age and weaning. This age group re-ceived the most vaccinations against IBR, BVD, PI3, BRSV, and clostridial disease. Approximately 25percent of operations vaccinated this age group against each of these diseases. Most operations used aclostridial vaccine against either blackleg and/or malignant edema (61.9 percent) or enterotoxemia (46.5percent).
Vaccinations against reproductive diseases, such as leptospira (28.5 percent) and camplylobacter (20.1percent) were the primary focus of the cow herd vaccination program. IBR and BVD were also used insome herds (18.0 percent and 17.4 percent, respectively). Bred heifers were generally not vaccinated asoften as beef cows or heifers prior to breeding.
Vaccines against agents associated with digestive diseases (rotavirus, coronavirus,E. coli, or Salmonella)were not frequently used in any of the groups.
4. Type of vaccination
a. Percent of operations using vaccinations against specific viruses for calves through weaning by type ofvaccine:
Percent OperationsBoth Killed Killed or Not
Stand. Modified Stand. & Modified Stand. Modified Stand. Vaccinated Stand.Virus Killed Error Live Error Live Error Unknown Error Against Error Total
Bovine viral diarrhea (BVD)12.0 (±1.4) 7.2 (±1.0) 3.7 (±1.6) 2.5 (±0.7) 74.6 (±2.3) 100.0
Infectious bovine rhinotracheitis (IBR)9.5 (±1.4) 11.8 (±1.4) 4.6 (±1.7) 2.7 (±0.7) 71.4 (±2.5) 100.0
Bovine respiratory syncytial virus (BRSV)7.8 (±1.3) 10.8 (±1.1) 3.4 (±1.5) 2.9 (±0.9) 75.1 (±2.3) 100.0
Percentages of producers that used killed versus modified live virus vaccines to protect calves against res-piratory disease were similar. Slightly more producers used killed vaccines against BVD (12.0 percent)compared to modified live virus vaccines (7.2 percent).
b. For operations that used killed vaccinations against the following viruses, percent of operations thatre-vaccinated within 60 days:
Virus Percent Operations Standard Error
Bovine viral diarrhea (BVD) 27.9 (±4.5)Infectious bovine rhinotracheitis (IBR) 27.2 (±4.2)Bovine respiratory syncytial virus (BRSV) 29.4 (±4.7)
When producers did use killed products for calves, less than 30 percent followed manufacturers’ recom-mendations for boostering the primary vaccination.
C. Health Management Section I: Population Estimates
USDA:APHIS:VS 17 NAHMS Beef '97

5. Calf respiratory vaccinationa. Percent of operations by number of times calves were vaccinated for respiratory disease before sale:
Percent OperationsRegion
Number Standard North- Standard South- Standard Standard Standard All StandardTimes West Error central Error central Error Central Error Southeast Error Operations Error
0 49.5 (±6.5) 40.1 (±4.1) 73.0 (±6.0) 54.6 (±5.7) 78.2 (±4.8) 64.3 (±2.6)1 28.0 (±5.1) 37.2 (±4.5) 22.1 (±5.9) 27.7 (±4.7) 11.8 (±3.1) 22.8 (±2.3)2 20.0 (±3.7) 20.2 (±3.5) 4.4 (±2.2) 17.7 (±4.8) 9.8 (±4.0) 12.2 (±1.8)3 or more 2.5 (±0.8) 2.5 (±0.8) 0.5 (±0.2) 0.0 (±0.0) 0.2 (±0.1) 0.7 (±0.1)
Total 100.0 100.0 100.0 100.0 100.0 100.0
A vaccination program for respiratory diseases can improve calf health prior to and after weaning. Nearlytwo-thirds (64.3 percent) of operations did not vaccinate calves for respiratory diseases prior to sale. Nearlyone-fourth (22.8 percent) of producers vaccinated calves once for respiratory diseases prior to sale. Relativelyfew producers (12.9 percent) vaccinated calves two or more times prior to sale. Lack of vaccination is onlypartly explained by producers who sold calves immediately at weaning. Just over 80 (80.7) percent of produc-ers who did not hold weaned calves for any length of time prior to sale were not vaccinating calves forrespiratory disease. However, over one-half (51.3 percent) of producers that did hold calves for a period oftime after weaning were also not vaccinating calves for respiratory disease. (Not shown.)
Producers in the Northcentral region were more likely to vaccinate calves for respiratory disease, while calvesfrom the Southeast were the least likely to have been vaccinated.
b. For operations that vaccinated calves for respiratory disease at least once, percent of operations thatvaccinated calves for respiratory disease by age group:
Age Group Percent Operations Standard Error
From birth up to 30 days prior to weaning 41.9 (±4.2)30 to 14 days prior to weaning 28.4 (±3.9)Less than 14 days prior to weaning 4.7 (±1.1)At weaning 36.0 (±4.1)After weaning but before sale 19.6 (±3.0)
Effectiveness of vaccination at weaning is reduced because of stress and immune suppression associated withthis event. Among the 35.7 percent of operations that were vaccinating calves for respiratory disease prior tosale, the largest percentage were doing so at least 30 days prior to weaning (41.9 percent). The next most com-mon time for vaccinating calves was at weaning (36.0 percent of operations) followed by the period from 14to 30 days prior to weaning (28.4 percent of operations). (Note that these percentages do not sum to 100 per-cent since an operation could answer in multiple categories if they vaccinated calves more than once prior tosale.)
Section I: Population Estimates C. Health Management
NAHMS Beef '97 18 USDA:APHIS:VS
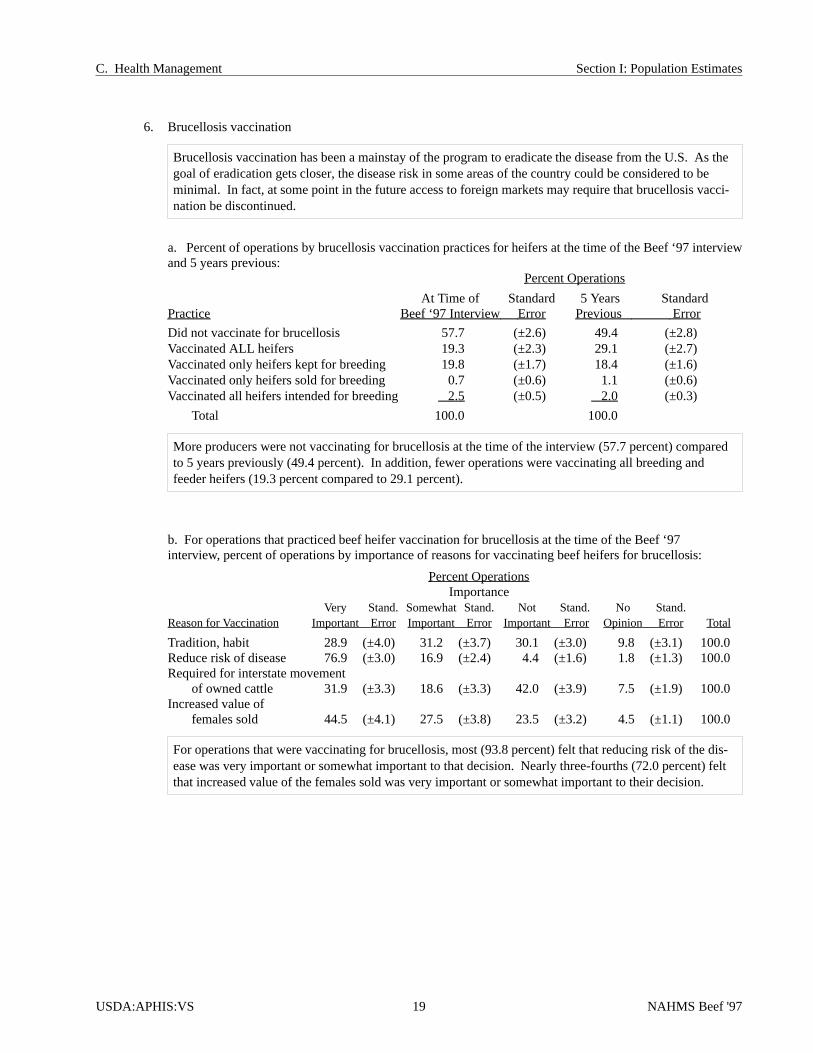
6. Brucellosis vaccination
Brucellosis vaccination has been a mainstay of the program to eradicate the disease from the U.S. As thegoal of eradication gets closer, the disease risk in some areas of the country could be considered to beminimal. In fact, at some point in the future access to foreign markets may require that brucellosis vacci-nation be discontinued.
a. Percent of operations by brucellosis vaccination practices for heifers at the time of the Beef ‘97 interviewand 5 years previous:
Percent Operations
At Time of Standard 5 Years StandardPractice Beef ‘97 Interview Error Previous Error
Did not vaccinate for brucellosis 57.7 (±2.6) 49.4 (±2.8)Vaccinated ALL heifers 19.3 (±2.3) 29.1 (±2.7)Vaccinated only heifers kept for breeding 19.8 (±1.7) 18.4 (±1.6)Vaccinated only heifers sold for breeding 0.7 (±0.6) 1.1 (±0.6)Vaccinated all heifers intended for breeding 2.5 (±0.5) 2.0 (±0.3)
Total 100.0 100.0
More producers were not vaccinating for brucellosis at the time of the interview (57.7 percent) comparedto 5 years previously (49.4 percent). In addition, fewer operations were vaccinating all breeding andfeeder heifers (19.3 percent compared to 29.1 percent).
b. For operations that practiced beef heifer vaccination for brucellosis at the time of the Beef ‘97interview, percent of operations by importance of reasons for vaccinating beef heifers for brucellosis:
Percent OperationsImportance
Very Stand. Somewhat Stand. Not Stand. No Stand.Reason for Vaccination Important Error Important Error Important Error Opinion Error Total
Tradition, habit 28.9 (±4.0) 31.2 (±3.7) 30.1 (±3.0) 9.8 (±3.1) 100.0Reduce risk of disease 76.9 (±3.0) 16.9 (±2.4) 4.4 (±1.6) 1.8 (±1.3) 100.0Required for interstate movement
of owned cattle 31.9 (±3.3) 18.6 (±3.3) 42.0 (±3.9) 7.5 (±1.9) 100.0Increased value of
females sold 44.5 (±4.1) 27.5 (±3.8) 23.5 (±3.2) 4.5 (±1.1) 100.0
For operations that were vaccinating for brucellosis, most (93.8 percent) felt that reducing risk of the dis-ease was very important or somewhat important to that decision. Nearly three-fourths (72.0 percent) feltthat increased value of the females sold was very important or somewhat important to their decision.
C. Health Management Section I: Population Estimates
USDA:APHIS:VS 19 NAHMS Beef '97

c. Percent of operations by “belief” that brucellosis vaccination practice affects the sales price of heiferssold by region:
Percent OperationsRegion
Standard North- Standard South- Standard Standard Standard All StandardBelief West Error central Error central Error Central Error Southeast Error Operations Error
No effect 34.1 (±5.8) 47.3 (±5.1) 60.2 (±6.7) 60.8 (±6.7) 84.8 (±4.0) 63.6 (±3.0)Increases price
61.5 (±6.5) 51.6 (±5.1) 39.7 (±6.7) 39.2 (±6.7) 15.2 (±4.0) 35.9 (±3.0)Decreases price
4.4 (±3.0) 1.1 (±0.8) 0.1 (±0.1) 0.0 (±0.0) 0.0 (±0.0) 0.5 (±0.3)
Total 100.0 100.0 100.0 100.0 100.0 100.0
Overall, more producers (63.6 percent) felt that brucellosis vaccination did not affect sales price of heiferssold. Slightly over one-third (35.9 percent) of producers felt that the impact on price was positive. Perceivedimpact of brucellosis vaccination on price was not uniform across all regions. In the West and Northcentral re-gions, more producers felt that vaccination tended to increase sales price. In all other regions, more producersfelt that there was no effect on price. The Southeast region had the smallest percentage of producers (15.2 per-cent) that felt there was a positive impact on price of heifers sold. Note: the relatively large standard errors onthe percent of operations believing in a price decrease, due to the small number of respondents in this category.
d. For operations that believed vaccinating for brucellosis affects the sales price of heifers sold, operationaverage estimated change in value (dollars per head) for heifers sold:
Operation AverageChange (Dollars per head) Standard Error
Increase price $45.09 (±$5.28)Decrease price -$28.57 (±$8.00)Net price change $44.03 (±$5.21)
For the producers that did feel there was positive impact on price from vaccinating heifers for brucellosis, theaverage additional value per head was estimated at $45.09.
53.1
47.3
47.4
29.1
21.5
20
19.8
19.6
External parasites
Internal parasites
Open/late calvers
Pinkeye
Calf scours
Weak calves
Foot rot
Calf pneumonia/shipping fever
0 20 40 60
Percent Operations
Strongly AgreedAgreed
Percent of Operations that Agreed the Following HealthConditions "Had a Significant Economic Impact on the
Cow-calf Operation in the Last 12 Months"
Level of Agreement
#3688
No effect63.6%
Increases price35.9%
Decreases price0.5%
Percent of Operations by Beliefthat Brucellosis Vaccination Practice
Affects Sales Price of Heifers Sold
#3687
Section I: Population Estimates C. Health Management
NAHMS Beef '97 20 USDA:APHIS:VS

7. Economic impact of selected health conditions
a. Percent of operations by level of agreement with the statement that the specified health condition “hada significant economic impact on the cow-calf operation in the last 12 months, including the cost of prevention,cost of treatment, and lost production”:
Percent OperationsLevel of Agreement
Health Strongly Standard Standard Standard Strongly Standard No StandardConditions Agree Error Agree Error Disagree Error Disagree Error Opinion Error Total
PARASITES:Internal parasites 15.9 (±2.2) 31.4 (±2.5) 39.9 (±3.0) 6.7 (±1.6) 6.1 (±1.5) 100.0External parasites (flies, lice,
ticks, grubs) 17.7 (±2.3) 35.4 (±2.4) 36.2 (±3.0) 5.7 (±1.6) 5.0 (±1.5) 100.0
DIGESTIVE:Calf scours 5.9 (±1.1) 15.6 (±1.5) 53.2 (±2.9) 15.8 (±2.6) 9.5 (±1.8) 100.0Bloat/colic/ulcers (abomasal/stomach)
0.5 (±0.1) 6.2 (±1.1) 59.7 (±2.9) 20.3 (±2.7) 13.3 (±2.0) 100.0Coccidiosis 2.5 (±0.7) 8.3 (±1.0) 55.9 (±3.0) 18.7 (±2.7) 14.6 (±2.1) 100.0
REPRODUCTIVE:Open/late calvers 7.6 (±1.0) 39.8 (±2.9) 38.6 (±2.9) 8.1 (±2.0) 5.9 (±1.5) 100.0Abortion 3.5 (±0.8) 12.1 (±1.7) 56.4 (±2.9) 18.0 (±2.6) 10.0 (±1.8) 100.0Weak calves 2.1 (±0.5) 17.9 (±2.0) 55.4 (±2.9) 16.8 (±2.5) 7.8 (±1.5) 100.0
RESPIRATORY:Calf pneumonia/shipping fever
3.7 (±0.6) 15.9 (±1.8) 54.7 (±2.9) 15.3 (±2.4) 10.4 (±1.9) 100.0Cow asthma 0.4 (±0.1) 2.8 (±0.6) 57.2 (±3.0) 19.3 (±2.5) 20.3 (±2.2) 100.0
PLANT-RELATED:Any plant-related
toxicities 2.0 (±0.7) 6.9 (±1.2) 56.9 (±2.9) 20.8 (±2.6) 13.4 (±1.9) 100.0
OTHER:Pinkeye 7.3 (±1.5) 21.8 (±2.0) 48.4 (±2.9) 14.1 (±2.4) 8.4 (±1.8) 100.0Foot rot 2.1 (±0.6) 17.7 (±1.7) 54.2 (±2.9) 16.0 (±2.5) 10.0 (±1.8) 100.0White muscle disease (selenium/vitamin E deficiency)
0.6 (±0.2) 2.2 (±0.5) 52.1 (±2.9) 18.9 (±2.7) 26.2 (±2.4) 100.0Copper deficiency 0.5 (±0.2) 4.3 (±0.9) 48.5 (±2.9) 17.6 (±2.6) 29.1 (±2.5) 100.0Anaplasmosis 0.8 (±0.3) 4.5 (±1.2) 51.7 (±2.9) 17.3 (±2.4) 25.7 (±2.4) 100.0Grass tetany 3.2 (±0.7) 10.8 (±1.4) 55.4 (±2.9) 15.5 (±2.4) 15.1 (±2.1) 100.0
When asked about diseases or conditions that may have a significant economic impact on their cow-calfoperation, the largest percentage of producers (53.1 percent) agreed that external parasites had a signifi-cant impact in the last 12 months. Open (non-pregnant) and late-calving cows (47.4 percent ofoperations) and internal parasites (47.3 percent of operations) were also thought to have had a significanteconomic impact. Calf problems included calf scours (21.5 percent), weak calves (20.0 percent), and calfpneumonia or shipping fever (19.6 percent).
C. Health Management Section I: Population Estimates
USDA:APHIS:VS 21 NAHMS Beef '97

8. Problem diseases for the U.S. beef cattle industry
a. Percent of operations by level of agreement with the statement that the specified disease “is asignificant problem for the U. S. beef cattle industry”:
Percent OperationsLevel of Agreement
StronglyStandard Standard StandardStronglyStandard No StandardDisease Agree Error Agree Error Disagree Error Disagree Error Opinion Error Total
Tuberculosis 6.6 (±1.4) 20.1 (±2.4) 36.7 (±2.8) 5.3 (±1.5) 31.3 (±2.8) 100.0Brucellosis 10.9 (±1.5) 32.9 (±2.6) 30.4 (±2.7) 5.4 (±1.5) 20.4 (±2.3) 100.0Trichomoniasis 3.3 (±0.7) 12.9 (±1.9) 22.3 (±2.4) 3.4 (±1.0) 58.1 (±2.8) 100.0Johne’s disease (M. paratuberculosis)
1.5 (±0.6) 12.8 (±1.9) 18.8 (±2.1) 3.2 (±0.9) 63.7 (±2.7) 100.0Bovine leukosis virus infection (BLV)
2.2 (±0.7) 11.6 (±1.6) 18.7 (±2.2) 3.0 (±0.9) 64.5 (±2.6) 100.0
Less than half of cow-calf producers felt that any of the listed diseases were a significant threat for the U.S.beef cattle industry. Brucellosis had the most support (43.8 percent of operations) of any of the conditions.Other diseases were either not perceived to be as much of a threat or producers were unfamiliar with the dis-ease condition. Over half of the producers had no opinion about Trichomoniasis, Johne’s disease, and bovineleukosis virus (BLV). Other evidence would suggest that, at least for Johne’s disease, much of this is basedon lack of knowledge of the disease (see D.15.a. on page 32).
Section I: Population Estimates C. Health Management
NAHMS Beef '97 22 USDA:APHIS:VS

D. Disease Control
1. Vaccination of cattle brought onto the operation
When considering disease control programs, many producers and veterinarians think primarily about vac-cinating. Yet there are many other management practices that can be used to minimize both diseaseoccurrence and the risk of introducing new diseases onto operations.
a. For operations that brought cattle onto the operation in the last 3 years, percent of operations thatnormally required animals to be vaccinated against the following diseases before bringing them onto theoperation:
Vaccination Percent Operations Standard Error
Brucellosis (female cattle) 28.1 (±2.9)Bovine viral diarrhea (BVD) 13.1 (±1.9)Infectious bovine rhinotracheitis (IBR) 13.2 (±2.0)Leptospirosis 13.7 (±1.7)
Less than one-third (28.1 percent) of producers that brought cattle onto the operation in the previous 3years usually required vaccination of females for brucellosis. Approximately 13 percent of operationsadding new animals in the previous 3 years usually required vaccination for bovine viral diarrhea (BVD),infectious bovine rhinotracheitis (IBR), or leptospirosis. All of these diseases are capable of causing sig-nificant reproductive losses in the herd. In all cases, new animals that are not vaccinated could becarrying these disease agents when introduced to the herd if not tested to be negative.
b. For operations that brought cattle onto the operation in the last 3 years, percent of operations thatnormally required animals to be tested for the following diseases before bringing them onto the operation:
Vaccination Percent Operations Standard Error
Brucellosis (for animals 2 years of age or older) 38.9 (±3.3)Johne’s disease (M. paratuberculosis) 0.2 (±0.1)Bovine viral diarrhea (BVD) 1.0 (±0.3)Bovine tuberculosis (TB) 3.8 (±0.9)Anything else 0.6 (±0.2)
Another method of assessing the status of animals to be added to the herd is to test the animals for evi-dence of recent infection with various disease agents.
The only disease that a significant percentage of producers tested for prior to adding new animals is bru-cellosis (38.9 percent). This practice may be because of interstate movement requirements rather than aconscious decision on the part of the producer to test for the disease and thus minimize risk. Relativelyfew producers tested for any of the other listed diseases indicating a relative lack of concern or lack ofknowledge about these disease agents and the risks that they may pose. Some of the lack of concern inthe case of BVD could stem from an active immunization program in the herd, however producers maynot recognize the potential risks associated with introduction of cattle persistently infected with BVDvirus. Again, lack of testing for Johne’s disease (0.2 percent) is likely a reflection of producers’ lack ofknowledge about Johne’s disease (see D.15.a. on page 32).
D. Disease Control Section I: Population Estimates
USDA:APHIS:VS 23 NAHMS Beef '97
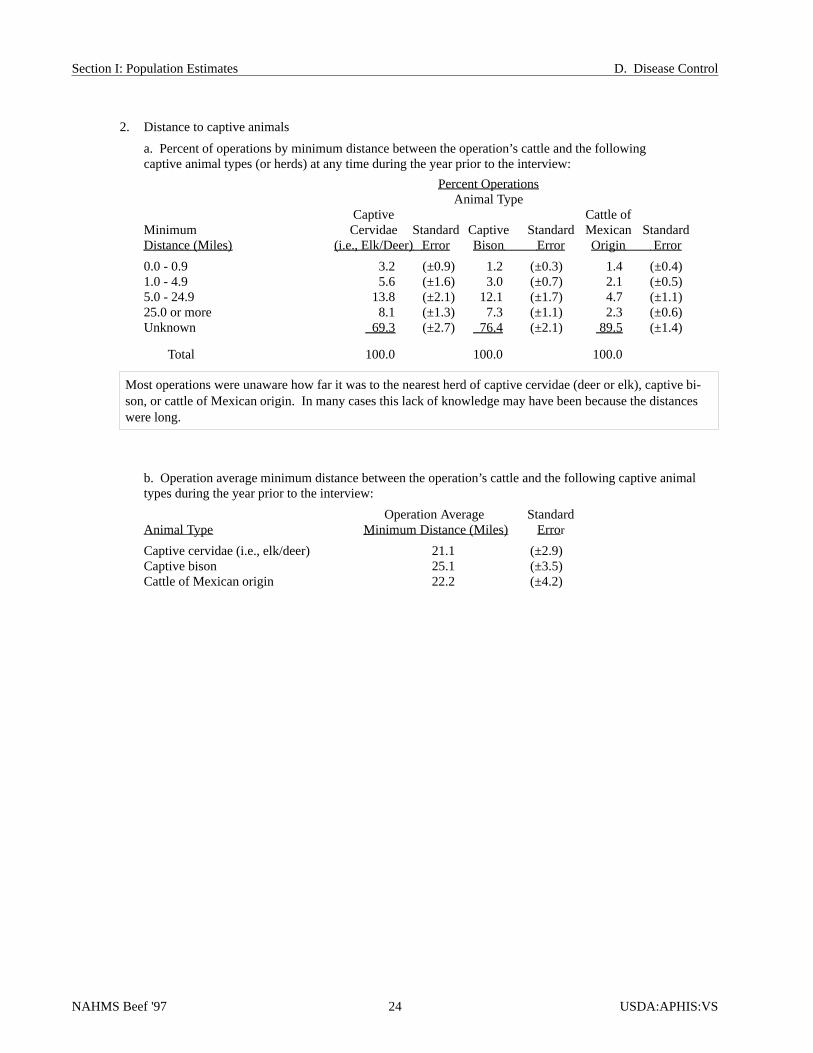
2. Distance to captive animals
a. Percent of operations by minimum distance between the operation’s cattle and the followingcaptive animal types (or herds) at any time during the year prior to the interview:
Percent OperationsAnimal Type
Captive Cattle ofMinimum Cervidae Standard Captive Standard Mexican StandardDistance (Miles) (i.e., Elk/Deer) Error Bison Error Origin Error
0.0 - 0.9 3.2 (±0.9) 1.2 (±0.3) 1.4 (±0.4)1.0 - 4.9 5.6 (±1.6) 3.0 (±0.7) 2.1 (±0.5)5.0 - 24.9 13.8 (±2.1) 12.1 (±1.7) 4.7 (±1.1)25.0 or more 8.1 (±1.3) 7.3 (±1.1) 2.3 (±0.6)Unknown 69.3 (±2.7) 76.4 (±2.1) 89.5 (±1.4)
Total 100.0 100.0 100.0
Most operations were unaware how far it was to the nearest herd of captive cervidae (deer or elk), captive bi-son, or cattle of Mexican origin. In many cases this lack of knowledge may have been because the distanceswere long.
b. Operation average minimum distance between the operation’s cattle and the following captive animaltypes during the year prior to the interview:
Operation Average StandardAnimal Type Minimum Distance (Miles) Error
Captive cervidae (i.e., elk/deer) 21.1 (±2.9)Captive bison 25.1 (±3.5)Cattle of Mexican origin 22.2 (±4.2)
Section I: Population Estimates D. Disease Control
NAHMS Beef '97 24 USDA:APHIS:VS

3. Frequency of wildlife sightings
a. Percent of operations by frequency of seeing the following wildlife species within one mile of the cattle onthe operation during the winter and spring of the last 3 years:
Percent OperationsWildlife Specie
Wild Standard Wild Standard Wild Standard Wild StandardFrequency Deer Error Elk Error Bison Error Pig Error
Frequently: more than4 times per month 69.9 (±2.6) 1.7 (±0.4) 0.0 (±0.0) 5.4 (±1.5)
Occasionally: about1-4 times per month 15.2 (±2.1) 0.9 (±0.3) 0.0 (±0.0) 1.8 (±0.4)
Rarely: less than onceper month 9.7 (±1.7) 1.2 (±0.2) 0.2 (±0.1) 6.5 (±1.6)
Never 5.2 (±1.1) 96.2 (±0.5) 99.8 (±0.1) 86.3 (±2.1)
Total 100.0 100.0 100.0 100.0
Concern has been raised about the potential for transmission of disease between cattle and wildlife popu-lations. Deer were commonly seen within one mile of cattle on cow-calf operations. All of the otherwildlife species listed were seen near cattle much less frequently.
4. Access to dairy cattle
a. Percent of operations where beef cattle had direct access to dairy cattle by region:Percent Operations
RegionStandard North- Standard South- Standard Standard Standard All Standard
West Error central Error central Error Central Error Southeast Error Operations Error
4.6 (±1.3) 11.2 (±3.6) 3.1 (±1.7) 4.3 (±1.6) 1.1 (±0.5) 3.9 (±0.8)
In most cases beef and dairy operations were separate. Beef cattle had direct access to dairy cattle ononly 3.9 percent of cow-calf operations.
b. For operations where beef cattle had direct access to dairy cattle, percent of operations by type ofcontact with dairy cattle:
Type of Contact Percent Operations Standard Error
Nose-to-nose contact through a fence 82.6 (±8.5)Shared pasture 48.9 (±9.9)Shared water source 56.9 (±10.1)
For those operations where the beef cattle did have direct access to dairy cattle, this access was most com-monly nose-to-nose contact through a fence (82.6 percent of operations). Beef and dairy cattle shared apasture in slightly less than half (48.9 percent) of the instances where they had direct access.
D. Disease Control Section I: Population Estimates
USDA:APHIS:VS 25 NAHMS Beef '97

5. Type of grazing used
a. Percent of operations by type of grazing used during the year prior to the Beef ‘97 interview, and, if used,percent of operations where the operation’s cattle were commingled with cattle from other operations:
Percent OperationsStandard Where Cattle Standard
Type of Grazing Percent Operations Error Were Commingled Error
Grazed on public lands 4.6 (±0.6) 22.9 (±4.5)Grazed in a grazing association 1.0 (±0.2) 69.3 (±9.2)Grazed on leased, private lands 38.1 (±2.5) 16.9 (±3.5)Grazed on own land 96.0 (±1.0) 9.3 (±1.7)
Commingling cattle from different herds can lead to the introduction of new disease agents to beef herds un-less efforts are undertaken to coordinate the health care and prevention activities in all herds that arecommingled.
Most operations (96.0 percent) grazed cattle on land that was owned by the operation. On 9.3 percent of theseoperations, cattle from other herds were commingled with those belonging to the operation. The next mostcommon source of grazed forage was through leased private lands (38.1 percent of operations). In 16.9 per-cent of cases, animals from multiple herds were commingled. Although beef cattle were more frequentlycommingled with other herds in grazing associations and on public lands, relatively few operations made useof these types of grazing arrangements.
b. Percent of operations by type of grazing used during the year prior to the Beef ‘97 interview and herd size:
Percent OperationsNumber Cows
Less Standard Standard Standard 300 StandardType of Grazing Than 50 Error 50-99 Error 100-299 Error or More Error
Grazed on public lands 1.4 (±0.5) 6.5 (±1.5) 18.0 (±2.9) 36.4 (±5.4)Grazed in a grazing association 0.1 (±0.1) 1.6 (±0.8) 4.7 (±1.3) 11.0 (±3.5)Grazed on leased, private lands 30.6 (±3.2) 49.1 (±3.9) 68.0 (±3.5) 68.0 (±5.9)Grazed on own land 95.8 (±1.3) 96.1 (±1.2) 97.3 (±1.0) 95.5 (±2.2)
Regardless of size of herd, most operations made use of some grazing on land owned by the operation. Fre-quency of use of other types of grazed forages was related to herd size with larger herds using each of theother sources of grazed forages more frequently than smaller herds.
Section I: Population Estimates D. Disease Control
NAHMS Beef '97 26 USDA:APHIS:VS

c. Percent of operations by type of grazing used during the year prior to the Beef ‘97 interview and region:Percent Operations
RegionStandard North- Standard South- Standard Standard Standard
Type of Grazing West Error central Error central Error Central Error Southeast Error
Grazed on public lands 32.8 (±4.4) 9.7 (±2.1) 0.1 (±0.1) 0.0 (±0.0) 1.1 (±1.1)Grazed in a grazing
association 7.1 (±1.8) 2.7 (±1.0) 0.1 (±0.1) 0.0 (±0.0) 0.0 (±0.0)Grazed on leased,
private lands 49.8 (±6.4) 63.0 (±4.8) 41.0 (±5.3) 45.3 (±6.1) 16.1 (±3.4)Grazed on own land 85.4 (±7.9) 98.8 (±0.6) 94.1 (±1.6) 98.4 (±0.7) 98.2 (±0.9)
Use of grazing on public lands and grazing associations were most common in the western region. Graz-ing on leased private lands was most common in the Northcentral region. Relatively few herds in theSoutheast made use of grazed forages other than on lands owned by the operation. This fact is likely a re-flection of the smaller average herd size in the Southeast making it easier to satisfy the forage needs ofthe herd on owned lands rather than needing to find outside sources.
6. Distance to grazing areas
a. Percent of operations by average number of miles the herd was moved to grazing areas that were notcontiguous with the operation and region:
Percent OperationsRegion
Distance Standard North- Standard South- Standard Standard Standard All Standard(Miles) West Error central Error central Error Central Error Southeast Error Operations Error
0 (not moved) 51.4 (±6.3) 32.6 (±4.7) 71.3 (±5.1) 58.2 (±6.1) 81.9 (±3.9) 64.9 (±2.4)0.1 - 0.9 4.2 (±2.4) 7.5 (±3.0) 2.9 (±1.6) 8.3 (±3.5) 5.7 (±2.6) 5.6 (±1.2)1.0 - 3.9 9.3 (±2.9) 20.4 (±3.7) 7.6 (±1.9) 10.9 (±2.4) 6.3 (±2.5) 9.7 (±1.2)4.0 - 9.9 8.0 (±2.0) 19.5 (±4.0) 6.1 (±1.3) 10.6 (±2.4) 2.4 (±0.8) 7.8 (±0.9)10 or more 27.1 (±4.3) 20.0 (±3.5) 12.1 (±4.6) 12.0 (±5.3) 3.7 (±2.2) 12.0 (±1.9)
100.0 100.0 100.0 100.0 100.0 100.0
b. For operations that moved cattle for grazing, operation average number of miles the herd was moved byregion:
Operation Average (Miles)Region
Standard North- Standard South- Standard Standard Standard All StandardWest Error central Error central Error Central Error Southeast Error Operations Error
25.6 (±3.5) 20.7 (±7.8) 9.4 (±1.7) 5.8 (±1.1) 5.7 (±2.4) 12.8 (±2.1)
Although only 12 percent of operations moved herds 10 or more miles (Table 6.a.), some herds moved aconsiderable distance (e.g., up to 400 miles), especially in the West and Northcentral regions, whichcaused the average distance herds moved to be quite high.
D. Disease Control Section I: Population Estimates
USDA:APHIS:VS 27 NAHMS Beef '97

7. Carcass disposal
a. Of operations where beef cattle or calves died in 1996, percent of operations (and percent of beef cattleand calves that died1) using the following carcass disposal methods:
Percent Standard Percent Beef StandardDisposal Method Operations Error Cattle & Calf Deaths Error
Buried on the operation 39.6 (±2.7) 33.5 (±2.5)Landfill 4.6 (±1.0) 4.9 (±1.0)Renderer 24.7 (±2.3) 20.0 (±2.1)Burned 33.1 (±2.6) 34.6 (±2.5)Other 0.7 (±0.2) 0.8 (±0.4)No disposal method 8.6 (±2.2) 6.2 (±2.1)
Total 100.0
The manner in which dead animals are disposed of on the operation can impact the availability of diseaseagents for transmission to other susceptible animals in the herd. Burial on the operation was used to disposeof dead cattle and calves on 39.6 percent of operations. One-third (33.1 percent) of operations reported burn-ing some of the carcasses of dead animals. About one-quarter (24.7 percent) of operations sent somecarcasses to the renderer. Other disposal methods were used relatively infrequently. Approximately one-thirdof dead calves and cattle were disposed of by burning (34.6 percent) and burial (33.5 percent) each. Render-ers were used to dispose of 20.0 percent of carcasses from cow-calf operations. (Note, the percentage ofoperations using each of the disposal methods does not sum to 100 percent since an operation could use morethan one means of disposal.)
Section I: Population Estimates D. Disease Control
NAHMS Beef '97 28 USDA:APHIS:VS
1 Includes number of stillbirths, weaned calf deaths, and breeding cattle deaths.

8. Fly control
a. Percent of operations by fly control methods used during the year prior to the interview:
Fly Control Method Percent Operations Standard Error
Environmental fly control (sprays, foggers, strips) 22.8 (±2.4)Topical products (dustbags, dips, sprays, backrubs) 60.6 (±2.8)Treated ear tags 30.8 (±2.6)Biologic control (predators) 0.9 (±0.3)Oral products 7.3 (±1.4)Other 0.9 (±0.5)Any of the above 80.8 (±2.4)
Flies can cause significant reductions in cattle productivity. In addition, heel fly larvae can impact hidequality when cattle grubs form breathing holes in the skin of the back.
A large percentage of operations (80.8 percent) used some form of fly control. Topical products weremost common (60.6 percent of operations) followed by treated ear tags (30.8 percent) and environmentalcontrol (22.8 percent).
9. Rodent control
a. Percent of operations by rodent control methods routinely used during the year prior to the interview:
Rodent Control Method Percent Operations Standard Error
Chemicals/bait 38.6 (±2.7)Traps 10.9 (±1.9)Cats 57.6 (±2.9)Other 5.0 (±1.4)Any of the above 74.8 (±2.5)
22.8
60.6
30.8
0.97.3
0.9
80.8
Envi
ronm
enta
l
Topi
cal p
rodu
ct
Trea
ted
ear t
ag
Biol
ogic
cont
rol
Ora
l pro
duct
s
Oth
er
Any
0
25
50
75
100
Percent Operations
Percent of Operations by Fly Control Methods Used
#3689
D. Disease Control Section I: Population Estimates
USDA:APHIS:VS 29 NAHMS Beef '97

10. Feed storage unit accessibility
a. Percent of operations where storage units used for grain and protein supplement fed to cows preventedthe following animals from accessing the feed:
Animals Percent Operations Standard Error
Dogs 63.2 (±2.8)Cats 59.6 (±2.9)Birds 57.0 (±2.9)Rodents 43.3 (±3.1)Any of above 75.1 (±2.4)
11. Females calving per acre
a. Percent of operations by the maximum number of females per acre at any one time in area wherethe majority of females calve:
Number Females per Acre Percent Operations Standard Error
Less than 0.5 44.4 (±2.9)0.5 - 0.9 18.5 (±2.1)1.0 - 4.9 27.3 (±2.6)5.0 - 9.9 4.2 (±0.6)10.0 - 19.9 2.0 (±0.4)20.0 or more 3.6 (±0.9)
Total 100.0
Density of animals in the calving area can give some indication of potential infection pressure of diseaseagents for calves. Another part of the picture is how quickly young calves are removed from the calving area(see D.12.c. and D.12.d. on the next page). For 62.9 percent of operations, peak density of females in the calv-ing area was less than one female per acre.
Section I: Population Estimates D. Disease Control
NAHMS Beef '97 30 USDA:APHIS:VS

12. Selected breeding and calving management practices used at the time of the Beef ‘97 interview
Percent of operations by the following management practices used:
Management Practice Percent Operations Standard Error
a. Embryo transfer 1.8 (±0.4)If embryo transfer used, Holstein cows or heiferswere recipients 39.4 (±10.8)
b. During the calving season, frequency of using the calving area to hold sick cows:Frequently (once or more per month) 6.4 (±1.6)Occasionally (less than five times in 6 months) 7.5 (±1.4)Rarely (once or less in 6 months) 28.6 (±2.5)Never 57.5 (±2.9)
Total 100.0
c. Separate cow-calf pairs from pregnant cows: 19.8 (±1.8)
d. For operations where cow-calf pairs were separated from pregnant cows, operation average number ofdays after calving that cow-calf pairs were separated from pregnant cows:
OperationAverage (Days) Standard Error
8.3 (±1.0)
A variety of other management practices on the cow-calf operation could be a source of new diseaseagents or facilitate transmission of disease agents within the herd. Very few cow-calf operations (1.8 per-cent) made use of any embryo transfer, though in 39.4 percent of these instances, Holstein cows or heiferswere used as recipients indicating that these animals were likely brought onto the operation. Calving ar-eas were rarely used to hold sick animals on cow-calf operations. Overall 86.1 percent of operationsnever used the calving area to hold sick animals or did so two times per year or less. Cow-calf pairs wereseparated from pregnant cows on only 19.8 percent of operations. In some cases herd size may not war-rant separate calving pastures. Also over half of cow-calf producers had no set calving season indicatingthat the whole herd would probably be managed as a unit regardless of stage of the production cycle.
13. Travel to fairs or shows
a. Percent of operations where any cattle from the operation left for fairs or shows and returned to thepremises during the last year:
Percent Operations Standard Error
5.8 (±0.9)
D. Disease Control Section I: Population Estimates
USDA:APHIS:VS 31 NAHMS Beef '97

14. Manure handling
a. Percent of operations (and percent of beef cows on those operations) where the following methodswere used to dispose of manure:
Percent Standard Percent StandardManure Disposal Method Operations Error Beef Cows Error
Drag or harrow pastures 43.0 (±3.0) 44.2 (±2.2)Hauled and spread onto land used for grazing
or forage production for the operation 25.5 (±2.4) 34.1 (±2.0)Hauled and spread onto other land 21.9 (±1.9) 25.4 (±1.6)Other 2.5 (±1.2) 1.7 (±0.4)No disposal 34.7 (±2.8) 32.4 (±2.0)
b. Frequency of using equipment for manure handling that was also used to handle feed fed to heifers lessthan 12 months of age:
Management Practice Percent Operations Standard Error
Regularly (at least weekly) 3.2 (±0.5)Occasionally (less than weekly) 9.2 (±1.4)Never 87.6 (±1.5)
Total 100.0
15. Familiarity with Johne’s disease
a. Percent of operations by degree of familiarity with Johne’s disease in cattle before the time of theBeef ‘97 interview and herd size:
Percent OperationsNumber Cows
Degree Less Standard Standard Standard 300 Standard All Standardof Familiarity Than 50 Error 50-99 Error 100-299 Error or More Error OperationsError
Hadn’t heard of it before73.1 (±3.3) 65.6 (±3.4) 56.1 (±3.8) 59.1 (±6.2) 69.9 (±2.5)Recognized the name,
not much else 20.1 (±3.1) 23.8 (±2.9) 33.1 (±3.7) 33.6 (±6.2) 22.3 (±2.3)Knew some basics 4.6 (±1.4) 8.7 (±1.9) 6.1 (±1.5) 2.5 (±1.2) 5.4 (±1.1)Fairly knowledgeable 2.2 (±0.8) 1.9 (±0.7) 4.7 (±1.6) 4.8 (±2.2) 2.4 (±0.6)
Total 100.0 100.0 100.0 100.0 100.0
Most producers (over 90 percent), regardless of herd size, knew very little about Johne’s disease. This findingindicates a significant need for education of beef producers regarding this disease. This situation may be justone example of an overall need to educate beef producers about many of the infectious diseases and the poten-tial for control aside from vaccination.
Section I: Population Estimates D. Disease Control
NAHMS Beef '97 32 USDA:APHIS:VS

16. Opinions on U.S. outbreak preparedness
a. Percent of operations by level of agreement with the statement that “the United States is well preparedto handle outbreaks of livestock diseases currently not found in this country, such as foot and mouth diseaseand rinderpest”, and herd size:
Percent OperationsNumber Cows
Level of Less Standard Standard Standard 300 Standard All StandardAgreement Than 50 Error 50-99 Error 100-299 Error or More Error Operations Error
Strongly agree 10.4 (±2.5) 12.5 (±2.5) 11.0 (±2.3) 10.5 (±3.1) 10.8 (±1.9)Agree 50.4 (±4.0) 47.6 (±4.0) 52.8 (±3.9) 53.4 (±6.1) 50.3 (±3.0)Disagree 13.0 (±2.6) 18.7 (±2.9) 11.3 (±2.0) 11.1 (±3.5) 13.6 (±1.9)Strongly disagree 3.0 (±1.2) 6.3 (±3.2) 9.4 (±2.9) 6.5 (±2.4) 4.3 (±1.0)No opinion 23.2 (±3.3) 14.9 (±2.7) 15.5 (±2.8) 18.5 (±5.2) 21.0 (±2.5)
Total 100.0 100.0 100.0 100.0 100.0
b. Percent of operations by level of agreement with the statement that “the United States is well preparedto handle outbreaks of livestock diseases currently not found in this country, such as foot and mouth disease andrinderpest”, and region:
Percent OperationsRegion
Level of Standard North- Standard South- Standard Standard Standard All StandardAgreement West Error central Error central Error Central Error Southeast Error Operations Error
Strongly agree 8.4 (±2.1) 9.4 (±3.1) 16.0 (±5.3) 12.1 (±3.7) 6.5 (±2.3) 10.8 (±1.9)Agree 63.3 (±5.3) 56.6 (±4.9) 48.3 (±6.5) 40.7 (±5.8) 52.1 (±6.2) 50.3 (±3.0)Disagree 10.0 (±2.6) 9.6 (±2.3) 22.7 (±5.8) 14.2 (±3.2) 7.5 (±2.2) 13.6 (±1.9)Strongly disagree
7.9 (±3.0) 5.6 (±2.1) 4.5 (±2.7) 5.5 (±2.9) 1.5 (±0.6) 4.3 (±1.0)No opinion 10.4 (±3.0) 18.8 (±3.8) 8.5 (±2.2) 27.5 (±5.7) 32.4 (±6.3) 21.0 (±2.5)
Total 100.0 100.0 100.0 100.0 100.0 100.0
D. Disease Control Section I: Population Estimates
USDA:APHIS:VS 33 NAHMS Beef '97

E. Feed Management
1. Creep feeding
a. Percent of operations where unweaned calves had access to creep feed in 1996 by region:
Percent OperationsRegion
Standard North- Standard South- Standard Standard Standard All StandardWest Error central Error central Error Central Error SoutheastError OperationsError
13.8 (±7.5) 31.1 (±4.8) 32.5 (±6.2) 44.3 (±5.6) 19.5 (±4.0) 29.2 (±2.6)
Nearly one-third (29.2 percent) of cow-calf operations used creep feeding in 1996. Creep feeding was mostcommon in the Central region and least common in the West and Southeast. Low use in the West is likely areflection of extensively managed cattle operations and the difficulty in keeping feeders stocked during thesummer grazing period.
b. For operations where unweaned calves had access to creep feed in 1996, percent of operations byaverage number of days they had access:
Number Days Percent Operations Standard Error
1 - 31 16.5 (±4.5)32 - 61 30.3 (±5.2)62 - 92 17.1 (±3.4)93 - 122 14.0 (±2.9)123 or more 22.1 (±4.3)
Total 100.0
The largest percent (30.3 percent) of operations reported using creep feeding from 32 to 61 days. Roughlyequal percentages of operations reported creep feeding for each of the other intervals listed.
13.8
31.1 32.5
44.3
19.5
29.2
Wes
t
Nor
thce
ntra
l
Sout
hcen
tral
Cen
tral
Sout
heas
t
All o
pera
tion
0
10
20
30
40
50
Percent Operations
Percent of Operations Where Unweaned Calves HadAccess to Creep Feed in 1996 by Region
#3690
1-31 days16.5%
32-61 days30.3%
62-92 days17.1%
93-122 days14.0%
123 or more days22.1%
Percent of Operations by Average Number of DaysUnweaned Calves Had Access to Creep Feed
* For operations where unweaned calves had access to creep fed in 1996. #3691
Section I: Population Estimates E. Feed Management
NAHMS Beef '97 34 USDA:APHIS:VS

F. Marketing
1. Marketing calves for feeding
a. Percent of operations that marketed 1996 weaned calves for feeding within 60 days of weaningby region:
Percent OperationsRegion
Standard North- Standard South- Standard Standard Standard All StandardWest Error central Error central Error Central Error Southeast Error Operations Error
58.8 (±7.2) 45.9 (±5.0) 79.7 (±3.6) 54.5 (±5.9) 67.2 (±6.4) 64.5 (±2.7)
Nearly two-thirds (64.5 percent) of producers marketed calves for feeding within 60 days of weaning.Regional differences are shown.
i. Of calves weaned in 1996, percent marketed for feeding within 60 days of weaning by region:
Percent CalvesRegion
Standard North- Standard South- Standard Standard Standard All StandardWest Error central Error central Error Central Error Southeast Error Operations Error
54.1 (±4.8) 28.8 (±3.4) 65.9 (±3.3) 43.8 (±4.5) 62.0 (±4.2) 50.9 (±1.9)
Slightly over half (50.9 percent) of the calves marketed in 1996 were marketed within 60 days of wean-ing. This finding was similar across all regions with the exception of the Northcentral region where only28.8 percent of calves were marketed in that time frame. While nearly two-thirds ofoperationsmarketedcalves within 60 days of weaning (see F.1.a.), only one-half of thecalveswere marketed during this timeperiod. This finding implies that larger operations were retaining calves longer.
54.1
28.8
65.9
43.8
62
50.958.8
45.9
79.7
54.5
67.2 64.5
WestNorthcentral
SouthcentralCentral
SoutheastAll operations
0
25
50
75
100
Percent OperationsCalves
Percent of Operations (and Percent of Calves Marketed)that Marketed 1996 Weaned Calves Within 60 Days of
Weaning by Region
#3692
F. Marketing Section I: Population Estimates
USDA:APHIS:VS 35 NAHMS Beef '97

b. Percent of operations that marketed 1996 weaned calves for feeding within 60 days of weaningby herd size:
Percent OperationsNumber Cows
Less Standard Standard Standard 300 StandardThan 50 Error 50-99 Error 100-299 Error or More Error
65.5 (±3.6) 65.1 (±3.5) 57.6 (±3.7) 64.7 (±6.1)
c. For operations that marketed calves for feeding within 60 days of weaning, percent of operations thatshipped these calves the following distances to the first point of delivery:
Distance (Miles) Percent Operations Standard Error
Less than 50 81.2 (±2.9)50 - 99 12.0 (±2.3)100 - 499 5.2 (±1.3)500 or more 1.9 (±0.5)Unknown 2.9 (±1.8)
Most operations (81.2 percent) shipped calves less than 50 miles to the first point of delivery. Very few opera-tions shipped calves extensive distances for sale.
i. Percent of calves marketed for feeding within 60 days of weaning by distance shipped to the first pointof delivery:
Distance (Miles) Percent Calves Standard Error
Less than 50 64.9 (±3.3)50 - 99 17.3 (±3.4)100 - 499 10.3 (±1.8)500 or more 5.9 (±1.1)Unknown 1.6 (±0.6)
Total 100.0
Approximately two-thirds (64.9 percent) of calves were shipped less than 50 miles to the first point ofdelivery. This information taken with that in F.1.b. above would indicate that larger operations tended to shipcalves farther to the first point of delivery, not surprising given the remoteness of some of the large cow-calfoperations.
Section I: Population Estimates F. Marketing
NAHMS Beef '97 36 USDA:APHIS:VS

d. In 1996, for calves marketed for feeding within 60 days of weaning, operation average pricereceived per hundred weight by gender of calves:
Gender of Calves Operation Average Price/cwt (Dollars) Standard Error
Steers 58.00 (±1.03)Bulls 52.14 (±2.15)Heifers 52.80 (±0.92)
A $5.86 discount per cwt for bull calves equates to an average $30.82 difference per herd between sellingbull calves and steers.
e. For operations that marketed calves for feeding within 60 days of weaning, percent of operations thatusually provided buyers with information about the operation’s calf health program by herd size:
Percent OperationsNumber Cows
Less Standard Standard Standard 300 Standard All StandardThan 50 Error 50-99 Error 100-299 Error or More Error Operations Error
13.9 (±2.3) 23.7 (±3.6) 43.2 (±5.1) 72.7 (±6.7) 19.3 (±1.9)
Calf health programs can add value to calves when communicated to potential buyers. The first step in re-couping the investment in calf health is to advertise. Only 19.3 percent of operations selling calveswithin 60 days of weaning provided buyers with information on their calf health program. This findingwas strongly related to herd size with the smallest herds least likely to provide any information (13.9 per-cent) compared to the largest herds (72.7 percent).
13.9
23.7
43.2
72.7
19.3
Less than 50 50-99 100-299 300 or More All Operations
Number Cows
0
20
40
60
80
Percent Operations
Percent of Operations that UsuallyProvided Buyers with Information About the
Operation's Calf Health Program by Herd Size
*For operations that marketed calves for feeding within 60 days of weaning. $3693
F. Marketing Section I: Population Estimates
USDA:APHIS:VS 37 NAHMS Beef '97

i. For operations that marketed calves for feeding within 60 days of weaning, and that usuallyprovided buyers with information about the operation’s calf health program, percent of operationsby the method the information was conveyed and herd size:
Percent OperationsNumber Cows
Less Standard Standard Standard 300 Standard All StandardMethod Than 50 Error 50-99 Error 100-299 Error or More Error Operations Error
Written documentation 16.4 (±5.3) 23.7 (±7.0) 27.4 (±6.4) 13.2 (±5.4) 20.0 (±3.5)Told buyer orally 70.7 (±7.3) 72.2 (±7.1) 68.5 (±6.6) 73.6 (±7.3) 70.7 (±4.3)Other 12.9 (±5.9) 4.1 (±2.4) 4.1 (±2.2) 13.2 (±5.7) 9.3 (±3.2)
Total 100.0 100.0 100.0 100.0 100.0
The method of communicating the calf health program to the buyer may influence how the information is re-ceived. Telling the buyer orally at the time of sale may not have as much impact as written documentationand it will be more difficult for this information to become part of the longer term record on the calves beingsold. For those operations that communicated information about the calf health program, most (70.7 percent)did so by telling the buyer orally. Only 20.0 percent of these producers (approximately 4 percent of all pro-ducers) provided some written documentation of the calf health program. Although the mid-size herdsshowed a larger percentage using written documentation, the large standard errors in all herd sizes make com-parisons difficult.
Written documentation20.0%
Told buyer orally70.7%
Other9.3%
Percent of Operations by Method Information About theOperation's Calf Health Program was Conveyed to Buyers
#3694*For operations that marketed calves for feeding within 60 days of weaning and that usually providedbuyers with information about the operation's calf health program.
Section I: Population Estimates F. Marketing
NAHMS Beef '97 38 USDA:APHIS:VS

f. For operations that marketed calves for feeding within 60 days of weaning, percent of operationswhere the same person or company tended to buy calves marketed for feeding each year by herd size:
Percent OperationsNumber Cows
Less Standard Standard Standard 300 Standard All StandardThan 50 Error 50-99 Error 100-299 Error or More Error Operations Error
30.3 (±4.4) 31.3 (±4.3) 37.5 (±5.0) 64.4 (±7.0) 31.7 (±3.3)
Larger operations tend to have more repeat buyers than smaller operations, possibly because they arebetter able to sort calves into groups and have full loads.
2. Marketing calves for breeding
a. Percent of operations that sold or planned to sell any of the calves weaned in 1996 for breedingpurposes:
Percent Operations Standard Error
13.1 (±2.1)
b. For operations that sold or planned to sell calves weaned in 1996 for breeding purposes, percent ofoperations selling bulls and percent of operations selling heifers for breeding purposes:
Breeding Calves Percent Operations Standard Error
Bulls 75.7 (±5.3)Heifers 72.1 (±7.8)
30.3 31.337.5
64.4
31.7
Less than 50 50-99 100-299 300 or More All Operations
Number Cows
0
20
40
60
80
Percent Operations
Percent of Operations Where the Same Person orCompany Tended to Buy Calves for Feeding Each
Year by Herd Size
*For operations that marketed calves for feeding within 60 days of weaning. #3695
F. Marketing Section I: Population Estimates
USDA:APHIS:VS 39 NAHMS Beef '97

3. Cull cows
a. Percent of operations that sold cull cows for slaughter in 1996 (and cows culled as a percent ofJanuary 1, 1997, cow inventory) by herd size:
Percent OperationsNumber Cows
Less Standard Standard Standard 300 Standard All StandardPercent Than 50 Error 50-99 Error 100-299 Error or More Error OperationsError
Operations 49.1 (±4.0) 75.1 (±3.5) 89.3 (±2.2) 94.9 (±2.7) 58.3 (±3.0)Cows culled 13.7 (±1.7) 8.9 (±1.0) 9.6 (±0.7) 10.1 (±1.0) 10.8 (±0.6)
As herd size increased, a greater percentage of operations sold cull cows. However, the actual percentages ofcows culled did not vary significantly among operation sizes or region (see F.3.b.)
b. Percent of operations that sold cull cows for slaughter in 1996 (and cows culled as a percent ofJanuary 1, 1997 cow inventory) by region:
Percent OperationsRegion
Standard North- Standard South- Standard Standard Standard All StandardPercent West Error central Error central Error Central Error Southeast Error Operations Error
Operations 68.2 (±7.1) 64.7 (±4.8) 51.5 (±6.2) 65.3 (±5.9) 53.8 (±6.4) 58.3 (±3.0)Cows culled 11.3 (±0.9) 8.0 (±0.5) 14.6 (±1.8) 9.3 (±0.9) 9.8 (±1.7) 10.8 (±0.6)
c. Of the cows culled in 1996, percent known or assumed to be pregnant:
Percent Cows Culled Standard Error
42.7 (±3.0)
d. Percent of cull cows sold for slaughter by distance to the first point of delivery:
Distance (Miles) Percent Cows Standard Error
Less than 50 64.1 (±3.7)50 - 99 25.1 (±3.9)100 - 499 10.1 (±1.6)500 or more 0.2 (±0.1)Unknown 0.5 (±0.2)
Total 100.0
Section I: Population Estimates F. Marketing
NAHMS Beef '97 40 USDA:APHIS:VS

Section II: Sample Profile
A. Responding operations
1. Total cattle and calves on hand, January 1, 1997:Number Responding Operations
Less than 50 23350 - 99 260100 - 399 527400 or more 170
Total 1,190
2. Total beef cows on hand January 1, 1997:
Less than 50 47050 - 99 294100 - 299 330300 or more 96
Total 1,190
3. Total operations by region:
West 261Northcentral 215Southcentral 256Central 196Southeast 262
Total 1,190
A. Responding operations Section II: Sample Profile
USDA:APHIS:VS 41 NAHMS Beef '97
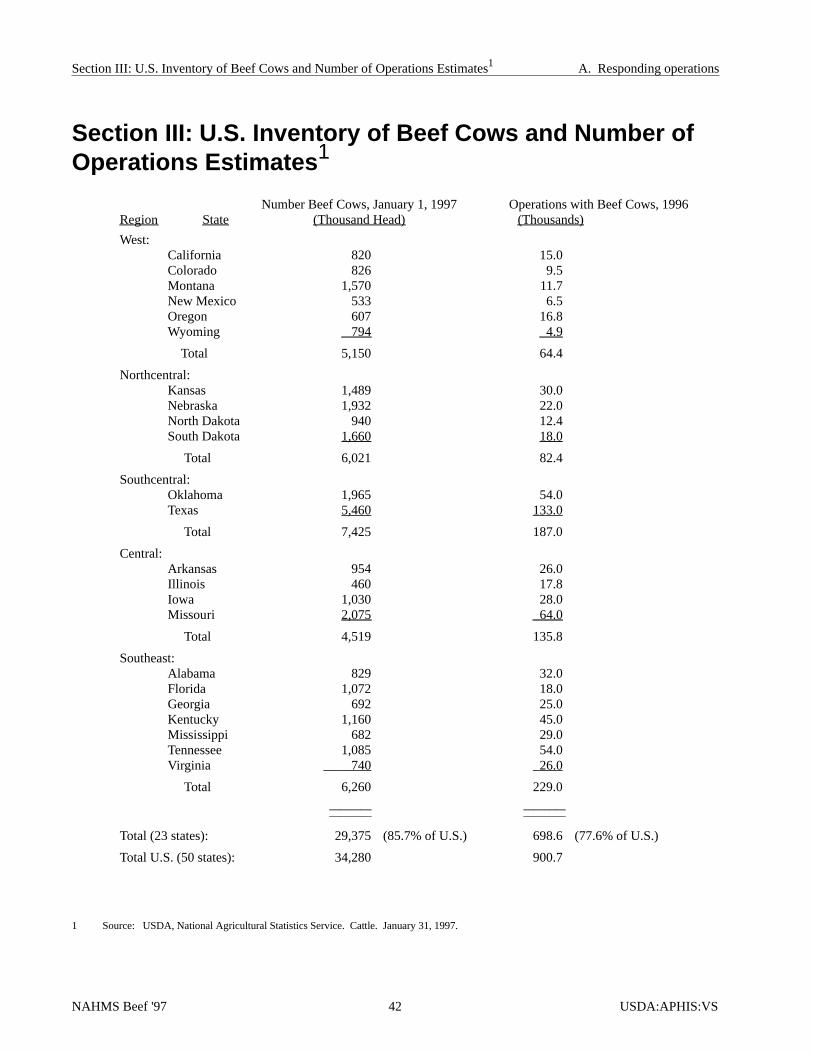
Section III: U.S. Inventory of Beef Cows and Number ofOperations Estimates 1
Number Beef Cows, January 1, 1997 Operations with Beef Cows, 1996Region State (Thousand Head) (Thousands)
West:California 820 15.0Colorado 826 9.5Montana 1,570 11.7New Mexico 533 6.5Oregon 607 16.8Wyoming 794 4.9
Total 5,150 64.4
Northcentral:Kansas 1,489 30.0Nebraska 1,932 22.0North Dakota 940 12.4South Dakota 1,660 18.0
Total 6,021 82.4
Southcentral:Oklahoma 1,965 54.0Texas 5,460 133.0
Total 7,425 187.0
Central:Arkansas 954 26.0Illinois 460 17.8Iowa 1,030 28.0Missouri 2,075 64.0
Total 4,519 135.8
Southeast:Alabama 829 32.0Florida 1,072 18.0Georgia 692 25.0Kentucky 1,160 45.0Mississippi 682 29.0Tennessee 1,085 54.0Virginia 740 26.0
Total 6,260 229.0________ ________________ ________
Total (23 states): 29,375 (85.7% of U.S.) 698.6 (77.6% of U.S.)
Total U.S. (50 states): 34,280 900.7
Section III: U.S. Inventory of Beef Cows and Number of Operations Estimates1 A. Responding operations
NAHMS Beef '97 42 USDA:APHIS:VS
1 Source: USDA, National Agricultural Statistics Service. Cattle. January 31, 1997.

Expected Productsand Related Study Objectives
1. Support global trade by estimating the prevalence of important animal pathogens.
• Johne’s disease (interpretive summary),expected fall 1998.
• Bovine leukosis virus andSalmonella (info sheets),expected summer 1998.
2. Support efforts of the industry to supply quality products.
• Part I: Reference of 1997 Beef Cow-Calf Management Practices, June 1997.
• Part II: Reference of 1997 Beef Cow-Calf Health and Health Management Practices, July 1997.
• Information Sources for Cow-Calf Herds (info sheet), July 1997
• Implants (info sheet),expected February 1998
• Calving management (info sheet),expected February 1998.
• Quality assurance,expected summer 1998.
• Injection sites (info sheet),expected summer 1998.
3. Support the efforts of APHIS to achieve a high level of emergency preparedness.
• Part I: Reference of 1997 Beef Cow-Calf Management Practices, June 1997.
• Part II: Reference of 1997 Beef Cow-Calf Health and Health Management Practices, July 1997.
• Part III: Reference of 1997 Beef Cow-Calf Production Management and Disease Control, Jan. 1998.
4. Describe trends in animal health.
• Part IV: Changes in Beef Cow-Calf Management Practices,expected February 1998.
5. Support disease control efforts.
• Vaccinations (info sheet),expected summer 1998.
• Johnes disease (interpretive summary),expected fall 1998.
• Bovine leukosis virus (BLV) andSalmonella (info sheets),expected summer 1998.
• Part III: Reference of 1997 Beef Cow-Calf Production Management and Disease Control, Jan. 1998.
6. Support efforts of the beef industry to become more efficient.
• Part I: Reference of 1997 Beef Cow-Calf Management Practices, June 1997.
• Identification in Beef Cow-Calf Herds (info sheet), July 1997
• Part III: Reference of 1997 Beef Cow-Calf Production Management and Disease Control, Jan. 1998.

Centers for Epidemiology and Animal HealthUSDA:APHIS:VS, attn. NAHMS
2150 Centre Ave., Bldg. B, MS 2E7 Fort Collins, CO 80526-8117
Telephone: (970) [email protected]
http//www.aphis.usda.gov/vs/ceah/cahm
N247.198