evaluation of beef cow-calf nutrition in yucatan, mexico: ms thesis progress report animal science...
Post on 21-Dec-2015
215 views
TRANSCRIPT

Evaluation of beef cow-calf nutrition in
Yucatan, Mexico:MS thesis progress report
Animal Science
Kotaro Baba
January 2006

Situation
• Beef cattle farming is the main industry in Tizimín
• beef production systems in Yucatan are constrained by:– Declining forage quality as the forage prod
uction system progresses– Low quality and amount in the dry season – Long calving intervals and percentage of c
ows calving each year
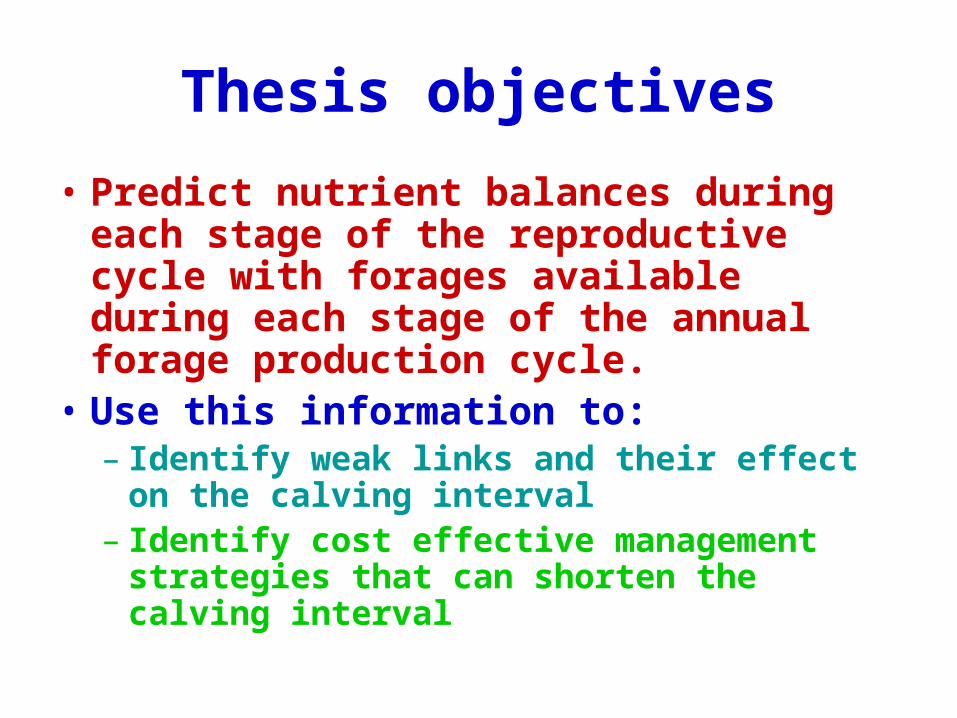
Thesis objectives
• Predict nutrient balances during each stage of the reproductive cycle with forages available during each stage of the annual forage production cycle.
• Use this information to:– Identify weak links and their effect on the
calving interval– Identify cost effective management
strategies that can shorten the calving interval

Procedures
• Use panel of experts to describe current situation– Describe each group in the beef herd– Describe forage composition available
during each season of the year
• Predict nutrient balances for each group in the herd when consuming forages available during each forage growth season

Distribution of calving of Zebu and crossbred cows by month
0
50
100
150
200
250
Jan Feb Mar Apr May Jun Jul Aug Sep Oct Nov Dec
month
calv
ing
fre
qu
en
cy

Conception rate of the Zebu cows at 120 days pospartum by parity
0
0.1
0.2
0.3
0.4
0.5
0.6
1 2 3 4 5 6 more than 7Parity

Forage growth periodsForage growing cycle in Yucatan, (Source Magaña UADY)
0
200
400
600
800
1000
1200
1400
1600
1800
2000
1 2 3 4 5 6 7 8 9 10 11 12month
DM
/kg
/ha
nn1nn2nn3nn4

Grasses grazed by forage growth periods
• Season 1 grass ( June 1- July 31)• Season 2 grass ( August 1-September 30)• Season 3 grass ( October 1- January 30)• Season 4 grass ( February 1-May 31)

Representative farms
• Farm 1: Calving on June 1
• Farm 2: Calving on August 1
• Farm 3: Calving on October 1
• Farm 4: Calving on February 1
• Physiological stages -Early lactation -Mid-late lactation -Early dry -Late Dry
• Parity and age - 1 st lactation cows
- 2nd lactation cows -Mature cows
-heifers

Inputs for the CNCPS
SBW
-1st =400 kg
-2nd=460 kg
-Mature=500 kg
Calf BW
-male 33 kg
-female 30 kg
Weaning weight
-male 210 kg (dry season)
-female 180 kg (dry)
- male 220 kg (rainy)
- female 220 kg (rainy)

Inputs for the CNCPS
Milk production early lactation -1 st= 4 kg -2nd=4.5 kg -mature=5kgMid late lactation-1 st =3 kg-2 nd=3.3 kg-Mature 3.7 kg
Milk fat=4 %Milk CP=3.5 %True protein=3.3 %
CI -1st (rainy) 460 days -1st(dry) 500 days -The others 420 days

BCS change in the rainy season
Rainy season
parity calvingearly
lactationMid-late
lactation Early dry late dry
1st7 6 4 5 6
2nd6 5 4 5 7
≧38 7 6 6 7
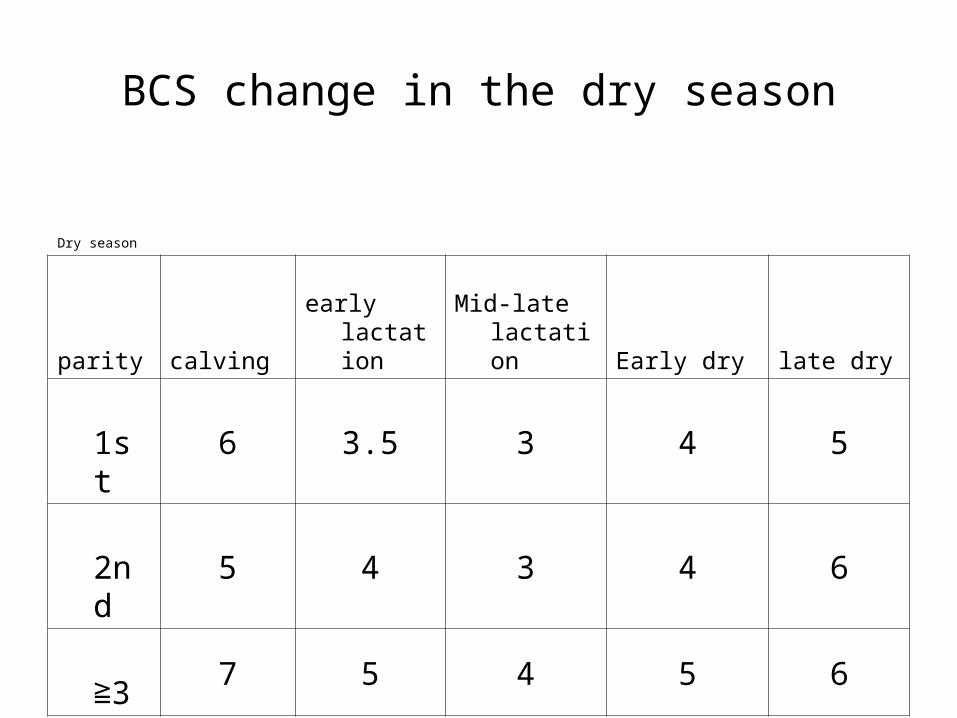
BCS change in the dry season
Dry season
parity calvingearly
lactationMid-late
lactation Early dry late dry
1st6 3.5 3 4 5
2nd5 4 3 4 6
≧37 5 4 5 6

Rations for simulations
• Rations -season of the year and physiological period.
Example,
Early lactation period =90 days
Farm 1 (calving on June 1)
The ration ; 60 days(June1-July 31 with season 1 grass): 30 days( August 1- August 31, season 2 grass)=2:1, (6 kg:3 kg for example)

Simulation 1: grazed grass composition
based on CNCPS feed library

Predicted composition of forages grazed during each of 4 growth
periods• Assume forage quality progressively
declines from beginning of growth in rainy season (season 1) to accumulated forage grazed in the dry season (season 4).
• Used CNCPS feed library to estimate composition of forage grazed during each season.

Estimated composition of grazed forage during each of 4 seasons1
ForageCP% of DM
NDF% in
DM
Lignin% in NDF
Ash% in DM
NDF rate
%/hr
Ether extract% in DM
Season 1 grass
9 67 6 12.7 8.6 3
Season 2 grass
8 72 7 12 6.8 2.6
Season 3 grass
7 74 8 11.5 4.2 2.2
Season 4 grass
5 77 9 11 3 1.6
1Based on CNCPS Feed Library

Simulation 1:early lactation with Grasss 1 and 2
Early lactation Mature with season 1 grass
Inputed DMI 9.94 kg
Predicted DMI 9.94 kg
Inputed Milk 5 kg
ME allowable Milk 6.1 kg
MP allowable Milk 5.7 kg
ME Balance0.33 Mca
l
MP Balance -6.82 g
Day to BCS change 694 days
Early lactation Mature with season 2 grass
Inputed DMI 9.46 kg
Predicted DMI 9.46kg
Inputed Milk 5 kg
ME allowable Milk 2.9kg
MP allowable Milk 3.9 kg
ME Balance-3.27 Mc
al
MP Balance -112g
Day to BCS change 0

Simulation 1:early lactation with Grasses 3 and 4
Early lactation Mature with season 3grass
Inputed DMI 7.37 kg
Predicted DMI 7.37 kg
Inputed Milk 5 kg
ME allowable Milk -3.9kg
MP allowable Milk 0.1 kg
ME Balance-11.06 M
cal
MP Balance -331 g
Day to BCS change 0 days
Early lactation Mature with season 4 grass
Inputed DMI 5.46 kg
Predicted DMI 5.46 kg
Inputed Milk 5 kg
ME allowable Milk -10.7kg
MP allowable Milk -1.5 kg
ME Balance-18.87 M
cal
MP Balance -427g
Day to BCS change 0

Farm 1; Mature lactating cows calving on June 1
Early lactation (June 1-August 31); consuming grasses 1and 2 in ratio of 2:1
Grass1 :Grass 2 =6.5 kg:3.25 kg
Inputed DMI 9.75 kg
Predicted DMI 9.76 kg
Inputed Milk 5 kg
ME allowable Milk 5 kg
MP allowable Milk 5 kg
ME Balance-0.91 Mcal
MP Balance -44.3 g
Mid-late lactation (Sep 1-January 31); consuming grasses 2 and 3 in ratio of 1:4
Grass 2 :Grass 3 =(1.57 kg):(6.28 kg)
Inputed DMI 7.85 kg
Predicted DMI 7.85 kg
Inputed Milk 3.7 kg
ME allowable Milk -2.7 kg
MP allowable Milk 0.7 kg
ME Balance-6.28 Mcal
MP Balance -126 g

Farm 1; Mature lactation cows calving on June 1
Farm 1 early dry mature cows (Feb 1-April 30); consuming grass 4, 100%
Grass 4(100%)=6
.83 kg
Inputed DMI 6.83 kg
Predicted DMI 6.83 kg
--- ---
ME Balance-14.41 M
cal
MP Balance -193 g
Farm 1 late dry mature cows (May 1-July 31); consuming grasses 4 and 1in ratio of 1:2
Grass 4 :Grass 1 =3.375 kg:6.75 kg
Inputed DMI 10.125 kg
Predicted DMI 10.192 kg--- ---
ME Balance -3.77 Mcal
MP Balance

Energy balance change for mature cows, Farm 1 calving on June 1
-20
-15
-10
-5
0
5
Jun Jul
Aug
Sep
Oct
Nov
Dec
Jan
Feb
Mar Ap
rM
ay Jun
Jul
Aug
Mca
l

Conclusions: simulation 1
• Negative energy balance through the entire calving interval; does not agree with observations of panel of experts.
i) assumptions on milk amount and composition? ii) Do cows eat more than the predicted intake by the CNCPS? iii) Forage composition assumed.

Simulation 2:grazed grass composition based on data collected by Juarez at
Veracruz and Rueda in Western Brazil

Predicted composition of grazed forages: simulation 2
• Assume forage quality progressively declines from beginning of growth in rainy season (season 1) to accumulated forage grazed in the dry season (season 4).
• Used data from Mexico Gulf Coast (Juarez et al.) and Brazil Amazon region (Rueda et al.) to estimate composition of forage grazed during each season.

NDF Lignin CPNDF rate, %/hour
Rainiest 71.7 5.6 7.8 6.6
Less rainy
68.6 6.1 8.1 6.6
mean 70.15 5.85 7.95 6.6
Composition of grass grazed, Brazil Amazon region1
1Rueda et al., J. Animal Science 81:2923-2937.

Grass composition, Gulf of Mexico1
NDF
% of DM
LIGNIN
% of NDF
CP
% of DM
NDF rate,
%/hour
66.8 5.6 9.4 7.3
70.6 5.9 7.8 7.2
74.2 7.5 7.0 5.1
1Juarez et al., J. Dairy Science 82:2136-2145. Averaged by 3 NDF ranges; 64-69, 70-72, and 73-75

Simulation 2 forage composition assumptions
ForageCP% in
DM
NDF% in
DM
Lignin% in NDF
Ash% in DM
CHOB3 Kd
%/hr
Fat(Ether
extract)(%DM)
Season 1 grass
9 67 5.5 12.7 8.6 3
Season 2 grass
8 70 6 12 6.8 2.6
Season 3 grass
8 71 6.5 11.5 6.2 2.2
Season 4 grass
7 73 7 11 4.4 1.6

Simulation 2 (grasses one and two)
Early lactation Mature with season 1 grass
Inputted DMI 10.00 kg
Predicted DMI 10 kg
Inputted Milk 5 kg
ME allowable Milk
6.5 kg
MP allowable Milk 5.9 kg
ME Balance 0.77 Mcal
MP Balance 8.2 g
Day to BCS change
297 days
Early lactation Mature with season 2 grass
Inputted DMI 9.59 kg
Predicted DMI 9.6 kg
Inputted Milk 5 kg
ME allowable Milk 3.9 kg
MP allowable Milk 4.2 kg
ME Balance ‘-2.11 Mcal
MP Balance -91 g
Day to BCS change---

Simulation 2 (grass three and four)Early lactation Mature with
season 3 grass
Inputted DMI 9.47 kg
Predicted DMI 9.47 kg
Inputted Milk 5 kg
ME allowable Milk
3 kg
MP allowable Milk 3.3 kg
ME Balance-3.17 Mca
l
MP Balance -146 g
Day to BCS change
---
Early lactation Mature with season 4 grass
Inputted DMI 8.08 kg
Predicted DMI 8.08kg
Inputted Milk 5 kg
ME allowable Milk -1.8 kg
MP allowable Milk 1.1 kg
ME Balance -8.65Mcal
MP Balance -275 g
Day to BCS change---

Simulation 2 (Farm 1; Lactating mature cows that calved on June 1)
Early lactation (June 1-August 31); consuming grasses 1and 2 in ratio of 2:1
Grass1 :Grass 2
=6.58 kg:3.29kg
Inputed DMI 9.87 kg
Predicted DMI 9.87 kg
Inputed Milk 5 kg
ME allowable Milk 5.7 kg
MP allowable Milk 5.4 kg
ME Balance -0.15 Mcal
Day to BCS change 0 days
Mid-late lactation (Sep 1-January 31); grasses 2 and 3 in ratio of 1:4
Grass2 :Grass3=(1.897kg):
7.59kg)
Inputed DMI 9.487 kg
Predicted DMI 9.491 kg
Inputed Milk 3.7 kg
ME allowable Milk 2.9 kg
MP allowable Milk 3.4 kg
ME Balance 0.1 Mcal
Day to BCS change 2317 days

Simulation 2 (Farm 1; early and late dry Mature cows that calved on June 1)
Farm 1 early dry mature cows (Feb 1-April 30) consuming grass 4, 100%
Grass 4 (100%)=9.17 kg
Inputed DMI 9.17 kg
Predicted DMI 9.174 kg
---
ME allowable gain 0
MP allowable gain N-A-N
ME Balance-4.19 Mca
l
Day to BCS change 0
Farm 1 late dry mature cows (May 1-July 31) consuming grasses 4 and 1 in ratio of 1:2
Grass 4 :Grass 1 =3.43 kg:6.86 kg
Inputed DMI 10.29 kg
Predicted DMI 10.31 kg
---
ME allowable gain 0.01
MP allowable gain Infinity
ME Balance -1.58 Mcal
Day to BCS change 7356 days
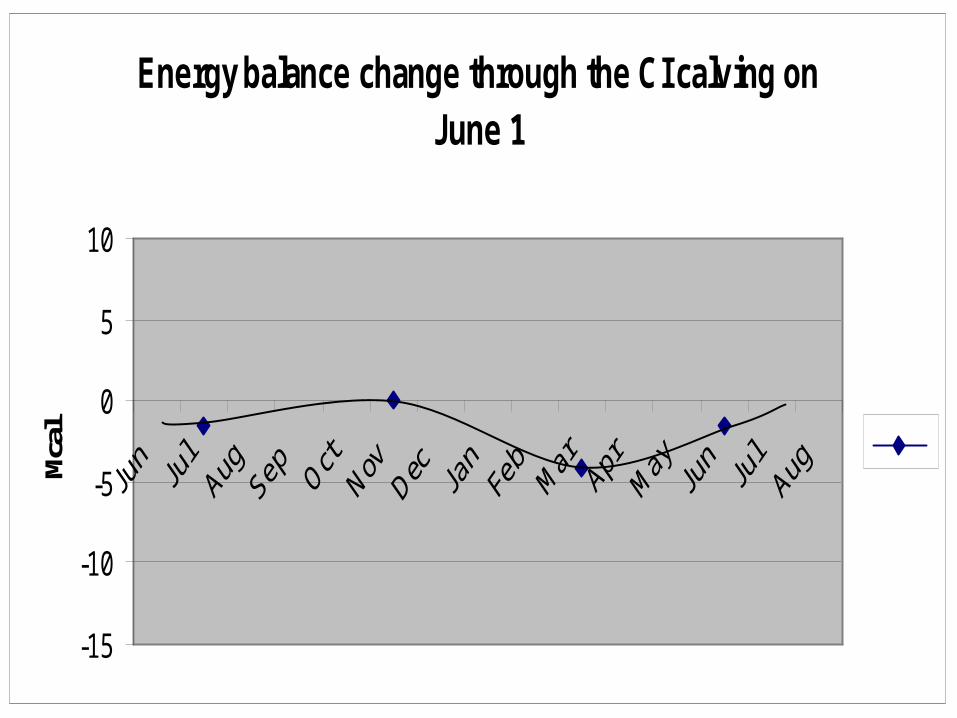
Energy balance change through the CI calving on June 1
-15
-10
-5
0
5
10
Mca
l

Energy balance change through the CI calving on June 1 for 1stlactation cows
-15
-10
-5
0
5
10
J un J ul AugSepOct NovDec J an FebMar Apr May J un J ul AugSepOctMcal

Energy balance change Farm 4 through the CI for mature cows calving on Feb 1
-15
-10
-5
0
5
10
Mca
l

Energy balance change for 1 st lactation cows farm 4 calving on Feb 1
-15
-10
-5
0
5
10Fe
bMa
rAp
rMa
yJu
n Jul
Aug
Sep
Oct
Nov
Dec
Jan
Feb
March Ap
rMa
yJu
nMcal

BCS change of the mature cows at farm 4
123456789

Effect of body condition score on conception
• BCS 4.5-5 is needed for mature cows, 6 for heifers at calving, for conception
(Herd et al, 1995 Randel, 1990)
• Need BCS inputs for Farm 1 and 3 simulations whose calving time is in the beginning of the dry season.

Conclusions.
• The CNCPS simulations are very sensitive to forage chemical composition (Juarez et al. J. Dairy Science)
• Farm 1 (Calving on June) looks closer to average of zero energy balance for the reproductive cycle than that of Farm 4(Calving on February 4)
• Farm 4 has two energy balance nadirs

Conclusions about forage composition for accurate simulation• Need actual values for forage consumed.
• Grass samples need to represent what cows are observed to select.
• Need samples for each month of year.
• Analysis should include NDF, lignin, CP, and available NDF digestion rate.

Goals for shortening the CI
• Reach nadir as soon as possible after calving.
• Have cows in optimum BCS at calving.
• Need to achieve zero energy balance over the reproductive cycle.