name: unit 1 part 2 functions - weebly › uploads › 2 › 6 › 4 › 4 › 26441713 › … ·...
TRANSCRIPT

Name:________________
Unit 1 Part 2 Functions
Day Date
Topic Homework A DAY B Day
1 Wednesday 9/28
Thursday 9/29
Exploring Graphs of Real World Situations Real World Worksheet Pages 7 and 8
2 Friday 9/30
Early Rel.
Monday 10/3
Relations and Functions: Domain and
Range/Testing Functions Intro to Functions Worksheet Page 13
3 Tuesday 10/4
Wednesday 10/5
Function Notation Functions Tables and Graphs Page 18
4 Thursday 10/6
Friday 10/7
Quiz Recursive (Next Now) Functions
Recursive Patterns Worksheet Page 23 and 24
5 Monday 10/10
Tuesday 10/11
Review Finish Review Sheet
6 Wednesday 10/12
Thursday 10/13
Unit 1 Part 2 Test Cumulative Review

Pag
e2

Pag
e3
Graphs of Real-World Situations Notes
Independent Variable:_________________________________________________
Dependent Variable:__________________________________________________
******The independent variable causes the dependent variable to change******
Examples:
1. The amount of time you study will make a positive difference on your next test score.
The ________________ causes the _________________________to change
IV:____________________ DV:__________________________
2. The higher the temperature of water, the faster the egg will cook.
The ________________ causes the _________________________to change
IV:____________________ DV:__________________________
3. Grass will grow taller if it is watered and fertilized more.
The ________________ causes the _________________________to change
IV:____________________ DV:__________________________
4. Scientists believe that exposure to ultraviolet light causes skin cancer.
IV:____________________ DV:__________________________
5. The height of bean plants is recorded daily for 2 weeks.
IV:___________________ DV:__________________________
Continuous Graphs
The graphs below show increasing functions, meaning that as the x-values increase, the y-values also increase. In Graph
A, the function values increase at a constant rate. In Graph B, the values increase slowly at first and then more quickly. In
Graph C, the function switches from one constant rate of increase to another.
y
x
y
x
y
x
Graph A Graph B Graph C

Pag
e4
The graphs below show decreasing functions, meaning that as the x-values increase, the y-values decrease. In Graph D,
the function values decrease at a constant rate. In Graph E, the values decrease quickly at first and then more slowly. In
Graph F, the function switches from one constant rate of decrease to another.
The graphs below show functions that have both increasing and decreasing intervals. In Graph G, the function values
decrease at a constant rate at first and then increase at a constant rate. In Graph H, the values increase slowly at first and
then more quickly and then begin to decrease quickly at first and then more slowly. In Graph I, the function oscillates
between two values.
Intervals of increasing, decreasing, or constant
Increasing:__________________________ Increasing:_________________________
Decreasing:__________________________ Decreasing:________________________
Constant:____________________________ Constant:_________________________
Graph D Graph E Graph F
y
x
y
x x
y
x
y
x x Graph G Graph H Graph I
Pag
e5
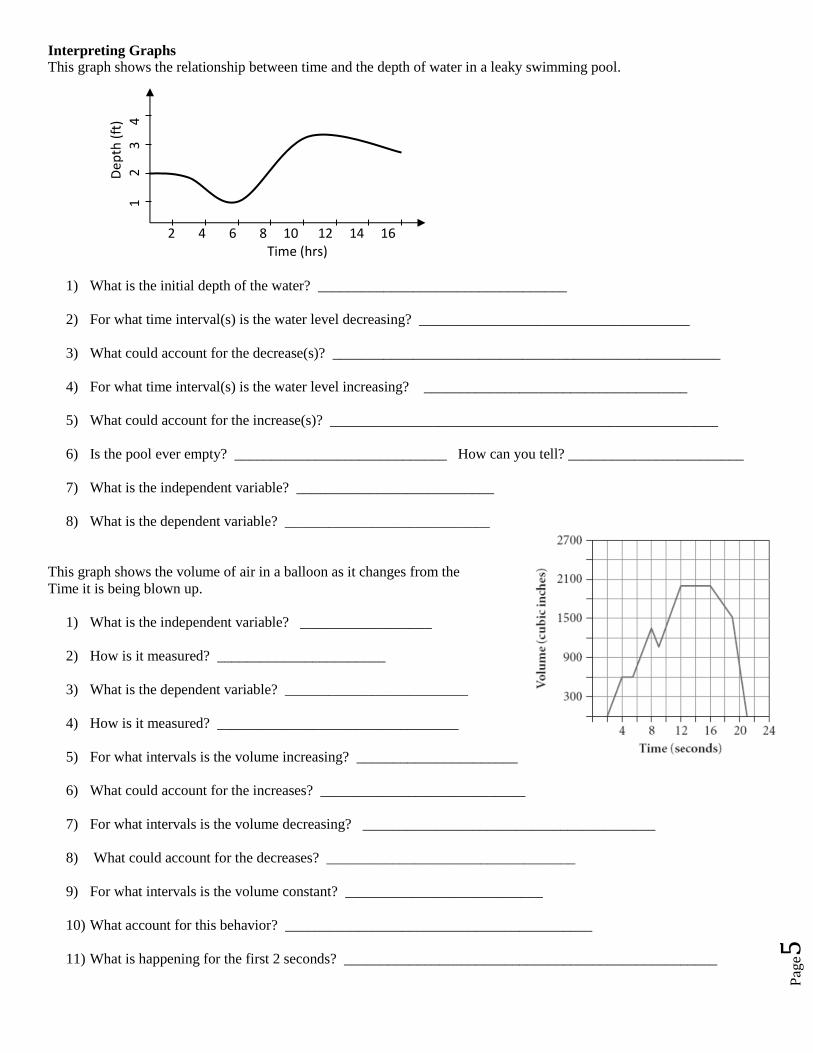
Interpreting Graphs
This graph shows the relationship between time and the depth of water in a leaky swimming pool.
1) What is the initial depth of the water? __________________________________
2) For what time interval(s) is the water level decreasing? _____________________________________
3) What could account for the decrease(s)? _____________________________________________________
4) For what time interval(s) is the water level increasing? ____________________________________
5) What could account for the increase(s)? _____________________________________________________
6) Is the pool ever empty? _____________________________ How can you tell? ________________________
7) What is the independent variable? ___________________________
8) What is the dependent variable? ____________________________
This graph shows the volume of air in a balloon as it changes from the
Time it is being blown up.
1) What is the independent variable? __________________
2) How is it measured? _______________________
3) What is the dependent variable? _________________________
4) How is it measured? _________________________________
5) For what intervals is the volume increasing? ______________________
6) What could account for the increases? ____________________________
7) For what intervals is the volume decreasing? ________________________________________
8) What could account for the decreases? __________________________________
9) For what intervals is the volume constant? ___________________________
10) What account for this behavior? __________________________________________
11) What is happening for the first 2 seconds? ___________________________________________________
2 4 6 8 10 12 14 16 Time (hrs)
Dep
th (
ft)
1
2
3
4

Pag
e6
Discrete Graphs
Functions that have smooth graphs, with no breaks in the domain or range, are called continuous functions. Functions that
are not continuous often involve quantities—such as people, cars, or stories of a building—that are counted or measured
in whole numbers. Such functions are called discrete functions. Below are some examples of discrete functions.
Graph J Graph K Graph L
Read the description of each situation below. Identify the independent and dependent variables. Describe the graph as
discrete or continuous. Then choose the letter graph from above. (Graphs A-L)
Pizza
Little Ceasars sells pizza in small, medium and large diameters at different costs.
Independent Variable: _______________________ Dependent Variable: ___________________________
Discrete or Continuous ___________________ Graph ______
Temperature of Hot Tea
Grandma pours a cup of hot tea into a tea cup. The temperature at first is very hot, but cools off quickly as the cup sits on
the table. As the temperature of the tea approaches room temperature, it cools off more slowly.
Independent Variable: _______________________ Dependent Variable: ___________________________
Discrete or Continuous _______________________ Graph_______
Air conditioning bill
Each month you get an air conditioning bill starting in January and continuing for the year.
Independent Variable: _______________________ Dependent Variable: ___________________________
Discrete or Continuous ________________________ Graph _______
Population
Apex is one of the fastest growing cities in North Carolina. It has been steadily growing. Over the next 10 years, it is
expected to grow at an even faster rate.
Independent Variable: _______________________ Dependent Variable: ___________________________
Discrete or Continuous_______________________ Graph________
y
x
y
x
y
x

Pag
e7
A
B
C
D
Real World Homework Name_________________________
1. One student walks to a bus stop and takes a bus to get to school each day. The graph below shows the student’s commute by relating the time the student spends commuting and the distance he travels.
Describe what the graph shows at each labeled section.
Circle one for each section. Section A) Increasing Decreasing Constant
*Describe what happened in the scenario during section A ________________________________________________________________________________ Section B) Increasing Decreasing Constant
*Describe what happened in the scenario during section B ________________________________________________________________________________ Section C) Increasing Decreasing Constant
*Describe what happened in the scenario during section C ________________________________________________________________________________ Section D) Increasing Decreasing Constant
*Describe what happened in the scenario during section D ________________________________________________________________________________
Time
Total
Distance

Pag
e8
2. For each of the following, state the independent and dependent variables.
a. If skin cancer is related to ultraviolet light, then people with high exposure to UV light will have a higher frequency of skin cancer.
Ind ____________________ Dep__________________
b. The temperature of a carton of milk and the length of time left out of the refrigerator.
Ind ____________________ Dep__________________ c. The number of CDs you purchase as related to the price.
Ind ____________________ Dep__________________
3. A car travels at a steady speed. Which graph could you used to show the speed of the car,
and which could you use to show the distance it has traveled?
4. Draw a graph is the most appropriate to describe the height of a candle burning at a constant rate? Would you consider this graph discrete or continuous? ______________
5. Draw a graph that shows the distance of a person’s feet from the ground as they jump rope. Would you consider this graph discrete or continuous? _____________
Time Time

Pag
e9
Warm Up:
Remember the general rule is that time is usually the Independent variable and distance is usually the dependent
**Independent causes the dependent to change**
State the Independent and Dependent Variables for the following
1. The temperature of the water was measured at different depths of the lake.
Independent Variable: __________________________ Dependent Variable: _____________________________
2. The amount of algae growth in lakes seems to be directly related to the number of sacks of fertilizer sold.
Independent Variable: __________________________ Dependent Variable: _____________________________
3. The number of hours you work determines the amount of her annual bonus.
Independent Variable: __________________________ Dependent Variable: _____________________________
4. The score on the final test depends on the number of study questions the student completed.
Independent Variable: __________________________ Dependent Variable: _____________________________
5. As we exercise, our cells begin to run out of oxygen and begin to do anaerobic respiration. When this happens, lactic acid builds up. A scientist wants to study how fast this toxic substance builds up in a muscle cell. He makes a cell do anaerobic respiration and takes a measurement every five minutes. What is the independent variable? What is the dependent variable?
Independent Variable: __________________________ Dependent Variable: _____________________________
Increasing:____________________________
Decreasing:___________________________
Constant:_____________________________

Pag
e10
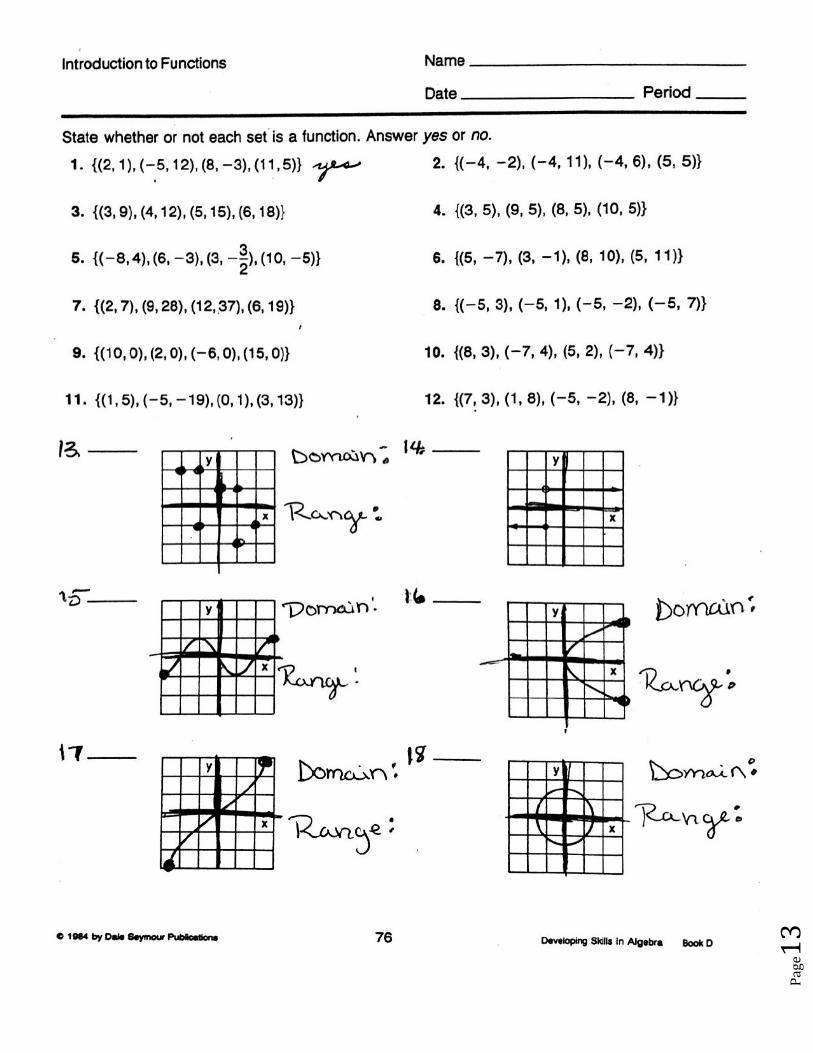
Testing for Functions Notes
Definitions:
Relation: _____________________________________________________________________________________
Function: _____________________________________________________________________________________
Domain: ______________________________________________________________________________________
Range: _______________________________________________________________________________________
Testing for Functions In each case, we will decide whether the relationship represented is a function or not.
Part II: Mappings – If each relation is a function, give the domain & range.
Mapping 1 Mapping 2 Mapping 3

Pag
e11
Part III: Equations (& Inequalities)
Statement 1 Statement 2 Statement 3 Statement 4 𝑦 = 2𝑥 + 1 𝑦 = √𝑥 𝑦 = 𝑥2 𝑦 < −2𝑥 + 4
Part III: Graphs
EXAMPLE 2: Does each relationship of the form (input, output) represent a function? If the relationship does not represent a function, find an example of one input that has two or more outputs.
a) (city, zip code) b) (phone number, area code) c) (person, birth date)
d) (last name, first name)
e) (state, capital)
y
x
Graph 1 Graph 2 Graph 3 Graph 4
Pag
e12
Pag
e13

Pag
e14
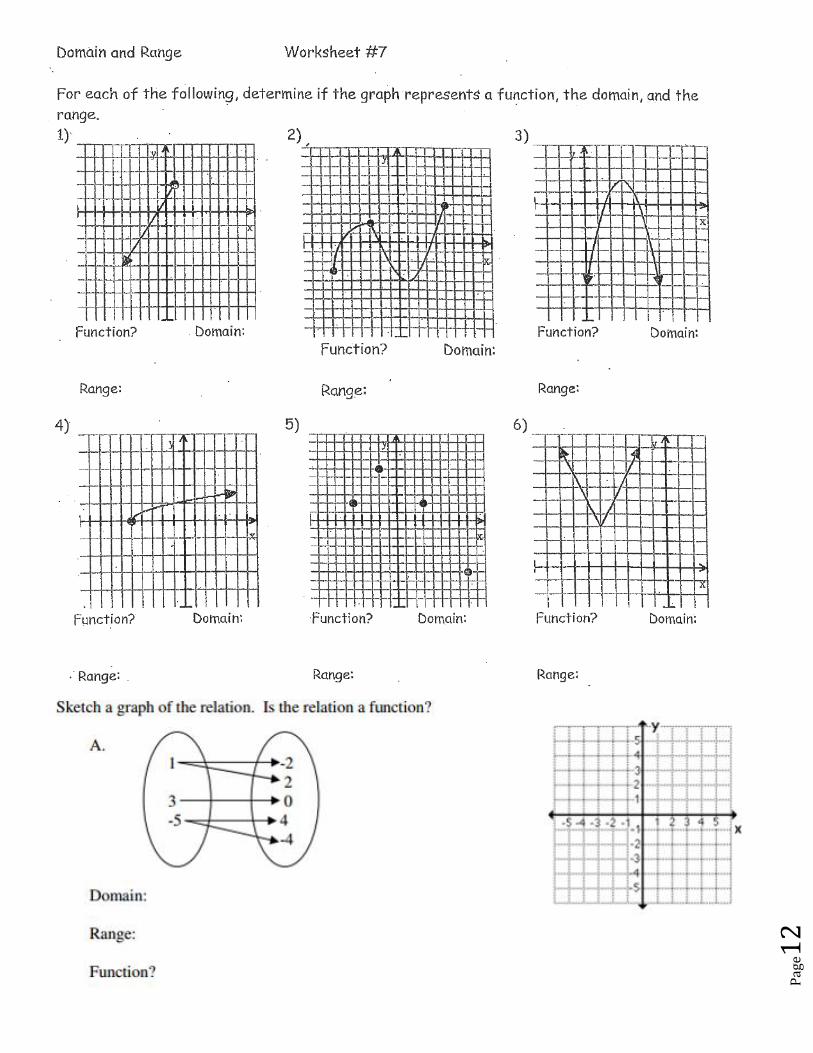
Warm Up:
Function? __________
Domain:__________________________
Range:___________________________
Sort the following key terms into two groups. Then draw lines connecting pairs of terms that go together (one from each
group).
dependent, distance, horizontal axis, independent, input, output, time, vertical axis
X Y

Pag
e15
Function Notation Notes
What is a function?_____________________________________________________________
How can we name a function?____________________________________________________
1. Evaluate the following expressions given the functions below:
g(x) = -3x + 1 f(x) = x2 + 7 x
xh12
)( 92)( xxj
a. g(10) = b. f(3) = c. h(–2) =
d. j(7) = h. Find x if g(x) = 16 j. Find x if f(x) = 23
2. Evaluate the following expressions given the functions below
g(x) = 2x2 – 3 f(x) = 3x + 2
a. Find g(4) = ________________ b. Find g(-2) = _________________
c. Find f(-4) = _______________ c. Find x when f(x) = 355___________
d. Find x when f(x) = 8 ______________
3. Given xxf 43)( . Fill in the table. 4. Given 43)( xxf . Fill in the table.

Pag
e16
5. Given 72)( xxf . Fill in the table. 6. . Given 6)4()( xxf . Fill in the table.
7. Translate the following statements into coordinate points, then plot them!
a. f(–1) = 1
b. f(2) = 7
c. f(1) = –1
d. f(3) = 0
8. Given this graph of the function f(x):
Find:
a. f(–4) =
b. f(0) =
c. f(3) =
d. f(-5) =
e. x when f(x) = 2
f. x when f(x) = 0
f(x) y
x 5
5
-5
-5

Pag
e17
9. Use the graph y = f(x) at the right to answer each question.
APPLICATION
10 .Swine flu is attacking Porkopolis. The function below determines how many people have swine where t =
time in days and S = the number of people in thousands.
49)( ttS
a. Find S(4).
b. What does S(4) mean?
c. Find t when S(t) = 23
d. What does S(t) = 23 mean?
11. Zombies are attacking Needham Broughton High School. The function below determines how many people
have been attacked where t = time in days and P = the number of people in thousands.
P(t) = 8t – 3
a) Find P(5).
b) What does P(5) mean?
c) Find t when P(t) = 29.
d) What does P(t) = 29 mean?

Pag
e18
Function Notation Homework:
1. Fill in the following tables:
2. Use the following graph f(x) to answer the questions.
Domain: ______________________________
Range:________________________________
Find f(-4) = ________
Find f(-6) = _________
Find f(0) = __________
Find x when f(x) = 2 ____________________
Find x when f(x) = 4 ____________________
3. Evaluate the following functions
f(x) = 2x + 1 g(x) = -3x – 4 h(x) = (-5)x + 2
a. f(3) = ________ c. g(4) = ________ e) g(2) = _________
b. h(2) = ________ d. h(3) = ________ f) find x when g(x) = -31 __________
f(x) f(x) f(x)
f(x) f(x) f(x)
f(x)

Pag
e19
WARM UP
1. The function f(x) is graphed below. Answer the following:
a) Find the Domain: ____________________
b) Find the Range:______________________
c) Find f(6) ___________
d) For what values is f(x) = 5 true?
_____________________________________
2. The function g(x) is graphed below. Answer the following:
Increasing Interval(s) : _____________________________
Decreasing Interval(s): _____________________________
Constant Interval(s) : ______________________________
Domain:__________________________
Range:____________________________
Find g(2) = ______________
For what values is f(x) = -2 true?_____________________
3. Ebola is attacking Moscow. The function below determines how many people have Ebola where t = time in
days and M = the number of people in thousands.
M(t) = 7t + 2
a) Find M(6).
b) What does M(6) mean?
c) Find t when M(t) = 37.
d) What does M(t) mean?
1 2 3 4 5–1–2–3–4–5 x
1
2
3
–1
–2
–3
y
Pag
e20
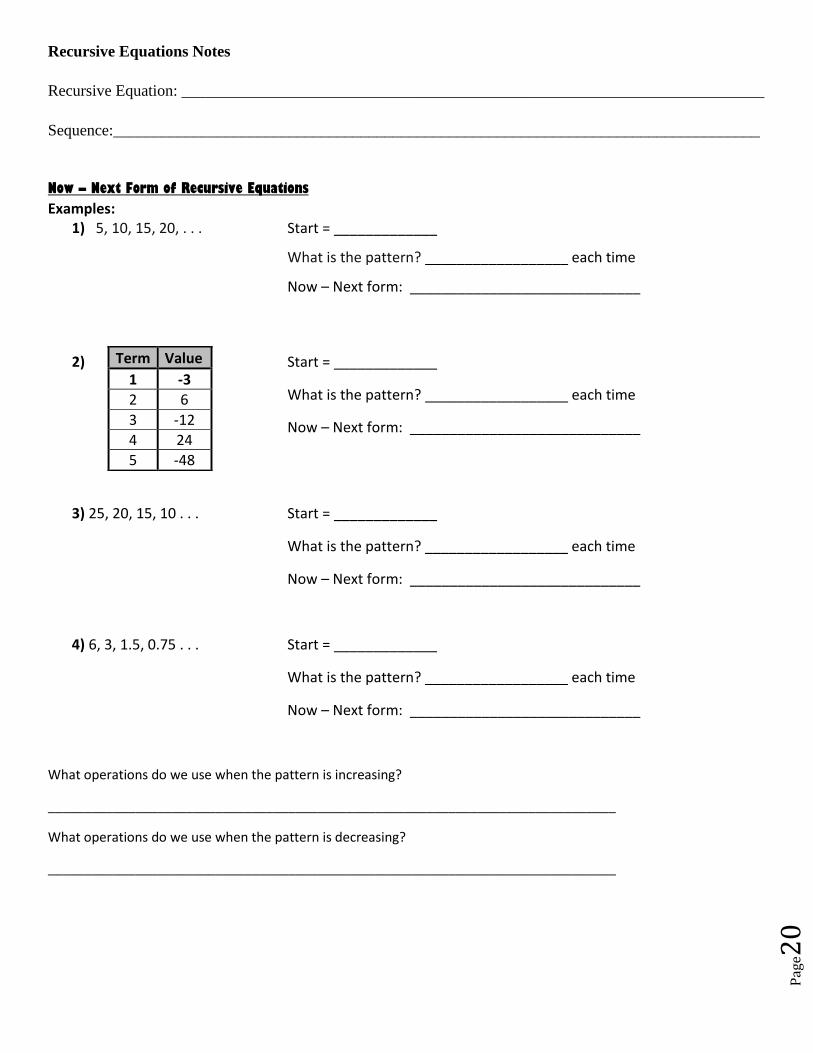
Recursive Equations Notes
Recursive Equation: _________________________________________________________________________
Sequence:_________________________________________________________________________________
Now – Next Form of Recursive Equations
Examples: 1) 5, 10, 15, 20, . . . Start = _____________
What is the pattern? __________________ each time
Now – Next form: _____________________________
2) Start = _____________
What is the pattern? __________________ each time
Now – Next form: _____________________________
3) 25, 20, 15, 10 . . . Start = _____________
What is the pattern? __________________ each time
Now – Next form: _____________________________
4) 6, 3, 1.5, 0.75 . . . Start = _____________
What is the pattern? __________________ each time
Now – Next form: _____________________________
What operations do we use when the pattern is increasing?
______________________________________________________________________________
What operations do we use when the pattern is decreasing?
______________________________________________________________________________
Term Value
1 -3
2 6
3 -12
4 24
5 -48

Pag
e21
You Try!
1) 2, 4, 6, 8,… 2) 3, 6, 12, 24,… 3) 2, -4, -10, -16,…
Start: Start: Start:
NOW-NEXT form: NOW-NEXT form: NOW-NEXT form:
4) 4, -12, 36, -108,… 5)
Start: Start:
NOW-NEXT form: NOW-NEXT form:
Example: Start = _____________ Now – Next form: _____________________________
n = 1 Perimeter = 3
n = 2 Perimeter = 4
n = 3 Perimeter = 5
n = 4 Perimeter = 6
You Try: Start = _____________ Now – Next form: _____________________________
What does it look like in recursive form?
𝒂𝟏 = _____________________
𝒂𝒏 = _____________________
𝒂(𝒏+𝟏) = ___________________
𝒂(𝒏−𝟏) = ___________________
Examples:
1. Given 𝑎𝑛 = 𝑎(𝑛+1) + 4 what are the next 4 terms if 𝑎1 = 6? _____________________________________

Pag
e22
2. Given 𝑎𝑛 = 𝑎(𝑛+1) ∗ 3 what are the next 4 terms if 𝑎1 = −2? _____________________________________
3. Given 𝑎𝑛 = 𝑎(𝑛+1) ∗1
4 what are the next 4 terms if 𝑎1 = 200? _____________________________________
4. Given 𝑎𝑛 = 𝑎(𝑛+1) − 7 what are the next 4 terms if 𝑎1 = 50? _____________________________________
EOC Questions:
1._________ Given 𝑎1 = 1 and 𝑎𝑛 = 𝑎(𝑛+1) + 2. Find 𝑎7.
A. 7 B. 9 C. 11 D. 13
2. ________ Sandra wrote the following sequence: 2, 5, 10, 17, . . . Which equation represents the rule for finding the nth term of this sequence?
A. 𝑎𝑛 = 𝑎(𝑛+1) + 2 B. 𝑎𝑛 = 𝑎(𝑛+1) + 2 C. 𝑎𝑛 = 𝑎(𝑛+1) + 2 D. 𝑎𝑛 = 𝑎(𝑛+1) + 2
3. __________ 4. ___________
Pag
e23
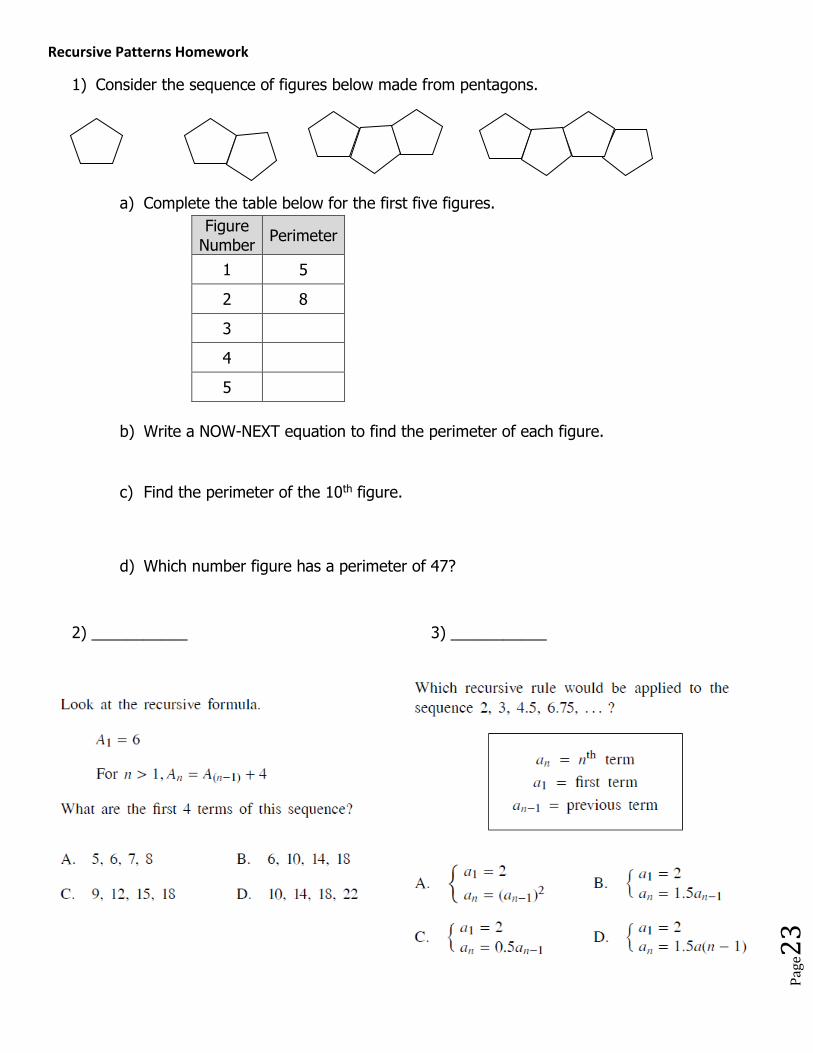
Recursive Patterns Homework
1) Consider the sequence of figures below made from pentagons.
a) Complete the table below for the first five figures.
Figure Number
Perimeter
1 5
2 8
3
4
5
b) Write a NOW-NEXT equation to find the perimeter of each figure.
c) Find the perimeter of the 10th figure.
d) Which number figure has a perimeter of 47?
2) ___________ 3) ___________

Pag
e24
4) Determine which of the following relationships are functions. Justify your answer.
a. b) c)
5) Answer each question for the graph of 𝑓(𝑥).
a. What is the domain of the function?
b. What is the range of the function?
c. What is 𝑓(3)?
d. For what values of x does 𝑓(𝑥) = 1?
e. Is this function discrete or continuous?
6) Find the domain and range of the graph.
a. D: 1 x 4
R: 1 y 6
c. D: 2 x 6
R: 4 y 7
b. D: 1 x 7
R: 1 y 6
d. D: 1 x 6
R: 1 y 7
x y
1 3
2 6
3 9
4 12
5 15
𝑓(𝑥)
𝑥
2 4 6 x
2
4
6
y
8.
Domain:________________
Range:_________________