namibia electricity supply industry national …
TRANSCRIPT

GOVERNMENT OF THE REPUBLIC OF NAMIBIA
NAMIBIA ELECTRICITY SUPPLY INDUSTRY
NATIONAL INTEGRATED RESOURCE PLAN REVIEW AND UPDATE
FINAL REPORT
SEPTEMBER 2016
MINISTRY OF MINES AND ENERGY

The National Integrated Resource Plan Review and Update – Final Report
September 2016 Page i of 155
Developed for the Ministry of Mines and Energy by the Electricity Control Board in consultation with the Electricity Supply Industry Stakeholders
September 2016
Ministry of Mines and Energy ______________________ Private Bag 13297 Hon. Obeth Kandjoze (MP) Windhoek Minister Namibia

The National Integrated Resource Plan Review and Update – Final Report
September 2016 Page ii of 155
Executive Summary The Electricity Control Board (ECB) was tasked by the Ministry of Mines and Energy (MME) to review and update the National Integrated Resource Plan (NIRP). Hatch, a Canadian Consultancy firm, was contracted to do the review and update of the NIRP for Namibia focusing on electricity. The NIRP is a 20 year electricity sector development plan. It aims to provide an indication of Namibia’s electricity demand, how this demand could be supplied and the cost of supply. The NIRP does not deal explicitly with the overall energy needs for the country but focuses on electricity only. The plan is expected to be dynamic and be continuously revised and updated to incorporate the latest available information and technologies.
It was recognized that the review and update of the NIRP requires the input of all stakeholders in the Electricity Supply Industry (ESI) in Namibia and these were involved as participants in the NIRP review and update process and several stakeholder workshops were held to obtain stakeholder input. The principal goal of the NIRP project was to identify the supply mix of resources to meet the near and long-term electric power needs in Namibia in a sustainable, efficient, safe and reliable manner at the lowest reasonable cost. The NIRP is focused on electricity supply, but should also take into account the impact of developing other energy sources and demand side management measures capable of reducing electricity demand in Namibia. The NIRP report presents the recommended NIRP Plan and documents the development of the plans for new generation and transmission additions taking into account the increase in demand, the aging of the existing generation fleet, the possibility of curtailment of imports from other networks and the implementation of the security of supply aspects outlined in the 1998 White Paper on Energy Policy. This document, herein called Final Report, summarizes all project deliverables and presents the recommended base case expansion plan, as well as the implementation plan. In earlier stages of the project, estimates were prepared for the capital and operating costs and performance characteristics of power generating plants utilizing the different primary energy resources. The NIRP is a national level plan and the primary analysis as described above has been carried out as an economic analysis rather than a financial analysis.

The National Integrated Resource Plan Review and Update – Final Report
September 2016 Page iii of 155
Disclaimer
This report has been prepared by Hatch Ltd. (Hatch) for the sole and exclusive use of the Electricity Control Board of Namibia (the “Client” or “ECB”) for the purpose of assisting the Client in review and update of the National Integrated Resource Plan and shall not be (a) used for any other purpose, or (b) provided to, relied upon or used by any third party.
Notwithstanding the foregoing, Hatch acknowledges that the Client may make this report available electronically to interested third parties through internet web access, provided that all such parties shall rely upon this report at their own risk and shall (by virtue of their use of this report) be deemed to have (a) acknowledged that Hatch shall not have any liability to any party other than the Client in respect of the report and (b) waived and released Hatch from any liability in connection with the report.
This report contains opinions, conclusions and recommendations made by Hatch, using its professional judgment and reasonable care. Use of or reliance upon this report by Client is subject to the following conditions:
The report being read in the context of and subject to the terms of the Agreements between Hatch and the Client dated 23 October, 2015 (the “Agreement”), including any methodologies, procedures, techniques, assumptions and other relevant terms or conditions that were specified or agreed therein; the report being read as a whole, with sections or parts hereof read or relied upon in context; the conditions may change over time (or may have already changed) due to natural forces or human intervention, and Hatch takes no responsibility for the impact that such changes may have on the accuracy or validity or the observations, conclusions and recommendations set out in this report; and the report is based on information made available to Hatch by the Client or by certain third parties; and unless stated otherwise in the Agreement, Hatch has not verified the accuracy, completeness or validity of such information, makes no representation regarding its accuracy and hereby disclaims any liability in connection therewith.

The National Integrated Resource Plan Review and Update – Final Report
September 2016 Page iv of 155
Table of Contents
1. Background ........................................................................................................................................... 1
1.1 Introduction ................................................................................................................................... 1 1.2 Scope of Work .............................................................................................................................. 1 1.3 Timeframe for the Project ............................................................................................................. 1 1.4 Data Collection .............................................................................................................................. 1 1.5 Outline of the Report ..................................................................................................................... 3
2. Context for the NIRP Update ............................................................................................................... 4
2.1 Introduction ................................................................................................................................... 4 2.2 The Namibian ESI and the Role of the NIRP ............................................................................... 4 2.3 The Namibia Power System ......................................................................................................... 7
2.3.1 Inventory of Existing Power Plants ..................................................................................... 7 2.3.2 Power Import Agreements ................................................................................................ 11 2.3.3 Transmission and Distribution Systems ............................................................................ 13
2.4 Committed Power Plants ............................................................................................................ 14
3. Study Parameters ............................................................................................................................... 15
3.1 Economic Parameters ................................................................................................................ 15 3.1.1 National Focus .................................................................................................................. 15 3.1.2 National Focus and White Paper on Energy Policy .......................................................... 15 3.1.3 Economic Costs ................................................................................................................ 16 3.1.4 Planning Horizon ............................................................................................................... 16 3.1.5 Cost and Present Worth Datum ........................................................................................ 17 3.1.6 Escalation .......................................................................................................................... 17 3.1.7 Currency and Exchange Rate ........................................................................................... 17 3.1.8 Discount Rate .................................................................................................................... 17 3.1.9 Cost of Expected Unsupplied Energy ............................................................................... 17 3.1.10 Cost of Losses .................................................................................................................. 18 3.1.11 Duties and Taxes .............................................................................................................. 18 3.1.12 Interest During Construction ............................................................................................. 18
3.2 Reliability Criteria ........................................................................................................................ 18 3.2.1 Deterministic Criteria ......................................................................................................... 18 3.2.2 Probabilistic Criteria .......................................................................................................... 18 3.2.3 Southern African Power Pool (SAPP) Reliability Criterion................................................ 19
3.3 Emissions Criteria ....................................................................................................................... 19 3.4 Fuel Prices .................................................................................................................................. 20
3.4.1 Fuel Background in Namibia ............................................................................................. 20 3.4.2 Underlying Assumptions ................................................................................................... 20 3.4.3 Crude Oil Forecast ............................................................................................................ 21 3.4.4 Price Forecast for Kudu Natural Gas ................................................................................ 23 3.4.5 Estimate of Natural Gas Price from Liquefied Natural Gas .............................................. 24 3.4.6 Coal Price Forecast........................................................................................................... 25 3.4.7 Price Forecasts for Other Fuels ........................................................................................ 26 3.4.8 Heat Content of Fuels and Unit Prices of Energy ............................................................. 26
4. Generation Resources and Options ................................................................................................. 28
4.1 Introduction ................................................................................................................................. 28 4.2 Primary Generation Resources .................................................................................................. 28
4.2.1 Coal Fired Power Generation ........................................................................................... 28 4.2.2 Natural Gas Including LNG Fueled Power Generation ..................................................... 32

The National Integrated Resource Plan Review and Update – Final Report
September 2016 Page v of 155
4.2.3 Fuel Oil Fired Power Generation ...................................................................................... 36 4.2.4 Nuclear Power Generation ................................................................................................ 38 4.2.5 Hydro Electric Power Generation ...................................................................................... 42 4.2.6 Other Renewable Power ................................................................................................... 47
4.3 Imports from SAPP ..................................................................................................................... 54 4.4 Secondary Generation Options with Quantified Resources but Non-mature Technology ......... 54
4.4.1 Small Modular Nuclear Reactor Power Generation .......................................................... 54 4.5 Secondary Generation Options with Mature Technology but Non-quantified Resources .......... 56
4.5.1 Wind Power Generation .................................................................................................... 56 4.5.2 Power Generation Using Municipal Solid Waste .............................................................. 57 4.5.3 Bio-fuels Power Generation .............................................................................................. 59 4.5.4 Geothermal Power Generation ......................................................................................... 60
5. Load Forecast and Supply/Demand Balance .................................................................................. 76
5.1 Historic Sales and Load Data ..................................................................................................... 76 5.2 Review of NIRP Load Forecast .................................................................................................. 78
5.2.1 General Approach and NIRP 2013 Forecast .................................................................... 78 5.3 The Namibian Economy ............................................................................................................. 80
5.3.1 Background ....................................................................................................................... 80 5.3.2 Projections ........................................................................................................................ 83
5.4 Background to the Load Forecast ............................................................................................... 86 5.4.1 The Demand for Electricity ................................................................................................ 86 5.4.2 Adjustments to the Data Series ........................................................................................ 87 5.4.3 Regression Analysis .......................................................................................................... 87 5.4.4 Regression Results ........................................................................................................... 88 5.4.5 Development Options – Step Loads ................................................................................. 90 5.4.6 Demand Side Management Programs and Renewable Energy ....................................... 92
5.5 Forecast Results ......................................................................................................................... 93 5.5.1 Forecast Summary ............................................................................................................ 93 5.5.2 Reference Forecast........................................................................................................... 95 5.5.3 Low Scenario .................................................................................................................... 98 5.5.4 High Scenario .................................................................................................................. 101
5.6 Supply-Demand Balance .......................................................................................................... 104
6. Formulation of Expansion Scenarios ............................................................................................. 107
6.1 Evaluation of Available Generation Options ............................................................................. 107 6.2 Screening Curves and Selection of Generation Options .......................................................... 107
6.2.1 Unit Cost of Energy for Conventional Base Load Plants ................................................ 107 6.2.2 Unit Cost of Energy for Conventional Peaking Plants .................................................... 110 6.2.3 Unit Cost of Energy for Dispatchable Renewable Plants................................................ 113 6.2.4 Unit Cost of Energy for Intermittent Renewable Plants .................................................. 116 6.2.5 Unit Cost of Energy of Potential Imports ......................................................................... 116 6.2.6 Summary of Analysis ...................................................................................................... 116
6.3 Expansion Scenario Themes .................................................................................................... 117 6.3.1 Principal Decision Factors .............................................................................................. 117 6.3.2 Overview of Planning Factors ......................................................................................... 119 6.3.3 Formulation of Generation Expansion Scenarios ........................................................... 120
7. Selection of Preferred Scenarios .................................................................................................... 125
7.1 Introduction ............................................................................................................................... 125 7.2 Assessment of the Generation Option on the Criteria .............................................................. 125
7.2.1 Generation in Namibia .................................................................................................... 125 7.2.2 Use of Indigenous Resources ......................................................................................... 125

The National Integrated Resource Plan Review and Update – Final Report
September 2016 Page vi of 155
7.2.3 Renewable Energy .......................................................................................................... 126 7.2.4 Foreign Exchange Requirement ..................................................................................... 127 7.2.5 Need for Government Investment ................................................................................... 127 7.2.6 Development/Operating Complexity ............................................................................... 128
7.3 Selection of Top Ranked Scenarios ......................................................................................... 129 7.4 Sensitivity Studies ..................................................................................................................... 133
7.4.1 Capital Cost ..................................................................................................................... 133 7.4.2 Fuel Cost ......................................................................................................................... 134 7.4.3 Discount Rate .................................................................................................................. 134 7.4.4 Load Forecast ................................................................................................................. 134 7.4.5 CO2 Emission Offset Allowance ...................................................................................... 135
7.5 Conclusions on Scenarios ........................................................................................................ 135 7.5.1 Base Case Plan – Plan A ................................................................................................ 136 7.5.2 Large Local Resource Project Realization - Alternative Path – Plan B .......................... 136 7.5.3 Renewable Prioritization - Alternative Path – Plan C ...................................................... 136 7.5.4 Conclusion ...................................................................................................................... 136
8. Implementation Plan for the NIRP ................................................................................................... 137
8.1 Key Factors to Consider ........................................................................................................... 137 8.2 Recommended Implementation Plan for NIRP ......................................................................... 138 8.3 Monitoring, Review and Update of the NIRP ............................................................................ 141
List of Tables Table 1-1: Reports and Other Documents Collected .................................................................................... 2 Table 2-1: Power Plants in Namibia January 2016 ....................................................................................... 7 Table 2-2: Ruacana Generating Capability ................................................................................................... 9 Table 2-3: Characteristics of the Van Eck Coal Power Plant ...................................................................... 10 Table 2-4: Characteristics of the Walvis Bay Diesel Plants ........................................................................ 11 Table 2-5: Summary of Namibia’s Power Import Sources .......................................................................... 11 Table 2-6: Committed Power Plants as of January 2016 ........................................................................... 14 Table 3-1: Heat Content of Fuels (HHV) ..................................................................................................... 26 Table 3-2: Unit Price of Fuels (HHV) .......................................................................................................... 27 Table 4-1: Coal Fired Power Generation .................................................................................................... 63 Table 4-2: Natural Gas Fired Power Generation ........................................................................................ 64 Table 4-3: Fuel Oil Fired Power Generation ............................................................................................... 65 Table 4-4: Nuclear Power Generation ........................................................................................................ 66 Table 4-5: Hydro Electric Power Generation .............................................................................................. 67 Table 4-6: Wind Power Generation ............................................................................................................. 68 Table 4-7: Solar PV Power Generation ....................................................................................................... 69 Table 4-8: Concentrated Solar Power Generation ...................................................................................... 70 Table 4-9: Biomass Power Generation ....................................................................................................... 71 Table 4-10: Small Modular Reactor Power Generation .............................................................................. 72 Table 4-11: Power Generation Using Municipal Solid Waste ..................................................................... 73 Table 4-12: Bio-Fuel Power Generation ..................................................................................................... 74 Table 4-13: Geothermal Power Generation ................................................................................................ 75 Table 5-1: Namibia Overall Electricity Data (GWh) .................................................................................... 76 Table 5-2: Number of Customers for 2014/15 ............................................................................................ 77 Table 5-3: Sales Statistics for 2014/15 (MWh) ........................................................................................... 77 Table 5-4: Comparison of Electricity Sales – 2014/15 ................................................................................ 78 Table 5-5: Reference Forecast Summary NIRP 2013 (GWh) .................................................................... 79 Table 5-6: Generation Forecast Summary .................................................................................................. 80 Table 5-7: Selected Economic Statistics (1990 - 2014) .............................................................................. 83 Table 5-8: GDP Projections ........................................................................................................................ 84

The National Integrated Resource Plan Review and Update – Final Report
September 2016 Page vii of 155
Table 5-9: Tariff Scenarios .......................................................................................................................... 85 Table 5-10: Population Projection, National ................................................................................................ 86 Table 5-11: Mining Step Loads ................................................................................................................... 91 Table 5-12: Water Pumping Step Loads ..................................................................................................... 91 Table 5-13: Commercial/Industrial Step Loads ........................................................................................... 92 Table 5-14: Sales Forecast Summary ........................................................................................................ 93 Table 5-15: Generation Forecast Summary ................................................................................................ 94 Table 5-16: Reference Forecast Summary ................................................................................................. 95 Table 5-17: Reference Forecast Energy Components (GWh) .................................................................... 96 Table 5-18: Low Forecast Summary (GWh) ............................................................................................... 98 Table 5-19: Low Forecast Energy Components (GWh) .............................................................................. 99 Table 5-20: High Forecast Summary (GWh) ............................................................................................ 101 Table 5-21: High Forecast Energy Components (GWh) ........................................................................... 102 Table 6-1: Unit Cost of Energy (N$/kWh) for Conventional Base Load Plants at Various Capacity Factors .................................................................................................................................................................. 108 Table 6-2: Unit Cost of Energy (N$/kWh) for Conventional Peaking Plants ............................................. 111 Table 6-3: Unit Cost of Energy (N$/kWh) for Dispatchable Renewable Plants ........................................ 113 Table 6-4: Levelised Unit Cost of Energy (N$/kWh) for Intermittent Renewable Plants .......................... 116 Table 6-5: Generation Options Retained .................................................................................................. 117 Table 6-6: Summary of Key Inputs to the Planning Analysis .................................................................... 119 Table 6-7: Simulation Results for the Five Options .................................................................................. 122 Table 6-8: Unit Additions by Scenario for Option 2 ................................................................................... 123 Table 6-9: Unit/Plant Addition/Retirement Schedule for Scenario 6 in Option 2 ...................................... 124 Table 7-1: Attributes of Generation Options ............................................................................................. 126 Table 7-2: Criteria of Generation Expansion Alternatives ......................................................................... 130 Table 7-3: Level of Renewables Integration for Selected Scenarios ........................................................ 132 Table 7-4: Sensitivity Results – Power Plant Capital Costs ...................................................................... 133 Table 7-5: Sensitivity Study Results – Fuel Cost ...................................................................................... 134 Table 7-6: Sensitivity Study Results – Discount Rate ............................................................................... 134 Table 7-7: Sensitivity Study Results – Load Forecast .............................................................................. 135 Table 7-8: Sensitivity Study Results – CO2 Emission Offset Allowance .................................................. 135 Table 8-1: National Integrated Resource Plan – Implementation Plan A and Schedule .......................... 139 Table 8-2: Estimated Present Value of the Total Cost of the Recommended Plan .................................. 140 Table 8-3: National Integrated Resource Plan – Implementation Plan B and Schedule .......................... 140 List of Figures Figure 2-1: ESI in Namibia ............................................................................................................................ 5 Figure 2-2: Context for the NIRP .................................................................................................................. 6 Figure 2-3: Transmission System of Namibia ............................................................................................. 13 Figure 3-1: Crude Oil Price Forecast .......................................................................................................... 22 Figure 3-2: Natural Gas Price Forecast ...................................................................................................... 23 Figure 3-3: Coal Price Forecast .................................................................................................................. 25 Figure 5-1: Reference Sales and Generation (GWh) ................................................................................. 79 Figure 5-2: Overall Generation Forecasts – Energy (GWh) ....................................................................... 80 Figure 5-3: Constant and Current Total GDP ............................................................................................. 82 Figure 5-4: Historic GDP and Sales Data ................................................................................................... 90 Figure 5-5: Overall Sales Forecasts – Energy (GWh) ................................................................................ 94 Figure 5-6: Overall Generation Forecasts – Peak Demand (MW) .............................................................. 95 Figure 5-7: Reference Sales and Generation (GWh) ................................................................................. 96 Figure 5-8: Reference Forecast Components (GWh) ................................................................................. 97 Figure 5-9: Reference Forecast – Organic vs. Total Sales (GWh) ............................................................. 97 Figure 5-10: Low Sales and Generation (GWh) ......................................................................................... 99 Figure 5-11: Low Forecast Components (GWh) ....................................................................................... 100 Figure 5-12: Low Forecast Organic vs. Total Sales (GWh) ...................................................................... 100 Figure 5-13: High Sales and Generation (GWh) ....................................................................................... 102 Figure 5-14: High Forecast Components (GWh) ...................................................................................... 103

The National Integrated Resource Plan Review and Update – Final Report
September 2016 Page viii of 155
Figure 5-15: High Forecast Organic vs. Total Sales (GWh) ..................................................................... 104 Figure 5-16: Monthly Energy Balance – All Inclusive ............................................................................... 105 Figure 5-17: Monthly Capacity Balance – All Inclusive ............................................................................. 105 Figure 5-18: Monthly Energy Capacity Balance – Energy Policy ............................................................. 106 Figure 6-1: Unit Cost of Energy for Conventional Base Load Plants ........................................................ 109 Figure 6-2: Total Annual Costs of Conventional Base Load Plants .......................................................... 109 Figure 6-3: Unit Cost of Energy for Conventional Peaking Plants ............................................................ 112 Figure 6-4: Total Annual Costs of Conventional Peaking Plants .............................................................. 112 Figure 6-5: Unit Cost of Energy for Dispatchable Renewable Resources ................................................ 115 Figure 6-6: Total Annual Costs of Dispatchable Renewable Resources .................................................. 115 List of Appendices
Appendix A : Terms of Reference
Appendix B : Data Collection Items
Appendix C : Unit Addition/Retirement Schedules

The National Integrated Resource Plan Review and Update – Final Report
September 2016 Page ix of 155
List of Abbreviations
BFB CC
Bubbling Fluidised Bed Combined cycle
CCGT Combined Cycle Gas Turbines
CFB COP 21
Circulating Fluidised Bed 21st Conference of Parties of the UNFCCC
CSP Concentrated Solar Power
DC Direct Current
DSM Demand Side Management
ECB Electricity Control Board of Namibia
EIA U.S. Energy Information Administration
EPC Engineering, Procurement and Construction
ESI Electricity Supply Industry
ESKOM Electricity Supply Commission of South Africa
FGD Flue Gas Desulfurization
FOB Free on Board
FPS Floating Plant System
FSRU Floating Storage & Regasification Unit
GHG Greenhouse gases
GT Gas Turbine
HFO Heavy Fuel Oil
HPP Hydroelectric Power Plant
HRSG ICRE
Heat Recovery Steam Generator Internal Combustion Reciprocating Engine
IDC Interest During Construction
INDC Intended Nationally Determined Contributions
IPP Independent Power Producer
LFO Light Fuel Oil
LNG Liquefied Natural Gas
LRMC Long-run Marginal Cost
MME Ministry of Mines and Energy
MSB Modified Single Buyer
MSW Municipal Solid Waste
MW Megawatt, i.e. One Million Watts
N$ Namibian Dollar
NG Natural Gas
NIRP National Integrated Resource Plan
OPE Oshakati Premier Electric
The National Integrated Resource Plan Review and Update – Final Report
September 2016 Page x of 155
PC Pulverised Coal
PPA Power Purchase Agreement
PV Solar Photovoltaic
RE Reciprocating Engine
RED Regional Electricity Distributor
SAPP Southern African Power Pool
TOR UNFCCC
Terms of Reference United Nations Framework Convention on Climate Change
US$ United States of America Dollar
USTDA US Trade and Development Agency
WB The World Bank
WTE Waste to Energy
ZESC Zambia Electricity Supply Corporation Ltd.
ZPC Zimbabwe Power Company

The National Integrated Resource Plan Review and Update – Final Report
September 2016 Page 1 of 155
1. Background 1.1 Introduction
This report is the Final Report prepared as the fifth and final deliverable under Hatch Ltd.’s (Hatch) contract with the Electricity Control Board (ECB) for Consultancy Services on Review and Update of the National Integrated Resource Plan (NIRP) for Namibia (NIRP Update). The NIRP is a 20-year development plan for Namibia’s Electricity Supply Industry, spanning the period between 2016 and 2035. The report provides the context for the NIRP Update, outlines the existing electricity supply facilities, describes the parameters used in preparing the NIRP Update, presents the load forecast, summarises the generation resources and options included in the analysis, outlines the analysis carried out to determine the preferred generation options and puts forward the recommended National Integrated Resource Plan along with an implementation plan.
In carrying out this assignment Hatch was supported by the Namibian consulting firms EMCON Consulting Group and VO Consulting.
1.2 Scope of Work The scope of work for the project is provided in the ECB’s Terms of Reference which are included as Annexure A to the contract between the ECB and Hatch. For easy reference, these Terms of Reference are provided in Appendix A of this report.
1.3 Timeframe for the Project The contract for this project was signed on October 23, 2015. The Inception Mission took place during the period October 19 through October 28, 2015. The first one-week training workshop was presented at the end of November and the first Stakeholder Workshop was held on December 2, 2015. A Progress Report was submitted on January 7, 2016 and a Preliminary Draft Final report was submitted on February 19, 2016. The latter report formed the basis of the presentation given at the second Stakeholder Workshop held on March 2, 2016. The second one-week training workshop was presented in early March. The Draft Final Report for the study was issued on March 31, 2016. This Final Report includes responses to the ECB and stakeholder comments that have been received on the Stakeholder Workshop presentation and the Draft Final Report. A companion summary report has also been prepared that focuses on the Plan for implementation of the NIRP.
1.4 Data Collection Data collection has proceeded through two main channels – 1) meetings with and/or data requests to ESI agencies and, 2) collection of reports and other documents.
The ECB prepared an official letter signed by its CEO introducing the project consultants and requesting ESI agencies to engage in the project and be available to meet with and provide the required data to the Consultant (see Appendix B).
At the start of the Inception Mission, Hatch provided its overall data requirements list to the ECB. This list is also provided in Appendix B. This list was used as the basis for the preparation of specific listings and templates which were then distributed to the relevant ESI agencies.

The National Integrated Resource Plan Review and Update – Final Report
September 2016 Page 2 of 155
Given their locations across the country, a survey was judged to be the most expeditious approach for initial data collection from distributors. This survey questionnaire is also included in Appendix B.
Table 1-1 lists the documents that have been collected to date.
Table 1-1: Reports and Other Documents Collected
No. Description Published by Date 1 Annual Report Electricity Control Board 2015 2 Electricity Supply Industry –
Statistical Bulletin Electricity Control Board 2014/15
3 Terms of Reference – Consultancy Services for the Review and Update of Namibia’s IPP and Investment Market Framework
Electricity Control Board July 2015
4 Terms of Reference for Procurement of Consultancy Services to Develop a Renewable Energy Policy for Namibia
Electricity Control Board August 2015
5 Tender for Namibian Consultant to Support the Energy Policy Committee to Review and Update the White Paper on Energy Policy
Electricity Control Board September 2015
6 Annual Report NamPower 2015 7 Demand Side Management –
Progress Report NamPower October 2015
8 REFIT Power Purchase Agreement Template – Solar PV
NamPower n/av
9 REFIT Power Purchase Agreement Template – Wind
NamPower n/av
10 REFIT Power Purchase Agreement Template – CSP
NamPower n/av
11 REFIT Power Purchase Agreement Template – Biomass
NamPower n/av
12 REFIT Transmission Connection Agreement
NamPower n/av
13 White Paper on Energy Policy Ministry of Mines and Energy
1998
14 Namibia Vision 2030 Office of the President 2004 15 Namibia Household Income &
Expenditure Survey Namibia Statistics Agency 2012
16 Energy Demand and Forecasting in Namibia
Office of the President 2013
17 Renewable Energy Feed-in Tariff Rules
Nexant August 2014
18 Annual Review Chamber of Mines 2014 19 Mines in the Pipeline & Non
Chamber Members Chamber of Mines October 2015
20 Newsletter Chamber of Mines August 2015 21 Commodity Markets Outlook World Bank October 2015 22 Harvesting Namibian Encroacher
Bush GIZ GmbH 2015
23 WattsOn NamPower Newsletter Edition #1 2015 24 Intended Nationally Determined Government of Namibia September

The National Integrated Resource Plan Review and Update – Final Report
September 2016 Page 3 of 155
No. Description Published by Date Contributions 2015
25 Eskom Schedule of Standard Prices 2015/16
Eskom April 2015
26 SAPP Generation Planning Criteria SAPP November 2011 27 Commodity Markets Outlook –
Quarterly Report WB April 2016
28 Annual Energy Outlook 2015 EIA April 2015
1.5 Outline of the Report This report is presented sequentially in 8 sections and 3 appendices.
Section 1 provides background information on the scope and timing for the project as well as the data collection program. Section 2 provides a brief overview of the existing Namibian electricity sector and indicates the context for the NIRP within the various activities required for a successful electricity supply industry (ESI). Section 3 presents the parameters that will be used in the preparation of the NIRP Update. Section 4 identifies the generation options that will be considered and outlines the key data that will be used for each in the technical/economic analysis. Section 5 provides the updated load forecast for the study period and the supply-demand balances for the initial years of the study period. Section 6 presents the formulation of the expansion scenarios and Section 7 provides the basis for selecting the preferred scenarios based on alternative national policies. Section 8 provides the implementation plan for the NIRP.
Turning to the appendices, Appendix A provides the contract statement of work. Appendix B provides the ECB’s letter introducing the consultants and requesting the cooperation of stakeholders in providing data and information for the project, Hatch’s data request list and a copy of the survey questionnaire sent to electricity distributors. Appendix C provides schedules of unit/plant additions/retirements for a number of the expansion scenarios analyzed in preparing this updated NIRP.

The National Integrated Resource Plan Review and Update – Final Report
September 2016 Page 4 of 155
2. Context for the NIRP Update 2.1 Introduction
This section provides an overview of the Namibian ESI and indicates where the NIRP fits within the various activities carried out in the development of the sector. Following this, the characteristics of the existing power supply and delivery assets are outlined.
2.2 The Namibian ESI and the Role of the NIRP
Namibia has a well-developed ESI that has many features in common with best practices around the world for ESIs. Figure 2-1 identifies the agencies that make up the ESI and depicts how these agencies combine to supply electricity consumers with the services they require.
As the national power company fully owned by the Government of Namibia, NamPower has played, and continues to play, many roles in the ESI. Included amongst the roles played by NamPower has been the single buyer role in which it has been responsible for power import/export agreements with neighbouring countries as well as the purchase of power generated by any Independent Power Producers (IPPs) operating within Namibia. Current developments in the ESI see the role of IPPs increasing. NamPower has recently signed Power Purchase Agreements (PPAs) with a number of individual companies that plan to develop some 70 MW of renewable power projects. Additional IPP generation projects are in the pipeline.
At the same time, a modified single buyer (MSB) model has been proposed with the intent of allowing IPPs to sell power directly to distributors and large users. It is understood that implementation of the MSB model is ongoing.

The National Integrated Resource Plan Review and Update – Final Report
September 2016 Page 5 of 155
Figure 2-1: ESI in Namibia
Following on from the overall structure of the ESI as shown in Figure 2-1, it is important to note the overall context for the NIRP, in particular the key inputs to the NIRP and the ways that the NIRP would be used in the ongoing development of the sector. Figure 2-2, in which the NIRP is highlighted in green, is designed to convey this information.

The National Integrated Resource Plan Review and Update – Final Report
September 2016 Page 6 of 155
Figure 2-2: Context for the NIRP
As indicated in the chart, national energy policies should set the stage for all aspects of the ESI. At the present time, the White Paper on Energy Policy of 1998 is the key policy document for the ESI. The ECB is currently undertaking three very important policy reviews that will have important implications for the ESI. The first is the review and update of the White Paper itself. At the same time, the ECB is developing the country’s first Renewable Energy Policy and is also carrying out a review and update of Namibia’s IPP and Investment Market Framework. These initiatives will potentially have significant impacts on the ESI and in turn on future NIRPs. The current review and update of the NIRP will be informed by these initiatives but due to the timing of the current study will likely not reflect the final outcomes of the three policy initiatives.

The National Integrated Resource Plan Review and Update – Final Report
September 2016 Page 7 of 155
2.3 The Namibia Power System
2.3.1 Inventory of Existing Power Plants
Summary
Table 2-1 provides summary information on the existing grid connected commercial power plants.
Table 2-1: Power Plants in Namibia January 2016

The National Integrated Resource Plan Review and Update – Final Report
September 2016 Page 8 of 155
Ruacana Hydropower Station
The Ruacana hydro power station is located on the Kunene River, in the north of Namibia, where the Kunene River becomes the border between Namibia and Angola. The station was commissioned in 1978 and consists of three 80 MW hydro generators and a fourth unit of 92 MW commissioned in May 2012 for a total capacity of 332 MW. The station has black start up diesel generators and a 330 kV transmission line running from Ruacana to the Omburu substation which is some 570 km in length.
The Ruacana station is mainly operated as a run-of-river power plant as its upstream storage dams are either not completed or were damaged in the Angolan civil war. The output of the hydro power station depends on the amount of water available in the river. A small diversion weir just upstream of Ruacana allows the power station to produce at its full capacity for eight hours. During the rainy season (from February to May) the station is run at full output level and operated as a base load power plant, while for the remainder of the year it is operated predominately as a peaking power plant.
NamPower has identified the need to repair the runners in the turbines of units 1 to 3. Since the repair of the runner structure is required, NamPower has considered a major refurbishment of the turbines including replacing runners with more efficient design. This refurbishment will increase efficiency by approximately 6% for each unit. This increase will provide approximately 5 MW of additional peaking capacity per unit. In addition, on average, the plant’s generation will increase by about 60 GWh on an annual basis. Once the refurbishment is completed, the maximum plant output will be approximately 347 MW (3x85 + 92).
The monthly energy production for Ruacana, once the refurbishment is completed, is shown in Table 2-2 for average and firm conditions. In this case “firm” energy is that energy that is associated with a hydrology of 90% probability of exceedance. While a 95% probability level of exceedance is often used in planning work to allow for a reliable supply level in case that a dry hydrology is encountered during any particular year, the 90% level was selected for this study due to the existing interconnections of the Namibian network with other networks in the region.

The National Integrated Resource Plan Review and Update – Final Report
September 2016 Page 9 of 155
Table 2-2: Ruacana Generating Capability
Month Firm Energy (GWh)
Average Energy (GWh)
January 90.74 148.44 February 101.49 166.03 March 142.35 232.86 April 139.19 227.69 May 120.42 197.00 June 69.82 114.22 July 57.74 94.45 August 45.36 74.21 September 35.92 58.77 October 27.27 44.61 November 32.45 53.09 December 57.24 93.64 Total 920.0 1,505.0
For planning purposes and in order to construct a system model, the plant will be modelled with a forced outage rate of 4% and planned maintenance of 2 weeks per year for each unit will be modeled by derating monthly capacities over the months with energy limitations.
Van Eck Coal Power Plant
The Van Eck coal-fired power plant is situated on the northern outskirts of Windhoek. It has a total rating of 120 MW using four 30 MW generators and was commissioned in 1973. Due to various reasons, only up to three units can currently be operated at the same time. The station needs external power for start-up. Due to the frequent water constraints in Windhoek the plant was designed as a dry cooled station. The coal used is imported from South Africa, transported by ship to Walvis Bay and then by rail or road to Windhoek. This is costly and the plant is normally operated as a standby and peaking power station only. During the recent regional constraints, it has been run at mid-merit to base load. The power station has very limited emission control equipment and thus emits high levels of air pollutants. The station is therefore limited to burning 3,500 tonnes of coal each week, although it may use emergency stockpiles if necessary.
These aging units are becoming less and less reliable as they approach the end of their technical life. At present, the maximum continuous output of the plant can reach is only some 60 MW due to various constraints.
A study on the rehabilitation options for the plant funded by the US Trade and Development Agency (USTDA) was completed a few years ago. The study examined several rehabilitation options which would result in different output, extension of life and capital costs.

The National Integrated Resource Plan Review and Update – Final Report
September 2016 Page 10 of 155
As per the information collected, refurbishment of the Van Eck Power Plant started a few years ago and it is expected the refurbishment will be completed by early 2016. After the rehabilitation work, it is expected that the plant would meet its original design output of 120 MW (gross) and will be able to achieve a guaranteed base load output of at least 90 (gross) MW. Table 2-3 presents the expected main parameters of the plant after refurbishment, to be used in the NIRP Update study.
Table 2-3: Characteristics of the Van Eck Coal Power Plant
Item Refurbished Net Capacity (MW) 108 FOR (%) 10 Planned Maintenance 42 Days Net Heat Rate (kJ/kWh) 17,569 Fixed O&M (N$/kW-Yr) 2,200 Variable O&M (N$/MWh) In the Fixed O&M
Anixas Power Station
The Anixas power station is located near the Paratus power station in Walvis Bay. This station benefits from new and proven technology which has a higher efficiency and reliability, and less emissions and noise than older power stations of its type. There are 3 Caterpillar V16 cylinder internal combustion reciprocating engines (ICRE) generator sets, each with a net electrical capacity of 7.5 MW, for a total of 22.5 MW (gross). The power station started operations at the end of July, 2011 with the official inauguration in November 2011.
The three generator sets are housed in a building with its own control room, offices and a black start generator of 810 kVA capacity. The generators use LFO for starting and stopping and HFO once they have reached a certain output. The station has fuel offloading facilities and a fuel treatment system.
Radiators are used for cooling. A high exhaust stack disperses emissions high up, reducing ambient concentration of any pollutants. Noise attenuation and control conform to international standards. Care was also taken to select materials capable of withstanding the extreme corrosive environment of Walvis Bay.
Table 2-4 presents the characteristics for the generating units at Walvis Bay.
Paratus Power Station
The Paratus power station is located in Walvis Bay. It has a total rating of 24 MW using four 6 MW (nominal) ICRE generators The rating of each unit is dependent on the ambient temperature, with a rating of approximately 5 MW at low temperatures and some 2 MW at high temperatures. The station has a black start up generator and was commissioned in 1976. It is used mainly as a standby and peaking power station respectively but it is also contractually bound as an emergency standby plant for the city of Walvis Bay. Paratus runs at very high marginal cost and can only generate a maximum of 6 MW (gross).
The power station uses light fuel oil (LFO) to start-up and shut down, switching to heavy fuel oil (HFO) once a unit is generating more than 2.7 MW.
The National Integrated Resource Plan Review and Update – Final Report
September 2016 Page 11 of 155
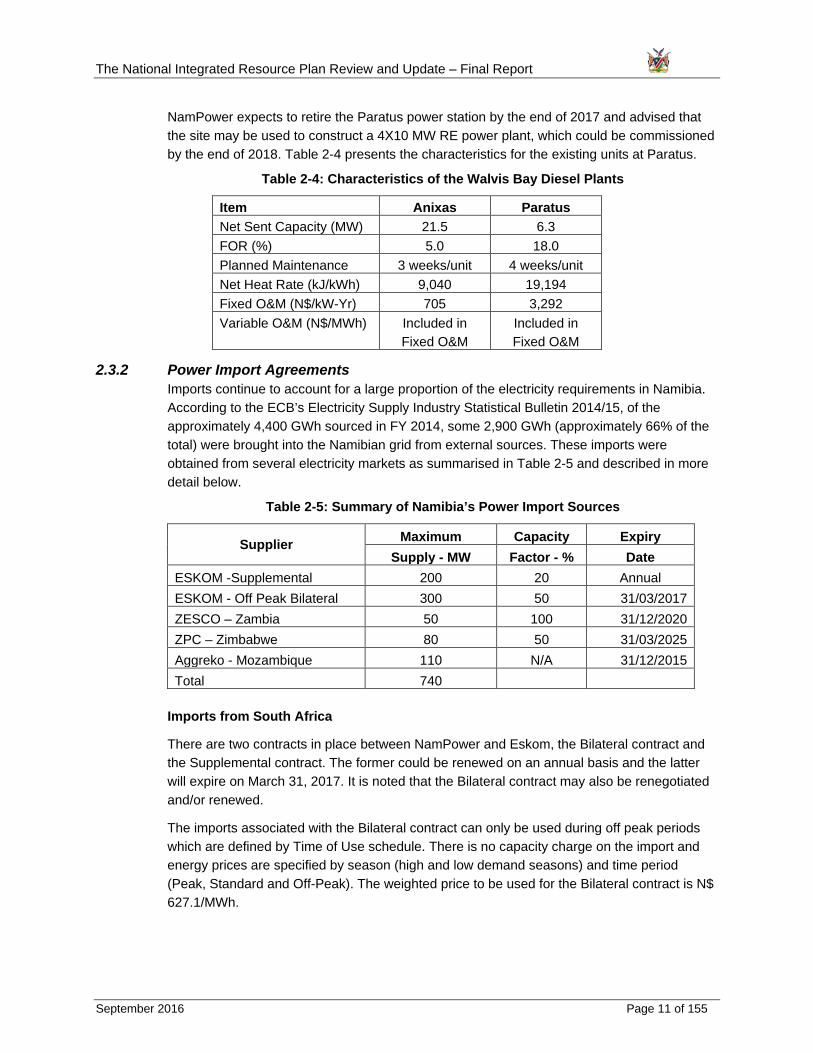
NamPower expects to retire the Paratus power station by the end of 2017 and advised that the site may be used to construct a 4X10 MW RE power plant, which could be commissioned by the end of 2018. Table 2-4 presents the characteristics for the existing units at Paratus.
Table 2-4: Characteristics of the Walvis Bay Diesel Plants
Item Anixas Paratus Net Sent Capacity (MW) 21.5 6.3 FOR (%) 5.0 18.0 Planned Maintenance 3 weeks/unit 4 weeks/unit Net Heat Rate (kJ/kWh) 9,040 19,194 Fixed O&M (N$/kW-Yr) 705 3,292 Variable O&M (N$/MWh) Included in
Fixed O&M Included in Fixed O&M
2.3.2 Power Import Agreements Imports continue to account for a large proportion of the electricity requirements in Namibia. According to the ECB’s Electricity Supply Industry Statistical Bulletin 2014/15, of the approximately 4,400 GWh sourced in FY 2014, some 2,900 GWh (approximately 66% of the total) were brought into the Namibian grid from external sources. These imports were obtained from several electricity markets as summarised in Table 2-5 and described in more detail below.
Table 2-5: Summary of Namibia’s Power Import Sources
Supplier Maximum Capacity Expiry Supply - MW Factor - % Date
ESKOM -Supplemental 200 20 Annual ESKOM - Off Peak Bilateral 300 50 31/03/2017 ZESCO – Zambia 50 100 31/12/2020 ZPC – Zimbabwe 80 50 31/03/2025 Aggreko - Mozambique 110 N/A 31/12/2015 Total 740
Imports from South Africa
There are two contracts in place between NamPower and Eskom, the Bilateral contract and the Supplemental contract. The former could be renewed on an annual basis and the latter will expire on March 31, 2017. It is noted that the Bilateral contract may also be renegotiated and/or renewed.
The imports associated with the Bilateral contract can only be used during off peak periods which are defined by Time of Use schedule. There is no capacity charge on the import and energy prices are specified by season (high and low demand seasons) and time period (Peak, Standard and Off-Peak). The weighted price to be used for the Bilateral contract is N$ 627.1/MWh.

The National Integrated Resource Plan Review and Update – Final Report
September 2016 Page 12 of 155
A supply contract with up to 200 MW of Special Assistance or the Supplemental contract was negotiated with Eskom with the provision that it will be reviewed annually. Due to power supply shortages within South Africa, this supply option can only be requested by NamPower after all local supply options have been exhausted, including any active demand management programs within Namibia. There is no capacity charge on the import and energy prices are specified by season (high and low demand seasons) and time period (Peak, Standard and Off-Peak).
Based on the contract clauses, NamPower must also shed its load if there is load shedding in South Africa due to generation shortages. The load to be curtailed in Namibia is equal to the Eskom load shedding ratio multiplied by the amount of Special Assistance.
This agreement is vital to Namibia’s security of supply as depicted given the percentage of Eskom’s share of the total imports over the last few years.
The tariffs associated with this contract are complex and require intelligent meters to be in place to accurately record the power that is imported. For the present study the model to be used is unable to correctly model the complexity of seasonal and three daily tariffs and as such it was decided to blend the tariffs into a single value taking into account the duration of each time of use value. The price actually paid is heavily dependent on the number of hours of imports during each time period the foreign currency exchange rate as the prices are based on US$. Under the agreement with Eskom, the lower the number of hours of import during the off peak period, the higher the blended price. The weighted price to be used for the Supplemental contract is N$ 2,782.3/MWh.
Power Supply Agreement with Zambia
The power supply agreement with the Zambia Electricity Supply Corporation Limited (ZESCO) came into effect on 16 January 2010. The agreement has 10-year duration and a firm capacity of 50 MW, which will be expiring on December 31, 2020.
There is also a non-firm agreement with ZESCO for 50 MW which would be confirmed on a daily basis but this agreement has not been executed. This could be partially due to transmission constraints in the ZESCO system and could be executed once the constraints are resolved.
The ZESCO import has a two-part tariff, a demand charge and an energy charge. The import has a very high capacity factor and has been identified as being close to 100%. The capacity charge has to be paid regardless of the amount of energy being withdrawn. At 100% capacity factor the blended cost of energy will be N$712.8/MWh.
Power Supply Agreement with Zimbabwe
NamPower has a power supply agreement with the Zimbabwe Electricity Supply Authority (ZESA) for the supply of 80 MW. The contract will expire on March 31, 2025. The weighted tariff for this contract is N$ 2,224/MWh.
Power Supply Agreement with Aggreko in Mozambique
This agreement for up to 110 MW expired on December 31, 2015.
The National Integrated Resource Plan Review and Update – Final Report
September 2016 Page 13 of 155
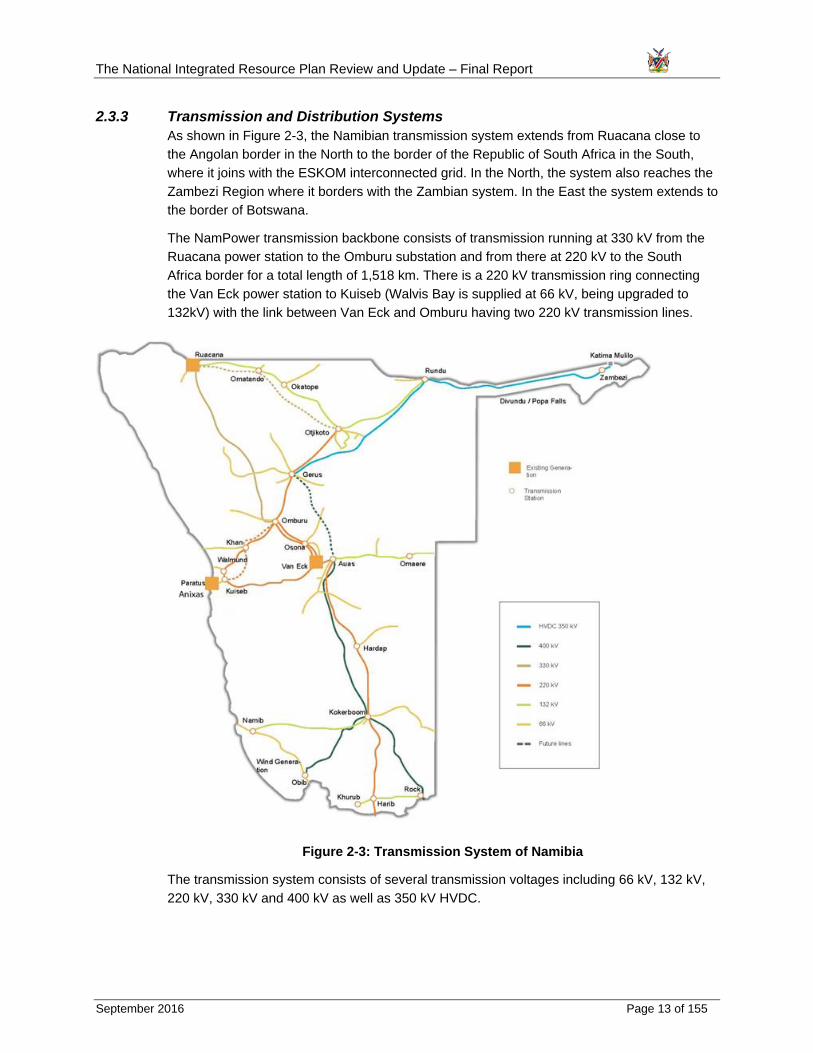
2.3.3 Transmission and Distribution Systems As shown in Figure 2-3, the Namibian transmission system extends from Ruacana close to the Angolan border in the North to the border of the Republic of South Africa in the South, where it joins with the ESKOM interconnected grid. In the North, the system also reaches the Zambezi Region where it borders with the Zambian system. In the East the system extends to the border of Botswana.
The NamPower transmission backbone consists of transmission running at 330 kV from the Ruacana power station to the Omburu substation and from there at 220 kV to the South Africa border for a total length of 1,518 km. There is a 220 kV transmission ring connecting the Van Eck power station to Kuiseb (Walvis Bay is supplied at 66 kV, being upgraded to 132kV) with the link between Van Eck and Omburu having two 220 kV transmission lines.
Figure 2-3: Transmission System of Namibia
The transmission system consists of several transmission voltages including 66 kV, 132 kV, 220 kV, 330 kV and 400 kV as well as 350 kV HVDC.

The National Integrated Resource Plan Review and Update – Final Report
September 2016 Page 14 of 155
The first stage of the Caprivi Link Interconnection project was officially commissioned on November 12, 2010, which comprises a 951 km 350 kV HVDC line with converter stations at Zambezi and Gerus substations. The Zambezi substation is located in Katima Mulilo, the Capital of the Caprivi Strip at the border between Namibia and Zambia. The Gerus substation is situated outside Otjiwarongo in central Namibia.
The Caprivi Link Interconnection was built in monopole mode with capability of transmitting 300 MW of power. It could be upgraded to 600 MW in bi-pole mode as demand increases and as trading opportunities evolve in the region. The link is an important component of the future ZIZABONA connection.
ZESA of Zimbabwe, ZESCO of Zambia, BPC of Botswana and NamPower of Namibia signed an Inter-Utility Memorandum of Understanding (IUMOU) for co-operation in new transmission infrastructure investment. The project is planned to be commissioned in two phases, namely the Hwange/Livingstone (Phase 1) and Victoria Falls – Pandamatenga – Zambezi Transmission Stations (Phase 2). Due to challenges encountered with regards to the financing of the ZIZABONA Project, it was decided to engage a consultant to repackage the project. The scope of the consultant is to conduct market studies, transmission pricing and system studies in support of the realisation of the project.
Distribution lines with the voltage 33 kV and below extend radially from the main substations for further dispersion of power to the consumption areas along the coast and inland. As great parts of the country are rather sparsely populated, the area served by the distribution network covers quite a small portion of the total area.
The REDs and certain local and regional authorities are responsible for the distribution and supply of electricity to end consumers within their respective areas. As of the end of the 2014/2015 fiscal year they serve approximately 233,000 end consumers, of which some 90% are domestic users.
2.4 Committed Power Plants There are several power generation projects which could be treated as committed power plants. These are summarised in Table 2-6.
Table 2-6: Committed Power Plants as of January 2016
The 70 MW REFIT program includes 14 individual projects, each at 5 MW. Only one of the 14 projects will be from wind and the rest will be from solar PV.

The National Integrated Resource Plan Review and Update – Final Report
September 2016 Page 15 of 155
3. Study Parameters This section provides the economic parameters on which the NIRP Update analysis will be based, defines the power system reliability criteria that will be used and outlines the assumptions on fuel prices.
3.1 Economic Parameters
3.1.1 National Focus The development of the NIRP Update is carried out from a national perspective to maximise the benefits to all Namibians rather than being concerned with particular interests of individuals or entities. The NIRP Update is to cover the entire territory of Namibia and take into account existing policies and the national development strategy of Vision 2030.
3.1.2 National Focus and White Paper on Energy Policy The Namibia Energy Policy Committee (NEPC) of MME published the White Paper on Energy Policy in May 1998. It is noted that the ECB has recently tendered for selection of a consultant to assist the Energy Policy Committee review and update the 1998 White Paper. However, the updated policy is not expected to be prepared and approved in time for reference as part of this work on the NIRP Update.
The 1998 White Paper is quite a comprehensive document consisting of an executive summary and five principal sections. Section 1 provides the rationale for the White Paper on Energy Policy and the sector’s profile, Section 2 focuses on energy demand for the productive sectors, urban energy needs and rural energy needs. Section 3 addresses energy supply and deals with electricity, gas, liquid fuels and renewable energy. Section 4 deals with cross cutting themes including economic empowerment, environment, health and safety, energy efficiency and conservation and regional energy trade. Section 5 points to the way forward.
The following goals served as a framework for the energy policies;
• Effective governance - Systems were to be in place to provide stable policy, legislative and regulatory frameworks for the sector.
• Security of supply – To be achieved through an appropriate diversity of competitive and reliable sources, with emphasis on the development of local resources.
• Social upliftment – Consumers to have access to appropriate, affordable energy supplies.
• Investment and growth - The sector to expand through local and foreign fixed investment, resulting in economic benefits for the country. Attention to be given to black economic empowerment.
• Economic competitiveness and efficiency - The sector to be economically efficient and to contribute to Namibia’s economic competitiveness.
• Sustainability - The sector to move towards the sustainable use of natural resources for energy production and consumption.

The National Integrated Resource Plan Review and Update – Final Report
September 2016 Page 16 of 155
As part of the energy policy, Government is to promote the use of renewable energy through the establishment of an adequate institutional and planning framework, the development of human resources and public awareness and suitable financing systems.
The energy policy goal of sustainability is to be promoted through a requirement for environmental impact assessments and project evaluation methodologies which incorporate environmental externalities. While energy efficiency was to be promoted through policies on better information collection and dissemination, and particularly with respect to energy efficiency and conservation practices in households, buildings, transport and industry. Security of supply was to be achieved through an appropriate diversification of economically competitive and reliable sources, but with particular emphasis on Namibian resources.
As part of one of the policy statements, the White Paper on Energy Policy outlines the amounts of generation to be from internal sources stating: “Duly considering associated risks, it is the aim of government that 100% of the peak demand and at least 75% of the electric energy demand will be supplied from internal sources by 2010. Risk mitigation measures will be pursued, including the possibility of regional equity participation in, and guarantees for, Namibian generation projects.”
As of the time of writing, the targets for internal supply specified in the policy have not been realised. Generation resources located within Namibia’s territory can currently supply up to a maximum of 420 MW (even though the installed capacity is now approximately 500 MW) to meet a peak demand that has reached 597 MW (in June 2015); imports from sources outside Namibia have provided an average of just over 60% of the annual energy requirements over the last five years.
3.1.3 Economic Costs The NIRP Update is prepared from a national perspective using economic costs rather than financial costs. As shown in Figure 2-2, financial factors come into play when specific projects in-line with the NIRP Update are developed by government, the private sector or by means of public private partnerships. The NIRP Update analysis is based on economic values that do not take into account such factors as the imposition of taxes or royalties by government or any risk premium that may be charged by private sector investors. Government taxes and royalties are not included in the calculation of economic costs, as these are a transfer payment between one group in the economy and another, rather than a cost to the economy as a whole. The analysis is carried out using a social discount rate, that is, the rate of return on capital expected by society, rather than the investment criteria that may be used by the private sector.
Economic costs are used to determine what the right choices would be from the point of view of the Namibian economy and society as a whole.
3.1.4 Planning Horizon As per the requirement outlined in the Terms of Reference, the plan is to cover a development period of 20 years and it is intended to model the system from 2016 to 2035.

The National Integrated Resource Plan Review and Update – Final Report
September 2016 Page 17 of 155
At the end of the simulation period, the various expansion scenarios can have different plant mixes with different remaining lives and different operation and maintenance costs as well as different investment costs. In order to measure all benefits of the plants that are commissioned in the planning period and take into account different plant lives, it is a common practice in integrated resource planning to extend the planning horizon by a period ranging from 10 to 15 or more years. For the extended period, demand and supply are maintained at the same level as at the end of the simulation period. An extended period of 15 years is used in this study.
In order to simplify the overall analysis and for ease of understanding the overall concept, the report will show the cumulative present worth of costs to the end of the 20-year planning period for each generation expansion scenario and the cumulative present worth of costs for the extended period.
3.1.5 Cost and Present Worth Datum All costs will be expressed in January 2016 prices. All present worth and discounting calculations will also use January 2016 as their reference point.
3.1.6 Escalation The economic analysis will be based on real costs expressed at January 2016 price levels, omitting projections for general price inflation during the planning period. However, if any parameters are expected to exhibit price changes that are significantly different than the rate of general price inflation, a differential escalation rate will be included.
3.1.7 Currency and Exchange Rate All monetary values will be expressed in constant Namibian Dollars (N$), in border prices or equivalence. All economic costs and benefits will exclude all local duties and taxes. The Namibian Dollar is pegged at parity to the South African Rand thus a border price to South Africa would be equivalent to the Namibian border price with the addition of an appropriate transportation cost.
For this assignment, prices that are obtained in United States Dollars (US$) will be converted to N$ at an exchange rate of 1 US$ to 16 N$ although the exchange could fluctuate significantly. On December 11, 2015, one US$ was approximately equal to 15.8 South African Rand (ZAR), which is equivalent to N$. One recent forecast indicates that ZAR will be continuously devalued over next two years and one US$ could be equal to 17.5 ZAR by the middle of 2016.
3.1.8 Discount Rate Typical practice for national economic studies is to set the discount rate at 10 percent. This rate is used in this study to calculate the present worth of input costs expressed in real terms.
The study will also consider discount rates of 6%, 8%, 12% and 14% as part of the sensitivity analysis.
3.1.9 Cost of Expected Unsupplied Energy A customer survey of the market sectors of the ESI in South Africa indicated that the cost of unserved energy could be in the order of 20,000 N$/MWh. Recent surveys in South Africa have suggested even higher values, as high as 75,000 N$/MWh.

The National Integrated Resource Plan Review and Update – Final Report
September 2016 Page 18 of 155
An economic expression for the cost of unserved energy is to divide the country’s GDP by the total electricity consumption. Considering Namibia’s GDP of N$ 141 billion (for 2014 in current prices) and electricity generation plus imports of some 4,400 GWh (in 2014) this would result in a value of about 32,000 N$/MWh.
Based on this information, a value of 30,000 N$/MWh or 30 N$/kWh will be used for the cost of unserved energy in this NIRP Update.
3.1.10 Cost of Losses To evaluate the different transmission expansion plans it will be necessary to compare and cost losses between the different plans. The energy value of losses will be based on the most expensive cost of energy import, while capacity losses will be evaluated based on the cost of gas turbines.
3.1.11 Duties and Taxes Duties and taxes are not included in this economic study.
3.1.12 Interest During Construction Interest is a financial cost and as such is excluded from the economic evaluations. The impact of construction periods of different lengths will be taken into account by distributing the capital over the entire construction period. In order to align the distributed investment flow and present value calculation, the rate used will be equal to the discount rate.
3.2 Reliability Criteria The primary objective of generation expansion planning is to find the least cost long-term expansion scenario that supplies the forecast demand at an acceptable or specified level of reliability. In any given year it is essential to verify that the generation capacity reserve is sufficient so that the system can meet the load demand even if one or more units are out of service and/or, for systems with significant hydroelectric capacity, unexpected hydrological conditions are encountered. The reliability criteria are usually the deciding factor in scheduling the addition of new generating plants. There are usually two types of reliability criteria used in generation expansion planning: deterministic and probabilistic.
3.2.1 Deterministic Criteria There are a number of ways to define deterministic reliability criteria. The core part of these criteria is, however, generation capacity. Depending on the application, these criteria could be measured using the values calculated using generator gross MCR (maximum continuous rating), net MCR (gross MCR less station services), or seasonal MCR (MCR less seasonal derating and/or energy limitation). Some utilities/systems apply the deterministic criteria prior to allowing for generating unit planned maintenance outage while others apply them after.
The deterministic reliability criteria are normally expressed in three different ways: (1) a fixed amount of capacity in MW to account for the random outage of one, two or more largest units, (2) a percentage of annual peak demand, or (3) a percentage of annual peak demand plus a fixed amount of capacity.
3.2.2 Probabilistic Criteria The probabilistic reliability criteria include both the loss of load probability (LOLP) and the expected unsupplied energy (EUE), which are obtained from the convolution of the load demand and available generation.

The National Integrated Resource Plan Review and Update – Final Report
September 2016 Page 19 of 155
LOLP is used to measure the risk associated with having insufficient generation capacity to meet the forecast load demand, which is normally expressed in days per year or hours per year, or as a percentage. For example, a 1% LOLP indicates that the installed generation will not be able to meet the forecast demand in a given year for 3.65 days or 87.6 hours. It is important to understand that a simple LOLP value may have different implications as it could be calculated based on either a daily peak load duration curve or an hourly load duration curve. In the case of the daily peak load duration curve, each day is represented by one point, the highest hourly demand during the day.
EUE is the quantity of expected energy that a system would not be able to serve with the planned generation system in a given year. It is expressed either in MWh or as a percentage in which case it is equal to the expected unsupplied energy divided by the annual energy demand and multiplied by 100.
In this study, a LOLP criterion value of 5 days per year was adopted for the period from 2016 to 2020 and 2 days per year for the balance of the study horizon, which allocates adequate time to achieve the reliability goal. The EUE criterion has been used as companion criteria with EUE not to exceed a value of 1%.
3.2.3 Southern African Power Pool (SAPP) Reliability Criterion As a member of SAPP, Namibia is required to operate its power sector within parameters established by SAPP which include a reliability criterion. The SAPP reliability criterion is that the reserve capacity obligation of a member for any given period is to be equal to 10.6 % of the annual system peak of such member when the generating plant is thermal and 7.6 % when the generating plant is hydro. A weighted average is to apply to members who have a mixed system which implies an overall reserve of less than 10% for Namibia.
The SAPP criterion is classified as a deterministic criterion and since a probabilistic criterion is used in developing this NIRP Update, checks will be carried out that the SAPP criterion is satisfied.
3.3 Emissions Criteria The development of any power plant needs to take full account of the environmental impact of the plant irrespective of its location. Due consideration must be taken of both the indirect and direct environmental effects and, where appropriate, suitable mitigation measures should be put in place.
Environmental considerations for power plants are addressed in Section 6 of this report. One of the environmental considerations for the thermal plants is the expected levels of emissions from the stacks of those plants (sulphur dioxide, nitrous oxides, carbon dioxide and other greenhouse gases, particulate matter, etc.).
In today’s practice it is common when comparing different forms of generation to apply an economic levy on thermal plants to take account of the cost to society of emissions that, while within the legal limits, do create costs that society as a whole must bear. This is normally done on the basis of the level of emissions such as CO2, SO2 and NOx expected to be emitted by the relevant plant type. Some studies levy a cost in terms of US$ per tonne for the emissions to represent the societal cost for these emissions. This study includes a penalty of 60 N$ per tonne of emissions, representing a societal cost, levied against thermal options, which reflects the current low market prices on voluntary GHG reductions.

The National Integrated Resource Plan Review and Update – Final Report
September 2016 Page 20 of 155
3.4 Fuel Prices This section presents price assumptions in January 2016 US dollars for the fuels to be included in preparation of the NIRP Update. The fuels considered include diesel (light fuel oil – LFO), residual (heavy fuel oil – HFO), natural gas (NG), liquefied natural gas (LNG), coal, uranium, biomass and medium blend fuels. The prices of fuels are converted from their native and usually used units into US$/GJ and subsequently into N$/GJ.
3.4.1 Fuel Background in Namibia Liquid fuels, mainly in the form of petrol and diesel, dominate the Namibian energy sector. As per the report prepared by the Government of Namibia1, the energy from oil products consumed (liquid fuels) in 2010 was some 73% of all energy consumed. The second largest energy form was electricity, accounting for some 15% (it is noted that the use of biomass was not taken into account in the report). The oil industry is controlled by five private oil companies, although the price and distribution of fuel is regulated by government. All liquid fuels are imported.
In 2010, coal and coal products accounted for only some 2% of Namibia’s net energy consumption. As Namibia does not have economically exploitable coal reserves, all coal, is imported.
Biomass is the main fuel of households in the North where much of the population resides.
Namibia has an excellent solar resource and good biomass resources as well as fair wind resources. It has yet to record a commercial oil discovery, but it is endowed with largely undeveloped energy resources in the form of hydro-power and natural gas (Kudu field) in addition to uranium.
Exploration licenses for offshore and onshore drilling have been granted to a few major companies. The exploration is for both oil and natural gas.
3.4.2 Underlying Assumptions All liquid fuels used in Namibia are imported and obtained in the world market; therefore, for the NIRP Update the price for these fuels will follow closely international prices for crude oil. As such it was decided to investigate the publicly available forecasts for crude as they could provide a good indication of the most likely future price trends.
Similarly, the coal used in Namibia is also imported and as such new generation sources using this fuel would also have to obtain coal in the international markets for which there are a few long range price forecasts.
Finally, it was judged that the base case price forecast for the Kudu natural gas would follow closely the price of internationally traded liquefied natural gas. It was assumed that natural gas available in the international market would be a good proxy for the price of the Kudu gas and in this case the cost of re-gasification would have to be considered.
The forecast prices were collected from four well known institutions, the EIA (Energy Information Administration), WBG (World Bank Group), KPMG and Sproule.
1 Energy Demand and Forecasting in Namibia – Energy for Economic Development, National Planning Commission, Office of the President, 2013.
The National Integrated Resource Plan Review and Update – Final Report
September 2016 Page 21 of 155
The U.S. EIA collects, analyses, and disseminates independent and impartial energy information to promote sound policymaking, efficient markets, and public understanding of energy and its interaction with the economy and the environment.
The WBG’s engagement in the energy sector is aimed at supporting developing countries to secure the affordable, reliable and sustainable energy supply needed to end poverty and promote shared prosperity. The WBG acts as a knowledge hub for Sustainable Energy for All, leading numerous agencies in major collaborative projects to monitor and report on energy development outcomes.
The KPMG Global Energy Institute allows global industry experts to share knowledge, insights, collaborate and participate in timely and relevant issues facing the market. Its Global Energy network works with major organisations in a variety of energy related sectors to respond to business issues and trends.
Sproule is a diversified, world-wide petroleum consulting firm with 60 years of experience in all aspects of the energy sector throughout North America and the World.
The outlooks produced by each of the four institutions are recent and are dated as of:
1. The EIA Annual Energy Outlook 2015 with Projections to 2040 was released in April 2015
2. The WBG Commodity Markets Outlook was released in April 2016
3. The KPMG Coal Price and FX Consensus Forecasts June/July 2015 issue presents the coal price outlook for the period from 2015 to 2019
4. The Sproule forecast was released in September 2015
Given its broad perspective on commodity markets, it was decided to base the price forecasts for oil and coal on the World Bank projections. The Sproule forecast was taken into account in selection of the forecast for natural gas prices.
3.4.3 Crude Oil Forecast Crude oil price forecasts were collected from three institutions, the EIA, WB and Sproule.
Figure 3-1 shows the forecast prices for crude oil over the next 11 years, i.e. from 2015 to 2025. The EIA price is for imported crude delivered to U.S. refiners. The WBG price is for the average spot price around the world and the Sproule price is for UK Brent crude oil.

The National Integrated Resource Plan Review and Update – Final Report
September 2016 Page 22 of 155
Figure 3-1: Crude Oil Price Forecast
The following could be observed from Figure 3-1:
1. The EIA forecast price is expected to increase over the forecast period, i.e. from the price of some US$ 54/BBL in 2015 to some US$ 88/BBL in 2025
2. The WB forecast predicts that the crude price would decrease to some US$ 40/BBL in 2016 and then increase to some US$ 70/BBL gradually from 2017 to 2025. It is noted that in December, 2015, the crude price was only approximately US$ 37/BBL
3. The Sproule forecast shows the price would be very close to US$ 80/BBL from 2019 to 2025
4. Based on the WB forecast, it was determined that an average price of US$ 60/BBL for crude oil will be used in this NIRP Update
It is important to note that the price forecasts shown in Figure 3-1 are the FOB prices and do not include the cost of transportation to the refinery, refining cost and delivery cost of the refined products to the end user.
To account for transportation, handling, refining, insurance and losses an additional cost of US$ 20/BBL will be added.
For forecasts beyond 2025, it is assumed that the trend for 2020 to 2025 would be followed from 2026 to 2034.

The National Integrated Resource Plan Review and Update – Final Report
September 2016 Page 23 of 155
3.4.4 Price Forecast for Kudu Natural Gas The forecast prices for natural gas were collected from the EIA, WBG and Sproule. As previously mentioned, it is assumed that these forecasts would serve as a proxy for the expected prices for the Kudu natural gas. Figure 3-2 shows two groups of forecasted prices, for Henry Hub (U.S.) and Europe. It can be seen from this figure that the Henry Hub prices are much lower than the European prices. The WBG predicted an almost constant price for the European gas. For Britain, Sproule forecasts a price increase over the next couple of years and after that the price will be relatively constant.
Figure 3-2: Natural Gas Price Forecast
In view of the above values it is difficult to forecast a proxy price for the Kudu natural gas. From the values shown in Figure 3-2 it appears that Henry Hub prices will increase significantly over the 10-year period (from 2011 to 2020) and that European and Henry Hub prices could become closer in the future. It is noted that on December 11, 2015, the natural gas price at Henry Hub was approximately US$ 2/MMBTU, i.e. some US$ 1.9/GJ.
Given the physical location of Namibia, the current LNG prices and its likely LNG sources, one could argue that a modified Sproule’s price forecast for the European gas could be more reasonable for use in this NIRP Update study. It is also important to note that the prices presented in Figure 3-2 are the ones at main hubs and they do not include the component required to transport the gas to its final destinations. For natural gas price forecasts beyond 2025, it is assumed that the trend from 2020 to 2025 would be followed from 2026 to 2034.
Given the above, it is assumed that the delivered cost of Kudu natural gas would be in the order of US$ 10/GJ.

The National Integrated Resource Plan Review and Update – Final Report
September 2016 Page 24 of 155
3.4.5 Estimate of Natural Gas Price from Liquefied Natural Gas Natural gas transported as LNG needs to go through the LNG chain from its production at a well to the use for electricity generation in a power plant, i.e. production, liquefaction, transportation, regasification and transport to the power plant location. The price of gas delivered at a power plant must therefore include all cost contributions from these five processes.
Although LNG supply under spot and short term contracts (with duration of four years or less) has decreased over the past couple of years, LNG transactions have mainly been based on long-term contracts lasting for 20 or more years. The prices of some of these long-term contracts are indexed at approximately 90% of crude oil prices. The terms and conditions of the long-term contracts will include at least several key clauses such as annual supply quantity, price, delivery format (such as FOB – free on board and destination) and price adjustment mechanism. The LNG FOB price usually covers two components in the LNG chain, production and liquefaction. As an LNG contract is subject to many factors, its price therefore varies widely, from a couple of US$ per GJ to some US$ 15 per GJ, i.e. from N$ 32 to N$ 240 per GJ. An LNG FOB price of US$ 6 per GJ (N$ 90/GJ) is assumed in this study.
A transportation cost of US$ 50 per tonne will convert to a rate of US$ 1 per GJ based on the assumption that the heating value of LNG is 50 GJ per tonne. In this estimate it was assumed that the lease fee of one LNG vessel with a capacity of 135,000 cubic meters would be some US$ 100,000 per day and each LNG delivery trip would require the ship for some 30 days.
In order to estimate the costs associated with the other two processes, i.e. regasification and transmission, it is necessary to estimate the LNG requirements of a CCGT power plant. Presuming natural gas with a heating value of 1,050 GJ per MMCF (million cubic feet) or 50 GJ/Tonne and a 150 MW CCGT unit with a heat rate of 7.4 GJ per MWh (HHV) and an annual capacity factor of 85%, the daily and annual gas consumption of two 150 MW units would be some 43 MMCF (906 tonnes of LNG) and 15,743 MMCF (330,600 tonnes of LNG) respectively.
As per commercially available technologies, regasification of LNG could be processed via either an on-shore based LNG receiving terminal or a floating storage and regasification unit (FSRU). An on-shore terminal needs a very large amount of capital investment and could handle some 6 to 12 million tonnes of LNG per year. For this project, a small scale FSRU is adequate to deliver the required amount of natural gas which can be leased as opposed to a permanent land based facility. It is estimated that the capital cost of the FSRU will be some US$ 250 to US$ 350 million. With an assumption of 15 years of capital repayment period, 15% return requirement on capital and operation and maintenance (O&M) cost of 3% of capital investment, the annual rental and O&M cost of the FSRU will be some US$ 50 to US$ 70 million, or US$ 3.04 per GJ to US$ 4.26 per GJ.
By assuming the pipeline from the floating terminal to the CCGT power plant to be 20 km long, the unit capital cost of US$ 2.5 million per kilometre, a capital repayment period of 15 years, 15% return requirement and O&M cost of 3% capital investment, the annual capital repayment and O&M cost of the pipeline will be some US$ 10 million per year, i.e. US$ 0.61 per GJ.

The National Integrated Resource Plan Review and Update – Final Report
September 2016 Page 25 of 155
Based on the above calculations, the estimated unit cost of the natural gas will be some US$ 11.65 per GJ to US$ 12.86 per GJ. Taking into account 10% allowance for losses and other contingency factors, the unit cost will be some US$ 12.81 per GJ to US$ 14.15 per GJ. Based on this, an LNG gas price of US$ 13.5 per GJ (N$ 216 per GJ) will be used in this study.
3.4.6 Coal Price Forecast The coal prices shown in Figure 3-3 were obtained from forecasts by the EIA, WB and KPMG and are for the FAS (free alongside ship) or FOB (free on board) prices and do not include the fees and costs for internal unloading, loading and transportation. It is noted that the price from the EIA is for exported coal produced in the U.S., the WB forecast is for Australian coal and the KPMG forecast is for Australian thermal coal. It is possible that the higher EIA price has a significant portion of coking coal.
Figure 3-3: Coal Price Forecast
As can be seen from Figure 3-3 there is a wide range of prices by 2020 with forecast prices ranging from about 50 US$ per tonne to 115 US$ per tonne. It must be noted that energy prices are relative amongst themselves and this can be seen by comparing the WB forecasts for crude oil and coal. The EIA forecast appears to be quite high and its starting point is some US$ 40 per tonne higher than prevailing prices.
The NIRP Update will use an average coal price of US$ 50 per tonne for the entire period plus US$ 20 per tonne for shipping, handling (including expansion facilities at a given port) and delivery to a power plant close to a major port.

The National Integrated Resource Plan Review and Update – Final Report
September 2016 Page 26 of 155
3.4.7 Price Forecasts for Other Fuels In addition to the fuels mentioned above, the NIRP Update considers generation technologies that use other fuels such as uranium, municipal solid waste, biofuels and biomass and as such a fuel price forecast for these is needed.
There are several ways of quoting prices for uranium but the ultimate measure, like for any other fuel, is the unit price per GJ or other energy measuring unit. For the NIRP Update, it is assumed that uranium is to be priced at US$ 1.0/GJ (for each GJ of electricity output, not the energy input).
Several studies in the US and Europe have been carried out to determine the cost of collecting and delivering municipal solid waste taking account that in this case the tipping fees for normal refuse would be saved. The estimated cost of collecting and delivering the municipal solid waste to a plant using this fuel is US$ 135 per tonne in the United States. As no specific information was located for Namibia it is assumed that the cost would be half that amount in Namibia or US$ 67.5 per tonne or N$ 1,080 per tonne.
Biofuels, especially biodiesel from Jatropha, have increased in production significantly in the last decade. Presently, biodiesel is a reality in many parts of the world and large plots of land are dedicated to crops that can produce this type of fuel. In locations with suitable growing conditions it is possible to produce and bring to market biodiesel at US$ 3.0 per US gallon or US$ 0.79 per liter (N$ 12.64 per L). However, biofuels are not expected to be important in Namibia during the forecast period.
Encroacher bush has tremendous potential in Namibia to fuel small biomass plants. Given that this fuel is labor intensive and requires machinery to cut the bush and transport it to a central plant it is assumed that the bush chip feedstock would cost about N$ 850 per tonne,
3.4.8 Heat Content of Fuels and Unit Prices of Energy The previous sections have provided prices of fuels in various units. This sections converts all these prices to a common unit of which the GJ has been selected. In order to do this one requires the different values of heat content of each fuel. It was assumed that the HFO price would be 70% of the crude oil price, i.e. US$ 56/BL, including transportation, refining, handling and delivery while the LFO price would be 130% of the crude price.
Table 3-1 provides the heat content of the various fuels previously mentioned.
Table 3-1: Heat Content of Fuels (HHV)
Fuel Heat Content Unit LFO 6.22 GJ/BBL HFO 6.65 GJ/BBL Natural Gas 37.26 MJ/M3 Coal 27.91 GJ/Tonne MSW 10.00 GJ/Tonne Biofuel 33.30 MJ/Liter Biomass (Invader Bush) 16.00 GJ/Tonne
Taking into account the prices of the fuels provided in the above section and the heat content of these, the unit prices of energy are given in Table 3-2.

The National Integrated Resource Plan Review and Update – Final Report
September 2016 Page 27 of 155
Table 3-2: Unit Price of Fuels (HHV)
Fuel Fuel Price (US$/GJ) (N$/GJ) LFO 16.71 267.33 HFO 8.42 134.72 Kudu Natural Gas 10.00 160.00 NG from LNG 13.5 216.00 Coal 2.51 40.16 Uranium 1.00 16.00 MSW 6.75 108.00 Biofuel 23.72 379.52 Biomass (Encroacher Bush)
3.32 53.13
Geothermal 8.00 128.00
The National Integrated Resource Plan Review and Update – Final Report
September 2016 Page 28 of 155
4. Generation Resources and Options 4.1 Introduction
This section provides descriptions of the fuel resources and their associated power generation options which will be taken into account in the preparation of the NIRP Update. The fuel resources include both domestic and imported resources such as natural gas, LNG, coal, uranium, fuel oil, hydro, wind, solar, biomass, municipal waste, biofuels and geothermal. In order to assess the quantity of these resources and evaluate the maturity of the generation technologies using these resources at appropriate levels, generation options have been divided into the following three groups:
1. Primary options with quantified resource and commercially available and proven technologies for which the cost and timing of deploying the technology in Namibia can be quantified with reasonable confidence. These would include natural gas including LNG, coal, uranium, fuel oil, hydro, wind, solar and biomass.
2. Secondary options with quantified resource but non-mature technology. Small module nuclear reactors fall into this group.
3. Secondary options with mature technology but non-quantified resource. A few examples of these are potential sites for hydro, wind, solar, municipal solid waste, biofuels and geothermal for which no detailed studies have been completed.
4.2 Primary Generation Resources This section of the report presents a brief outline of each of the primary resources selected to meet the growing electricity demand in Namibia.
4.2.1 Coal Fired Power Generation Coal resources are available in almost every country around the world, with recoverable reserves in some 70 countries. It has been estimated that the proven coal reserves are enough to last for well in excess of 120 years at the current rates of production. In contrast, the proven oil and gas reserves are equivalent to some 50 and 60 years respectively at the current production levels.
Coal deposits in Namibia have not been commercially exploited. All coal used in the country is imported from either South Africa or other countries. Coal deposits in Namibia are stratigraphically confined to the Ecca Group of the Karoo Sequence. Coal potential exists in extensive sedimentary basins like the Owambo, Huab, Waterberg and Aranos basins. The Aranos basin has been investigated in detail for coal and contains in situ resources of about 350 million tonnes of high-quality metallurgical coal at a depth of up to 300 m, which makes it the largest known coal deposit in the country. At this time, most of these coal resources cannot be economically developed when comparing with development of coal mines in other Southern Africa countries, especially South Africa, Botswana and Mozambique. Coal resources in these Southern Africa countries are considered to be more than sufficient to supply a large power plant in Namibia over the course of its normal life.

The National Integrated Resource Plan Review and Update – Final Report
September 2016 Page 29 of 155
South Africa exports about 30% of its coal production mainly through the Richards Bay Coal Terminal, making the country one of the top coal exporting countries in the world. Coal supply to a power plant in Namibia could be secured through a long term coal supply agreement with one or more coal mines in that country or in the region. In general, regional coal mines should prove to be the most economic sources due to shorter transport routes and lower transport cost. However, this may be offset by anticipated increasing transport cost, supply risks and increasing handling costs due to political and economic instability.
Power generation using coal normally involves three major stages, coal mining, transportation of coal to the power plant and conversion of the coal into electricity. It is understood that cost reduction in any of the three stages could eventually reduce the cost of unit electricity production. When selecting a coal fired power plant site, several important factors need to be taken into account including land availability, fuel source, fuel transportation, electricity transmission, water availability, ash disposal, environmental and socio-economic impacts.
A conventional coal fired generating unit is comprised of a coal-fired boiler to convert the energy contained in the coal into heat and high pressure steam which is then used to drive a steam turbine coupled to an electricity generator. Due to its relatively high initial investment cost and technical constraints, a coal fired generating unit is normally used to supply base load in order to reduce the unit energy cost. This implies that a coal-fired generating unit should be dispatched at its highest available output most of the time in order to achieve economies of scale. As the primary fuel for electric power generation, generation technologies using coal have experienced a long development process and most of them are well established and proven.
The commonly used coal-fired power generation technologies in the modern power industry include pulverised coal (PC) combustion with/without installation of flue gas desulphurization (FGD) equipment and circulating fluidised bed (CFB) combustion, which are technically proven and have very well defined cost estimates. The PC with FGD and CFB combustion technologies would also reduce SO2 emissions. One of the main advantages of the CFB combustion against PC combustion is that the former could use a variety of fuels and does not require FGDs.
Coal is becoming more controversial due to its high level of greenhouse gas (GHG) and other emissions (if they can’t be abated in a cost effective manner) when compared to other primary energy options. The most advanced technologies for coal power generation are integrated gasification combined cycle (IGCC) and carbon capture and sequestration (CCS), which could significantly reduce emission of GHG into the atmosphere. These two technologies will of course increase the initial capital investment significantly as well as O&M cost and therefore increase the unit cost of electricity. It has been estimated that the CCS could increase the capital cost of a coal-fired power station by around 35%. As understood, construction of a CCS is subject to geographical and geological constraints and such a facility could only be built at limited locations.

The National Integrated Resource Plan Review and Update – Final Report
September 2016 Page 30 of 155
The size of a coal fired generating unit can range from 10 MW to over 1,000 MW. The typical service life of a coal fired generating unit could vary from 30 to 50 years. However, in economic and financial analysis, an economic life of 20 to 30 years is normally used. Based on the potential electric load growth over the next 20 years, the unit size of around 150 MW would be suitable for the Namibia electric system. Larger sized units could result in excessive base load generation capacity and higher operating reserve obligations as determined by SAPP. Excessive based load generation implies that internal customers could not consume all energy generated over the off-peak periods and, if the unit could not be economically curtailed or shut down during this period part of the output must be sold to the external markets at much lower prices than the average generation cost. In some cases, the base load energy prices could be negative, i.e. the generators must pay the customer to consume electricity. This situation has already occurred in some electricity markets.
The higher operating reserve obligations (due to larger unit size) means that the Namibian electric system must operate and maintain other units to provide spinning reserve and quick start reserve which normally have high incremental generation cost. The Namibian electric system operator can, of course, purchase a certain amount of spinning and quick reserves from other SAPP countries depending on the SAPP rules.
The lead time to develop the 150 MW coal generating unit could be six to seven years if a standard (or off-the-shelf) technology is selected, which includes scoping study, feasibility study, environmental impact assessment, tendering documents, EPC (engineering, procurement and construction) documentation and bid evaluation, negotiation of financing and financial closing, construction and commissioning. Larger sized units, new technologies or sea water cooling may have a longer lead time. Fast tracking could of course reduce the lead time considerably especially if some of the steps outlined above are bypassed by using balance sheet financing and carrying out some of the steps on a concurrent basis.
In Namibia, the existing Van Eck coal fired power station located in Windhoek uses coal imported mainly from South Africa. This plant has been used as standby over the last several years due to environmental constraints, high coal transportation cost, low efficiency and low cost of power imports from other SAPP countries.
A scoping study for development of a coal fired power plant in Namibia was completed a few years ago and the plant could be located in the Erongo Region and is often referred to as the Erongo Coal Power Plant. Such a plant would first be constructed with two 150 MW units and could be expanded with more units up to a total capacity of 800 MW when required.
For the NIRP Update study, the candidate coal-fired power plant with a unit size of 150 MW using either CFB or PC technology has been selected as it fits well with system demand requirements for the near future. The following is a short description of the factors for a standard CFB power plant and a PC power plant without installation of FGD equipment and explanations to the parameters presented in Table 4-1:
1. The CFB and PC technologies for the 150 MW unit size have been utilised in many power plants around the world and are commercially available and technically proven.
The National Integrated Resource Plan Review and Update – Final Report
September 2016 Page 31 of 155
2. For the Erongo Coal Power Plant, CFB combustion was recommended against the PC combustion due to the fact that the CFB could use a variety of fuels including encroacher bush which is available in Namibia, have a minimum loading requirement as low as some 35% of its full output and remove most sulphur in the coal during the combustion. The low minimum loading requirement of the CFB technology could have advantages to the Namibian electric system.
3. Due to environmental and social issues including community opposition, with a coastal location, an inland site was selected.
4. The coal required by the plant could be supplied from Richards Bay, South Africa as both resources and infrastructure are in place at that location. The coal could also be imported from Mozambique and Botswana if necessary. Part of the required coal could also be substituted by locally harvested encroacher bush.
5. With a total net capacity of 300 MW for the first phase, the annual coal consumption has been estimated at some 1 million tonnes. The current unloading facilities at Walvis Bay harbor and rail transport of the coal to the coal power plant site would need moderate upgrades and investments.
6. The fuel price used in the study is the price for fuel to be delivered to the plant site, i.e. including all transportation and handling costs.
7. Several alternatives had been investigated for the plant cooling technology in the scoping study of the Erongo coal power plant, of which a dry air-cooled condenser had been identified as the optimum solution. Its main advantages are the low water consumption, low investment cost and ease of operation.
8. A list of potential EPC contractors had been identified in the Erongo power plant scoping study. Most of them are from India, China and Korea and only one is from Japan. It is noted that the EPC bidding prices from these contractors could be much lower than those from Western economies based contractors.
9. The lead time would be some six to seven years, including scoping study, feasibility study, EPC contract document preparation as well as tendering and awarding, financing closure, construction and commissioning. A fast track approach could be used to shorten the lead time to 4 years.
10. It is expected that the equivalent availability of a unit would be around 85%, which is based on the information available in the NERC database. Its capacity factor could, therefore, only be up to this value as the unit might not produce at its full capacity all the time due to various reasons such as low load demand, contribution to spinning reserve obligation, etc.
11. The EPC costs for CFB and PC technologies have been estimated at US$ 1,700 (N$ 27,200) per net unit capacity (kW) and US$ 1,500 (N$ 24,000) respectively, which do not include interconnection costs.
12. Owner’s cost has been estimated at 10% of the total EPC cost.

The National Integrated Resource Plan Review and Update – Final Report
September 2016 Page 32 of 155
13. The construction time for a 150 MW coal fired plant would be some three years, with a cash disbursement of 30%, 40% and 30% in year 1 to year 3 of construction respectively. In order to align the capital expenditure to the in-service date, the base discount rate is used to calculate the interest during construction (IDC).
14. 1.5% of the sum of EPC, owner’s cost and IDC is assumed to be the financing charges including commitment fees.
15. 2% of the sum of EPC, owner’s cost and IDC is assumed to be the decommissioning costs, which is allocated at the beginning of the unit’s operation.
16. Fixed O&M cost was calculated based on 3% of the unit’s total capitalised cost, including insurance.
17. Variable O&M cost was assumed as N$ 400 per MWh.
18. Emission rates of CO2, NOx, SO2 and particulate matter are the uncontrolled factors calculated based on the parameters for CFB, PC and ESP (electrostatic precipitator), collected from the U.S. EIA and EPA. The SO2 emission factor was calculated based on 1% sulphur coal. The PC combustion option will have higher emission factors of NOx and SO2.
4.2.2 Natural Gas Including LNG Fueled Power Generation Natural gas is a naturally occurring hydrocarbon gas mixture consisting primarily of methane, with up to 20 percent concentration of other hydrocarbons (usually ethane) as well as small amounts of impurities such as carbon dioxide. Natural gas is widely used and is an important energy source in many applications including heating buildings, generating electricity, providing heat and power to industry and vehicles and is also a feedstock in the manufacture of products such as fertilizers.
Natural gas is commercially extracted from oil fields and natural gas fields. Gas extracted from oil wells is called casing head gas or associated gas. The natural gas industry is extracting gas from increasingly more challenging resource types: sour gas, tight gas, shale gas, and coal bed methane.
Total world proven natural gas reserves, as of October 2015, were more than 200 trillion cubic meters (TCM; or 7063 trillion cubic feet - TCF)2. At current production rates, which was estimated at 3.2 trillion cubic meters per year, this would last more than 60 years. Reserves have grown about 2% per year. With production also growing, the reserve-to-production ratio has stayed within the range of 58 to 68 years since 1985. The top four countries with the largest reserves are Russia (48.7 TCM), Iran (33.6 TCM), Qatar (24.7 TCM) and Turkmenistan (17.5 TCM).
2 List of countries by natural gas proven reserves - Wikipedia, the free encyclopaedia

The National Integrated Resource Plan Review and Update – Final Report
September 2016 Page 33 of 155
The efficient and effective movement of natural gas from producing regions to consumption regions requires an extensive and elaborate transportation system. In many instances, natural gas produced from a particular well will have to travel a great distance to reach its point of use. The transportation system for natural gas consists of a complex network of pipelines, designed to quickly and efficiently transport natural gas from its origin to areas of high natural gas demand. Transportation of natural gas is closely linked to its storage. Should the natural gas being transported not be immediately required, it can be put into storage facilities for use when it is needed.
Because of its low density, it is not easy to store natural gas or transport it by vehicle. Natural gas pipelines are impractical across oceans. In these cases, gas can be turned into liquid at a liquefaction plant, and is returned to gas form at a regasification plant at the terminal. Ship borne regasification equipment can also be used. LNG carriers transport LNG across oceans, while tank trucks can carry liquefied or compressed natural gas (CNG) over shorter distances. Sea transport using CNG carrier ships that are now under development may be competitive with LNG transport in specific conditions. As per the industrial practice, LNG is the preferred form for long distance, high volume transportation of natural gas, whereas pipeline is preferred for transport for distances up to 4,000 km over land and approximately half that distance offshore.
The global LNG trade in 2013 was at 236.8 MT (million tonnes), slightly below the peak of 241.5 MT reached in 2012. There are several operational liquefaction plants in African countries including Algeria, Angola, Egypt, Equatorial Guinea, Libya and Nigeria.
In Namibia, the Kudu gas field is situated approximately 170 km off-shore to the south-west of the city of Oranjemund in the south western corner of Namibia. The gas field is located about 4.5 km underground and would require an under-sea pipeline to reach the shore. Water depth at the site is around 170 meters.
The Kudu offshore gas field, discovered in 1974, is estimated to contain 1.3 trillion cubic feet (37 billion cubic meters) of proven natural gas reserves. However more recent exploration and analysis suggests that reserves could reach 3 trillion cubic feet (85 billion cubic meters) with a potential much higher than the suggested reserves.
The gas from the Kudu gas field is a sweet gas requiring little cleaning and processing and is available at a certain pressure and temperature. At the present time it is envisaged that the gas would be processed on a floating plant system (FPS) to be contained in a permanently moored large ship and from the FPS an undersea 170 km long pipeline would be constructed to bring the gas to Namibian soil at Uubvlei (close to Oranjemund) where it would be used to supply a 900 MW power plant.
The National Integrated Resource Plan Review and Update – Final Report
September 2016 Page 34 of 155
Various gas turbine technologies have been developed and used around the world by using natural gas or light fuel oil to generate electricity. In this case, instead of heating steam to turn a turbine, hot gases from combusting fossil fuels are used to turn the turbine and generate electricity. Gas turbine plants are traditionally used primarily for meeting peak-load demands, as it is possible to quickly and easily turn them on. These plants have increased in popularity due to advances in technology and the availability of natural gas. Gas turbines can be combined with a steam turbine to form a combined cycle unit. In combined-cycle plants, the waste heat from the gas-turbine process is directed toward a heat recovery steam generator (HRSG) which in turn supplies steam to a steam turbine to turn an electric generator. Because of this efficient use of the heat energy released from the natural gas, combined-cycle plants are much more efficient than steam units or gas turbines alone.
The size of a single gas turbine could range from a few MW to some 500 MW. Selection of the single unit/plant size is determined by several important factors such as system operating reserve, system regulations, generation adequacy, plant/load locations, load magnitude and its variability, fuel availability, and cost and transmission/distribution access. For the NIRP Update study, the net sizes selected for CCGTs are 150 MW and 450 MW (as per the information obtained from the Kudu Gas Power Project) and the net sizes for GTs are 50 (the proposals received for LNG based power plants have included several 50 MW units) and 100 MW. In the case of a 450 MW unit, it is expected that there would be one GT, rated at some 300 MW and one steam turbine rated at 150 MW (the current plant design of the Kudu Gas Power Project). It is noted that two 450 MW units were recommended by the Kudu Gas-to-Power Project Study although this size is quite large for the Namibia electric system and it would increase the Namibia system’s operating reserve obligation, which at present stands at 35.6 MW (17.8 MW of spinning reserve plus 17.8 MW of quick start reserve).
Based on the Kudu Gas-to-Power Project Study, the power station near Oranjemund is being designed for a 884 MW net capacity, approximately one half of which (442 MW) would be consumed by Namibia customers and the rest would be sold to utilities outside Namibia through long term power sale contracts. The total amount of gas available to the Kudu project is contractually limited to 584 PJ (petajoule). This amount of available gas is insufficient for continuous year round operation of the Kudu power plant at its full capacity over the power plant life. It has been estimated that the 584 PJ could fuel the power plant for 15 years.
Studies have determined that the power station and an 18 inch gas pipeline from the gas field to the power station would be designed and constructed in such a way that the power station could be operated in a more flexible manner targeting mid merit/peak periods. The current proposal is for the power plant to supply mid-merit and peaking load in Namibia and base load in outside markets. The additional cost in the design of Kudu power plant and the pipeline for creating operating reserves for mid merit/peaking may not be significant relative to the benefits of operational flexibility, risk management and potential commercial advantages. The operational flexibility is particularly valuable to NamPower as its other major supply option is the run-of-the-river Ruacana hydro power station. Ruacana cannot run at its full capacity for a large part of a year due to low water inflow and limited storage capacity.

The National Integrated Resource Plan Review and Update – Final Report
September 2016 Page 35 of 155
In this study, two sizes for each of CCGT and GT candidates are taken into account in development of generation expansion sequences. The CCGT sizes are 150 MW and 450 MW while the GT sizes are 50 MW and 100 MW. The following is a short description of the factors for the selected CCGT and GT sizes and explanations to the parameters presented in Table 4-2:
1. The CCGT and GT technologies for the selected size ranges are technically proven and commercially available and have been widely used in electric power generation around the world.
2. The CCGTs and GTs could be fueled by either Kudu natural gas or imported LNG. In the case of Kudu gas, a pipeline from the gas field would be required while in the case of LNG, LNG would be shipped from the LNG production countries and then be re-gasified in Namibia using a FSRU. It is important to note that all natural gas prices are assumed to be the delivered prices to a plant.
3. The infrastructure for natural gas transportation and/or regasification is at present not in place. This may take a relatively long time to build and need government support to bring this on line.
4. It is expected most EPC contractors for a CCGT or GT plant would come from India, China and Korea and the EPC bidding prices from these contractors would be lower than those estimated using the developed economy standard. However, the major equipment for a plant could still be procured from the manufacturers located in the developed economy countries.
5. The lead time for a CCGT plant could be some five to six years while it could be one year shorter for a GT plant, including scoping study, feasibility study, EPC contract document preparation as well as tendering and awarding, financing closure, construction and commissioning. Given the studies already carried out, the progress made to date in project structuring and the status of the negotiations with the upstream developer or IPP, the lead time for Kudu power project would be three and a half to four years.
6. It is expected that the equivalent availability of a plant would be from 87% to 90%, based on the information from the NERC database. Its capacity factor could, therefore, be only up to this range as the plant might not produce at its full capacity at all times due to various reasons such as low load demand, contribution to spinning reserve obligation, etc.
7. Supply of natural gas or LNG could be arranged through a take-or-pay contract. This means that the monthly payment would be fixed no matter if the fuel would be consumed by the power plant.
8. The EPC costs for CCGT 450 MW, CCGT 150 MW, GT 50 MW GT 100 MW have been estimated at US$ 800 (N$12,800) per net unit capacity (kW), US$ 850 (N$ 13,600), US$ 700 (N$ 11,200) and US$ 650 (N$ 10,400) respectively.
9. Owner’s cost has been estimated at 10% of the total EPC cost.

The National Integrated Resource Plan Review and Update – Final Report
September 2016 Page 36 of 155
10. The construction time for a CCGT unit would be some three years, with a cash disbursement of 30%, 40% and 30% for year 1 to year 3 respectively, while the construction time for a GT unit is two years with a cash disbursement of 60% and 40%. In order to align the capital expenditure to the in-service year, the base discount rate is used to calculate the interest during construction (IDC).
11. 1.5% of the sum of EPC, owner’s cost and IDC is assumed to be the financing charges including commitment fees.
12. 2% of the sum of EPC, owner’s cost and IDC is assumed to be the decommissioning costs, which is allocated at the beginning of the unit’s operation.
13. Fixed operation & maintenance (O&M) cost (including insurance) was calculated based on 3% of the unit’s EPC cost.
14. Variable O&M cost was assumed at N$ 240/MWh.
15. Emission rates of CO2, NOx, SO2 and particulate matter are the uncontrolled factors calculated based on the factors collected from the US EIA and EPA. It is expected the current CCGT and GT technologies would reduce the NOx by 90%. The SO2 emission factor was calculated based on 1% sulphur natural gas.
4.2.3 Fuel Oil Fired Power Generation The total proven oil reserves in the world were estimated at some 1.48 trillion barrels in September 20133. The three countries with most oil reserves around the world are Venezuela with 298 billion barrels, Saudi Arabia with 268 billion barrels and Canada with 174 billion barrels.
Because the geology of the subsurface cannot be examined directly, indirect techniques must be used to estimate the size and recoverability of the resource. While new technologies have increased the accuracy of these techniques, significant uncertainties still remain. In general, most early estimates of the reserves of an oil field are conservative and tend to grow with time; many oil-producing nations do not reveal their reservoir engineering field data and instead provide unaudited claims for their oil reserves.
Future reserves growth will depend, to a large extent, on increases in the recovery factor, which is estimated to average about 35% worldwide today. Such increases, through secondary and enhanced oil recovery techniques and other factors, could make a big difference to recoverable reserves, prolonging the production life of producing fields and postponing the peak of conventional oil production.
There are ongoing oil exploration activities both off shore and on shore in Namibia. It appears that the geological formations off the coast of Namibia are very similar to those of pre-salt fields in Brazil and thus the prospects of finding commercial exploitable oil resources are very attractive.
3 List of countries by proven oil reserves - Wikipedia, the free encyclopaedia

The National Integrated Resource Plan Review and Update – Final Report
September 2016 Page 37 of 155
Crude oil is extracted from oilfields located on land or offshore and is then converted to more refined products in large oil refineries. Several petroleum products emerge from the refining process including gasoline, diesel oil, heavy fuel oil (or Bunker C) and with today’s new cracking processes petcoke. Most of the liquid petroleum products can be used to generate electricity by using a variety of technologies. Four main technologies are used to convert petroleum products (including both light fuel oil (LFO) and heavy fuel oil (HFO) into electricity:
1. Conventional steam – HFO or Petcoke is burned to heat water to obtain steam to drive a turbine which in turn drives an electrical generator.
2. Combustion turbine – LFO is combusted under pressure to produce hot exhaust gases, which spin a turbine to generate electricity.
3. Combined-cycle technology – LFO is first combusted in a combustion turbine and then the exhaust gases of the turbine are fed to a HRSG which produces steam that is used to drive a steam turbine and subsequently an electrical generator.
4. Internal Combustion Reciprocating Engines – these engines use combustion of a fuel (LFO or HFO) to push a piston within a cylinder that turns a crankshaft to generate electricity. Reciprocating engines that use compression ignition (these are often referred to as diesel engines) are the most common for power generation. These are referred to as ICREs in this report to avoid confusion with diesel fuel.
Conventional steam technology using HFO was not considered as a candidate generation alternative because other technologies are more economic. The use of Petcoke was not considered for use on conventional steam technology due to serious environmental considerations as well as emissions associated with this fuel. This fuel appears to be more commonly used when blended with coal.
ICREs can use a variety of fuels including light fuel oil (LFO) (diesel oil or No. 2), HFO (No. 6) of various degrees of viscosity and a variety of biofuels (biodiesel and fats). There are 3 principal types of ICREs; high speed, medium speed and low speed. Each offers its advantages and comes in different sizes. For large amounts of power production it appears that the most commonly used engine is the medium speed with some installations using low speed engines. The largest ICRE used for electricity generation to date has a capacity of about 83 MW.
For the NIRP Update, 20 MW medium speed ICRE generators operating on HFO will be considered as well as the LFO fueled 150 MW CCGTs, 50 MW GTs and 100 MW GTs. ICREs used in large electrical generators run at approximately 400 to 800 rpm and are optimised to run at a set synchronous speed depending on the generation frequency (50 or 60 hertz) and provide a rapid response to load changes. The largest ICREs in production are in sizes of up to approximately 20 MW supplied by companies like MAN B&W, Wärtsilä, and Rolls-Royce. Most ICRE engines produced are four-stroke machines, however there are some two-stroke ICREs manufactured by others.
The parameters presented in Table 4-3 for CCGT and GT technologies are similar to those given in Table 4-2, except for heat rate, fuel cost and emission factors. Therefore the following presents only the descriptions and explanations to the differences:
The National Integrated Resource Plan Review and Update – Final Report
September 2016 Page 38 of 155
1. The ICRE, CCGT and GT technologies using fuel oil for the selected size ranges are technically proven and commercially available and have been widely used in electric power generation around the world.
2. The cost for infrastructure required for fuel oil transportation is included in the estimated fuel cost.
3. It was assumed that the EPC contract would be awarded to contractors from the developing economy countries. The bidding prices of the bidders from the developing economy countries would be lower than those estimated using the developed economy standard. The major equipment for a plant could still be procured from the manufacturers located in the developed economy countries.
4. It is expected that the equivalent availability of an ICRE, CCGT and GT would be some 90%, 87% and 90% respectively based on the information from the NERC database. Their capacity factors could, therefore, be only up to these values as the plant might not produce at its full capacity at all times due to various reasons such as low load demand, contribution to spinning reserve obligation, etc.
5. The EPC costs for ICRE 20 MW, CCGT 150 MW, GT 50 MW and GT 100 MW have been estimated at US$ 1,100 (N$ 17,600) per net unit capacity (kW), US$ 850 (N$ 13,600), US $700 (N$ 11,200) and US$ 650 (N$ 10,400) respectively.
6. The construction time for an ICRE would be some two years with a cash disbursement of 60% and 40%. In order to align the capital expenditure to the in-service date, the base discount rate is used to calculate the interest during construction (IDC).
7. Variable O&M cost was assumed as N$ 240 per MWh for ICREs, CCGTs and GTs.
8. Emission factors of CO2 and NOx were calculated based on the information obtained from the EIA and EPA. It is recognised that the emission factors for GT and CCGT using LFO would be different from those using natural gas.
4.2.4 Nuclear Power Generation It is estimated that some 5.4 million metric tonnes of uranium ore reserves are economically viable around the world4 while 35 million metric tonnes are classified as mineral resources (reasonable prospects for eventual economic extraction). The worldwide production of uranium in 2014 amounted to 56,252 metric tonnes, of which more than 40% was mined in Kazakhstan. The five next most important uranium mining countries are Canada (16.2%), Australia (8.8%), Niger (7.2%), Namibia (5.8%) and Russia (5.3%). This shows Namibia the fifth largest producer of uranium ore in the world. It is noted that a number of new uranium mining licenses have been issued by the MME which are expected to increase Namibia’s annual uranium output from 2016, notably from the Husab Mine.
4 List of countries by uranium reserves - Wikipedia, the free encyclopaedia

The National Integrated Resource Plan Review and Update – Final Report
September 2016 Page 39 of 155
Uranium ore is mined in several ways, open pit, underground, in-situ leaching, and borehole mining. Commercial-grade uranium can be produced through the reduction of uranium halides with alkali or alkaline earth metals. Uranium metal can also be prepared through electrolysis of KU5 or UF4, dissolved in molten calcium chloride (CaCl2) and sodium chloride (NaCl) solution. Very pure uranium is produced through the thermal decomposition of uranium halides on a hot filament.
As nuclear power generation has become established since the 1950s, the size of reactor units has grown from 60 MW to some 1,600 MW, with corresponding economies of scale in operation. At the same time there have been many smaller power reactors built both for naval use and as neutron sources, yielding enormous expertise in the engineering of small units. As per the definitions from the International Atomic Energy Agency (IAEA), the generating units are divided in three size groups. The “small” group includes those units less than 300 MW, the “medium” group is for those between 300 and 700 MW and the “large” group has the unit size over 700 MW. The last two groups include most operational units from the 20th century. The most common types of nuclear power plants include pressurised water reactor (PWR), boiling water reactor (BWR), gas cooled reactor (GCR) and advanced gas cooled reactor (AGR), light water cooled graphite moderated reactor (LWGR), and pressurised heavy water moderated reactor (PHWR).
As per the information collected from the World Nuclear Association (WNA), there are at present some 439 operable reactors producing electricity for power grids with a total net capacity of 382,248 MW, 64 reactors under construction with a total gross capacity of 67,797 MW, 159 planned reactors with a total gross capacity of 180,015 MW and 329 proposed reactors with a total gross capacity of 374,020 MW. Based on the information collected from the IAEA, the gross unit size of the operable reactors ranges from 12 MW located in Russia to 1,561 MW located in France. Except for the four smallest units, each at 12 MW, and one 25 MW reactor in China, the next smallest sizes are in the 200 MW to 300 MW range, which are located in Argentina, Armenia, China, India, Japan, Pakistan, Russia, Switzerland, United Kingdom and Ukraine. India alone has 17 reactors with net capacity ranging from some 150 MW to 200 MW, 15 of which belong to the PHWR type and the other two are the BWR type. Most of these generators have been in operation for quite some time and apart from those in India no recent medium size generators have been built.
As per international practice, nuclear power generation is relatively expensive and requires a good national technological base and well trained human resources to operate and maintain such power plants. In deciding if and when a nuclear power plant should be constructed in Namibia, a number of factors such as those listed below must first be taken into account:
1. Grid load demand including export. It is noted that from both economic and technical aspects, nuclear power units should be dispatched to supply base load although advanced technologies could allow a nuclear power unit to have relatively flexible output. The appropriate time to build a nuclear power unit is when the system off-peak load could consume all the unit output. At present, almost all small reactor technologies have not been licensed and approved by relevant authorities as they are for naval use and as neutron sources, for which economics are normally not an important factor in the decision making process.

The National Integrated Resource Plan Review and Update – Final Report
September 2016 Page 40 of 155
2. Establishment of an effective national nuclear regulatory authority in Namibia which formulates policies, develops regulations governing nuclear reactors and nuclear material safety, issues orders to licensees, and adjudicates legal matters. It is expected that from establishment of an effective national nuclear regulatory authority the licensing of reactors could take at least seven to ten years. The establishment of a nuclear regulatory commission can also take quite a few years as expertise has to be gathered to be part of such body.
3. Selection of potential power plant site(s) and conduct of site environmental and social impact assessment. In the advanced economy, such assessment for a nuclear power plant could take from five to ten years. It is our understanding that pressure groups are already in place in Namibia and are trying to sway popular opinion.
4. Financing has to be obtained regardless of the intended ownership, private, public or private public partnership. This could be a long and difficult road especially for investors outside Namibia and would require full GRN back up, support and participation especially with guarantees.
5. Construction of a nuclear power generating unit is likely to exceed five years after environmental and required approvals.
6. A nuclear power plant should have access to water and other infrastructure as it requires very large amounts of water for cooling.
7. The output from a nuclear power plant should be evacuated through reliable transmission lines without interruptions in order to minimize the risk of overheating. A nuclear power plant is normally connected to several transmission lines to obtain the desired redundancy. In order to avoid a bottleneck and other operational issues, these transmission lines would have to be connected to a strong point in the grid with several evacuating routes.
8. Maintenance and operation of a nuclear power plant requires considerable technical expertise and a technology base in order to be able to supply the specialist skills and products to a nuclear power station, to which Namibia has never been exposed and may need to import at considerable costs in the initial years of operation.
9. Unless the company operating the nuclear power station also operates a uranium mine and a uranium processing plant, the company will have to import the enriched uranium for electric power generation from the international market and thus pay the international price. This is a factor that needs to be considered by investors.
10. In most jurisdictions, nuclear power generation option requires considerable government interventions with regards to stipulations contained in international conventions, safety regulations, funding and technical facilitations, identification of countries from where safe and proven technologies and initial human expertise can be sourced, as well as establishment of a plan to train more Namibians in nuclear physics and nuclear engineering.

The National Integrated Resource Plan Review and Update – Final Report
September 2016 Page 41 of 155
11. The Government should also play a sustainable role in negotiating power purchase agreements with countries within the region or within the SAPP. Regional cooperation is required as the generation capacity of even a small nuclear power plant may exceed Namibia’s ability to absorb the full generation capacity.
12. It is noted that after Japan’s Fukushima nuclear disaster caused by the 8.9 magnitude earthquake on March 11, 2011, Germany has permanently shut down eight of its seventeen reactors and pledged to close the rest by the end of 2022. A couple of countries have banned the construction of new reactors. Several countries have called for a reduction in their reliance on nuclear power. As of 2013, there are more than 10 countries remaining opposed to nuclear power, including Australia, Austria, Denmark, Greece, Ireland and Italy while other countries such as Canada are continuing to invest in nuclear power plants.
13. Consideration and/or programs for radioactive waste handling and final disposition including for spent fuels.
In this study, parameters for two reactor sizes, 200 MW and 600 MW are estimated and shown in Table 4-4. The following is a short description of the factors for 200 MW and 600 MW nuclear power plants and explanations to the parameters presented:
1. The nuclear technologies for the selected size ranges are technically proven and commercially available but have not been widely used in the recent past and may require redesign to incorporate the latest technological advances.
2. Unlike the EPC contract for coal, gas and fuel oil fired technologies, it is strongly recommended that the first nuclear plant should be built by a highly experienced contractor from the developed economy countries with proven nuclear power technologies but at the present time there are only a very limited number of such contractors.
3. The lead time for a nuclear plant could be fifteen or more years. Taking into account the fact that the country does not have a nuclear regulatory commission in place, and there are no licensed reactors for the sizes considered, the total lead time for the first nuclear unit in Namibia should be at least 20 years.
4. It is expected that the equivalent availability of a nuclear plant would be around 85%, based on the information from the NERC database. Its capacity factor could, therefore, be only up to this number as the plant might not produce at its full capacity at all times due to various reasons such as low load demand, contribution to spinning reserve obligation, etc.
5. The EPC costs for 200 MW and 600 MW plants have been estimated at US$ 8,000 (N$ 128,000) per net unit capacity (kW), and US$ 7,000 (N$ 112,000).
6. Owner’s cost has been estimated at 5% of the total EPC cost.
7. The construction time for a nuclear unit would be some six years, with a cash disbursement of 10%, 15%, 20%, 25%, 20% and 10%. In order to align the capital expenditure to the in-service date, the base discount rate is used to calculate the interest during construction (IDC).

The National Integrated Resource Plan Review and Update – Final Report
September 2016 Page 42 of 155
8. 0.5% of the sum of EPC, owner’s cost and IDC is assumed to be the financing charges including commitment fees.
9. 2% of the sum of EPC, owner’s cost and IDC is assumed to be the decommissioning costs, which is allocated at the beginning of the unit’s operation.
10. Fixed O&M cost was calculated based on 1.5% of the unit’s total capitalised cost.
11. Variable O&M cost was assumed as N$ 160 and N$ 128 per MWh for the 200 MW and 600 MW units respectively.
4.2.5 Hydro Electric Power Generation The 2007 Survey of Energy Resources published by the World Energy Council indicates that Namibia’s only perennial rivers are the Kunene, Okavango (forming borders with Angola and Zambia in the north) and the Orange River bordering South Africa in the south. It appears that any plans to develop hydro power are subject to lengthy bilateral negotiations. Another problem leading to limited exploitation of hydro resources is the scarcity of rain and the extensive droughts.
Namibia’s hydropower resources have been mapped and studied in the past. It was estimated, in 1992, that Namibia’s gross theoretical hydropower potential would be approximately 9,000 GWh per year. In 1990, it was assessed that the country’s technically and economically feasible potential would be approximately 8,645 GWh per year. The Kunene River, a shared river with Angola, has a hydropower potential of 1,600 MW and was studied in depth during the 1990’s. The potential large-scale hydropower projects identified for further study were the Epupa and Baynes schemes, and were studied in detail at feasibility level in 1997. Both these schemes were originally envisaged as 360 MW plants aimed at ensuring security of base load supply for Namibia. The study found both schemes to be financially viable with Epupa having some negative environmental impacts but being self-sufficient as far as water reservoir capacity is concerned, conversely the environmental impact of the Baynes option was much more acceptable but it relied heavily on the regulation of water to be released from the Gove Dam situated deep inside Angola. The project was shelved and NamPower, in dire need of electricity supply, opted to build a 400 kV power line connecting Namibia to South Africa which facilitated the import of inexpensive electricity from South Africa to Namibia.
A reasonable amount of study work has been done in Namibia with regard to the development of small hydro power plants. Small hydro potential can be found mostly on the Okavango and Orange Rivers, since the Kunene is situated in a remote area. The waters of the Orange River are dedicated to irrigation projects and mining activities.
It was reported that Namibia had developed a hydro power Master Plan for the country but this has not been made available for review. A study on all perennial rivers had been performed. The aim of the study was to identify and estimate cost and production for all potential hydro power projects on the Lower Kunene, Okavango and Lower Orange rivers.

The National Integrated Resource Plan Review and Update – Final Report
September 2016 Page 43 of 155
Baynes Hydroelectric Power Plant
The Baynes hydro project on the Kunene River was first considered in 1997 after plans to build the scheme east of Namibia’s Epupa Falls received fierce opposition due to concerns regarding the impact on the environment and on the nomadic community in northern Namibia. After carefully considering all options, the Namibian and Angolan governments decided to give the green light for the Baynes development to be studied. This change came about mainly because of the following two factors:
• The changed peace situation inside Angola which made it possible for the Angolans to rehabilitate the damaged Gove Dam inside Angola and to regulate the river flow from the dam which is of vital importance for the success of the Baynes Hydropower development.
• The 400 kV interconnecting power line between South Africa and Namibia that can provide a long-term capacity opportunity for regional power trading.
The potential duty cycle of a Kunene hydropower plant therefore needs to be revisited, particularly as potential exports from Namibia would primarily be targeting peaking and mid-merit opportunities in the Southern African market. Designed for peaking and mid-merit operations, a Kunene power plant at Baynes could potentially provide about 600 MW of additional peaking generation capacity.
It needs to be mentioned that present and future hydropower developments in the Lower Kunene River would benefit considerably from the completion of two initiatives in the Upper Kunene River inside Angola, i.e. further repair of the Gove Dam and the completion of the Calueque Dam. Both these initiatives would improve the upstream flow-regulation of the Kunene River and enhance the performance and cost-competitiveness of a Kunene hydropower plant.
The exploration and exploitation of hydropower developments on a river shared by two countries requires considerable intervention from the concerned governments. In this case, the Namibian and the Angolan Governments were closely involved in laying the foundation for a considerable cross-border investment. Good cooperation between these two governments must continue for the Kunene hydropower plant(s) to be realised. The project also requires considerable regional collaboration on securing the constant flow of water from the hinterland, on bilateral power purchasing arrangements and on joint operations and maintenance programs. The clarification of existing documents regarding water rights for both countries is essential to the development of any hydroelectric project on the Kunene.
The technical and economic feasibility study of the Baynes Hydro Power Plant was completed by a consultant retained by the Joint Permanent Technical Committee of Angola and Namibia for the Kunene River Basin a couple of years ago. The study included three phases. The first phase consisted of review of the previous studies, field inspection and critical assessment of the existing data for next two phases. Phase 2 was characterised by preliminary engineering studies, pre-dimensioning, modeling, energy economic and financial analysis, analysis of alternatives and selection of the most attractive solution. The last phase, i.e. Phase 3 was focused on the improvement of energy, motorization and reservoir depletion, as well as the breakdown of the general arrangement and structure of the plant. The main characteristics of the proposed hydro plant would be as follows:
1. The coordinates of the hydro plant location will be 17002’44” S and 12053’22”E.

The National Integrated Resource Plan Review and Update – Final Report
September 2016 Page 44 of 155
2. A total of five units with a net maximum generating capacity of some 600 MW.
3. The live storage of the upstream reservoir would have a capacity of approximately 1,300 million cubic meters, which could provide water to the station at its full output for more than 800 hours.
4. The total EPC cost for the plant was estimated about US$ 1.4 billion, i.e. US$ 2,330 (N$ 37,280) per kW of net capacity.
5. The expected annual generation under the average hydrologic condition (50% of exceedance probability) would be some 1,610 GWh, i.e. an annual capacity factor of approximately 30%. Comparing with other hydroelectric plants built in the world, this value is relatively low. This means that the unit energy cost of the hydro station would be relatively high.
It is expected that with appropriate methods of inflow forecasting, the reservoir would be filled up during wet season (summer) and then be discharged during dry season (winter). The monthly energy output over the dry season could be maintained at reasonable levels as per system load demands.
The studies for the 600 MW Baynes hydroelectric plant did not take into account the power evacuation from the plant to the Namibian and Angolan systems. The costs associated with the power evacuation could be considerable and an order of magnitude estimate is provided in another section of this report. Conversations with NamPower indicate that the preferred evacuation route would be to build two 400 kV transmission lines from the plant to a new substation just south of the Ruacana plant and convert the output of Ruacana to 400 kV (from 330 kV) and convert the existing 520 km long 330 kV transmission line from Ruacana to Omburu to 400 kV operation. In addition, there would be another 400 kV from just south of Ruacana to Otjikoto and transmission lines to Angola. There are some issues with this concept in that the Angolan representatives have expressed their desire to be supplied directly from the power plant and the other large issue is that the conversion of the existing 330 kV transmission line from Ruacana to Omburu to 400 kV operation could be problematic. Thus the evacuation of power to the final consumers could become quite expensive.
As Baynes HPP would be on the same river system as Ruacana HPP, it could be a serious concern for having a very large portion of the country’s generation capacity dependent on the water flow on a single river.
Okavango River Hydro Electric Power Generation
In May 2004, NamPower commissioned a prefeasibility study on the viability of a 20 MW hydroelectric plant to be located on the Okavango River in the vicinity of Popa Falls. This development would be a run-of-the-river project and would be connected to the NamPower grid via a 200 km long 132 kV power line. The pre-feasibility study has shown the project to be viable but there are still some environmental issues that need to be resolved such as avoiding the entrapment of sediment in the dam basin, before the development may go ahead. The development plan was rejected by NamPower due to the following main reasons:
1. Concerns over possible damage to the Okavango Delta, located downstream from the falls in neighboring Botswana. The costs of environmental management of the project would be very high.

The National Integrated Resource Plan Review and Update – Final Report
September 2016 Page 45 of 155
2. The power output will be only 20 MW.
3. The hydro matrix turbines were found to be not ideal for the purpose for which they were proposed. Bulb turbines could be used as an alternative.
4. Heavy financial commitments to develop the Kudu gas project.
However, NamPower has not ruled out the possibility of this proposal being revisited at some future date. The Namibian Government could actively assist in obtaining funding on concessionary conditions. The Namibian Government’s role in this project is limited to ensuring that environmental concerns are addressed and that the resource, set in a prime tourism area, is used in the best interest of Namibia.
Lower Orange River Hydroelectric Power Station
The Orange River catchment area is divided into three catchment subdivisions: the upper, middle and lower catchment areas. Clackson Power Company (Pty) Ltd (“Clackson Power”) together with NamPower have been pursuing the possibility of developing several distributed hydro-electric power stations which would be situated in the lower Orange River catchment, more specifically between the Fish River junction to the west and the Molopo River junction to the east. It would begin slightly upstream of the Onseepkans settlement and end just after the Vioolsdrift Weir. The Lower Orange Hydro Electric Power Stations (LOHEPS) project consists of the development of up to 9 small hydro-electric power stations, varying in size from 6 MW to 12 MW with an anticipated total installed capacity of some 100 MW. The potential annual output from these hydro stations would be as much as some 650 GWh. The concept of the project is to divert the flow (run-of-river) of the Orange River through canals and tunnels into turbines which in turn would drive an electric generator. By placing the turbines at strategic derivation points along the river, the kinetic and potential energy of the river would be converted into electrical energy. Recent hydrological studies along the Orange River indicate a potential generation capacity of between 80 MW and 120 MW.
The first phase of the feasibility study for the development of a small-scale hydro-power plant along the lower Orange River has been completed. The next step is for the conclusion of environmental and technical studies that would enable decisions on the project site and cost. NamPower could also earn carbon credits from the hydro-power plant, as there would be no use of water abstraction or water regulation.
Due to the fact that the project is an environmentally clean project but with several issues, and could help alleviate the power shortage in Namibia and SADC region, support for the project has been given by the Namibian and South African Heads of State, the Namibian Ministry of Agriculture, Water and Forestry as well as the Namibian MME.
As with most projects of this nature, considerable licenses and regulatory permits are required. However, it is expected that there will be minimal risk to the investor/lender in terms of legislation and regulatory impacts on the project as the projects have received government support from both Namibia and South Africa. The following permits are currently being obtained from the relevant authorities:
1. Operational agreement and water usage permit from the Ministry of Water Affairs (MWAF) of Namibia.
2. Generation license agreement from ECB.

The National Integrated Resource Plan Review and Update – Final Report
September 2016 Page 46 of 155
3. Mining permit from MME.
4. EIA clearance from Namibia and South Africa.
Furthermore, as all power stations would be situated on the Namibian side of the border and above the 100 year flood line, any issue regarding border uncertainty should not impact this project. The LOHEPS projects are presently at a standstill as both NamPower and Clackson Power cannot agree on a method to pursue a way forward. The likelihood of any further progress in the short to medium term is very unlikely especially if other projects under consideration are further developed.
Table 4-5 summarises the main technical and economic parameters for the three hydroelectric power stations described above, i.e. Baynes, Okavango River and Lower Orange River. The following provides short descriptions and explanations to the parameters presented in this table:
1. Generation technologies for all sizes of hydroelectric power units (from less than one megawatt to several hundred megawatts) are commercially available and technically proven in the world. However, due to the nature of a hydroelectric power plant, its capital cost is site dependent, which is a function of several key parameters such as geographical location, geological conditions, reservoir volume or dam requirements, generating station, resettlement, road access, transmission access as well as environmental and social impact management.
2. The economic life of a hydroelectric power station is assumed to be 50 years.
3. The lead time for Baynes, Okavango River and Lower Orange River would be ten, six and six years respectively. The expected construction time for the three stations would be seven, three and three years respectively.
4. The availability of a hydroelectric power station could be very high (taking away the forced outage and planned maintenance) if the availability of water is not taken into account.
5. The daily production profile of the run-of-river projects is dependent on water in-flows and daily peaking storage. Without a daily peaking storage, the station’s output is totally dependent on its in-flows. It generates power when water flows and stops if there is no water. With a daily peaking storage, the water could be stored when the system demand is low and the station generates when the system demand is high.
6. Similar to the explanation for the daily production profile, the seasonal production would be controlled if there is a relatively large reservoir. A small reservoir such as daily peaking storage would have little control of the station’s seasonal output. As per the average in-flows analysed for the Baynes power plant, the in-flows in summer (wet) months are relatively high while they are very low in winter (dry) months.
7. The EPC costs for the hydroelectric stations are based on the assumption that the EPC contracts would be awarded to experienced companies from developing economies as they normally offer much lower prices than those from developed economies.

The National Integrated Resource Plan Review and Update – Final Report
September 2016 Page 47 of 155
8. The EPC costs for Baynes, Okavango River and Lower Orange River power stations were estimated at US$ 2,330 (N$ 37,280) per net unit capacity (kW), US$ 2,500 (N$ 40,000) and US$ 2,500 (N$ 40,000) respectively. These costs do not include the funds required for road access and transmission connection. The cost estimates are based on the fact that Baynes station would have a seasonal reservoir constructed, Okavango River station would need a large amount of funds for environmental management and the Lower Orange stations would need construction of canals and tunnels.
9. Owner’s cost has been estimated at 5% of the total EPC cost.
10. The construction time for the Baynes station would be some seven years, with a cash disbursement of 5%, 10%, 15%, 20%, 20%, 20% and 10%. The construction time for the other two stations would be some three years, with a cash disbursement of 30%, 40% and 30%. In order to align the capital expenditure to the in-service date, the base discount rate is used to calculate the interest during construction (IDC).
11. 1.5% of the sum of EPC, owner’s cost and IDC is assumed to be the financing charges including commitment fees.
12. 2% of the sum of EPC, owner’s cost and IDC is assumed to be the decommissioning costs, which is allocated at the beginning of the unit’s operation.
13. Fixed O&M cost was calculated based on 1.5% of the EPC cost.
14. Variable O&M cost was assumed as N$ 80 per MWh.
4.2.6 Other Renewable Power The Namibian Government in general, and NamPower in particular, through the establishment of a dedicated Renewable Energy Division, have recognised the importance of having renewable energy as an important part of the country’s generation portfolio. However, renewable power generation should be capable of being integrated into the national grid in a cost effective and sustainable way giving careful consideration to the intermittent nature of the generation by some renewable generation technologies.
The potential of solar, wind and biomass (encroacher bush, firewood and wood charcoal) in Namibia is substantial. As per market evolution, the costs of the three renewable generation options are becoming very competitive to the conventional generation technologies.
In addition to the existing renewable based generation projects (Innosun 4.5 MW solar PV, HopSol 5 MW solar PV, one small wind generator around 220 kW near Walvis Bay, the 250 kW CBEND biomass project using gasification of encroacher bush as well as several hybrid systems at Gam, Tsumkwe and Gobabeb), commitments have been made to add the following renewable power projects within next one or two years:
1. NamPower 70 MW REFIT program
2. Diaz 44 MW wind
3. NamPower 37 MW solar PV
4. GreeNam 20 MW solar PV

The National Integrated Resource Plan Review and Update – Final Report
September 2016 Page 48 of 155
Since solar power is localised and the output of the plant can be relatively accurately predicted, regional cooperation is not required beyond the possible exchange of knowledge, best practices and experience among SADC countries. Wind power, however, requires a higher level of regional co-operation since wind profiles are difficult to predict.
Wind Power Generation
The Namibian west coast has good wind resources, with annual average wind speeds ranging from 6 to 12 meters per second with a potential capacity factor from 30% to 40%, which of course depends on the wind turbine technology and tower height. There is little doubt that areas of Namibia are well suited to produce electricity from wind energy, but the potential maximum capacity is debatable. It is generally recognised that wind power is a valuable addition to a country’s electricity generation mix. The level of renewable power which the Namibian grid could accommodate can be examined through a renewable power integration study. It is important to note that there is no general rule of thumb on a higher level of renewable power integration as it is subject to many factors such as load variation patterns, renewable power generation patterns, technical characteristics of the generation fleet, energy storing capability, interconnection strength and power interchange rules/policies with neighboring utilities, etc.
According to an investigation and pre-feasibility study conducted in 1996/1997 by MME, the Lüderitz area has one of the best potentials to develop a sizeable wind farm with total potential capacity of up 65 MW. The other area with great potential for wind power generation is Oranjemund, which is located in the southern part of the country and has an average wind speed of up to 10 meters per second. This area has a total potential capacity of approximately 15 MW.
The Walvis Bay area has also been identified as having considerable wind potential, with average wind speeds ranging from 7 to 12 meters per second and an estimated total potential capacity of 25 MW. The north corridor between Walvis Bay and Henties Bay has considerable wind potential for power generation. This could be extended further north from Henties Bay to Terrace Bay, and even up to Möwe Bay located further north. However, these areas need further investigation to determine their full potential. Nevertheless, the information obtained from the National Weather Service and supported by the Namibia wind map indicates that the wind regime along this section is between 7 and 10 meters per second, which is still attractive for wind power generation. The total potential of the Walvis Bay corridor up to Möwe Bay could reach 45 MW.
As per the information from the ECB, only one wind power project (Lüderitz 44 MW) currently has an effective license issued by the ECB. It is also noted that two wind power licenses lapsed. Table 4-6 summarises the technical and economic parameters for a typical 50 MW wind power project, which could be a combination of several smaller projects. The following provide simple explanations for these parameters:
1. The lead time would be from three to five years depending on permitting requirements, including resource quantification, scoping study, feasibility study, and EPC contract document preparation as well as tendering and awarding, financing closure, construction and commissioning.
2. It is expected that the equivalent availability of the projects would be around 95%.

The National Integrated Resource Plan Review and Update – Final Report
September 2016 Page 49 of 155
3. Due to the lack of viable storage capacity, it is expected that the wind power will be variably dispatched as wind energy is available.
4. The EPC cost for the wind project is estimated at US$ 1,500 (N$ 24,000) per net unit of capacity (kW). The estimate does not include land acquisitions and interconnection to grid.
5. Owner’s cost has been estimated at 5% of the total EPC cost.
6. The construction time would be approximately two years with an annual cash disbursement flow of 60% and 40%.
7. 1.5% of the sum of EPC, owner’s cost and IDC is assumed to be the financing charges including commitment fees.
8. 2% of the sum of EPC, owner’s cost and IDC is assumed to be the decommissioning costs, which is allocated at the beginning of the unit’s operation.
9. Fixed O&M cost was calculated based on 2.5% of the EPC cost.
10. Variable O&M cost was estimated at N$ 80 per MWh.
Solar PV Power Generation
There are a number of different solar PV power technologies in the market, but they operate on the same principle that involves the utilisation of irradiance from the sun for producing electricity using solar panels. Due to the low voltage of an individual solar cell, several cells are wired in series in the manufacture of a "laminate". The laminate is assembled into a protective weatherproof enclosure, thus making a photovoltaic module or solar panel. Modules are then strung together into a photovoltaic array. Most PV arrays use an inverter to convert the DC power produced by the modules into AC power that can be transmitted via transmission or distribution systems to load centres to meet electricity demands.
The most common solar panel technologies on the market today are crystalline silicon modules, and thin-film modules. Sun tracking technology is available and can be implemented to improve the overall energy conversion efficiencies of a solar PV project. Trackers and sensors that optimise the performance are often seen as optional, and tracking systems can increase output by up to 50%.
Solar PV power projects can produce significant amounts of electricity ranging from a few kW to several MW and the technology is mature. Within the Namibian context, solar PV power projects can be effectively integrated into the power portfolio. The energy from the solar resource is available and free. Typically power production is higher at mid-day than the morning and afternoon, with no production at night, and tends to match well with diurnal demand profiles.
Relatively high initial capital investment and sizeable areas for the installation of solar PV projects are required. The direct costs of generation using this technology are currently very competitive to the conventional generation options. Namibia has an excellent resource and environment for large scale electricity generation from solar PV power.

The National Integrated Resource Plan Review and Update – Final Report
September 2016 Page 50 of 155
Namibia has one of the highest solar radiation regimes in Africa and the world. Sunshine is available throughout the year and there are minimal interruptions even during the rainy season. The radiation is utilised by solar panels of a photovoltaic energy conversion technology, i.e. the conversion of light into electricity. This is achieved through photovoltaic (PV) modules. Namibia has promoted solar energy for many years, focusing on providing households, rural clinics, rural schools, community centers and churches with lighting and other important electrical applications. Namibia has excellent sites for large scale solar PV plants of a variety of capacities, especially in areas where there are vast tracks of open, sunny land.
Generation of electricity from solar energy is therefore enjoying support from government and the private sector. As per the information available, solar PV is increasingly paling a more important role in Namibia’s electricity supply. For large-scale solar PV projects (10 MW or higher) in Namibia, the expected annual capacity factor could be in the range from 25% to 35%, with appropriate tracking system and over build of the DC side.
There are several solar PV projects with generator license issued by the ECB. It is assumed that these projects have similar technical and economic parameters as presented in Table 4-7. The following notes provide simple explanations for these parameters:
1. The lead time would be from less than one to two years depending on permitting requirements, including resource quantification, scoping study, feasibility study, and EPC contract document preparation as well as tendering and awarding, financing closure, construction and commissioning.
2. It is expected that the equivalent availability of the projects would be around 95%.
3. Due to the lack of viable storage capacity, it is expected that the solar PV power will be dispatched as sun light is available.
4. The EPC cost for the solar PV project is estimated at US$ 1,300 (N$ 20,800) per net unit capacity (kWp). These estimates do not include land acquisitions.
5. The estimated EPC costs include a 20% overbuild on the DC (direct current) side. For example, a 10 MW AC (alternating current) system will have a 10 MW inverter capacity but 12 MW of DC capacity.
6. Owner’s cost has been estimated at 5% of the total EPC cost.
7. The construction time would generally be approximately two years with an annual cash disbursement flow of 60% and 40% (although there could be cases of construction time being less than a year) 1.5% of the sum of EPC, owner’s cost and IDC is assumed to be the financing charges including commitment fees.
8. 2% of the sum of EPC, owner’s cost and IDC is assumed to be the decommissioning costs, which is allocated at the beginning of the unit’s operation.
9. Fixed O&M cost was calculated based on 2.5% of the EPC cost.
10. Variable O&M cost was estimated at N$ 80 per MWh.

The National Integrated Resource Plan Review and Update – Final Report
September 2016 Page 51 of 155
Concentrated Solar Power Generation
Concentrated solar power (CSP), also referred to as solar thermal power, involves the utilisation of the sun’s heat for power generation. CSP is being widely commercialised and the CSP market has been growing over the last several years. There are a number of different technologies on the market, but they operate on the same principle. Solar heat is trapped and concentrated by mirrors and reflected onto a heat-transfer medium (gas or liquid) contained in pipes. This medium then transfers the heat to water, producing steam, which drives a turbine. CSP stations can produce significant amounts of electricity ranging from a few MW to several hundred MW and they, through heat storage mechanisms (such as salt reservoirs) can produce electricity, albeit at a reduced capacity, for almost 24 hours.
Within a Namibian context, CSP stations are potential candidates for integration into the national grid together with other generation technologies. Namibia, south from Mariental, is generally considered to be highly suitable for CSP power generation.
CSP sun heat collectors for electricity generation require a large amount of initial capital investment and large surface areas for the installation of the solar heat collectors. With ongoing decreases in capital investment cost, this technology could be more readily available and affordable in the near future. Namibia has one of the best environments for installation of CSP collectors for large scale electricity generation.
1. It is noted that NamPower intends to issue a tender for the Techno-Economic Advisor for the Feasibility Study of the Concentrated Solar Power Project with an estimated budget of EUR 1,100,000.
2. The estimated technical and economic parameters for CSP plants are summarised in Table 4-8. The following notes provide high-level explanations for these parameters:
i) Only one size of CSP, 50 MW is selected for this study. The size could be changed based on the future study results. However, four options, i.e. no storage, 4-hour storage, 8-hour storage and 12-hour storage are selected.
ii) The lead time would be from five to six years including resource quantification, scoping study, feasibility study, EPC contract document preparation as well as tendering and awarding, financing closure, construction and commissioning.
iii) It is expected that the equivalent availability of a unit would be around 90%. Due to the limited energy and storage capacity, it is expected that most energy will be dispatched during day time and/or evening hours when the system experiences its daily high load demand.
iv) The EPC costs for the four options are estimated at US$ 1,800 (N$ 28,800) per net unit of capacity (kW). US$ 2,500 (N$ 40,000), US$ 3,750 (N$ 60,000) and US$ 5,000 (N$ 80,000) respectively. These estimates exclude land acquisitions.
v) Owner’s cost has been estimated at 10% of the total EPC cost.
vi) The construction time would be some three years, with a cash disbursement of 30%, 40% and 30%.
vii) 1% of the sum of EPC, owner’s cost and IDC is assumed to be the financing charges including commitment fees.

The National Integrated Resource Plan Review and Update – Final Report
September 2016 Page 52 of 155
viii) 2% of the sum of EPC, owner’s cost and IDC is assumed to be the decommissioning costs, which is allocated at the beginning of the unit’s operation.
ix) Fixed O&M cost was calculated based on 3% of the unit’s EPC cost.
x) Variable O&M cost was assumed as N$160 per MWh.
Biomass
Namibia has abundant biomass resources in the form of encroacher bush, which is located primarily in the north-central and central regions. It has been estimated that there are approximately 26 million hectares of bush-encroached land in Namibia. Encroacher bush prevents the growth of useful grass species, resulting in the compaction of soils in the bush encroached areas. It has reduced Namibia's carrying capacity of livestock, leading to reduced cattle numbers over the past 50 years - from 2.5 million in the commercial farming areas down to some 800,000 head of cattle. According to studies, the reduced availability of land for grazing causes economic losses exceeding one billion Namibian dollars in the agricultural sector every year. Another worrying factor is that the extensive root network - up to 40 meters long - of some encroacher bush species robs the soil of moisture. Soil also gets compacted, which prevents rainwater from penetrating the soil and replenishing the underground water table.
It appears that encroacher bush represents a nearly unlimited resource with which to generate electricity. Use of the encroacher bush for energy production is assumed to have excellent side benefits such as increased water infiltration, increased biodiversity, and improved business and employment opportunities in the agricultural sector. The scale of biomass combustion power plants typically varies from 5 MW to 50 MW, but smaller plant sizes are also possible.
Assuming a 60% sustainable bush clearing approach and a production rate of 12 tonnes per hectare, some 36,000 tonnes of bush chip for power production can be considered realistic in a bush encroached farming unit of 5,000 hectares, which is enough to fuel a 5 MW unit for one year. This calculation is based on a heating value of 16 GJ per tonne, heat rate of 15 GJ per MWh and plant utilisation factor of 80%. Without taking into account bush harvesting cycle, a 5 MW biomass plant would need 25 average-sized farms over its economic life of 25 years. For understanding of the harvesting area, a circle with a radius of 22 km will cover the total area of 25 farms. It is important to highlight that the bush should be harvested in a sustainable manner to be of real benefit to the environment.
The Combating Bush Encroachment for Namibia’s Development (CBEND) initiative is a proof-of-concept project implemented by the Desert Research Foundation of Namibia (DRFN) in partnership with the Namibia Agricultural Union and the Namibia National Farmers Union and funded by the European Commission at an amount of N$ 14 million through the National Planning Commission Secretariat’s Rural Poverty Reduction Programme.

The National Integrated Resource Plan Review and Update – Final Report
September 2016 Page 53 of 155
The CBEND Project has installed a 250 kW bush-to-electricity power plant on a commercial farm (in one of the most bush infested areas) in the Outjo area in Namibia, which is fueled with encroacher bush and will feed electricity directly into the national grid. This demonstration project is Namibia’s first independent power producer and could be used to assess the financial feasibility of this approach and evaluate the technical robustness of the technology. Unfortunately the project has faced various challenges and has not yet commenced commercial operation.
The Support to De-bushing Project is a bilateral cooperation between the Namibia Ministry of Agriculture, Water and Forestry and the German Federal Ministry for Economic Cooperation and Development, which runs from 2014 to 2017, being implemented by the Deutsche Gesellschaft für Internationale Zusammenarbeit GmbH. The Project is aimed to strengthen the restoration of productive rangeland in Namibia. The Project has investigated several methods to economically harvest encroacher bush.
Table 4-9 provides a summary of the estimated technical and economic parameters for the encroacher bush fired power projects, while the following provide additional explanations on these parameters:
1. The bubbling fluidised bed (BFB) technology is selected for the encroacher bush power plants with size of either 5 MW or 10 MW.
2. The lead time would be three to five years including resource quantification, scoping study, feasibility study, EPC contract document preparation as well as tendering and awarding, financing closure, construction and commissioning.
3. It is expected that the equivalent availability of a unit would be approximately 88%.
4. The EPC costs for the 5 MW and 10 MW projects are estimated at US$ 4,000 (N$ 64,000) per net unit capacity (kW) and US$ 3,800 (N$ 60,800) respectively. It is expected that more accurate estimates on capital investment, fuel cost and O&M cost of a biomass plant would be provided by a study to be undertaken by NamPower5.
5. Owner’s cost has been estimated at 5% of the total EPC cost.
6. The construction time would be some three years, with a cash disbursement of 30%, 40% and 30%.
7. 1% of the sum of EPC, owner’s cost and IDC is assumed to be the financing charges including commitment fees.
8. 1% of the sum of EPC, owner’s cost and IDC is assumed to be the decommissioning costs, which is allocated at the beginning of the unit’s operation.
9. Fixed O&M cost was calculated based on 2.5% of the unit’s EPC cost.
10. Variable O&M cost was estimated at N$ 320 and N$ 240 per MWh for the two different unit sizes.
5 NamPower, through the European Investment Bank, has issued a tender for the Techno-Economic Advisor for the Feasibility Study of the Encroacher Bush Biomass Power Plant

The National Integrated Resource Plan Review and Update – Final Report
September 2016 Page 54 of 155
4.3 Imports from SAPP It is learned from NamPower that discussions have been held with several entities to address the possibility of these entities supplying power to Namibia under fixed duration and fixed term conditions. The table below shows the source/entity as well as its fuel to be used, amount of capacity, price and earliest possible in-service date for several power import options:
Import Cost Earliest Source/Entity Country Fuel Capacity
(MW) (N$/MWh) Date ZPC Zambia 50 2,224 2016 Lunsemfwa (IPP) Zambia Hydro 50 1,776 2017/08 Mozambique 100 2,640 2017 IPP Botswana 200 2,272 2017
As previously mentioned, sources located outside Namibia would not qualify as Internal Resources regardless of type of participation (including ownership) to meet the requirements outlined in the 1998 Energy White Paper for both capacity and energy contributions.
4.4 Secondary Generation Options with Quantified Resources but Non-mature Technology This section provides a brief description of the options with quantified resources but non mature technologies (including small nuclear reactors).
4.4.1 Small Modular Nuclear Reactor Power Generation Due partly to the high capital cost of large nuclear reactors generating electricity via the steam cycle and partly to the need to service small electricity grids under about 4,000 MW, there is a move to develop smaller nuclear power units. These may be built independently or as modules in a larger complex, with capacity added incrementally as required. There are also moves to develop small units for remote sites. Small units are seen as a much more manageable investment than big ones whose cost rivals the capitalisation of the utilities concerned.
The four 12 MW EGP-6 nuclear reactors located in the Bilibino nuclear power plant, Chukotka Autonomous Okrug, Russia, are the smallest and the northernmost operating nuclear power units in the world. The EGP-6 reactors are a scaled down version of the RBMK reactor design. Notably, these reactors along with the RBMK designs are some of the few active reactors which still use light water cooled graphite as a neutron moderator. It is noted that construction of the plant began in 1966 and the first two units started operation in 1973, the third one in 1975 and the last one in 1976. Under the International Nuclear Safety Program, the U.S. Department of Energy (DOE) assisted with safety improvements at Bilibino NPP, particularly focusing on improving the safety of day-to-day operations. Activities included an analytical simulator project, safety and maintenance training, and the provision of monitoring and communications equipment, among others.

The National Integrated Resource Plan Review and Update – Final Report
September 2016 Page 55 of 155
The RBMK is an early Generation II reactor and the oldest commercial reactor design still in wide operation. It features a number of design and safety flaws (such as graphite-tipped control rods, a dangerous positive void coefficient and instability at low power levels) that have since been rectified in newer designs. The reactor's flaws contributed to the 1986 Chernobyl disaster in which an RBMK exploded during an unsafe test and spread radioactivity over a large portion of Eastern Europe. The disaster prompted worldwide calls for the reactors to be completely decommissioned, although there is still considerable reliance on RBMK facilities for power in Russia and the post-Soviet republics. The last RBMK at Chernobyl was not shut down until 2000, and as of 2010 there were still at least 11 RBMK reactors operating in Russia alone.
In 2007, the Government of Namibia, through the MME, identified nuclear energy as an option to be considered for electricity generation, which has resulted in interest from foreign investors. A series of discussions/negotiations between the Namibian and Russian governments took place from mid-2007 for the development of a nuclear power plant with 50 MW units to be located offshore Namibia. There are, however, serious concerns related to the safety and environmental risks of the proposed floating nuclear power plant technology as it is a new technology which has not been commercially available and has not been used in other countries. On the other hand, a French company has been investigating the possibilities for investing in nuclear power generation in Namibia based on the technology that has been proven to be technologically sound in developed countries.
In early 2012, the DOE announced its first step toward manufacturing small modular nuclear reactors (SMRs) in the United States. Through the draft Funding Opportunity Announcement (FOA), the Department will establish cost-shared agreements with private industry to support the design and licensing of SMRs. The draft FOA is a working document soliciting input from industry to promote leading edge design certification, licensing and engineering.
It is suggested that the small nuclear reactor power generation could be taken into account in the future NIRP development only when they are commercially available and technically proven. The lead time should, of course, include all necessary components for a nuclear power plant, including requirements for personnel training, establishment of national nuclear regulatory commission and associated laws, regulations and codes, feasibility study, environmental and social impact assessment, construction and commissioning.
Table 4-10 summarises the technical and economic parameters estimated for the small modular nuclear reactors which could be applicable to the Namibia electric system in the future. The following are some additional notes to this table:
1. The lead time for a small modular nuclear power plant could be from six to eight years following the approval and commercialisation of the reactors.
2. The earliest on-line time of a SMR is subject to future technology development and commercialisation.
3. It is expected that the equivalent availability of a nuclear plant would be around 88%, based on the information from the NERC database. Its capacity factor could, therefore, be only up to this value as the plant might not produce at its full capacity at all times due to various reasons such as low load demand, contribution to spinning reserve obligation, etc.

The National Integrated Resource Plan Review and Update – Final Report
September 2016 Page 56 of 155
4. The EPC costs for 50 MW and 100 MW have been estimated at US$ 9,000 (N$ 144,000) per net unit capacity (kW), and US$ 8,500 (N$ 136,000) respectively.
5. Owner’s cost has been estimated at 5% of the total EPC cost.
6. The construction time for a small modular nuclear unit would be some four years, with a cash disbursement of 15%, 35%, 35%, and 15%. In order to align the capital expenditure to the in-service date, the base discount rate is used to calculate the interest during construction (IDC).
7. 0.5% of the sum of EPC, owner’s cost and IDC is assumed to be the financing charges including commitment fees.
8. 1% of the sum of EPC, owner’s cost and IDC is assumed to be the decommissioning costs, which is allocated at the beginning of the unit’s operation.
9. Fixed O&M cost was calculated based on 1.5% of the unit’s EPC cost.
10. Variable O&M cost was estimated at N$ 240 per MWh for the two size units.
4.5 Secondary Generation Options with Mature Technology but Non-quantified Resources This section provides a brief description of the options with mature technology but non-quantified resources which we consider to include wind power generation, solar PV power generation, solar thermal power generation, generation using municipal solid waste, bio-fuels, biomass and geothermal generation.
4.5.1 Wind Power Generation There are a number of different wind power technologies on the market, but they operate on the same principle that involves the conversion of the kinetic energy in the wind to produce electricity using wind turbine-generators. The most common technology on the market today is the horizontal axis wind turbine (HAWT). The HAWTs have a rotor and a nacelle that houses the main rotor shaft and electrical generator at the top of a tower. Computer controlled yaw motors and pitch mechanisms allow the nacelle to turn and pitch with changes in wind direction. Most have a gearbox, which controls the rotational speed of the blades and many new models are available with direct drive systems that eliminate the need for a gearbox.
Turbines used in wind power plants for commercial production of electric power are usually three-bladed with high tip speeds of up to 320 km per hour, high efficiency, and low torque ripple, which contribute to reasonable reliability. The blades are usually colored light gray to blend in with the clouds and range in length from 20 to 50+ metres. The tubular steel towers range from 50 to 100+ metres tall. Modern technologies are equipped with protective features to avoid damage at high wind speeds, by feathering the blades into the wind which ceases their rotation, supplemented by brakes.
A wind power plant can produce significant amounts of electricity ranging from a few MW to few hundred MW and the technology is mature. Within the Namibian context, wind power projects can be effectively integrated into the power portfolio. The energy from the wind resource is available and free, but highly variable. As a result, the transmission and distribution system operator must consider regulation measures using other dispatchable quick response generating stations to deliver power to meet firm demand requirements.

The National Integrated Resource Plan Review and Update – Final Report
September 2016 Page 57 of 155
Relatively high initial capital investment and large areas for the installation of the wind turbines are required. This could make this technology less affordable and accessible currently, but with possible further increases in the price of fossil fuels, and the need for safer and cleaner energy sources, the cost of wind power technology could keep on decreasing and make these technologies readily available and affordable in the near future. Namibia has potential for large scale electricity generation from wind power.
It is expected that the following essential steps are required to quantify wind resources at a reasonably accurate level:
1. Review of previous and current studies on wind energy potentials, wind resource data monitoring campaigns, and critical assessment of the available data.
2. Based on the review work of the previous studies, select four to eight representative sites for wind resource monitoring and assessment.
3. Installation of monitoring equipment at the selected sites and collection of required data for at least one year and analysis of the data collected.
4. Wind power plant site selection will require detailed wind resource maps, and transmission and distribution maps.
5. Carry out prefeasibility studies for the selected sites to estimate the potential output, required investment and O&M costs.
6. The total period for this resource quantification would be two years or longer.
7. The total funds required for this could be from US$ 500,000 (N$ 8,000,000) to US$ 1,000,000 (N$ 16,000,000) but it is dependent on the level of accuracy, degree of complexity, size of the project, and requirements of the wind monitoring campaign.
It is noted that there are a couple of wind power projects with lapsed conditional licenses from ECB. It is not clear at this point the extent to which the developers have completed the above steps.
The technical and economic parameters of a wind power plant with a size ranging from 30 to 100 MW have been presented in Table 4-6.
4.5.2 Power Generation Using Municipal Solid Waste Electricity can be produced by burning municipal solid waste (MSW) as a fuel. MSW power plants, also called waste to energy (WTE) plants, are designed to dispose of MSW and to produce electricity as a byproduct of the incinerator operation. The term MSW describes the stream of solid waste generated by households and apartments, commercial establishments, industries and institutions. MSW consists of everyday items such as product packaging, grass clippings, furniture, clothing, bottles, food scraps, newspapers, paint and batteries. It does not include medical, commercial and industrial hazardous or radioactive wastes, which must be treated separately.
MSW is managed by a combination of disposal in landfill sites, recycling, and incineration. MSW incinerators often produce electricity in WTE plants. The U. S. EPA recommends, "The most environmentally sound management of MSW is achieved when these approaches are implemented according to EPA's preferred order: source reduction first, recycling and composting second, and disposal in landfills or waste combustors last.

The National Integrated Resource Plan Review and Update – Final Report
September 2016 Page 58 of 155
In the United States, there are currently two main WTE facility designs:
• Mass Burn is the most common waste-to-energy technology, in which MSW is combusted directly in much the same way as fossil fuels are used in other direct combustion technologies. Burning MSW converts water to steam to drive a turbine connected to an electricity generator.
• Refuse-derived fuel (RDF) facilities process the MSW prior to direct combustion. The level of pre-combustion processing varies among facilities, but generally involves shredding of the MSW and removal of metals and other bulky items. The shredded MSW is then used as fuel in the same manner as at mass burn plants.
In addition to the two main WTE facilities designs mentioned above, there are also two other technologies, pyrolysis and thermal gasification, under the development stage with a limited number of units in operation. Pyrolysis and thermal gasification are related technologies. Pyrolysis is the thermal decomposition of organic material at elevated temperatures in the absence of gases such as air or oxygen. The process, which requires heat, produces a mixture of combustible gases (primarily methane, complex hydrocarbons, hydrogen and carbon monoxide), liquids and solid residues.
Thermal gasification of MSW is different from pyrolysis in that the thermal decomposition takes place in the presence of a limited amount of oxygen or air. The producer gas which is generated can then be used in either boilers or cleaned up and used in combustion turbine/generators. The primary area of research for this technology is the scrubbing of the producer gas of tars and particulates at high temperatures in order to protect combustion equipment downstream of the gasifier and still maintain high thermal efficiency.
A couple of technologies for generating electricity using MSW are well developed internationally. Namibia could not support large MSW generation facilities as it only has modest amounts of waste resources available with which to generate electricity due to its relatively low population. A study performed by Stewart and Scott in 1997 indicated that Windhoek did not generate sufficient amounts of refuse to support an economically sized power plant.
There are, however, small scale technologies available that are able to generate electricity from refuse, in particular those based on gasification. Due to the relatively small size of these technologies, it is possible that they could be applied in Namibia’s medium-sized towns. However, it should be emphasised that refuse gasification technologies have not been fully proven internationally.
It is expected that the following essential steps are required to quantify municipal solid waste plants at a reasonably accurate level:
1. Review of previous studies on solid waste energy, collection of the current MSW disposal quantity, critical assessment of the available data and selection of several of the larger cities for potential MSW power plants, each with a capacity of some 10 MW or 20 MW.
2. Analysis of the MSW samples for each selected city and assessment of the energy available to fuel a power plant.
3. Carry out prefeasibility study for the selected sites to estimate the potential output, required investment and O&M costs.

The National Integrated Resource Plan Review and Update – Final Report
September 2016 Page 59 of 155
4. The total period for this resource quantification would be one year.
5. The total funds required for this work could be from US$ 200,000 (N$ 3,200,000) to US$ 1,000,000 (N$ 16,000,000).
The estimated technical and economic parameters for the MSW power plants are summarised in Table 4-11. The following notes provide simple additions to these parameters:
1. Two sizes, 10 MW and 20 MW are selected for this study. They could be changed based on the future study results.
2. The lead time would be from five to seven years including resource quantification, scoping study, feasibility study, EPC contract document preparation as well as tendering and awarding, financing closure, construction and commissioning.
3. It is expected that the equivalent availability of a unit would be around 80%.
4. The EPC costs for the 10 MW and 20 MW plants are estimated at US$ 8,000 (N$ 128,000) per net unit of capacity (kW) and US$ 7,500 (N$ 120,000) respectively.
5. Owner’s cost has been estimated at 5% of the total EPC cost.
6. The construction time would be some three years, with a cash disbursement of 30%, 40% and 30%.
7. 0.5% of the sum of EPC, owner’s cost and IDC is assumed to be the financing charges including commitment fees.
8. 1% of the sum of EPC, owner’s cost and IDC is assumed to be the decommissioning costs, which is allocated at the beginning of the unit’s operation.
9. Fixed O&M cost was calculated based on 2% of the unit’s EPC cost.
10. Variable O&M costs were assumed as N$ 320 per MWh.
4.5.3 Bio-fuels Power Generation Namibia also has a potential for bio-fuel production. The viability of bio-fuel production will depend on the prices of both electricity and liquid fuels. It is expected that the following essential steps are required to quantify bio-fuels at a reasonably accurate level:
1. Review of previous studies on bio-fuels, particularly the Okavango Bio-Fuel project, collection of the information related to the bio-fuel resources, critical assessment of the available data and selection of one to two sites for potential bio-fuel power plants. As CCGT could use bio-fuels as fuel, it is suggested that CCGT should be used and each CCGT plant could have a capacity of either 75 MW (two 25 MW GTs and one 25 MW ST) or 150 MW (two 50 MW GTs and one 50 MW ST).
2. Collection of crop samples and analysis of bio-fuel production rates.
3. Analysis of the potential bio-fuel resources and estimate of the total bio-fuels available to each selected site to fuel a power plant.
4. Carry out prefeasibility study for the selected sites to estimate the potential output, required investment and O&M costs.
5. The total period for this resource quantification would be one year.

The National Integrated Resource Plan Review and Update – Final Report
September 2016 Page 60 of 155
6. The total funds required for this work could be from US$ 200,000 (N$ 3,200,000) to US$ 500,000 (N$ 8,000,000).
The estimated technical and economic parameters for the bio-fuel power plants are summarised in Table 4-12. The following notes provide simple explanations on these parameters:
1. Two CCGT sizes, 75 MW and 150 MW are selected for this study. They could be revised based on the future study results.
2. The lead time would be from six to seven years including resource quantification, scoping study, feasibility study, EPC contract document preparation as well as tendering and awarding, financing closure, construction and commissioning.
3. It is expected that the equivalent availability of a unit would be around 88%.
4. The EPC costs for the 75 MW and 150 MW are estimated at US $900 (N$ 14,400) per net unit of capacity (kW) and US$ 850 (N$ 13,600) respectively.
5. Owner’s cost has been estimated at 10% of the total EPC cost.
6. The construction time would be some three years, with a cash disbursement of 30%, 40% and 30%.
7. 1.5% of the sum of EPC, owner’s cost and IDC is assumed to be the financing charges including commitment fees.
8. 2% of the sum of EPC, owner’s cost and IDC is assumed to be the decommissioning costs, which is allocated at the beginning of the unit’s operation.
9. Fixed O&M cost was calculated based on 3% of the unit’s EPC cost.
10. Variable O&M cost was assumed as N$ 240 per MWh.
4.5.4 Geothermal Power Generation In 2004, the University of the Witwatersrand advised the Namibian Geological Survey on aspects of terrestrial heat flow and the potential of geothermal energy in Namibia. Heat flow maps of Namibia and the region surrounding Namibia would suggest that the potential is high compared with most of the rest of the subcontinent, but there are large areas, particularly in the west where there is little information. There are only 12 heat flow measurements in Namibia, mostly from the Damara Belt, and this and the scarcity of data in adjacent regions results in an incomplete heat flow pattern. The average heat flow for the Damara Belt (69±10mW m-2) is the highest in the region but the heat flow does not attain the extremely high values observed in geologically more active regions. The high heat flow is not associated with thermal transients and is probably due to an enhanced radioactive contribution from the upper crust.
Despite the relatively high heat flow, the thermal gradients are not exceptionally high and exceed 25 K km-1 at only three localities. Regional subsurface temperature maps obtained by one dimensional modeling of the heat flow data indicate that temperatures exceeding 100°C are only reached at 2 – 3 km. This modeling is preliminary and a detailed analysis, based on more complete heat flow coverage and variations in geological structure may reveal local temperature anomalies.

The National Integrated Resource Plan Review and Update – Final Report
September 2016 Page 61 of 155
Hot water or thermal springs in Namibia are known in Warmbad, Rehoboth, Omburo (near Omaruru) and Gross Barmen (near Okahandja). These are used for recreational and tourism purposes. The occurrence of thermal springs has possible implications for geothermal energy. Those at Windhoek and Omburo are of particular interest as the temperatures of the surface waters were originally 70 - 80°C. These temperatures are however lower than those observed in active geological regions and the origins of the springs appear to be heating of meteoric water under the normal geothermal gradient. Preliminary calculations indicate that the springs probably rise from depths of 2 – 3 km. Drilling into the springs at Grosse Windhoek in the 1920s caused them to dry up, so the recharge rate of the springs is also of concern. These comments are based on little information and more work is required to establish the depth, size and temperature of the reservoirs giving rise to the springs and whether the rainfall and permeability of the aquifers feeding the reservoirs are sufficient to recharge them.
Currently there is insufficient data relating to geothermal gradients, heat flow patterns and other information relating to hot spring reservoirs to make a sound scientific assessment of the geothermal potential. This would be possible if there were a better coverage of heat flow data and more in-depth knowledge of thermal springs based on scientific investigations.
Reconnaissance level heat flow coverage over the entire country would be desirable and this would take at least two years to achieve because heat flow determination is time consuming. Particular attention should also be paid to the following: (i) areas where hot springs exist, especially Windhoek and Omburo, (ii) sedimentary basins such as the Owambo and Nama Basins, where deep-seated aquifers might house geothermal reservoirs Opportunities for heat flow determination include (i) making use of commercial offshore heat flow measurements and bottom hole temperature measurements in offshore and onshore oil wells which would require collaboration with the Namibian Petroleum Corporation, (ii) conducting surveys in mineral exploration boreholes and stratigraphic holes that might be drilled by the Geological Survey, (iii) collaborating with the Department of Water Affairs which conducts routine geophysical surveys in water exploration wells.
Further investigations of the hot springs in Windhoek and Omburo should be aimed at establishing the depth and extent of the reservoirs, their temperatures and water content and the recharge rates. A first step towards determining the temperature would be to survey some boreholes into the Windhoek springs that are currently being planned by the Windhoek Municipality. It may also be worth collaborating with the Municipality with a view to having one of these holes deepened. If the permeability of the reservoirs and the aquifers feeding them and the rainfall in the catchment areas are found to be inadequate to recharge the reservoirs, the use of artificial methods of enhancing these parameters (including hydraulic fracturing and injection of waste water) should be investigated. Finally, if the temperatures of the reservoirs are not high enough to use conventional turbines, the viability of binary-cycle turbines, which can operate at temperatures as low as 85°C, should be investigated.

The National Integrated Resource Plan Review and Update – Final Report
September 2016 Page 62 of 155
Considerable Government engagement would be required to finance, coordinate and evaluate the research as suggested above. Should sufficient data be obtained to ascertain the availability of sustainable geothermal energy, the Government of Namibia would be advised to support investments in geothermal electricity generating plants. Geothermal electric plants have relatively modest installation capital costs. Such plants could therefore be funded through a government-private sector initiative or by an IPP. Once running, the only major running cost of such electric plants is maintenance of the hot water pipes and the steam turbines. If appropriate corrosion prevention methods are incorporated at the design stage, the cost of maintenance becomes minimal.
Based on the success of existing geothermal electric plants in Naivasha Kenya, one could foresee a scenario in which Namibia would establish several generating plants in the future if sustainable geothermal energy sources are confirmed. Such electric plants would then be connected to the national grid and provide a clean, affordable and environmentally friendly energy source. With such a scenario, regional and international cooperation is not critical because power generation from geothermal plants can be varied or even shut down in times of excess power in the grid.
It is expected that the following essential steps are required to quantify the geothermal resources at a reasonably accurate level:
1. Review of previous studies on geothermal resources, collection of the information related to the geothermal energy resources, critical assessment of the available data and selection of two to five sites for potential geothermal power plants.
2. Investigation of the geothermal potential for each of the selected sites through reconnaissance, drill, testing, etc.
3. Analysis of the potential geothermal resources and estimate of the total resources available to each selected site to fuel a power plant.
4. Carry out prefeasibility study for the selected sites to estimate the potential output, required investment and O&M costs.
5. The total period for this resource quantification would be two to four years.
6. The total funds required for this work could be from US$ 1,000,000 (N$ 16,000,000) to US$ 3,000,000 (N$ 48,000,000).
The estimated technical and economic parameters for the geothermal power plants are summarised in Table 4-13. The following notes provide abbreviated explanations on these parameters:
1. Two plant sizes, 5 MW and 20 MW are selected for this study. They could be revised based on the resources available.
2. The lead time would be from eight to ten years including resource quantification, scoping study, feasibility study, EPC contract document preparation as well as tendering and awarding, financing closure, construction and commissioning.
3. It is expected that the equivalent availability of a plant would be approximately 86%.

The National Integrated Resource Plan Review and Update – Final Report
September 2016 Page 63 of 155
4. The EPC costs for the 5 MW and 20 MW are estimated at US$ 6,500 (N$ 104,000) per net unit of capacity (kW) and US$ 6,000 (N$ 96,000) respectively.
5. Owner’s cost has been estimated at 5% of the total EPC cost.
6. Construction time would be some three years, cash disbursement of 30%, 40% and 30%.
7. 1% of the sum of EPC, owner’s cost and IDC is assumed to be the financing charges including commitment fees.
8. 1% of the sum of EPC, owner’s cost and IDC is assumed to be the decommissioning costs, which is allocated at the beginning of the unit’s operation.
9. Fixed O&M cost was calculated based on 3% of the unit’s EPC cost
10. Variable O&M cost was assumed as N$ 240 per MWh.
Table 4-1: Coal Fired Power Generation
Note: All Costs expressed in N$

The National Integrated Resource Plan Review and Update – Final Report
September 2016 Page 64 of 155
Table 4-2: Natural Gas Fired Power Generation
Note: All Costs expressed in N$

The National Integrated Resource Plan Review and Update – Final Report
September 2016 Page 65 of 155
Generation Technology ICRE CCGT GT GT CommentFuel HFOPlant Gross Capacity (MW) 20.8 156 51 102Plant Net Capacity (MW) 20 150 50 100Number of Units 1 1 1 1Economic Life (Year) 25 25 20 20Lead Time (Year) 4-5 5-6 4-5 4-5Earliest On-Line Year 2020/2021 2021/2022 2020/2021 2020/2021Equivalent Availability (%) 90 87 90 90Equivalent Forced Outage Rate (%) 5.0 6.0 5.0 5.0Planed Outage Rate (%) 4.0 6.0 4.0 4.0 Two/three weeks per yearProduction Profile (Daily)Production Profile (Seasonal)Net Heat Rate (KJ/kWh, HHV) 8,860 7,216 9,338 9,043Primary Fuel Cost ($/GJ) 134.72 267.33 267.33 267.33Overall Capitalized Cost ($M) 600.2 3,615.8 1,006.9 1,912.5
Plant EPC ($M) 352.0 2,040.0 560.0 1,040.0 Based on net capacityOwner's Cost ($M) 35.2 204.0 56.0 104.0 10% of Plant's EPC costPlant CAPEX Disbursement Flow (%) 60%, 40% 30%, 40%, 30%Plant IDC ($M) 43.3 351.9 68.8 127.8 Rate of 10% to align the cost to service yearGrid Integration EPC ($M) 122.2 734.0 235.5 471.0Owner's Cost for Grid Integration ($M) 12.2 73.4 23.6 47.1 10% of Integration costGrid Integration CAPEX Disbursement Flow (%)Grid Integration IDC ($M) 15.0 90.2 28.9 57.9 Rate of 10% to align the cost to service yearFinancing Charges including Commitment ($M) 8.7 52.4 14.6 27.7 1.5% of sum of all EPC, Owner's cost and IDC Commissioning Cost ($M) For Kudu gas power plant onlyDecommissioning Cost ($M) 11.6 69.9 19.5 37.0 2% of sum of all EPC, Owner's cost and IDC
Overall Plant Capital Unit Capacity Cost ($/kW) 30,010 24,106 20,137 19,125 Based on the net capacityFixed O&M Cost ($/kW-Year) 528.0 408.0 336.0 312.0 Based on 3% of EPC cost, including insuranceVariable O&M Cost ($/MWh) 240.0 240.0 240.0 240.0CO2 Emission Rate (kg/GJ) 69.009 69.009 69.009 69.009NOx Emission Rate (kg/GJ) 0.000566 0.000566 0.000566 0.000566SO2 Emission Rate (kg/GJ)Particulate Matter Emission Rate (kg/GJ)
LFO
Based on NERC database
Dispatched as per system requirementsDispatched as per system requirements
60%, 40%
60%, 40% 60%, 40%
Uncontrolled factors calculated as per the parameters from the US EIA and EPA. About 90% of NOx could be reduced by GT. SO2 emission factor was calculated based on 1% sulphur content.
Table 4-3: Fuel Oil Fired Power Generation
Note: All Costs expressed in N$

The National Integrated Resource Plan Review and Update – Final Report
September 2016 Page 66 of 155
Table 4-4: Nuclear Power Generation
Note: All Costs expressed in N$

The National Integrated Resource Plan Review and Update – Final Report
September 2016 Page 67 of 155
Table 4-5: Hydro Electric Power Generation
Note: All Costs expressed in N$

The National Integrated Resource Plan Review and Update – Final Report
September 2016 Page 68 of 155
Table 4-6: Wind Power Generation
Note: All Costs expressed in N$

The National Integrated Resource Plan Review and Update – Final Report
September 2016 Page 69 of 155
Table 4-7: Solar PV Power Generation
Note: All Costs expressed in N$

The National Integrated Resource Plan Review and Update – Final Report
September 2016 Page 70 of 155
Table 4-8: Concentrated Solar Power Generation
Note: All Costs expressed in N$

The National Integrated Resource Plan Review and Update – Final Report
September 2016 Page 71 of 155
Table 4-9: Biomass Power Generation
Note: All Costs expressed in N$

The National Integrated Resource Plan Review and Update – Final Report
September 2016 Page 72 of 155
Table 4-10: Small Modular Reactor Power Generation
Note: All Costs expressed in N$

The National Integrated Resource Plan Review and Update – Final Report
September 2016 Page 73 of 155
Table 4-11: Power Generation Using Municipal Solid Waste
Note: All Costs expressed in N$

The National Integrated Resource Plan Review and Update – Final Report
September 2016 Page 74 of 155
Table 4-12: Bio-Fuel Power Generation
Note: All Costs expressed in N$

The National Integrated Resource Plan Review and Update – Final Report
September 2016 Page 75 of 155
Table 4-13: Geothermal Power Generation
Note: All Costs expressed in N$

The National Integrated Resource Plan Review and Update – Final Report
September 2016 Page 76 of 155
5. Load Forecast and Supply/Demand Balance 5.1 Historic Sales and Load Data
The power sector in Namibia is dominated by NamPower, which is responsible for most generation, transmission and a small portion of the distribution business. The majority of the distribution sector is serviced by individual distributors including three REDs as well as a number of local and regional authorities.
The longest data series for electricity consumption in Namibia is based on the figures published in the NamPower Annual Reports. These data do not, however, isolate sales by location or type of consumer, although they do identify exports and ESKOM direct supplies to Orange River and the Skorpion Mine. All data are on a fiscal year basis – July to June. This data is summarised in Table 5-1.
Table 5-1: Namibia Overall Electricity Data (GWh) (1988/89 to 2014/15)
Fiscal Year
Units Sent Out
Total Units Sold
Units Exported
Units to Orange River
Units to Skorpion
Units Sold in Namibia
Apparent Transmission
Losses (GWh) (GWh) (GWh) (GWh) (GWh) (GWh)
1989 1835 1659 267 1392 9.59% 1990 1790 1612 166 1446 9.94% 1991 1919 1719 201 1518 10.42% 1992 1948 1714 204 1510 12.01% 1993 1746 1551 49 1502 11.17% 1994 1753 1553 28 1525 11.41% 1995 2015 1784 146 1638 11.46% 1996 1951 1731 30 1701 11.28% 1997 1949 1700 1 1699 12.78% 1998 2211 1904 21 1883 13.89% 1999 2085 1863 56 1807 10.65% 2000 2192 1978 100 1878 9.76% 2001 2277 2050 69 1981 9.97% 2002 2371 2136 54 2082 9.91% 2003 2466 2246 53 76 2117 9.21% 2004 2945 2795 23 257 471 2044 6.77% 2005 3363 2976 31 206 596 2143 15.11% 2006 3554 3199 36 184 682 2297 13.21% 2007 3621 3259 40 191 629 2399 12.92% 2008 3719 3392 47 224 663 2458 11.55% 2009 3692 3358 68 122 639 2529 11.40% 2010 3767 3431 77 130 673 2551 11.34% 2011 3910 3543 76 127 690 2650 11.87% 2012 4162 3726 91 133 662 2840 12.95% 2013 4238 3861 89 139 647 2986 10.92% 2014 4384 3827 84 145 571 3027 15.19% 2015 4254 3870 88 139 474 3169 10.55%
The Total Units Sold as listed in Table 5-1 are NamPower sales to either distributors or to direct customers such as mines, water pumping schemes and NamPower’s distribution customers. Data on delivery through the distributors’ systems and sales to the ultimate customers are not recorded by NamPower.

The National Integrated Resource Plan Review and Update – Final Report
September 2016 Page 77 of 155
The number of customers and sales volume are recorded for each distributor by four consumption categories: domestic, commercial, Bulk/Large Power User (LPU) and Institutional (Inst). The number of customers for the fiscal year 2014/15 is listed in Table 5-2. Approximately ninety percent of the distribution customers are in the domestic category.
Table 5-2: Number of Customers for 2014/15
Distribution Area Domestic Commercial Bulk/LPU Inst Total NORED 56,000 2,309 529 - 58,838 OPE 5,045 440 54 34 5,573 CENORED 22,019 2,276 71 664 25,030 ERONGO RED 33,404 3,193 249 165 37,011 Central Namibia 65,621 5,902 1,034 - 72,557 Southern Namibia 26,943 1,680 281 11 28,916 NamPower DX 14 2,549 111 - 2,674
Distribution Total 209,046 18,349 2,329 874 230,599 Source: ECB
The sales statistics for the fiscal year 2014/15 are displayed in Table 5-3. This table includes the distribution portion of the NamPower operations.
Table 5-3: Sales Statistics for 2014/15 (MWh)
Distribution Area Domestic Commercial Bulk/LPU Inst Total NORED 175,164 36,524 106,778 0 318,466 OPE 18,378 6,569 26,030 6,869 57,846 CENORED 58,797 50,277 24,835 38,160 172,069 ERONGO RED 163,251 58,215 173,835 3,162 398,463 Central Namibia 393,129 129,045 376,207 0 898,381 Southern Namibia 70,057 28,379 57,967 4 156,406 NamPower DX 262 74,715 121,903 0 196,880
Distribution Total 879,037 383,724 887,555 48,195 2,198,511 Source: ECB
For the sales in 2014/15, some 40 percent are in the domestic tariff category, 17 percent are in the commercial category, 40 percent are bulk sales and the remaining 3 percent are institutional. Slightly more than 40 percent of the total distribution sales were recorded for the Central area which includes the City of Windhoek and surrounding towns.
The NamPower Annual Report for the period ending 30 June 2015 reports total sales in Namibia of 3,169 GWh. The main difference between this number and the 2,198 GWh shown in Table 5-3 is the NamPower sales to its transmission connected customers. Table 5-4 links the 2014/15 ECB sales data with the NamPower Annual Report figures. The table shows the ECB sales reported by the distributors plus NamPower direct transmission level sales totalling 2,891 GWh. The annual report sales value is 3,169 GWh which implies average distribution losses of 8.7%.
The reported peak demand in the Annual Report for the Namibian plus export system is 597 MW (2014/2015). When the Skorpion Mine and Orange River Supply are included the overall system peak is 657 MW.
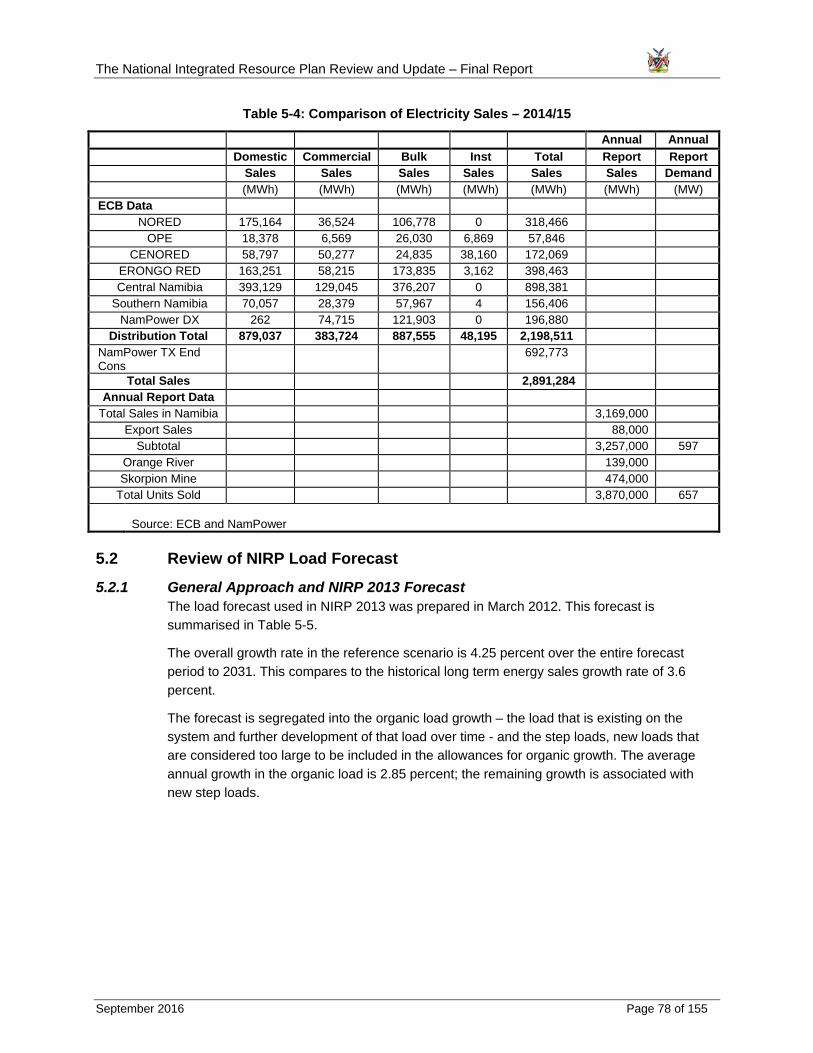
The National Integrated Resource Plan Review and Update – Final Report
September 2016 Page 78 of 155
Table 5-4: Comparison of Electricity Sales – 2014/15
Annual Annual Domestic Commercial Bulk Inst Total Report Report Sales Sales Sales Sales Sales Sales Demand (MWh) (MWh) (MWh) (MWh) (MWh) (MWh) (MW)
ECB Data NORED 175,164 36,524 106,778 0 318,466
OPE 18,378 6,569 26,030 6,869 57,846 CENORED 58,797 50,277 24,835 38,160 172,069
ERONGO RED 163,251 58,215 173,835 3,162 398,463 Central Namibia 393,129 129,045 376,207 0 898,381
Southern Namibia 70,057 28,379 57,967 4 156,406 NamPower DX 262 74,715 121,903 0 196,880
Distribution Total 879,037 383,724 887,555 48,195 2,198,511 NamPower TX End Cons
692,773
Total Sales 2,891,284 Annual Report Data
Total Sales in Namibia 3,169,000 Export Sales 88,000
Subtotal 3,257,000 597 Orange River 139,000 Skorpion Mine 474,000
Total Units Sold 3,870,000 657
Source: ECB and NamPower
5.2 Review of NIRP Load Forecast
5.2.1 General Approach and NIRP 2013 Forecast The load forecast used in NIRP 2013 was prepared in March 2012. This forecast is summarised in Table 5-5.
The overall growth rate in the reference scenario is 4.25 percent over the entire forecast period to 2031. This compares to the historical long term energy sales growth rate of 3.6 percent.
The forecast is segregated into the organic load growth – the load that is existing on the system and further development of that load over time - and the step loads, new loads that are considered too large to be included in the allowances for organic growth. The average annual growth in the organic load is 2.85 percent; the remaining growth is associated with new step loads.

The National Integrated Resource Plan Review and Update – Final Report
September 2016 Page 79 of 155
Table 5-5: Reference Forecast Summary NIRP 2013 (GWh)
Sales Sales Sales Generation Generation Year Organic Step Total Total Peak
(GWh) (GWh) (GWh) (GWh) (MW) 2008 2,512 0 2,512 2,763 443.7 2009 2,577 0 2,577 2,802 470.1 2010 2,756 0 2,756 2,976 477.0 2011 2,889 0 2,889 3,231 511.7 2012 2,956 9 2,965 3,316 525.7 2013 3,037 183 3,220 3,601 562.8 2014 3,123 464 3,586 4,011 614.0 2015 3,202 1,116 4,318 4,829 710.6 2016 3,285 1,505 4,790 5,357 774.9
.. 2021 3,824 1,696 5,520 6,173 901.3
.. 2026 4,410 1,499 5,909 6,608 988.5
.. 2031 5,071 1,576 6,646 7,432 1124.4 2011-2031 2.85% 4.25% 4.25% 4.02%
Figure 5-1 displays the reference energy forecast for both sales and generation.
Figure 5-1: Reference Sales and Generation (GWh)
Low and high forecasts were also prepared. Table 5-6 summarises the three forecasts in numerical form and Figure 5-2 displays the forecasts in graphical form (the low forecast is the green line, the reference forecast is the blue line and the high forecast is the red line).
Reference Scenario
Generation Energy
Energy Supplied
0
1,000
2,000
3,000
4,000
5,000
6,000
7,000
8,000
2008 2009 2010 2011 2012 2013 2014 2015 2016 2017 2018 2019 2020 2021 2022 2023 2024 2025 2026 2027 2028 2029 2030 2031
GWh

The National Integrated Resource Plan Review and Update – Final Report
September 2016 Page 80 of 155
Table 5-6: Generation Forecast Summary
Low Reference High Year Energy Peak Energy Peak Energy Peak
(GWh) (MW) (GWh) (MW) (GWh) (MW) 2008 2,763 443.7 2,763 443.7 2,763 443.7 2009 2,802 470.1 2,802 470.1 2,802 470.1 2010 2,976 477.0 2,976 477.0 2,976 477.0 2011 3,231 511.7 3,231 511.7 3,231 511.7 2012 3,245 513.8 3,316 525.7 3,349 531.3 2013 3,482 542.8 3,601 562.8 3,668 573.8 2014 3,842 585.9 4,011 614.0 4,183 639.0 2015 4,381 648.1 4,829 710.6 5,667 812.0 2016 4,746 690.9 5,357 774.9 6,650 936.9
.. 2021 5,197 758.9 6,173 901.3 8,358 1178.8
.. 2026 5,424 811.5 6,608 988.5 8,911 1272.0
.. 2031 6,028 910.4 7,432 1124.4 9,865 1429.1 2011-2031 3.17% 2.92% 4.25% 4.02% 5.74% 5.27%
Figure 5-2: Overall Generation Forecasts – Energy (GWh)
5.3 The Namibian Economy
5.3.1 Background On the basis of the most recent figures, the Namibian economy achieved an annual growth rate of approximately 6.4 percent in 2014 when expressed at constant prices. This is above the long-run average annual growth rate of 4.4 percent observed over the period from 1990 to 2014. The total GDP for financial year 2014 at current prices is N$ 141,033 million (see Figure 5-3) or approximately US$5,820 per capita.
0
2,000
4,000
6,000
8,000
10,000
12,000
2010 2012 2014 2016 2018 2020 2022 2024 2026 2028 2030
GWh
Reference, High and Low Scenario Generation Forecast Totals (GWh)

The National Integrated Resource Plan Review and Update – Final Report
September 2016 Page 81 of 155
The Namibian economy is dominated by the services sector – the tertiary industries which include wholesale and retail trade, transport and storage, finance and insurance and public administration. This sector represents approximately 60 percent of total GDP for 2014. The average annual growth rate of this sector over the past 20 years expressed at constant prices is 4.8 percent.
The second largest sector of the economy is the secondary industries including manufacturing, construction, electricity and water. This sector represents approximately 18 percent of total GDP and has been growing at an average annual rate of 4.3 percent from 1990 to 2014.
The final general GDP category is the primary industries which include agriculture, forestry, fishing and mining. This sector represents approximately 16 percent of total GDP and as it has been growing at a lower rate than the other sectors its share of total GDP has actually been declining. Growth from 1990 has averaged 2.6 percent per year.
The largest component of the primary industrial sector is mining and quarrying representing 9.5 percent of the total GDP in 2014. The impact of this sector on the economy is much larger than the direct value-added figure would suggest. Mining has a large impact on both the secondary and the tertiary industries. In 2014, mining activities directly consumed 639 GWh or approximately 20 percent of total sales.
Mining is dominated by the diamond industry. While not a significant consumer of electricity, diamond mining represents two-thirds of mining sector value-added. Diamond production in 2009 was at one of its lowest levels in twenty years. While diamond production increased somewhat from 2010 to 2014, exports into 2015 have displayed a slight decline. The high inventory levels of global polished diamonds, which stemmed from weak demand, resulted in lower exported volumes of rough diamonds. The remainder of the mining sector includes gold, zinc, copper and uranium.
Namibia is the fifth largest producer of uranium in the world. Annual production is approximately 6 percent of world supply. The Rössing mine is the third largest uranium mine in the world. The current power consumption in the uranium mining sector represents nearly ten percent of the total peak power demand in Namibia. The effects of the incident at the Fukushima Daiichi nuclear plant in Japan are clear in the production values as international demand dropped.
While uranium prices in 2015 recovered somewhat from the lows of 2014, the weak export earnings into 2015 were primarily due to a decline in volumes of exports.

The National Integrated Resource Plan Review and Update – Final Report
September 2016 Page 82 of 155
Figure 5-3: Constant and Current Total GDP
The Namibian rate of inflation is measured by the National Planning Commission’s Consumer Price Index. The long-term growth rate (1990 to 2015) for the CPI index is 7.65 percent. Recent years have displayed continued low levels of inflation. The 2013 value was 5.6 percent, the 2014 rate was 5.4 percent and the rate for 2015 is 3.4 percent.
The value of the Namibian Dollar is tied to that of the South African Rand. The average exchange rate for 2011 was 7.21 Rand per US$ and it has displayed a continual rise since that year. The average exchange rate for 2015 was 12.41 Rand per US$ and the value has depreciated significantly in recent months to the 16 Rand to the US$ level.
Details on a number of the economic statistics discussed above are provided in Table 5-7.
0
20,000
40,000
60,000
80,000
100,000
120,000
140,000
160,000
1990
1991
1992
1993
1994
1995
1996
1997
1998
1999
2000
2001
2002
2003
2004
2005
2006
2007
2008
2009
2010
2011
2012
2013
2014
GDP
(N$
mill
ions
)Constant & Current GDP
GDP Constant Prices
GDP Current Prices

The National Integrated Resource Plan Review and Update – Final Report
September 2016 Page 83 of 155
Table 5-7: Selected Economic Statistics (1990 - 2014)
Gross Domestic Product
Current (at 2004 Prices) Average CPI
Total Agric. Secondary Tertiary Total Exch. CPI Annual Year GDP Fishing Mining Industries Industries GDP Rate Index Change
(millions of N$) (Rand/$US) (2012=100)
1990 7,256 2,186 1,921 4,907 13,585 23,998 2.5877 18.02 1991 8,319 2,480 2,276 4,669 14,729 25,957 2.7609 21.48 19.20% 1992 9,835 2,333 2,451 5,417 15,646 27,823 2.8516 23.57 9.73% 1993 10,517 2,530 1,895 5,300 16,304 27,384 3.2667 25.99 10.27% 1994 12,913 2,871 2,096 5,737 15,609 27,858 3.5497 29.06 11.81% 1995 14,300 2,819 2,223 5,760 16,367 28,944 3.6270 31.15 7.19% 1996 16,962 3,037 2,311 5,199 17,194 29,867 4.2964 34.25 9.95% 1997 18,905 2,851 2,406 5,607 17,916 31,128 4.6073 36.19 5.66% 1998 21,154 3,078 2,345 6,143 18,301 32,152 5.5316 39.39 8.84% 1999 23,332 3,238 2,542 5,944 18,974 33,236 6.1131 42.31 7.41% 2000 27,125 3,530 2,499 6,126 19,719 34,396 6.9484 46.79 10.59% 2001 30,535 3,290 2,290 6,571 20,351 34,802 8.6179 50.85 8.68% 2002 35,430 3,624 3,115 6,350 20,595 36,468 10.5135 57.37 12.82% 2003 37,304 3,774 2,860 7,235 22,022 38,014 7.5554 59.73 4.11% 2004 42,678 3,816 4,147 7,377 24,304 42,679 6.4426 61.25 2.54% 2005 46,177 4,024 3,697 8,026 24,822 43,758 6.3627 63.47 3.62% 2006 54,028 3,995 4,718 8,680 26,194 46,853 6.7676 67.27 5.99% 2007 61,583 3,623 4,742 9,456 28,205 49,430 7.0467 72.53 7.82% 2008 70,111 3,104 4,606 9,766 29,708 51,038 8.2530 80.92 11.57% 2009 75,214 3,161 2,694 9,786 31,136 50,482 8.4083 86.03 6.31% 2010 82,599 3,117 3,533 10,416 32,587 53,649 7.3107 89.00 3.45% 2011 90,108 3,525 3,253 10,902 34,188 56,694 7.2124 95.10 6.85% 2012 106,865 4,000 3,643 11,328 36,362 59,538 8.1569 100.00 5.15% 2013 123,150 3,597 4,017 12,307 38,984 63,327 9.4739 104.90 4.90% 2014 141,033 3,747 3,796 13,464 41,869 67,752 10.8374 109.80 4.67%
Growth 13.2% 2.27% 2.88% 4.30% 4.80% 4.42% 7.65%
Namibia's long-term economic growth potential is high as the country begins to make fuller use of its resources and expands from a comparatively small market base. An important factor will be developments in the mining sector, particularly the mining of diamonds and uranium. New uranium developments as well as the expansion of existing mines are contingent upon a recovery of the demand for and the price of uranium. While mining accounts for approximately 10 percent of GDP it represents a large portion of export earnings.
5.3.2 Projections Economic Activity Statistics of economic activity are reported by the National Planning Commission (NPC). The average annual GDP growth rate for the most recent 25 years was approximately 4.4 percent. The GDP growth rate for the last three years (2011 to 2014) grew from 5.1 percent to 5.7 percent in 2013 and finally to 6.4 percent in 2014.

The National Integrated Resource Plan Review and Update – Final Report
September 2016 Page 84 of 155
The Bank of Namibia produces a forecast based on the most recent GDP values. In its Economic Outlook Update published in December 2015 it forecast 4.5% growth in GDP for 2014/15, 4.3% for 2015/16 and 5.9% for 2016/17.
The Ministry of Finance through the Macro-Economic Working Group has prepared national economic forecasts published as part of the Fiscal Strategy in September 2014. The forecasts were developed within three development scenarios: Pessimistic, Most Likely and Optimistic. The projected GDP growth rates are displayed in Table 5-8.
Table 5-8: GDP Projections
Ministry of Finance Bank of Namibia Macroeconomic Framework Economic Outlook Sept 2014 Update Dec 2015 Most Pessimistic Likely Optimistic Baseline
2012/13 Act 5.1% 5.1% 5.1% Act 5.1%
2013/14 Est. 5.7% 6.2% 6.7% Act. 6.4%
2014/15 Proj. 5.1% 5.7% 6.1% Proj. 4.5%
2015/16 Proj. 4.9% 5.4% 5.9% Proj. 4.3%
2016/17 Proj. 4.5% 5.0% 5.5% Proj. 5.9%
2017/18 Proj. 3.9% 4.4% 4.9% Proj. ---
The development scenarios are built upon very similar assumptions. In the most general terms, the Most Likely and Baseline scenarios assume that the global economic recovery gradually proceeds, commodity prices (typically uranium and copper) stabilise and then grow as well as modest depreciation in the Namibian currency encouraging exports and tourism.
The Pessimistic scenario assumes a stalled recovery in the global economy, continued low commodity prices and an appreciation in the Namibia currency. The Optimistic scenario assumes faster than expected global economic growth, increasing commodity prices and some depreciation in the Namibian currency.
Electricity Prices The ECB approved increase in the NamPower electricity tariff rates in 2011 brought NamPower to the objective of pricing to meet Long Run Marginal Cost (LRMC). It is the expectation that ECB will endeavour to maintain the relationship between the tariff and LRMC. NamPower has expressed the opinion that several years of higher than average electricity price increases will be required to maintain a cost reflective tariff.
Eskom which has been the source of approximately 30 percent of the energy sold in Namibia (excluding Skorpion Mine) applied to the National Energy Regulator of South Africa for annual tariff increases in the order of 16 to 30 percent in each of the years 2008/09 to 2012/13. Tariff increases in the last two have been 8 percent per year. The proposed increase for 2015/16 is 12.7 percent. It is also expected that generation expansion in Namibia, particularly in the near-term, will involve relatively more expensive generation options.

The National Integrated Resource Plan Review and Update – Final Report
September 2016 Page 85 of 155
Table 5-9 displays proposed price increases for the load forecasting. The low demand scenario incorporates the highest expected tariff increase. A negative price elasticity of demand would mean that large price increases will result in lower growth. Similarly, the high demand scenario incorporates a lower expected rate of tariff increase.
Table 5-9: Tariff Scenarios
(Percentage Increase per Year)
Low Load Reference High Load
2012-17 20% 15% 10%
2018 15% 10% 5%
2019 &
10% 5% 5%
Source: Hatch
Population Growth On the basis of the 2011 Census, the Namibia Statistics Agency published a population projection to 2041 at the National and the Regional levels. Three variants of the projection were produced.
The principal inputs to the projection are assumptions as to the fertility, mortality and migration patterns within the population. Fertility is the main component in population change. There are various factors which influence the level of fertility. These include, among others, age of entry into child bearing, family planning, marital status, level of education and employment status. The factors are generally based on data from the 2011 Population and Housing Census. Fertility rates were developed for the initial and final years of the projection as well as a number of intermediate years. Rates were prepared at a national level, for each individual region and for each variant.
The main indicator of mortality is the life expectancy at birth, defined as the average number of years a new-born will be expected to live if it is exposed to the mortality pattern for the year under consideration. The process of coming up with assumptions on the future trend of life expectancy at birth involved the examination of the past trend as well as the 2011 census results relating to mortality. As with the fertility rates, mortality rates were developed for the initial, a number of intermediate and the final year of the projection both at the national and region levels for each variant.
There are no statistics on international migration. It was therefore assumed that, at the national level migration is not significant. This implies that in and out migrants will cancel each other out. However, there was significant internal migration between the regions observed in the 2011 census. The principal migration pattern is from the northern regions to the urban areas in the regions of Khomas, Erongo and Karas.
Table 5-10 summarises the national population projections for all three variants. For the medium variant the expected average annual rate of population growth for Namibia is 1.7% over the 30-year forecast period. This indicates a population doubling rate of 41.2 years.
The average annual rates of population growth for the low and high variants are 1.41 percent and 1.97 percent, respectively. Over the 30-year period, the difference between the high and the low projections is approximately half a million people.

The National Integrated Resource Plan Review and Update – Final Report
September 2016 Page 86 of 155
Table 5-10: Population Projection, National
Year Low Variant Medium Variant High Variant 2011 2,116,077 2,116,077 2,116,077 2012 2,155,326 2,155,440 2,155,555 2013 2,195,628 2,196,086 2,196,547 2014 2,236,853 2,237,894 2,238,938 2015 2,278,843 2,280,716 2,282,591 2016 2,321,427 2,324,388 2,327,350 2017 2,364,431 2,368,747 2,373,062 2018 2,407,697 2,413,643 2,419,587 2019 2,451,079 2,458,936 2,466,792 2020 2,494,439 2,504,498 2,514,555 2021 2,537,669 2,550,226 2,562,779 2022 2,580,679 2,596,037 2,611,390 2023 2,623,388 2,641,857 2,660,322 2024 2,665,736 2,687,636 2,709,531 2025 2,707,680 2,733,338 2,758,993 2026 2,749,194 2,778,948 2,808,699 2027 2,790,265 2,824,465 2,858,661 2028 2,830,885 2,869,897 2,908,907 2029 2,871,045 2,915,254 2,959,467 2030 2,910,729 2,960,542 3,010,364 2031 2,949,906 3,005,745 3,061,606 2032 2,988,530 3,050,838 3,113,184 2033 3,026,540 3,095,780 3,165,085 2034 3,063,861 3,140,519 3,217,282 2035 3,100,421 3,185,005 3,269,750 2036 3,136,159 3,229,197 3,322,477 2037 3,171,009 3,273,051 3,375,444 2038 3,204,884 3,316,498 3,428,606 2039 3,237,696 3,359,466 3,481,915 2040 3,269,359 3,401,887 3,535,327 2041 3,299,805 3,443,709 3,588,815
Source: NPC
5.4 Background to the Load Forecast
5.4.1 The Demand for Electricity The demand for electricity is a derived demand. Electricity is consumed as a means to an end such as cooking or lighting and cannot be used without equipment designed for that specific purpose. The demand for electricity is therefore related to the stock of capital equipment as well as the demand for the output of this equipment. The principal factors affecting the amount of electricity demanded are:
• The Stock of Electricity Consuming Equipment. This includes the housing stock, whether this is new or existing housing in an urban or a rural setting. Consumers in new housing have a choice for major equipment purchases while consumers in existing houses have a fixed stock of equipment which is unlikely to change significantly for many years. Another important consideration is the level of technological advancement of the stock of equipment and the rate of technological change. Two recent examples of such change are the increase in the number of small computers, smart phones, tablets and other electronic equipment and the development and introduction of energy efficient light bulbs.

The National Integrated Resource Plan Review and Update – Final Report
September 2016 Page 87 of 155
• Income/Economic Activity. In the residential sector it is expected that the higher the household income, the larger is the demand for electricity in that household as a result of the larger stock of electrical consuming equipment. In the commercial and industrial sectors, higher economic activity indicates higher demand for goods and services.
• Prices. In general, the higher the price of electricity, relative to the prices of other forms of energy, the lower the relative demand for electricity. Similarly, the higher the price of electricity consuming equipment when compared to the price of the equipment required for other forms of energy, the lower the demand for this equipment and therefore the lower the demand for electricity.
• Population. The number and size of households has a big impact on the residential sector load and can also have a large impact on the commercial sector load.
• Other Factors. The main factors in this area are climate and weather. Climate affects the stock of equipment while weather affects its intensity of use. If the time periods under analysis are shorter, for example weekly or daily, more detailed demand factors would be required to describe system loading.
While some of the data associated with the demand for electricity is either not available or would require a detailed power market survey to obtain (for example, the stock and intensity of use of electrical equipment), much is recorded in sufficient quantity and detail to be used for regression studies. In many cases, however, proxies for the above data have been adopted; for example, Gross Domestic Product as a proxy for household income.
5.4.2 Adjustments to the Data Series The data base used for the regression analysis covers the period from 1989 - 2014 inclusive. Electricity consumption data is based on the NamPower Annual Report values for ‘Units sold in Namibia’. This data includes sales by NamPower to its direct customers (Mines, Industries and Water Pumping) as well as to distributors such as NORED and CENORED. These data exclude sales associated with the Skorpion Mine in southern Namibia which is supplied directly from Eskom.
A number of other data sources were investigated. These data included estimates of sales by customer category; however, there was a lack of consistency between these data and the Annual Report figures.
One adjustment was, however, required of the Annual Report data. This adjustment converted the reported values from financial years to calendar years to match the available independent variables. The adjustment was based on a review of the detailed data in the original NIRP study.
19YY = 0.50 x 19XX.YY + 0.50 x 19YY.ZZ (1)
5.4.3 Regression Analysis Regression analysis was carried out to prepare the load forecast. This analysis was based on the logarithms of both the dependent and the independent variables. Regressions based on absolute values of the variables were tested, but the correlations were poor. The general equation considered in the analysis is:
Y = a * Xb * Zc (2)

The National Integrated Resource Plan Review and Update – Final Report
September 2016 Page 88 of 155
This equation is linear in the parameters (a, b, and c) when expressed in double logarithmic form:
Log(Y) = log(a) + b Log(X) + c log(Z) (3)
One advantage of the double logarithmic form is that the parameters derived from the regressions represent the elasticity of demand relative to the independent variable. The parameters in this particular model are constant elasticities of demand.
Elasticity is an important concept. It is the measure of how much one variable changes in response to changes in another variable. Specifically, it is the ratio of the percentage change in the dependent variable to that of the independent variable, all other variables held constant.
There are three specific elasticities:
• Income Elasticity relates changes in the amount of electricity demanded to changes in consumers' income. In general, income elasticities are positive; i.e. an increase in income will increase electricity consumption.
• Price Elasticity relates changes in the amount of electricity demanded to changes in the price of electricity. Typically, price elasticities are expected to be negative; i.e. an increase in price will decrease electricity consumption.
• Cross-price Elasticity relates changes in the amount of electricity demanded to changes in the price of related goods. There are two general classes of related goods; namely, substitutes to electricity consumption and complements to electricity consumption. Typically, if the cross price elasticity of the related good is negative, i.e. an increase in price decreases electricity consumption, the good is said to be a complement, whereas if the elasticity is positive, it is said to be a substitute.
• Elasticities are also classified by their absolute value. An elasticity value which is greater than 1 (absolute value) is said to be elastic, that is, a change in the independent variable is related to a more than proportional change in the dependent variable. If the elasticity value is exactly 1, the elasticity is unitary and if the absolute value of the elasticity is less than one, the relationship between the variables is inelastic. An inelastic relationship indicates that a change in the independent variable is related to a less than proportional change in the dependent variable.
5.4.4 Regression Results A variety of relationships between electricity sales and the available exogenous variable were tested in the preparation of this forecast update. Specifically, the following tests were undertaken:
• Sales data from NamPower’s Annual Reports was converted to a calendar basis and tested against GDP expressed at constant prices.
• An alternative NamPower sales database which identified sales by broad consumption categories was converted to a calendar basis and tested against GDP expressed at constant prices.

The National Integrated Resource Plan Review and Update – Final Report
September 2016 Page 89 of 155
• The alternative NamPower sales database excluding exports and mining sales was tested against GDP expressed at constant prices.
• The sales data from NamPower’s Annual Reports was converted to a calendar basis and tested against GDP expressed at constant prices and the reported average price of power in Namibia converted to a constant price basis.
• Sales data from NamPower’s Annual Reports was converted to a calendar basis and tested against GDP expressed at constant prices, the reported average price of power in Namibia converted to a constant price basis as well as the estimated total annual population figures (based on census data points).
Overall sales have a long-term growth rate of 3.1 percent per annum over the 1990 to 2014 period. Namibian GDP has achieved a long-term growth rate of 4.4 percent per annum over the same period. Total sales display a strong correlation with total GDP with a coefficient of determination of 0.98. Figure 5-4 shows the annual GDP and electricity sales data for the period 1990 to 2014.
Unfortunately, the regression analysis could not identify a statistically valid regression model that includes the price variable or the national population. For both variables the relationship to sales was not significant and in fact the price variable was also of the wrong sign. As a result, the base linear regression of sales versus constant price GDP was used to estimate the organic growth over the forecast period.
The equation used is:
Sales (GWh) = 551.77 + 0.0386 * GDP(N$ millions) (44.80) (0.00105) t=12.3 t=36.7 n=25
Sales and GDP are expressed on a calendar year basis.

The National Integrated Resource Plan Review and Update – Final Report
September 2016 Page 90 of 155
Figure 5-4: Historic GDP and Sales Data
5.4.5 Development Options – Step Loads As a result of interviews with NamPower, the distributors and several large industries, a number of specific new loads were determined based on a number of planned developments and expansions. The new loads attributed to the distributors are considered likely to develop in one form or another. The mining expansion plans and new developments are largely dependent upon the future demand for and the commodity price of uranium, copper and gold.
Mining The development of the Husab Mine, adjacent to the Rössing facility, is well advanced in terms of construction and pre-operational mining activities. It is assumed to proceed in both the reference and high scenarios.
The step load list also includes a number of diamond, phosphate, gold and copper properties as well as a smelter. Some of these have been included in all scenarios and some are included only in the high load forecast scenario. The step loads for the mining sector are listed in Table 5-11.
Each step load is assigned a probability category. This probability does not necessarily apply to an individual load but rather to the group as a whole. As a group, loads with a high probability have been assigned a probability value of 75 percent. Medium probability assumes a 50 percent value and low probability a 35 percent value.
0
500
1000
1500
2000
2500
3000
3500
0
10,000
20,000
30,000
40,000
50,000
60,000
70,000
80,000
1990
1991
1992
1993
1994
1995
1996
1997
1998
1999
2000
2001
2002
2003
2004
2005
2006
2007
2008
2009
2010
2011
2012
2013
2014
Sales
in N
amibi
a (GW
h)
GDP (
milli
ons N
$ at c
onsta
nt p
rices
)
GDP
Sales
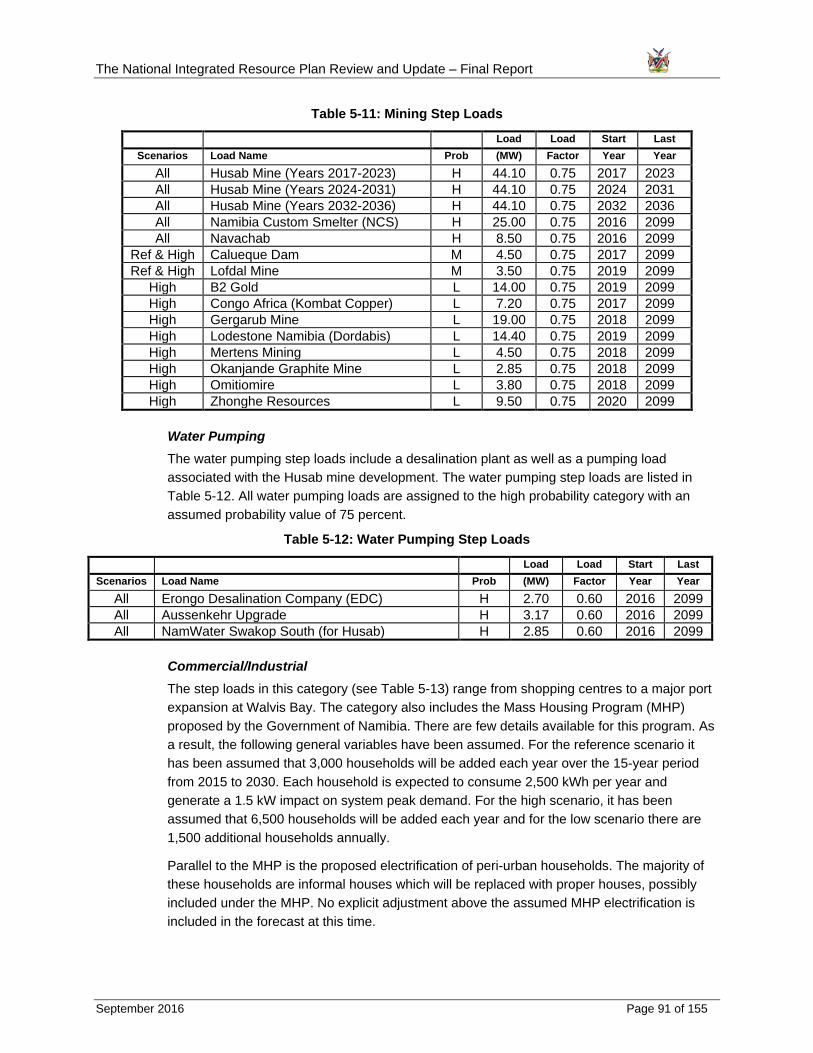
The National Integrated Resource Plan Review and Update – Final Report
September 2016 Page 91 of 155
Table 5-11: Mining Step Loads
Load Load Start Last Scenarios Load Name Prob (MW) Factor Year Year
All Husab Mine (Years 2017-2023) H 44.10 0.75 2017 2023 All Husab Mine (Years 2024-2031) H 44.10 0.75 2024 2031 All Husab Mine (Years 2032-2036) H 44.10 0.75 2032 2036 All Namibia Custom Smelter (NCS) H 25.00 0.75 2016 2099 All Navachab H 8.50 0.75 2016 2099
Ref & High Calueque Dam M 4.50 0.75 2017 2099 Ref & High Lofdal Mine M 3.50 0.75 2019 2099
High B2 Gold L 14.00 0.75 2019 2099 High Congo Africa (Kombat Copper) L 7.20 0.75 2017 2099 High Gergarub Mine L 19.00 0.75 2018 2099 High Lodestone Namibia (Dordabis) L 14.40 0.75 2019 2099 High Mertens Mining L 4.50 0.75 2018 2099 High Okanjande Graphite Mine L 2.85 0.75 2018 2099 High Omitiomire L 3.80 0.75 2018 2099 High Zhonghe Resources L 9.50 0.75 2020 2099
Water Pumping The water pumping step loads include a desalination plant as well as a pumping load associated with the Husab mine development. The water pumping step loads are listed in Table 5-12. All water pumping loads are assigned to the high probability category with an assumed probability value of 75 percent.
Table 5-12: Water Pumping Step Loads
Load Load Start Last Scenarios Load Name Prob (MW) Factor Year Year
All Erongo Desalination Company (EDC) H 2.70 0.60 2016 2099 All Aussenkehr Upgrade H 3.17 0.60 2016 2099 All NamWater Swakop South (for Husab) H 2.85 0.60 2016 2099
Commercial/Industrial The step loads in this category (see Table 5-13) range from shopping centres to a major port expansion at Walvis Bay. The category also includes the Mass Housing Program (MHP) proposed by the Government of Namibia. There are few details available for this program. As a result, the following general variables have been assumed. For the reference scenario it has been assumed that 3,000 households will be added each year over the 15-year period from 2015 to 2030. Each household is expected to consume 2,500 kWh per year and generate a 1.5 kW impact on system peak demand. For the high scenario, it has been assumed that 6,500 households will be added each year and for the low scenario there are 1,500 additional households annually.
Parallel to the MHP is the proposed electrification of peri-urban households. The majority of these households are informal houses which will be replaced with proper houses, possibly included under the MHP. No explicit adjustment above the assumed MHP electrification is included in the forecast at this time.

The National Integrated Resource Plan Review and Update – Final Report
September 2016 Page 92 of 155
Table 5-13: Commercial/Industrial Step Loads
Load Load Start Last Scenario Load Name Prob (MW) Factor Year Year
All Lady Pohamba Private Hospital H 1.97 0.60 2016 2099 All Karasburg upgrade H 0.90 0.60 2017 2099 All Brakwater development H 3.60 0.60 2016 2099 All Cuito Upgrade H 5.40 0.60 2018 2099 All Erongo Red NamPort (Port extension) H 13.00 0.60 2017 2099
Ref & High
Cuando Cubango M 5.10 0.60 2018 2099
Ref & High
Okombahe Upgrade M 0.95 0.60 2018 2099
Ref & High
Ruby Upgrade M 3.80 0.60 2016 2099
All Otavi Rebar L 31.50 0.60 2018 2099 Ref Mass Housing Program – Years 2016-2020 M 67.5 0.20 2016 2020 Ref Mass Housing Program – Years 2021-2025 M 67.5 0.20 2021 2025 Ref Mass Housing Program – Years 2026-2099 M 67.5 0.20 2026 2099 Low Mass Housing Program – Years 2016-2020 L 33.8 0.20 2016 2020 Low Mass Housing Program – Years 2021-2025 L 33.8 0.20 2021 2025 Low Mass Housing Program – Years 2026-2099 L 33.8 0.20 2026 2099 High Mass Housing Program – Years 2016-2020 L 146.3 0.20 2016 2020 High Mass Housing Program – Years 2021-2025 L 146.3 0.20 2021 2025 High Mass Housing Program – Years 2026-2099 L 146.3 0.20 2026 2099
5.4.6 Demand Side Management Programs and Renewable Energy A number of DSM programs are included in the forecast. There are three specific areas addressed in these programs:
• LED Lighting - NamPower’s DSM program includes the distribution of one million LED light bulbs as replacement for incandescent bulbs. The operational assumptions include that a 40 W incandescent bulb will be replaced by a 5 W LED bulb for a net saving of 35 W per replacement. Each bulb is assumed to be illuminated for 5 hours per day and that the illumination will be at an 80 percent coincidence to the system peak.
• Solar Thermal – NamPower has also considered a program that would replace 20,000 electric water heaters with solar heaters. While it is understood that NamPower is re-evaluating this program, other agencies such as the Namibia Energy Institute are actively involved in this area. This program has been included in the forecast as it is considered that such replacements would likely eventually be undertaken by consumers with or without the NamPower program. For the forecast it is assumed that this replacement will occur over ten years and that each unit replaced has a peak of 2.5 kW at a load factor of 0.25. The units are also assumed to operate at a 20 percent coincidence to the system peak.

The National Integrated Resource Plan Review and Update – Final Report
September 2016 Page 93 of 155
• Solar PV – The expectation is that the current trend of behind the meter installations of solar PV panels will continue. There are no official surveys providing estimates of the number of solar PV installations currently in use or on the projected number of future installations. It has been assumed that in each forecast year an additional 5 MW of solar PV capacity will be installed with an expected load factor of 0.20. It is also assumed that these installations will not impact the system peak demand as the system peak load is typically in the early evening when solar PV production is at, or close to, zero. It is noted that additional solar PV installations are included in the generation analysis.
5.5 Forecast Results
5.5.1 Forecast Summary
Three forecast scenarios have been prepared based on the growth rates presented in the previous sub-sections. The Low, Reference and High sales forecast results are listed in Table 5-14. The table shows the historical sales for 2014, the estimate for 2015 and the remaining years of the forecast to 2035. The corresponding energy generation and peak demand values are presented in Table 5-15. It is expected that the shape of the daily load curve will not change significantly over the forecast period. The annual peak demand has typically been recorded during the evening hours in the months of June or July (for example between 7 and 8 PM on June 2 for the year 2014/2015). While increasing LED lighting will have a moderating impact on the peak demand, increasing the amount of behind the meter solar PV will reduce the need for grid supply during daylight hours but will not impact the evening peak demand.
The Low, Reference and High forecast results are also displayed in Figure 5-5 -and Figure 5-6 in terms of the energy sales forecast and the peak demand forecast, respectively.
Table 5-14: Sales Forecast Summary Low Reference High
Year Sales Sales Sales (GWh) (GWh) (GWh)
2014 3,184 3,184 3,184 2015 3,387 3,402 3,413 2016 3,692 3,728 3,755 2017 3,927 3,998 4,050 2018 4,099 4,201 4,311 2019 4,196 4,333 4,556 2020 4,320 4,483 4,789 2021 4,461 4,647 5,001 2022 4,572 4,784 5,163 2023 4,688 4,927 5,334 2024 4,823 5,091 5,529 2025 4,966 5,265 5,735 2026 5,115 5,446 5,951 2027 5,280 5,647 6,189 2028 5,445 5,849 6,432 2029 5,616 6,060 6,685 2030 5,795 6,281 6,953 2031 5,980 6,508 7,227 2032 6,137 6,711 7,480 2033 6,337 6,959 7,783 2034 6,517 7,190 8,073 2035 6,733 7,461 8,407
2015-2035 3.50% 4.00% 4.61%

The National Integrated Resource Plan Review and Update – Final Report
September 2016 Page 94 of 155
Table 5-15: Generation Forecast Summary Low Reference High
Year Energy Peak Energy Peak Energy Peak (GWh) (MW) (GWh) (MW) (GWh) (MW)
2014 3,654 554.0 3,654 554.0 3,654 554.0 2015 3,853 597.0 3,871 597.0 3,883 597.0 2016 4,200 638.2 4,241 645.7 4,272 651.1 2017 4,468 678.3 4,549 692.5 4,608 702.9 2018 4,664 712.3 4,780 733.4 4,905 754.3 2019 4,774 730.1 4,930 758.4 5,184 800.9 2020 4,916 752.3 5,100 785.9 5,448 842.1 2021 5,076 777.2 5,288 815.9 5,689 880.6 2022 5,202 797.6 5,443 841.7 5,875 911.8 2023 5,334 818.8 5,606 868.5 6,069 944.0 2024 5,488 843.0 5,793 898.8 6,291 980.4 2025 5,651 868.6 5,991 930.7 6,526 1,018.7 2026 5,819 895.2 6,197 963.8 6,771 1,058.4 2027 6,007 925.3 6,425 1,001.0 7,042 1,102.9 2028 6,195 955.5 6,655 1,038.7 7,318 1,148.3 2029 6,390 986.8 6,895 1,077.6 7,606 1,195.3 2030 6,594 1,019.4 7,147 1,118.5 7,911 1,244.9 2031 6,803 1,052.4 7,405 1,158.7 8,223 1,293.2 2032 6,982 1,081.4 7,636 1,195.4 8,511 1,338.6 2033 7,210 1,117.0 7,918 1,239.3 8,855 1,391.7 2034 7,415 1,149.7 8,181 1,280.7 9,185 1,443.2 2035 7,661 1,188.1 8,490 1,328.5 9,565 1,501.7
2015-2035 3.50% 3.50% 4.00% 4.08% 4.61% 4.72%
Figure 5-5: Overall Sales Forecasts – Energy (GWh)
Forecast Sales Summary
0
1,000
2,000
3,000
4,000
5,000
6,000
7,000
8,000
9,000
2014
2015
2016
2017
2018
2019
2020
2021
2022
2023
2024
2025
2026
2027
2028
2029
2030
2031
2032
2033
2034
2035
Sale
s (GW
h)
Reference
Low
High

The National Integrated Resource Plan Review and Update – Final Report
September 2016 Page 95 of 155
Figure 5-6: Overall Generation Forecasts – Peak Demand (MW)
5.5.2 Reference Forecast The overall growth rate in the reference scenario is 4.0 percent over the entire forecast period to 2035. This compares to the historical long term growth rate of 3.1 percent.
Table 5-16 sumarises the reference forecast in terms of both sales and generation energy (GWh) and peak demand (MW). Figure 5-7 compares the reference energy forecast for both sales and generation.
Table 5-16: Reference Forecast Summary
Sales Generation Generation Year Energy Energy Peak
(GWh) (GWh) (MW) 2014 3,184 3,654 554.0 2015 3,402 3,871 597.0 2016 3,728 4,241 645.7 2017 3,998 4,549 692.5 2018 4,201 4,780 733.4 2019 4,333 4,930 758.4 2020 4,483 5,100 785.9 2021 4,647 5,288 815.9 2022 4,784 5,443 841.7 2023 4,927 5,606 868.5 2024 5,091 5,793 898.8 2025 5,265 5,991 930.7 2030 6,281 7,147 1,118.5 2035 7,461 8,490 1,328.5
2015-2035 4.00% 4.00% 4.08%
Forecast Peak Demand Summary
0
200
400
600
800
1,000
1,200
1,400
1,600
2014
2015
2016
2017
2018
2019
2020
2021
2022
2023
2024
2025
2026
2027
2028
2029
2030
2031
2032
2033
2034
2035
Peak
Dem
and
(MW
) Reference
Low
High

The National Integrated Resource Plan Review and Update – Final Report
September 2016 Page 96 of 155
Figure 5-7: Reference Sales and Generation (GWh)
Table 5-17 presents the forecast components in energy (GWh) terms. The forecast is segregated into the organic load – the load that is currently defined on the system and further development of that load over time - and the step loads, new loads that are considered too large to be associated with organic growth as well as the DSM reduction. The average growth in the organic load is 3.88 percent. The table also displays the estimated transmission losses.
Table 5-17: Reference Forecast Energy Components (GWh)
Sales Sales DSM Sales Transmission Generation Year Organic Step Reduction Total Losses Total
(GWh) (GWh) (GWh) (GWh) (GWh) (GWh) 2014 3,184 0 0 3,184 470 3,654 2015 3,402 0 0 3,402 469 3,871 2016 3,552 200 -24 3,728 514 4,241 2017 3,697 352 -51 3,998 551 4,549 2018 3,832 448 -78 4,201 579 4,780 2019 3,973 466 -106 4,333 597 4,930 2020 4,119 496 -133 4,483 618 5,100 2021 4,273 535 -160 4,647 640 5,288 2022 4,433 539 -188 4,784 659 5,443 2023 4,600 543 -215 4,927 679 5,606 2024 4,774 560 -243 5,091 702 5,793 2025 4,956 579 -270 5,265 725 5,991 2030 5,994 605 -318 6,281 865 7,147 2035 7,280 542 -361 7,461 1,028 8,490
2015-2035 3.88% 4.00% 4.00%
Energy Forecast - Reference
0
1,000
2,000
3,000
4,000
5,000
6,000
7,000
8,000
9,000
2014
2015
2016
2017
2018
2019
2020
2021
2022
2023
2024
2025
2026
2027
2028
2029
2030
2031
2032
2033
2034
2035
Ener
gy (G
Wh)
Sales
Generation

The National Integrated Resource Plan Review and Update – Final Report
September 2016 Page 97 of 155
The development of the Organic, Step, DSM and Transmission portions of the reference energy forecast are displayed in Figure 5-8. Figure 5-9 displays the forecast path for the organic and total sales over the entire forecast period.
Figure 5-8: Reference Forecast Components (GWh)
Figure 5-9: Reference Forecast – Organic vs. Total Sales (GWh)
Forecast Energy Components - Reference
-1,000
0
1,000
2,000
3,000
4,000
5,000
6,000
7,000
8,000
9,000
2015
2020
2025
2030
2035
Ener
gy (G
Wh)
Transmission Loss
Step Load
Organic
DSM Reduction
Organic Portion - Reference
0
1,000
2,000
3,000
4,000
5,000
6,000
7,000
8,000
9,000
10,000
2005
2006
2007
2008
2009
2010
2011
2012
2013
2014
2015
2016
2017
2018
2019
2020
2021
2022
2023
2024
2025
2026
2027
2028
2029
2030
2031
2032
2033
2034
2035
Ener
gy (G
Wh)
Total Sales less DSM
Organic

The National Integrated Resource Plan Review and Update – Final Report
September 2016 Page 98 of 155
5.5.3 Low Scenario The low scenario assumes the pessimistic GDP forecast and the expectation that lower uranium prices will not induce significant new uranium mining developments, thus limiting the mining step loads.
The overall growth rate in the low scenario is 3.5 percent over the entire forecast period to 2035.
Table 5-18 sumarises the low forecast in terms of both sales and generation energy (GWh) and peak demand (MW). Figure 5-10 displays the low energy forecast for both sales and generation.
Table 5-18: Low Forecast Summary (GWh)
Sales Generation Generation Year Energy Energy Peak
(GWh) (GWh) (MW) 2014 3,184 3,654 554.0 2015 3,387 3,853 597.0 2016 3,692 4,200 638.2 2017 3,927 4,468 678.3 2018 4,099 4,664 712.3 2019 4,196 4,774 730.1 2020 4,320 4,916 752.3 2021 4,461 5,076 777.2 2022 4,572 5,202 797.6 2023 4,688 5,334 818.8 2024 4,823 5,488 843.0 2025 4,966 5,651 868.6 2030 5,795 6,594 1,019.4 2035 6,733 7,661 1,188.1
2015-2035 3.50% 3.50% 3.50%

The National Integrated Resource Plan Review and Update – Final Report
September 2016 Page 99 of 155
Figure 5-10: Low Sales and Generation (GWh)
Table 5-19 presents the forecast energy components. The forecast is segregated into the organic load – the load that is currently defined on the system - and the step loads as well as the estimated DSM reduction and transmission losses. The average growth in the organic load is 3.4 percent.
Table 5-19: Low Forecast Energy Components (GWh) Sales Sales DSM Sales Transmission Generation
Year Organic Step Reduction Total Losses Total (GWh) (GWh) (GWh) (GWh) (GWh) (GWh)
2014 3,184 0 0 3,184 470 3,654 2015 3,387 0 0 3,387 467 3,853 2016 3,521 194 -24 3,692 509 4,200 2017 3,651 327 -51 3,927 541 4,468 2018 3,769 409 -78 4,099 565 4,664 2019 3,891 411 -106 4,196 578 4,774 2020 4,018 436 -133 4,320 595 4,916 2021 4,150 472 -160 4,461 615 5,076 2022 4,287 473 -188 4,572 630 5,202 2023 4,429 475 -215 4,688 646 5,334 2024 4,577 489 -243 4,823 665 5,488 2025 4,730 506 -270 4,966 684 5,651 2030 5,593 519 -318 5,795 798 6,594 2035 6,638 456 -361 6,733 928 7,661
2015-2035 3.4% 3.5% 3.5%
The development of the Organic, Step, DSM and Transmission portions of the low forecast are displayed in Figure 5-11. Figure 5-12 displays the forecast path for the organic and total sales components over the entire forecast period.
Energy Forecast - Low
0
1,000
2,000
3,000
4,000
5,000
6,000
7,000
8,000
9,000
10,000
2014
2015
2016
2017
2018
2019
2020
2021
2022
2023
2024
2025
2026
2027
2028
2029
2030
2031
2032
2033
2034
2035
Ener
gy (G
Wh)
Sales
Generation

The National Integrated Resource Plan Review and Update – Final Report
September 2016 Page 100 of 155
Figure 5-11: Low Forecast Components (GWh)
Figure 5-12: Low Forecast Organic vs. Total Sales (GWh)
Forecast Energy Components - Low
-1,000
0
1,000
2,000
3,000
4,000
5,000
6,000
7,000
8,000
9,000
10,000
2015
2020
2025
2030
2035
Ener
gy (G
Wh)
Transmission Loss
Step Load
Organic
DSM Reduction
Organic Portion - Low
0
1,000
2,000
3,000
4,000
5,000
6,000
7,000
8,000
9,000
10,000
2005
2006
2007
2008
2009
2010
2011
2012
2013
2014
2015
2016
2017
2018
2019
2020
2021
2022
2023
2024
2025
2026
2027
2028
2029
2030
2031
2032
2033
2034
2035
Ener
gy (G
Wh)
Total Sales less DSM
Organic

The National Integrated Resource Plan Review and Update – Final Report
September 2016 Page 101 of 155
5.5.4 High Scenario The high scenario assumes the optimistic GDP forecast and the expectation that uranium prices will be higher and therefore will encourage additional mining developments leading to more step loads.
The overall growth rate in the high scenario is 4.61 percent over the entire forecast period to 2035.
Table 5-20 sumarises the high forecast in terms of both sales and generation energy (GWh) and peak demand (MW). Figure 5-13 displays the high energy forecast for both sales and generation.
Table 5-20: High Forecast Summary (GWh)
Sales Generation Generation Year Energy Energy Peak
(GWh) (GWh) (MW) 2014 3,184 3,654 554.0 2015 3,413 3,883 597.0 2016 3,755 4,272 651.1 2017 4,050 4,608 702.9 2018 4,311 4,905 754.3 2019 4,556 5,184 800.9 2020 4,789 5,448 842.1 2021 5,001 5,689 880.6 2022 5,163 5,875 911.8 2023 5,334 6,069 944.0 2024 5,529 6,291 980.4 2025 5,735 6,526 1,018.7 2030 6,953 7,911 1,244.9 2035 8,407 9,565 1,501.7
2015-2035 4.61% 4.61% 4.72%

The National Integrated Resource Plan Review and Update – Final Report
September 2016 Page 102 of 155
Figure 5-13: High Sales and Generation (GWh)
Table 5-21 presents the forecast summary in energy (GWh). The forecast is segregated into the organic load – the load that is currently defined on the system - and the step loads as well as the estimated DSM reduction and the transmission losses. The average growth in the organic load is 4.3 percent.
Table 5-21: High Forecast Energy Components (GWh)
Sales Sales DSM Sales Transmission Generation Year Organic Step Reduction Total Losses Total
(GWh) (GWh) (GWh) (GWh) (GWh) (GWh) 2014 3,184 0 0 3,184 470 3,654 2015 3,413 0 0 3,413 470 3,883 2016 3,576 202 -24 3,755 517 4,272 2017 3,738 363 -51 4,050 558 4,608 2018 3,890 499 -78 4,311 594 4,905 2019 4,050 612 -106 4,556 628 5,184 2020 4,217 705 -133 4,789 660 5,448 2021 4,392 769 -160 5,001 689 5,689 2022 4,576 775 -188 5,163 711 5,875 2023 4,769 780 -215 5,334 735 6,069 2024 4,972 800 -243 5,529 762 6,291 2025 5,184 821 -270 5,735 790 6,526 2030 6,413 857 -318 6,953 958 7,911 2035 7,974 794 -361 8,407 1,158 9,565
2015-2035 4.3% 4.6% 470 4.6%
Energy Forecast - High
0
1,000
2,000
3,000
4,000
5,000
6,000
7,000
8,000
9,000
10,000
2014
2015
2016
2017
2018
2019
2020
2021
2022
2023
2024
2025
2026
2027
2028
2029
2030
2031
2032
2033
2034
2035
Ener
gy (G
Wh)
Sales
Generation

The National Integrated Resource Plan Review and Update – Final Report
September 2016 Page 103 of 155
The development of the Organic, Step, DSM and Transmission portions of the peak high forecast are displayed in Figure 5-14. Figure 5-15 displays the forecast path for the organic and step load components over the entire forecast period.
Figure 5-14: High Forecast Components (GWh)
Forecast Energy Components - High
-1,000
0
1,000
2,000
3,000
4,000
5,000
6,000
7,000
8,000
9,000
10,00020
15
2020
2025
2030
2035
Ener
gy (G
Wh)
Transmission Loss
Step Load
Organic
DSM Reduction

The National Integrated Resource Plan Review and Update – Final Report
September 2016 Page 104 of 155
Figure 5-15: High Forecast Organic vs. Total Sales (GWh)
5.6 Supply-Demand Balance Comparing the generation supply capability with the projected demand as developed in the load forecast provides an indication of the balance between the two. For these comparisons, supply includes existing and committed power plants in Namibia, import contracts and projected retirements of generation capacity. Supply-demand balances for both energy (kWh) and capacity (MW) are important as either or both can be constraints at different times of the year if there are seasonal variations in supply and/or load.
The projected monthly energy and capacity balances over the next four years, i.e. from 2016 to 2019 are graphically illustrated in Figure 5-16, Figure 5-17 and Figure 5-18. It is important to note that the supply energy and capacity are the maximum amounts which could be achieved, i.e. no allowances have been made for planned or forced outages of power plants, interruption of imports under import contracts and for reserve capacity. It is also possible that there are circumstances where system load demand is relatively low but the supply capacity is relatively high, resulting in a situation where the supply capacity could not be fully utilised.
Figure 5-16 and Figure 5-17 show the monthly energy and capacity balances, taking into account all domestic power plants and import contracts. One could see from these two figures that the system would experience energy shortages during several months of a year while the available capacity is relatively adequate.
Figure 5-18 shows the monthly energy and capacity balances based on the requirements of the White Paper on Energy Policy. Relative to the requirements of the Energy Policy, the system would be short of both energy and capacity over all months of the four years.
Organic Portion - High
0
1,000
2,000
3,000
4,000
5,000
6,000
7,000
8,000
9,000
10,000
2005
2006
2007
2008
2009
2010
2011
2012
2013
2014
2015
2016
2017
2018
2019
2020
2021
2022
2023
2024
2025
2026
2027
2028
2029
2030
2031
2032
2033
2034
2035
Ener
gy (G
Wh)
Total Sales less DSM
Organic

The National Integrated Resource Plan Review and Update – Final Report
September 2016 Page 105 of 155
Figure 5-16: Monthly Energy Balance – All Inclusive
Figure 5-17: Monthly Capacity Balance – All Inclusive

The National Integrated Resource Plan Review and Update – Final Report
September 2016 Page 106 of 155
Figure 5-18: Monthly Energy Capacity Balance – Energy Policy

The National Integrated Resource Plan Review and Update – Final Report
September 2016 Page 107 of 155
6. Formulation of Expansion Scenarios 6.1 Evaluation of Available Generation Options
Based on the information on generation resources and technologies described in Section 1, one could conclude that for this assignment, no further consideration need be given to generation from conventional nuclear, water power on the Okavango and Orange river systems, small modular nuclear reactors, municipal solid waste and geothermal. The remaining generation options could be divided into the following six categories:
1. Conventional base load – NG CCGT 450 MW, LNG CCGT 150 MW, LNG GT 50 MW, LNG GT 100 MW, Coal CFB 150 MW, Coal PC 150 MW, ICRE 20 MW and LFO CC 150 MW.
2. Conventional peaking – ICRE 20 MW, LFO GT 50 MW, LFO GT 100 MW.
3. Dispatchable renewable base load and mid-merit order – Biomass 5 MW, Biomass 10 MW, CSP 50 MW (12 Hour Storage), Biofuel CC 75 MW and Biofuel CC 150 MW.
4. Renewable peaking – Baynes, CSP 50 MW (4 Hour Storage), CSP 50 MW (8 Hour Storage).
5. Intermittent renewable – Wind 50 MW, Solar PV 10 MW and CSP 50 MW (No Storage).
6. Imports (including base load, peaking and off-peak from various sources).
This section presents a screening analysis of the generation options listed above. The main purpose of this screening process is to identify the options that are clearly not economic and as such should not be included in the formulation of generation expansion scenarios.
6.2 Screening Curves and Selection of Generation Options At the screening stage, a reasonable way to compare generation options is to make a comparison of the unit cost of energy produced by each generation option including capital costs, operation and maintenance costs and fuel costs (if any). It is noted that the GHG offset allowance cost has not been included in the screening analysis (but will be included in the latter stages of the analysis).
Each of the above generation categories has its own peculiarities when comparing the unit cost of energy including life of plant and operating characteristics. The unit cost of energy for each generation category presented in the following subsections harmonises these parameters such that realistic comparisons can be made.
6.2.1 Unit Cost of Energy for Conventional Base Load Plants Section 1 presents several conventional generation options that are suitable for base load duty using such fuels as natural gas, coal and petroleum based products. For each of these fuels there are one or more technologies that could be used. Based on the technical and economic parameters provided in Section 1 and the estimated cost of fuels, this section determines the levelised unit cost of energy for each of these options. The combination of technologies and fuels results in eight possible conventional base load plant types/sizes as shown in Table 6-1.

The National Integrated Resource Plan Review and Update – Final Report
September 2016 Page 108 of 155
When determining the unit cost of energy, one has to specify the capacity factor and since, at this stage, the amount to be dispatched is unknown, the costs for a range of capacity factors are shown in Table 6-1.
Figure 6-1 presents in a graphic form the results of Table 6-1 for the selected options while Figure 6-2 presents the cost in N$/kW-Year which represents the total cost for each kW for a year depending on the number of hours that a unit is operated (the greater number of hours, the higher the cost).
Table 6-1: Unit Cost of Energy (N$/kWh) for Conventional Base Load Plants at Various Capacity Factors

The National Integrated Resource Plan Review and Update – Final Report
September 2016 Page 109 of 155
Figure 6-1: Unit Cost of Energy for Conventional Base Load Plants
Figure 6-2: Total Annual Costs of Conventional Base Load Plants

The National Integrated Resource Plan Review and Update – Final Report
September 2016 Page 110 of 155
For the conventional base load generation technologies at a capacity factor of 80%, one could observe the following from Table 6-1, Figure 6-1and/or Figure 6-2:
1. Coal fired PC 150 MW would have the least unit cost of energy at N$ 1.44/kWh but it would need to have FGD installed at additional cost. It is assumed that the CFB technology would be adopted as it could reduce SO2 emissions and is flexible to use other fuels such as biomass. In this case, the unit cost of energy would increase to N$ 1.54/kWh. The next least cost option is the CC 450 MW fuelled by Kudu natural gas. The three most expensive base load generation options would be LNG GT 50 MW (N$ 2.72/kWh), LNG GT 100 MW (N$ 2.63/kWh) and LFO fuelled CC 150 MW (N$ 2.61/kWh).
2. Comparing the costs for LNG GTs, the unit cost of energy of LNG CC 150 MW would be some N$ 2.29/kWh, which is lower than that for LNG GT 50 MW and LNG GT 100 MW.
3. The unit cost of energy of HFO ICRE 20 MW would be N$ 1.98/kWh, which is lower than that for LFO CC, LNG GTs and LNG CC but higher than that for PC and CFB coal units as well as NG CC units.
4. It is understood that proposals have been made to NamPower that include several GT 50 MW units using LNG to be imported and regasified at a FSRU and the project would be used to supply base load power before a permanent base load plant is commissioned. After the commissioning of such a plant the GT 50 MW units operating on LNG could be either used for backup or removed from the system. In the case of backup, cost of LNG in N$/GJ could be very expensive as the small volume of gas consumption would need to carry the rental and O&M costs of the FSRU.
5. Based the findings above, the next stage analysis will not include such base load generation options as LNG GT 100 MW, PC 300 MW and LFO CC 150 MW. Although the cost of LNG GT 50 MW is also high, it will be included in the further analysis as NamPower has received the proposals referred to above.
6.2.2 Unit Cost of Energy for Conventional Peaking Plants Gas turbines are usually well suited for peaking duty as are medium speed ICREs. Due to lack of natural gas or very small volume of LNG required for peaking plants, this assignment takes into account only generation options using petroleum products for peaking duty, which include HFO ICRE 20 MW, LFO GT 50 MW and LFO GT 100 MW. Based on the information provided in Section 1 and the estimated cost of fuels, this section determines the unit cost of energy for peaking plants. In this case, it should be noted that peaking plants usually do not operate at annual capacity factors greater than 15 to 25%.
Table 6-2 presents the unit cost of energy in N$/kWh at various capacity factors for the selected peaking generation options. As can be seen from this table, the most economic option to meet peak demand would be a HFO ICRE 20 MW unit. At an annual capacity factor of 15%, the cost for HFO ICRE 20 MW, LFO GT 50 MW and LFO 100 MW would be N$ 4.35, N$ 4.79 and N$ 4.6 per kWh respectively. When the annual capacity factor is increased to 25%, the cost would reduce to N$ 3.18, N$ 3.97 and N$ 3.83 per kWh respectively.

The National Integrated Resource Plan Review and Update – Final Report
September 2016 Page 111 of 155
Table 6-2: Unit Cost of Energy (N$/kWh) for Conventional Peaking Plants
Figure 6-3 presents a graphic form of the results shown in Table 6-2 for the selected conventional peaking options while Figure 6-4 presents the cost in N$/kW-Year which represents the total cost for each kW for a year depending on the number of hours that a unit is operated (the greater number of hours, the higher the cost).
For this assignment, conventional HFO ICRE 20 MW would be used for the peaking duty and compared with the renewable peaking generation options.

The National Integrated Resource Plan Review and Update – Final Report
September 2016 Page 112 of 155
Figure 6-3: Unit Cost of Energy for Conventional Peaking Plants
Figure 6-4: Total Annual Costs of Conventional Peaking Plants

The National Integrated Resource Plan Review and Update – Final Report
September 2016 Page 113 of 155
6.2.3 Unit Cost of Energy for Dispatchable Renewable Plants Similar to conventional generation technologies, renewable generation is divided into two categories, dispatchable and non-dispatchable (or intermittent). The dispatchable technologies are further divided into three groups, peaking, intermediate and base load. As per the information presented in Section 4, Table 6-3 presents the calculated unit cost of energy for dispatchable renewable power generation plants at various capacity factors, which include Baynes, CSP with storage, biomass and biofuel.
Table 6-3: Unit Cost of Energy (N$/kWh) for Dispatchable Renewable Plants
It is noted that the data of Table 6-3 show the unit cost of energy for each technology for the full range of plant factors whereas the Baynes project’s plant factor would be in the range of 30% and the plant factors for the CSP options would be a function of the design levels of hours of storage. Figure 6-5 presents in a graphic form the results in Table 6-3 (in N$/kWh) for selected options while Figure 6-6 presents the cost in N$/kW-Year which represents the total cost for each kW over a year depending on the number of hours that a unit is operated (the greater number of hours, the higher the cost). The notes below would be helpful to understand the results presented in Table 6-3, Figure 6-5 and Figure 6-6:

The National Integrated Resource Plan Review and Update – Final Report
September 2016 Page 114 of 155
1. The average annual energy production of the proposed 600 MW Baynes hydroelectric plant has been estimated at 1,610 GWh. This means that Namibia’s 50% share would be some 805 GWh per year. One could calculate that the annual capacity factor of this plant would be in the proximity of 30%. The estimated unit cost of energy is therefore approximately N$ 3.49/kWh.
2. For a CSP project with storage for four hours, it is assumed that the CSP plant will produce some power during day time and will have full output capability during daily high load demand hours. The plant would be designed and constructed with an expected annual capacity factor of 30%. At this capacity level, the unit cost of energy would be some N$ 3.31/kWh.
3. It is assumed that the CSP plant with storage of eight hours would have an annual capacity factor of 50%, which will result in a unit cost of energy of N$ 2.85/kWh.
4. It is assumed that the CSP plant with storage of 12 hours would have an annual capacity factor of 70%. In this case, the CSP plant would be operated like a base load plant and it would have a unit cost of energy of N$ 2.65/kWh.
5. It is assumed that the biomass and biofuel plants would not have energy constraints and they can produce as per system load variation requirements. At an annual capacity factor of 80%, the unit cost of energy of Biomass BFB 5 MW, Biomass BFB 10 MW, Biofuel CC 75 MW and Biofuel CC 150 MW would be some N$ 2.25/kWh, N$ 2.07/kWh, N$ 3.66/kWh and N$ 3.42/kWh.
6. Based on the calculated unit costs of energy and energy resources availability, Baynes, CSP with storage and Biomass BFB 10 MW will be taken into consideration in the next stage analysis while the other generation options listed in Table 6-3 will not be considered further.

The National Integrated Resource Plan Review and Update – Final Report
September 2016 Page 115 of 155
Figure 6-5: Unit Cost of Energy for Dispatchable Renewable Resources
Figure 6-6: Total Annual Costs of Dispatchable Renewable Resources

The National Integrated Resource Plan Review and Update – Final Report
September 2016 Page 116 of 155
6.2.4 Unit Cost of Energy for Intermittent Renewable Plants As per the applicable technologies and available resources identified in Section 1, the intermittent renewable plants for this study will include wind, solar PV and CSP without storage. Under this assumption, these power plants will produce power when resources are available and stop production when no resources are available. The energy resource could not be stored for later use and the production of these plants is entirely dependent on the resource availability at the given time, no matter what the system load is. Table 6-4 presents the calculated costs of unit of energy for the three intermittent generation technologies.
Table 6-4: Levelised Unit Cost of Energy (N$/kWh) for Intermittent Renewable Plants
Wind Solar PV CSPCapacity (MW) 50 10 50Capacity Factor (%) 40 30 30Unit Cost of Energy (N$/kWh) 1.54 1.61 2.57
Generation TechnologyItem
As can be seen from Table 6-4, the unit cost of energy of wind and solar PV power is at the same magnitude while the unit cost of energy of CSP without storage is much higher. It is important to note that an assumption of 20% over build on the DC side has been made in estimating the solar PV capacity factor. It is therefore determined that CSP without storage will not be taken into account in the next stage of the analysis.
6.2.5 Unit Cost of Energy of Potential Imports The four potential new imports from SAPP member utilities have been discussed in Section 4. Only the import from Lunsemfwa would have a unit cost of energy below N$ 2/kWh and the cost of other three are above N$2 /kWh. The import from Mozambique would be most expensive, at higher than N$ 2.6/kWh. As the Mozambique import would have a very high capacity factor and meet the base load requirement, it is determined that it will not be considered any further in the analysis.
6.2.6 Summary of Analysis Based on the discussions and analysis provided in the previous subsections, Table 6-5 summarises the generation options retained for formulation of various generation expansion plans.

The National Integrated Resource Plan Review and Update – Final Report
September 2016 Page 117 of 155
Table 6-5: Generation Options Retained
Generation Unit/Plant Resources Capacity Unit CostFuel Size Available Factor Function of Energy
Technology (MW) (MW) (%) ($/kWh)CC NG 450 450 80 Base Load /
Mid Merit1.79
CC LNG 150 > 300 80 Base Load 2.29GT LNG 50 > 200 80 Base Load 2.72CFB Coal 150 > 300 80 Base Load 1.54ICRE HFO 20 No Limit 80 Base Load 1.98ICRE HFO 20 No Limit 25 Peaking 3.18Hydro Water 300 300 30 Peaking 3.49CSP-4 Hour Solar 50 No Limit 30 Peaking 3.31CSP-8 Hour Solar 50 No Limit 50 Mid Merit 2.85CSP-12 Hour Solar 50 No Limit 70 Base Load 2.65
BFB Biomass 10 <=600 80 Base Load 2.07Wind Wind 50 <= 300 40 Intermittent 1.54Solar PV Solar 10 No Limit 30 Intermittent 1.61Import Zambia 50 50 50 Mid Merit 2.22Import Lunsemfwa 50 50 80 Mid Merit 1.78Import Botswana 200 200 96 Base Load 2.27
6.3 Expansion Scenario Themes This subsection describes the principal decision factors used in the formulation and development of the generation expansion scenarios studied in preparing the NIRP Update.
6.3.1 Principal Decision Factors In generation expansion planning the principal decision factors for addition of generation units to a system include the forecast load demand, energy policy, reliability criteria, system cost and environmental and social impacts. Given a load demand forecast, the principal decision factors are the established energy policy, the reliability planning criteria and cost. In addition to other aspects, an energy policy could provide directives on the requirements for electricity production and selection of generation types, technologies and locations for generation (domestic versus imports and/or locations within the country). The energy policy may include consideration of key environmental and social impacts.
The reliability planning criteria determine when a unit should be added to the system in order to supply the forecast demand at a specified reliability level, which should be based on the established energy policy.
A national integrated resource plan should in the first instance be based on national level economic considerations rather than financial factors. However, in the selection of the preferred national level plan, it is necessary to consider the ability of the country to obtain the financing needed to develop the individual power system projects.

The National Integrated Resource Plan Review and Update – Final Report
September 2016 Page 118 of 155
6.3.1.1 The White Paper on Energy Policy The Energy Policy Committee (EPC) of the Ministry of Mines and Energy (MME) published the White Paper on Energy Policy in May 1998. Section 3 of the White Paper on Energy Policy addresses energy supply and deals with electricity, gas, liquid fuels and renewable energy. It is noted that the White Paper on Energy Policy is currently being revised by MME and its consultants with the new energy policy scheduled to be released in late 2016. Unfortunately, the NIRP Update is to be completed before this new policy is completed. In view of this, it has been agreed that the work on the NIRP Update should be based on the existing White Paper on Energy Policy of 1998.
The White Paper on Energy Policy promotes the use of renewable energy through the establishment of an adequate institutional and planning framework, the development of human resources and public awareness and suitable financing systems. The energy policy goal of sustainability is to be promoted through a requirement for environmental impact assessments and project evaluation methodologies which incorporate environmental externalities. Energy efficiency is to be promoted through policies on better information collection and dissemination, and particularly with respect to energy efficiency and conservation practices in households, buildings, transport and industry. Security of supply is to be achieved through an appropriate diversification of economically competitive and reliable sources, but with particular emphasis on Namibian resources.
6.3.1.2 Reliability Criteria In this study, a LOLP criterion value of 5 days per year is adopted for the period from 2016 to 2020 and 2 days per year is adopted for the balance of the study horizon, which allocates adequate time to achieve the reliability goal (see Section 3.2).
6.3.1.3 Load Forecast The load forecast used in this study is derived in Section 5. Both energy and demand are forecast. The forecasts take into account organic growth, step loads (for mining, water pumping, industrial, commercial and institutional projects including the Mass Housing Program), DSM programs and the installation of behind the meter solar PV systems.
6.3.1.4 System Cost Scenarios are compared based on each scenario’s estimated total cost over the period of the analysis. Costs include those for fuel, operating & maintenance, capital investment, unserved energy and emissions. The simulation model calculates the total cost based on the installed capacity needed to satisfy the load forecast at the set level of reliability by dispatching the fleet of power plants available in each year based on their operating costs and their ability to adjust output based on system needs.
6.3.1.5 Environmental and Social Factors
The cost of each new power plant considered in preparing alternative expansion scenarios includes allowances for the mandatory environmental and social requirements. In addition, a cost is assessed in the model to represent the indirect societal costs of emissions such as CO2, SOx NOx and particulates based on the typical emissions level for each type of thermal plant by fuel type that is included in individual expansion scenarios.
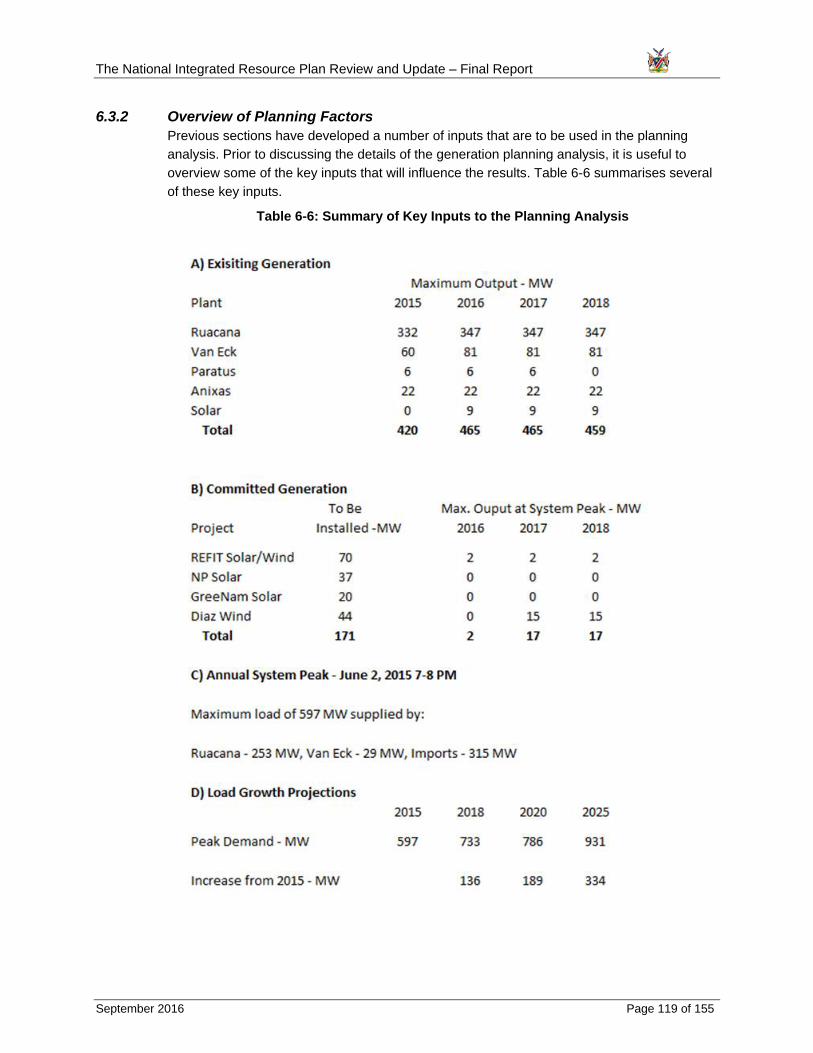
The National Integrated Resource Plan Review and Update – Final Report
September 2016 Page 119 of 155
6.3.2 Overview of Planning Factors Previous sections have developed a number of inputs that are to be used in the planning analysis. Prior to discussing the details of the generation planning analysis, it is useful to overview some of the key inputs that will influence the results. Table 6-6 summarises several of these key inputs.
Table 6-6: Summary of Key Inputs to the Planning Analysis

The National Integrated Resource Plan Review and Update – Final Report
September 2016 Page 120 of 155
Section A of Table 6-6 summarises the maximum output capabilities of the existing power plants on the Namibian power system; a total of some 420 MW in 2015. The table also indicates the increase in total capability to some 465 MW scheduled for later in 2016 after the refurbishment projects at the Ruacana and Van Eck power plants are completed.
Section B of Table 6-6 lists the power plant additions that are currently committed. As indicated, a total installed capacity of 171 MW is currently committed of which some 121 MW is solar PV and some 50 MW is wind power. Due to the intermittent nature of the output from these types of power plants, and the fact that the system peak typically occurs in the evening hours, the expected output capability of these committed power plants at the time of the system peak is expected to be less than 20 MW.
In 2015 the annual system peak demand reached 597 MW and this occurred on June 2 between the hours of 7 and 8 PM. Section C of Table 6-6 indicates that the Ruacana hydro plant contributed 253 MW at the time of this system peak, the Van Eck coal –fired power plant contributed 29 MW and imports, largely from the ESKOM substation, contributed some 315 MW or slightly over 50%.
The final section of Table 6-6 indicates the projected increase in the annual system peak loads in Namibia. Section D indicates that by 2025 under the Reference (mid-range forecast) Scenario the annual peak load will have increased by some 330 MW over the 2015 level.
The overarching conclusion of this is that, unless Namibia wishes to become even more heavily dependent on imports, there is a clear need to invest in significant amounts of new fully dispatchable generation.
6.3.3 Formulation of Generation Expansion Scenarios Reflecting the situation described in the previous section, there are a number of new power plants under consideration and/or in the negotiation stage in Namibia at this time. These include:
• Short lead time projects to meet the projected power demand and energy requirements without necessitating even greater reliance on imports
• Projects to make additional use of Namibia’s abundant renewable energy resources
• Longer lead time base load generation projects
It is understood that while NamPower is actively reviewing/negotiating at least two options, no final commitment has been made as yet for a short lead time generation project. In view of this, the initial formulation of generation expansion scenarios for this report is currently based on five short-term expansion options as follows:
• Option 1 – Quick install gas turbine plant using natural gas from LNG
• Option 2 – Short-term liquid fuel based emergency generation
• Option 3 – Both quick install gas turbine plant and emergency generation
• Option 4 – No short-lead time generation
• Option 5 – No new base load generation – rely on imports

The National Integrated Resource Plan Review and Update – Final Report
September 2016 Page 121 of 155
Under each of these five short-term options, a number of long-term generation expansion scenarios have been formulated and analysed. In each case other than Option 5, these include coal, LNG, domestic natural gas (Kudu), HFO and biomass/concentrated solar power scenarios. Each of these scenarios also includes renewable power plants (in addition to those included as committed projects). For this study, the penetration of intermittent renewables is considered at two levels, base and high. It is assumed that the base level includes a total of 90 MW of renewables, i.e. 40 MW of solar PV and 50 MW of wind power, while the high level includes a total of 200 MW, i.e. 100 MW of solar PV and 100 MW of wind power. In both cases these amounts are in addition to the renewables projects on the committed plants list.
Based on the information presented in Section 1, it could be summarised that the power plant size, fuel type and first possible year in service for the major generating options are as follows:
• Quick install GT, 200 MW, LNG/LFO, 2019
• Emergency ICRE generation, 100 MW, HFO/LFO, 2018 (3 year contract)
• Coal, 300 MW, 2021
• Kudu, 442 MW, 2021
• LNG, 300 MW, 2021
• ICRE 20 MW, multi unit plant, 2021
• Biomass, multiple 10 MW plants, 2021
Simulations were carried out for a number of expansion sequences under each of the five options with 30 scenarios studied in total. Table 6-7 shows the long-term capital and operating costs for each scenario. It can be seen that the total costs of these 30 scenarios over the full period of analysis (2016 – 2035) have a range of just over 20% from the lowest to the highest cost scenarios. However, for the five lowest cost scenarios, the variation from lowest cost to highest cost is under 10%. Short-term Option 2 is considered the best path forward for bridging the gap until base load plant can be installed given its relative costs and ability to quickly mitigate at least some of the short-term supply risks with a certain amount of flexibility. Although the Option 5 scenarios are shown to have lower costs, it is considered that this approach would be very risky from a supply perspective and would be diametrically opposed to the position expressed in the Energy Policy on self-supply.
Table 6-8 summarises the types of new generating plants included in each of the 11 scenarios in Option 2. Table 6-9 illustrates the year by year schedule of plant/unit additions/retirements for one of the Option 2 scenarios (Scenario 6). Similar tables for each of the 11 scenarios of Option 2 are provided in Appendix C.
In the next section, the NIRP is further developed by considering the attributes of the main generation options and how these combine to impact various national policies and financial factors. This more detailed analysis is carried out for the scenarios included in Option 2.

The National Integrated Resource Plan Review and Update – Final Report
September 2016 Page 122 of 155
Table 6-7: Simulation Results for the Five Options

The National Integrated Resource Plan Review and Update – Final Report
September 2016 Page 123 of 155
Table 6-8: Unit Additions by Scenario for Option 2

The National Integrated Resource Plan Review and Update – Final Report
September 2016 Page 124 of 155
Table 6-9: Unit/Plant Addition/Retirement Schedule for Scenario 6 in Option 2

The National Integrated Resource Plan Review and Update – Final Report
September 2016 Page 125 of 155
7. Selection of Preferred Scenarios 7.1 Introduction
In addition to lowest direct cost, there are a number of criteria of national importance that need to be considered in selecting the projects to include in the NIRP implementation plan. After introducing these criteria and showing how each individual generation option ranks on these factors, the scenarios of Option 2 are assessed against these criteria. This leads to the selection of several policy scenarios. The sensitivity of these to changes in base case parameters is then checked.
7.2 Assessment of the Generation Option on the Criteria Several criteria have been defined to rate the main generation options on how they meet existing or potential national energy policies and how they compare on financial considerations. These are described below. Table 7-1 summarises how each generating technology ranks on these factors.
7.2.1 Generation in Namibia The White Paper on Energy Policy establishes the amounts of generation to be from internal sources. It states that “Duly considering associated risks, it is the aim of government that 100% of the peak demand and at least 75% of the electric energy demand would be supplied from internal sources by 2010. Risk mitigation measures would be pursued, including the possibility of regional equity participation in, and guarantees for, Namibian generation projects.”
The goals mentioned in the foregoing paragraph have not been achieved to date. Generation resources located within Namibia can currently supply up to approximately 420 MW (this will increase to some 465 MW when the refurbishment projects at Ruacana and Van Eck are fully completed in 2016). In comparison, a peak demand of 597 MW occurred in June 2015. According to NamPower’s annual report, imports from sources outside Namibia have accounted for approximately 65% of the energy requirement in the last two years (including supply to the Skorpion Zinc Mine).
Taking into account the current power supply conditions in Namibia and the lead time required for the addition of new generation units/plants, it is expected that the internal resource requirements outlined in the White Paper on Energy Policy could be achieved within the next five years, i.e. by approximately 2021. Each power plant built in Namibia would contribute to meeting this policy.
7.2.2 Use of Indigenous Resources It is naturally considered to be desirable to make appropriate use of indigenous energy resources in supplying the electricity demand in Namibia. As indicated in Table 7-1, many of the power plant options under consideration would do so. This includes the Kudu Project that would use offshore natural gas and the Baynes hydroelectric plant that would use water shared with Angola.

The National Integrated Resource Plan Review and Update – Final Report
September 2016 Page 126 of 155
Table 7-1: Attributes of Generation Options
7.2.3 Renewable Energy Like many other countries, Namibia aspires to use more renewable energy to achieve reductions in its GHG emissions as well as to avail the country of the numerous other benefits associated with the use of renewable energy. Namibia’s submission to the recent COP 21 meetings in Paris, France titled “Intended Nationally Determined Contributions” (INDC) showed that the energy sector is expected to contribute to the national level INDC by increasing the share of renewables in electricity production from 33% in 2010 to 70% by 2030. While this objective is conditional on Namibia receiving some US$ 33 billion in foreign financial support, it is indicative of the importance of increased consideration of renewable energy in the country’s energy mix. Table 7-1 indicates that a significant number of the generation options under consideration would be based on renewable energy.

The National Integrated Resource Plan Review and Update – Final Report
September 2016 Page 127 of 155
7.2.4 Foreign Exchange Requirement As a rapidly developing country with an ambitious development plan (Namibia Vision 2030) underway, Namibia has many competing uses for its available foreign exchange capability. There are significant differences in the amount of foreign exchange that would be required to invest in and operate the various power generation options. As indicated in Table 7-1, a number of the options would require overseas sourcing of the generation equipment as well as ongoing fuel purchases. Even in the case of the Kudu project, it is expected that the natural gas supply would involve an ongoing foreign exchange requirement as the developer (assuming this to be a foreign investor) would need to be covered for the foreign exchange component of the investment required to develop and operate the gas field and the undersea pipeline. In the case of the Baynes project, a material share of the capital cost would be for civil works which would largely be carried out in N$. For imports there would not be an upfront foreign exchange requirement but the power price would generally be expected to be denominated in US$.
7.2.5 Need for Government Investment This is one of the more difficult attributes to assess at this planning stage as it is not known how an individual generating option would be procured. Some projects naturally lend themselves to a high level of government financing whereas other projects could be undertaken by the private sector if the enabling conditions are in place. The following discussion elaborates on some of the factors involved.
Kudu natural gas – this project involves development of an offshore natural gas reserve in deep water, far offshore. Since the discovery of this gas field a number of private sector investors have been involved but to date the investment needed to develop the project has not materialised. It is likely that the Government of Namibia would need to make a significant investment to reduce the risk to private sector investors. Once the natural gas is brought to shore it would be used in a conventional power plant but given the size of the power plant needed to make the natural gas delivery system economic there is both a risk that power surplus to Namibian needs could not be sold at a price that covers costs and that the generating unit size (442 MW) being large relative to the Namibian power sector could lead to reliability issues. Both of these factors point to additional need for government investment. In addition, NamPower would need to invest in the high voltage transmission infrastructure needed to deliver the power to the main NamPower grid.
Conventional generation – combined cycle, gas turbine and coal-fired power stations in the 300 MW range are developed by the private sector in many countries. However, given the size of the Namibian power sector and the limited involvement of IPPs in the sector to date, even in small generation projects, it is likely that these plants would require a certain amount of government investment. This is a subject that will no doubt be addressed by the “Review and Update of Namibia’s IPP and Investment Market Framework” that is now underway. It is likely that Government investment would also be needed for the infrastructure required to deliver the fuel to the power plant, particularly for projects that would be based on imported natural gas for which port, re-gasification and pipeline investment would be needed. For these types of generating options it is expected that “moderate” government investment would be required.
The National Integrated Resource Plan Review and Update – Final Report
September 2016 Page 128 of 155
Internal combustion reciprocating engines – this type of project typically involves multiple relatively small engines and has relatively low investment and operating risk and could potentially be developed with limited or no government investment dependent on the terms of the PPA that is offered.
Baynes hydroelectric project – the return on investment on a hydroelectric project is typically spread over the long-term operating life of these plants and hence it is unusual for these to be developed by IPPs. Given the complications of the Baynes project regarding shared water use with Angola and relatively low annual capacity factor, it is expected that this project would need to be financed entirely, either directly or indirectly, by the Government.
Concentrated solar power – this technology is relatively new and long-term profitable operation of sizeable plants has not been demonstrated, even in the larger market in Republic of South Africa. It is expected that at least the initial plants would need to be financed largely by the Government of Namibia. Hence this technology is categorised as requiring “moderate” government investment in Table 7-1.
Biomass (encroacher bush) – small sized biomass plants using encroacher bush are considered to represent a very good opportunity for private investment. However, it is considered that a commercial scale pilot project owned by the government would be needed to demonstrate the operating and economic characteristics of these projects before that private sector investment would be forthcoming. This technology is therefore shown as needing “limited” government investment.
Wind and solar PV – power plants using these technologies are routinely developed entirely with private investment. But for this to happen, bankable PPAs with reasonable prices and limited ability of the buyer to dispatch off are required.
Imports – typically no direct government investment is required. However, in some cases transmission investment could be needed.
7.2.6 Development/Operating Complexity The ranking on this attribute varies significantly amongst the generating alternatives as shown in Table 7-1. The Kudu Natural Gas project is shown as “high” due to the offshore location, delivery distance, export requirements and generating unit size. These factors give it a “high” rating. Projects involving LNG are shown as “medium” due to the requirements for delivery and conversion of LNG to usable natural gas. Baynes hydroelectric plant is shown as “high” due to the shared water usage. CSP and biomass based on encroacher bush are both shown as “medium” at this time but once initial plants have been developed and operated successfully this rating could be moved to the low range. The other generating technologies are all ranked “low” on this factor.
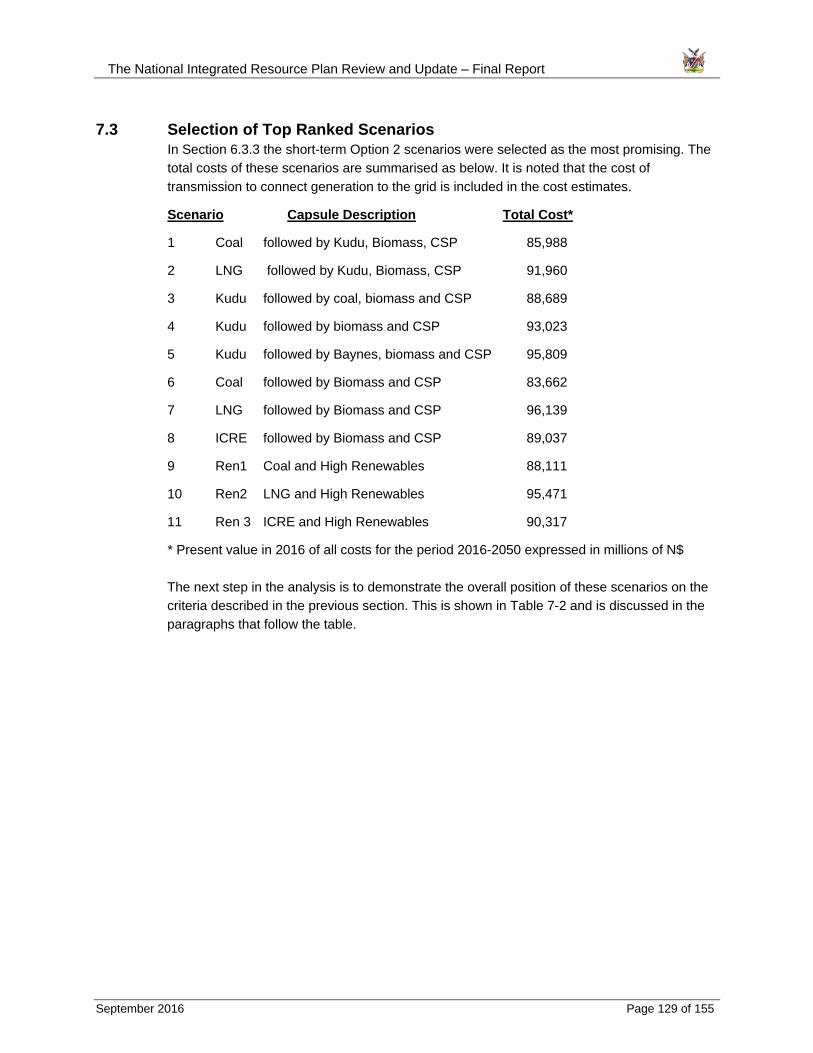
The National Integrated Resource Plan Review and Update – Final Report
September 2016 Page 129 of 155
7.3 Selection of Top Ranked Scenarios In Section 6.3.3 the short-term Option 2 scenarios were selected as the most promising. The total costs of these scenarios are summarised as below. It is noted that the cost of transmission to connect generation to the grid is included in the cost estimates.
Scenario Capsule Description Total Cost*
1 Coal followed by Kudu, Biomass, CSP 85,988
2 LNG followed by Kudu, Biomass, CSP 91,960
3 Kudu followed by coal, biomass and CSP 88,689
4 Kudu followed by biomass and CSP 93,023
5 Kudu followed by Baynes, biomass and CSP 95,809
6 Coal followed by Biomass and CSP 83,662
7 LNG followed by Biomass and CSP 96,139
8 ICRE followed by Biomass and CSP 89,037
9 Ren1 Coal and High Renewables 88,111
10 Ren2 LNG and High Renewables 95,471
11 Ren 3 ICRE and High Renewables 90,317
* Present value in 2016 of all costs for the period 2016-2050 expressed in millions of N$
The next step in the analysis is to demonstrate the overall position of these scenarios on the criteria described in the previous section. This is shown in Table 7-2 and is discussed in the paragraphs that follow the table.

The National Integrated Resource Plan Review and Update – Final Report
September 2016 Page 130 of 155
Scenario Main CapacityNamibia Renewable Indigenous CO2 Capital (1)
Description Additions (%) (%) (%) (MT) (Million N$)300 MW Coal 300 MW Coal, 442 MW NG CC, 80 MW Biomass and 250 MW CSP 99.35 51.81 67.89 2.677 31,403300 MW LNG CC 300 MW LNG CC, 442 MW NG CC, 80 MW Biomass and 250 MW CSP 99.29 49.48 91.72 1.255 25,819442 MW Kudu NG CC 442 MW NG CC, 300 MW Coal, 80 MW Biomass and 250 MW CSP 99.34 51.63 67.76 2.687 34,083442 MW Kudu NG CC and Renewable 442 MW NG CC, 400 MW CSP and 200 MW Biomass 99.23 79.42 98.77 0.490 40,754442 MW Kudu NG CC and Baynes 442 MW NG CC, 300 MW Hydro, 80 MW Biomass and 300 MW CSP 99.11 74.85 98.49 0.598 50,105600 MW Coal 600 MW Coal, 80 MW Biomass and 250 MW CSP 99.33 49.48 49.48 3.616 30,862600 MW LNG CC 600 MW LNG CC, 80 MW Biomass and 200 MW CSP 98.99 44.75 44.75 1.456 21,183480 MW HFO ICRE 480 MW HFO ICRE, 80 MW Biomass and 250 MW CSP 98.63 51.81 51.81 2.027 25,501600 MW Coal and High Renewable 600 MW Coal, 80 MW Biomass, 250 MW CSP and High Renewable 99.97 71.05 71.05 2.112 40,157600 MW LNG CC and High Renewable 600 MW LNG CC, 80 MW Biomass, 250 MW CSP and High Renewable 99.98 71.05 71.05 0.778 32,666420 MW HFO ICRE and High Renewable 420 MW HFO ICRE, 100 MW Biomass, 300 MW CSP and High Renewable 100.00 73.20 73.20 1.171 36,069
Scenario Main CapacityNamibia Renewable Indigenous CO2 Capital (1)
Description Additions (%) (%) (%) (MT) (Million N$)
300 MW Coal 300 MW Coal, 442 MW NG CC, 80 MW Biomass and 250 MW CSP 99.41 58.28 72.67 2.723 61,022300 MW LNG CC 300 MW LNG CC, 442 MW NG CC, 80 MW Biomass and 250 MW CSP 99.45 58.28 93.66 1.232 52,708442 MW Kudu NG CC 442 MW NG CC, 300 MW Coal, 80 MW Biomass and 250 MW CSP 99.41 58.28 72.67 2.723 63,703442 MW Kudu NG CC and Renewable 442 MW NG CC, 400 MW CSP and 200 MW Biomass 99.31 81.52 98.89 0.523 76,712442 MW Kudu NG CC and Baynes 442 MW NG CC, 300 MW Hydro, 80 MW Biomass and 300 MW CSP 98.89 71.89 97.91 0.789 88,329600 MW Coal 600 MW Coal, 80 MW Biomass and 250 MW CSP 99.53 58.28 58.28 3.557 59,903600 MW LNG CC 600 MW LNG CC, 80 MW Biomass and 200 MW CSP 99.20 54.15 54.15 1.436 43,354480 MW HFO ICRE 480 MW HFO ICRE, 80 MW Biomass and 250 MW CSP 99.11 58.28 58.28 2.105 50,326600 MW Coal and High Renewable 600 MW Coal, 80 MW Biomass, 250 MW CSP and High Renewable 99.93 71.69 71.69 2.448 75,933600 MW LNG CC and High Renewable 600 MW LNG CC, 80 MW Biomass, 250 MW CSP and High Renewable 99.95 71.69 71.69 0.903 63,761420 MW HFO ICRE and High Renewable 420 MW HFO ICRE, 100 MW Biomass, 300 MW CSP and High Renewable 100.00 77.63 77.63 1.161 68,378
Note: (1) Cumulative capital charge from 2016 to the indicated year
2030
3035
Table 7-2: Criteria of Generation Expansion Alternatives
• White Paper on Energy Policy – Within the period 2021-2025, each of the scenarios would be able to supply 100% of the peak load and more than 75% of the annual energy generation from domestic power plants. As shown in Table 7-2, each of these scenarios would have close to 100% of annual kWh generation in Namibia in 2030 and onwards. It is noted that the targets for self-sufficiency may be revised as an outcome of the review and update of the White Paper on Energy Policy that is currently underway.
• Use of Indigenous Resources - As shown in Table 7-2, both Scenarios 4 and 5 would use very close to 100% indigenous energy resources. Even though Scenario 2 includes imported LNG, this plant would not be dispatched as base load after the Kudu project is on-line and hence by 2030 this scenario would also use largely indigenous energy resources. The scenarios relying on imported coal, LNG and HFO for base load generation (Scenarios 6, 7 and 8) would use approximately 50% indigenous energy resources. For those same scenarios combined with high renewable capacity (Scenarios 9, 10 and 11) the use of indigenous energy resources would increase to the 70-75% level.

The National Integrated Resource Plan Review and Update – Final Report
September 2016 Page 131 of 155
• Renewable Energy – Table 7-3 compares the types and amounts of renewables based energy generation included in selected scenarios (Scenarios 1, 2 and 3 have relatively low levels of renewable and are not included in this table; it is also noted that negative signs in this table represent retirements). Scenarios 4 and 5 are heavily based on renewable generation and these would have 75-80% of annual kWh generation based on renewable energy thus meeting the target of at least 70% renewable based generation given in the INDC document. It is noted that achievement of this level assumes installation of multiple CSP plants and encroacher bush based biomass plants and these technologies have not yet been demonstrated to be economically attractive for Namibia. Scenarios 9, 10 and 11 would also have over 70% of annual kWh generation from renewables. In these scenarios large amounts of solar PV and wind generation enable this. However, both of these technologies offer only intermittent production and this level of non-dispatchable generation on the Namibian system would almost certainly result in serious operational issues. It is understood that both NamPower and the ECB are planning renewable integration studies.
• Foreign Exchange Requirement – most of the equipment required for the various generating plants would be imported. Scenarios 9, 10 and 11 with extra generation to achieve higher levels of renewable based generation while providing for generation to operate when the wind is not blowing and in hours of darkness would tend to have higher initial foreign exchange requirements. Once the initial investment is made, the annual foreign exchange requirements of the scenarios with higher levels of renewables would be lower. For the Kudu natural gas project, the foreign exchange component of the Kudu natural gas price would determine the total amounts of foreign exchange required. Similarly, for those scenarios that include coal, if this fuel could be imported from Republic of South Africa priced in Rand this would reduce the foreign exchange component significantly.
• Need for Government Investment – The total capital charges (related to both government and private investment) in the periods to 2030 and 2035 for Scenarios 6, 7 and 8 would generally be lower than those for other scenarios. For example the average total capital charges for those three scenarios up to 2035 would be N$ 51,000 million whereas for the other scenarios the average would be N$ 69,000 million or almost 40% higher. Scenarios 1-5 including Kudu, and in the case of Scenario 5 also including Baynes, would be expected to have the highest requirements for investment by the Government of Namibia.
• Greenhouse Gas Emissions – As indicated in Table 7-2, Scenarios 1, 3, 6 and 9 that include a coal-fired plant would have significantly higher greenhouse gas emissions than would the other scenarios.

The National Integrated Resource Plan Review and Update – Final Report
September 2016 Page 132 of 155
Capacity Capacity Capacity Capacity Capacity Capacity Capacity Capacity(MW) (MW) (MW) (MW) (MW) (MW) (MW) (MW)
201620172018 ICRE -6.3 ICRE -6.3 ICRE -6.3 ICRE -6.3 ICRE -6.3 ICRE -6.3 ICRE -6.3 ICRE -6.32019 Solar PV 20 Solar PV 20 Solar PV 202020 Solar PV 20 Solar PV 20 Solar PV 20 Solar PV 20 Solar PV 20 Solar PV 40 Solar PV 40 Solar PV 402021 Kudu Gas 442 Kudu Gas 442 Coal 300 LNG 300 ICRE 260 Wind 100 Wind 100 Wind 100
CSP 50 CSP 50 Coal 300 LNG CC 300 ICRE 2602022 Wind 50 Wind 50 Wind 50 Wind 50 Wind 50 Solar PV 40 Solar PV 40 Solar PV 40
Biomass 202023 Biomass 20 Biomass 20 Biomass 20 Wind 100 Wind 100 Wind 100
ICRE 402024 Solar PV 20 Solar PV 20 Solar PV 20 Solar PV 20 Solar PV 20 Solar PV 40 Solar PV 40 Solar PV 40
Biomass 20 Biomass 20 Biomass 20 Biomass 20 CSP 50 Biomass 20 Biomass 20 ICRE 402025 Coal -108 Coal -108 Coal -108 Coal -108 Coal -108 Coal -108 Coal -108 Coal -108
Biomass 80 Biomass 40 Coal 300 LNG 300 ICRE 180 Wind 100 Wind 100 Wind 100CSP 100 CSP 150 Coal 300 LNG CC 300 CSP 100
Biomass 202026 Solar PV 20 Solar PV 20 Solar PV 20 Solar PV 20 Solar PV 20 Solar PV 40 Solar PV 40 Solar PV 40
CSP 50 Hydro 300 Biomass 20 ICRE 402027 Biomass 20 CSP 50 CSP 50 Solar PV 40 Solar PV 40 Solar PV 40
CSP 50 CSP 50 Biomass 202028 Wind 50 Wind 50 Wind 50 Wind 50 Wind 50 Solar PV 40 Solar PV 40 Solar PV 40
Biomass 20 Biomass 20 CSP 50 Biomass 20 Biomass 20 ICRE 402029 CSP 50 CSP 50 ICRE 20 Solar PV 40 Solar PV 40 Solar PV 40
CSP 50 CSP 50 CSP 502030 Solar PV 20 Solar PV 20 Solar PV 20 Solar PV 20 Solar PV 20 CSP 50 CSP 50
Biomass 20 Biomass 20 Biomass 202031 Biomass 20 Biomass 20 CSP 50 CSP 50 Biomass 20 Biomass 20 CSP 502032 Solar PV 20 Solar PV 20 Solar PV 20 Solar PV 20 Solar PV 20 CSP 50 CSP 50 Biomass 20
CSP 50 CSP 50 Biomass 20 ICRE 202033 CSP 50 Biomass 20 CSP 50 CSP 50 Biomass 20 Biomass 20 CSP 50
Biomass 202034 CSP 50 CSP 50 Biomass 20 Biomass 202035 CSP 50 CSP 50 CSP 50 CSP 50 CSP 50 CSP 50 CSP 50 CSP 50
By 2030Total (MW) 1673.5 1823.5 1541.5 1491.5 1421.5 2011.5 2011.5 1851.5Renewable (MW) 1210.0 1360.0 920.0 870.0 940.0 1390 1390 1410.0
Hydro 346.5 646.5 346.5 346.5 346.5 346.5 346.5 346.5Solar PV 284.5 284.5 284.5 284.5 284.5 504.5 504.5 504.5
Wind 149.0 149.0 149.0 149.0 149.0 349.0 349.0 349.0Biomass 180.0 80.0 40.0 40.0 60.0 40.0 40.0 60.0
CSP 250.0 200.0 100.0 50.0 100.0 150.0 150.0 150.0Capacity (%) 72.3 74.6 59.7 58.3 66.1 69.1 69.1 76.2Energy (%) 79.42 74.85 49.48 44.75 51.81 71.05 71.05 73.2By 2035Total (MW) 1888.5 1968.5 1776.5 1726.5 1656.5 2176.5 2176.5 2066.5Renewable (MW) 1425.0 1505.0 1155.0 1105.0 1155.0 1555.0 1555.0 1625.0
Hydro 346.5 646.5 346.5 346.5 346.5 346.5 346.5 346.5Solar PV 329.5 329.5 329.5 329.5 329.5 529.5 529.5 529.5
Wind 149.0 149.0 149.0 149.0 149.0 349.0 349.0 349.0Biomass 200.0 80.0 80.0 80.0 80.0 80.0 80.0 100.0
CSP 400.0 300.0 250.0 200.0 250.0 250.0 250.0 300.0Capacity (%) 75.5 76.5 65.0 64.0 69.7 71.4 71.4 78.6Energy (%) 81.52 71.89 58.28 54.5 58.28 71.69 71.69 77.63
5 6 7 8 9
Type Type
10 11All scenarios shown are for Alternative 2 (short-term liquid fuel based emergency generation for the period from 2018 to 2020)
YearType Type Type Type Type Type
4
• Development/Operating Complexity – based on the information provided in Table 7-1, the level of development/operating complexity would be higher for those scenarios including Kudu, particularly those in which Kudu would be the first base load plant (Scenarios 3, 4 and 5), and particularly for Scenario 5 which also includes Baynes. While Table 7-1 indicates that complexity for wind and solar PV is considered to be low on an individual unit basis, when there are very high levels of intermittent renewables on a system the complexity of operating the system can increase significantly. It is expected that this would be the case under Scenarios 9, 10 and 11,
• Conclusions – While no scenario scores high across all of the aspects that have been assessed, it is considered that Scenarios 6, 7 and 8 demonstrate a good balance across the range of criteria reviewed.
Table 7-3: Level of Renewables Integration for Selected Scenarios

The National Integrated Resource Plan Review and Update – Final Report
September 2016 Page 133 of 155
1 2 3 4 5 6 7 8 9 10 11
300 MW Coal 300 MW LNG CC442 MW Kudu NG
CC442 MW Kudu NG CC
and Renewable442 MW Kudu NG
CC and Baynes600 MW Coal 600 MW LNG CC 480 MW ICRE
600 MW Coal & High
Renewbales
600 MW LNG CC & High
Renewbales
420 MW ICRE & High
Renewbales85,987.7 91,959.6 88,688.9 93,023.3 95,809.1 83,661.6 96,139.4 89,037.1 88,111.5 95,471.1 90,317.5
Coal Plant By -20% 84,345.8 87,599.1 80930 85379.9Increase (Decrease) -1,641.9 -1,089.8 -2,731.6 -2,731.6
By +20% 87,629.5 89,778.6 86393.1 90843.1Increase (Decrease) 1,641.8 1,089.7 2,731.5 2,731.6
For Every N$ 100/kW 19.5 13.0 32.5 32.5Kudu Gas Plant By -20% 85,034.4 91,006.4 87,252.7 91,587.1 94,373.0
Increase (Decrease) -953.3 -953.2 -1,436.2 -1,436.2 -1,436.1By +20% 86,940.9 92,912.8 90,125.0 94,459.4 97,245.3
Increase (Decrease) 953.2 953.2 1,436.1 1,436.1 1,436.2For Every N$ 100/kW 19.8 19.8 29.9 29.9 29.9
LNG CC Plant By -20% 90,892.6 94,364.2 93,695.9Increase (Decrease) -1,067.0 -1,775.2 -1,775.2
By +20% 93,026.6 97,914.6 97,246.2Increase (Decrease) 1,067.0 1,775.2 1,775.1
For Every N$ 100/kW 22.1 36.8 36.8Baynes Plant By -20% 93,960.8
Increase (Decrease) -1,848.3By +20% 97,657.5Increase (Decrease) 1,848.4
For Every N$ 100/kW 11.1ICRE Plant By -20% 87,435.6 88,833.8
Increase (Decrease) -1,601.5 -1,483.7By +20% 90,638.7 91,801.1Increase (Decrease) 1,601.6 1,483.6
For Every N$ 100/kW 26.7 24.7
Baase Case
Parameter Variation
Scenario
7.4 Sensitivity Studies Sensitivity studies were carried out to test the impacts of changes to the following base case parameters:
• Capital cost
• Fuel price
• Discount rate
• Low and high load forecasts
• Cost assessed against CO2 emissions
The results of this analysis are discussed in separate subsections for each parameter and numerical results are provided in accompanying tables. All the numbers in these tables represent the present value total cost of the indicated scenario over the period 2016 to 2050 expressed in millions of N$ 2016.
7.4.1 Capital Cost Table 7-4 presents the sensitivity study results on power plant capital cost. This table is set up to indicate the impacts of capital cost changes on total scenario costs and can also be used to compare the impacts of assumptions on the cost of one technology changing while a competing one does not change. For instance, it shows that if the capital cost of a coal-fired power plant increases by 20% (Scenario 6) and the cost of ICRE based power stations does not change (Scenario 8) the coal based scenario would remain less expensive over the period of analysis. This would also be the case if the cost of the ICRE based power station declined by 20%. The table also shows how much the total cost of each scenario would change per N$ 100 per kW change in the assumed capital cost and this information can be used to calculate crossover values.
This table indicates that the results are not very sensitive to differential capital cost changes in the 20% range.
Table 7-4: Sensitivity Results – Power Plant Capital Costs

The National Integrated Resource Plan Review and Update – Final Report
September 2016 Page 134 of 155
1 2 3 4 5 6 7 8 9 10 11
300 MW Coal300 MW LNG
CC442 MW Kudu NG
CC442 MW Kudu NG CC and Renewable
442 MW Kudu NG CC and Baynes
600 MW Coal 600 MW LNG CC 480 MW ICRE600 MW Coal &
High Renewbales
600 MW LNG CC & High
Renewbales
420 MW ICRE & High Renewbales
85,987.7 91,959.6 88,688.9 93,023.3 95,809.1 83,661.6 96,139.4 89,037.1 88,111.5 95,471.1 90,317.5Coal Price By -20% 84,156.6 91,317.5 87,400.3 92,575.6 95,361.5 81,349.2 95,497.3 88,395.0 86,321.5 94,829.0 89,675.4
Increase (Decrease) -1,831.1 -642.1 -1,288.6 -447.7 -447.6 -2,312.4 -642.1 -642.1 -1,790.0 -642.1 -642.1By +20% 87,818.7 92,601.7 89,977.4 93,470.9 96,256.8 85,973.9 96,781.5 89,679.2 89,901.5 96,113.1 90,959.6
Increase (Decrease) 1,831.0 642.1 1,288.5 447.6 447.7 2,312.3 642.1 642.1 1,790.0 642.0 642.1For Every N$ 100/Tonne 817.4 286.7 575.2 199.8 199.8 1,032.3 286.6 286.6 799.1 286.6 286.7
Kudu Gas Price By -20% 84,940.7 89,243.0 86,623.5 90,636.0 93,116.8Increase (Decrease) -1,047.0 -2,716.6 -2,065.4 -2,387.3 -2,692.3
By +20% 87,034.6 94,676.1 90,754.2 95,410.5 98,501.5Increase (Decrease) 1,046.9 2,716.5 2,065.3 2,387.2 2,692.4
For Every N$ 10/GJ 327.2 848.9 645.4 746.0 841.4LNG Price By -20% 90,074.8 89,947.1 91,331.1
Increase (Decrease) -1,884.8 -6,192.3 -4,140.0By +20% 93,844.4 102,331.7 99,611.1
Increase (Decrease) 1,884.8 6,192.3 4,140.0For Every N$ 10/GJ 436.3 1,433.4 958.3
Biomass Price By -20% 85,698.3 91,699.0 88,344.9 92,148.9 95,389.1 83,391.1 95,892.7 88,732.2 87,841.0 95,200.6 89,927.2Increase (Decrease) -289.4 -260.6 -344.0 -874.4 -420.0 -270.5 -246.7 -304.9 -270.5 -270.5 -390.3
By +20% 86,277.1 92,220.1 89,032.8 93,897.7 96,229.2 83,932.1 96,386.1 89,342.0 88,382.0 95,741.6 90,707.8Increase (Decrease) 289.4 260.5 343.9 874.4 420.1 270.5 246.7 304.9 270.5 270.5 390.3
For Every N$ 100/Tonne 170.3 153.2 202.3 514.4 247.1 159.1 145.1 179.3 159.1 159.1 229.6HFO Price By -20% 85,397.0 91,373.3 88,130.1 92,464.9 95,244.4 83,057.6 95,537.8 84,395.7 87,562.6 94,924.4 87,250.5
Increase (Decrease) -590.7 -586.3 -558.8 -558.4 -564.7 -604.0 -601.6 -4,641.4 -548.9 -546.7 -3,067.0By +20% 86,578.3 92,545.9 89,247.6 93,581.7 96,373.9 84,265.6 96,741.1 93,678.5 88,660.3 96,017.7 93,384.4
Increase (Decrease) 590.6 586.3 558.7 558.4 564.8 604.0 601.7 4,641.4 548.8 546.6 3,066.9For Every N$ 10/GJ 219.2 217.6 207.4 207.3 209.6 224.2 223.3 1,722.6 203.7 202.9 1,138.3
Scenario
Parameter Variation
Base Case
7.4.2 Fuel Cost The sensitivity study results on fuel cost are shown in Table 7-5. As with Table 7-4, this table is designed to provide the information needed to assess virtually any set of assumptions on fuel price changes. For each scenario, the impacts of changes in the price of each type of fuel used in that scenario are shown. This information can be used to assess the impacts across scenarios of price increases for certain fuels but not others. Again, it can be seen that the base case rankings are quite robust to differential fuel price changes in the 20% range.
Table 7-5: Sensitivity Study Results – Fuel Cost
7.4.3 Discount Rate Table 7-6 shows the sensitivity study results on discount rate for selected scenarios (Scenarios 1, 3, 5 and 6).
From the results presented in Table 7-6, one could understand that the increase/decrease in total system cost is not a linear function of discount rate. It could also be concluded that even the significant variations in the discount rate assessed in Table 7-6 would not change the rankings of the four scenarios.
Table 7-6: Sensitivity Study Results – Discount Rate
7.4.4 Load Forecast The sensitivity study on load forecast was carried out for selected scenarios (Scenarios 1, 3, 5 and 6) and the study results are presented in Table 7-7.
1 3 5 6Base Case 85,987.7 88,688.9 95,809.1 83,661.6
Discount Rate 8% (-2%) 102,263.6 105,112.0 112,176.7 98,634.3Increase (Decrease) 16,275.9 16,423.1 16,367.5 14,972.8
Discount Rate 12% (+2%) 73,874.2 76,443.3 83,367.3 72,171.6Increase (Decrease) -12,113.4 -12,245.5 -12,441.9 -11,490.0
ScenarioParameter/Variation

The National Integrated Resource Plan Review and Update – Final Report
September 2016 Page 135 of 155
From the results shown in Table 7-7, one could understand that the total system cost is not a linear function of system load. It is important to note that comparing with the Base Case, addition of some generation units/plants would be delayed in the low load case while some would be advanced in the high load case. The ranking order of the four scenarios does not change within the analyzed load forecast range.
Table 7-7: Sensitivity Study Results – Load Forecast
7.4.5 CO2 Emission Offset Allowance The sensitivity/impact of CO2 offset allowance on the total system cost is presented in Table 7-8. The analysis was carried out for two values, N$ 60 per Tonne and N$ 200 per tonne. As the total amount of offset allowance is a linear function of the offset allowance per tonne, the two cost values could be used to calculate any other offset allowances on CO2. The last row of the table shows the increase in total system cost for every N$ 10 per tonne increase in CO2 offset allowance. The results indicate that even with this significant range in the amount for the CO2 offset allowance there is no change in the ranking order of these coal (Scenarios 1 and 6) and natural gas (Scenarios 3 and 5) based scenarios.
Table 7-8: Sensitivity Study Results – CO2 Emission Offset Allowance
7.5 Conclusions on Scenarios While the capital intensive Kudu gas to power project remains a high priority for the Government by virtue of its being an indigenous resource ear-marked for base load generation intended to reduce the impact of imports and enhance security of supply, the current pressure on state resources due to competing socio-economic needs has necessitated exercising flexibility by deferring it to the medium-to-long term time slot. In the light of the recent assessment provided by Fitch rating agency, Government is obliged to strictly exercise pragmatism and fiscal prudence in managing its financial commitments, including debt servicing. Consequently, as highlighted further below, the sequential priority order comprises Plan A addressing the base load plant requirements without Kudu and Baynes, Plan B with Kudu and Baynes and Plan C with high renewable energy content.
1 3 5 6Base Case 85,987.7 88,688.9 95,809.1 83,661.6
Low Load Forecast 78,638.3 81,509.5 88,865.8 76,301.5Increase (Decrease) -7,349.3 -7,179.4 -6,943.3 -7,360.0
High Load Forecast 96,988.2 100,075.7 106,570.6 94,769.9Increase (Decrease) 11,000.5 11,386.9 10,761.5 11,108.4
ScenarioParameter/Variation
The National Integrated Resource Plan Review and Update – Final Report
September 2016 Page 136 of 155
7.5.1 Base Case Plan – Plan A The analysis of this section indicates that Scenarios 6 and 8 have total life cycle costs at the lower end of the range for all the above 11 scenarios and at the same time have balanced ratings on important non-cost criteria. While Scenario 7 is estimated to have higher life cycle costs it also scored well on a number of the non-cost criteria. Each of these scenarios satisfies the load forecast at the selected level of reliability and each has a slightly different mix of types/sizes of plants reflecting the operating characteristics and costs of each plant type. From these three scenarios, Scenario 6 was selected as the Base Case Plan (also referred to as Plan A) for the NIRP. As further developed in Section 8, a competitive bidding program is recommended to test the market including the costs of the fuel delivery infrastructure and the extent to which developers are willing to fix fuel prices for the base load generation fuels considered in Scenarios 6, 7 and 8. This process will allow the base load component of Plan A to be finalised.
7.5.2 Large Local Resource Project Realization - Alternative Path – Plan B Plan A does not include the Kudu and Baynes projects, both of which are considered to be heavily dependent on Government of Namibia investment, externalities beyond the direct control of the Government of Namibia and development decisions that may be hard to finalise in the timeframes needed to meet the projected power requirements for the next decade. Plan B is taken to be Scenario 5 which includes both Kudu (2021 on-line date) and Baynes (2026 on-line date). Plan A could transition to Plan B when the current hurdles to the Kudu and Baynes projects are overcome.
7.5.3 Renewable Prioritization - Alternative Path – Plan C A High Renewables option could also be selected if the international support on which the INDC is predicated materialises. This would be a variant on Plan A and could involve Scenario 9, 10 or 11 depending on the outcome of the bidding process or Plan B. Any of these Scenarios would achieve the 70% annual kWh generation from renewables that is put forward as the target by 2030 in the INDC.
7.5.4 Conclusion The Base Case Plan (Plan A) is further elaborated in Section 8.

The National Integrated Resource Plan Review and Update – Final Report
September 2016 Page 137 of 155
8. Implementation Plan for the NIRP The previous section concludes that the path forward for the Namibian ESI should include three key activities as follows:
1. Secure access to short-term rental generation by 2018 or, if available at better terms, guaranteed access to power markets for electricity imports.
2. Install fossil-fuel base load generation by 2021.
3. Continue programs to install solar PV and wind generation and further investigate the use of other renewable power technologies.
The implementation plan for the NIRP presented in this section includes both short-term and medium-term project related activities as well as the ongoing process for monitoring the implementation of the plan.
Government will also pursue the realization of the Kudu and Baynes power projects at its discretion, and should one or both of these projects become realizable then implementation can be switched over to a plan that includes these projects.
8.1 Key Factors to Consider The following are key factors to consider with respect to the implementation plan:
• The current level of reliance on imports (that sometimes extends beyond the contractual obligations for imports to the spot market) is perilous. In this regard it is noted that the 200 MW contract with ESKOM for import during peak load hours is subject to reduction if there is a need for load shedding in the ESKOM system.
• The existing “commitments” for renewables based projects in Namibia will do very little to secure the supply of power during peak load evening hours.
• There has not been a comprehensive study done to establish the level of intermittent generation that could be integrated in the Namibian power system.
• The use of government funds for direct or indirect investment in base load generation would reduce the government funding available for education, health care and other national priorities.
• Private sector offers for large power plants on a “non-solicited” basis is problematic as it is difficult to conclude to the satisfaction of stakeholders that project “x” is a more suitable project than project “y” may be.
• The indicated cost differences between alternative base load generation types/fuels are not large and could be outweighed by the risk factors associated with any particular project.
• The development of a thermal power station in the central coastal area could offer the opportunity to utilise waste heat for thermal based desalination of sea water and thereby contribute to addressing the water supply situation in Namibia. The potential benefit of this possibility should be considered when deciding on preferred technologies and sites.

The National Integrated Resource Plan Review and Update – Final Report
September 2016 Page 138 of 155
• Most recently, ESKOM apparently has excess generation capacity available once again and has been seeking to sell this capacity. If this is the case, and this capacity can be made available on secure terms, an acceptable price and for an appropriate timeframe then this could be considered instead of implementing the local reciprocating engine based emergency generation. This implementation plan however proceeds on the assumption that this may not be the case.
8.2 Recommended Implementation Plan for NIRP The path forward for implementation of the NIRP is recommended to be as outlined below. Table 8-1 provides year by year details on the implementation plan. The details shown in this table are for Scenario 6 (which includes coal-fired base load generation) and will vary depending on which generation technology and fuel type is selected in point 2 below.
1. In the absence of firm supply commitments from regional suppliers, complete arrangements for 120 MW of emergency generation that NamPower has already received bids for. The contract should allow for the suitably documented fixed costs of the project to be paid in full. Plant dispatch is to be fully controlled by NamPower at an agreed variable O & M cost, plus actual fuel cost. Starting in 2018, contract term of 3 to 4 years extendible for up to three 1-year periods should be considered. International consultants are to be retained to vet the contract and project implementation based on international standards.
2. Carry out an international competitive bidding process for approximately 300 MW (the exact capacity is to be based on unit sizes available from preferred bids) for coal, LNG or HFO fuelled base load generation, which is to be in full operation by January 1, 2021. The project is to be built on a designated site which is owned by Government of Namibia prior to the bids. The site should be selected to require minimum cost for transmission to connect the project to the grid. Water supply should require dedicated desalination by the power plant developer, if relevant. The cost of fuel landing and transport arrangements should form part of the tender, or be separately assessed by Government and taken into consideration in the tender evaluation. A suitably qualified international consultant is to be directly responsible for the evaluation of the bids and recommending the winning bidder based on criteria agreed on in advance with the Government, and should be a key member of the implementation team to ensure transparency.
3. Require that MME commissions and completes a comprehensive renewables grid integration study. This will be important to ensure that the country’s solar and wind resources can make an effective contribution to the power system.
4. Continue with the program for private sector investment in solar PV and wind power plants as shown in the implementation plan through competitive bidding, ensuring that prices and terms offered are attractive enough to incentivise investment.

The National Integrated Resource Plan Review and Update – Final Report
September 2016 Page 139 of 155
5. Require that MME commissions and completes a feasibility study on encroacher bush based biomass power plants. If the study shows this option to be reasonably attractive, seek funding for a 5-10 MW demonstration / pilot plant to test/confirm the operational aspects of such a power plant. With these activities completed and assuming positive results, the implementation plan includes installation of small encroacher bush based biomass plants beginning in 2023.
6. Require that MME commissions and completes a feasibility study on concentrated solar power plants. The implementation plan includes installation of CSP plants beginning in 2026.
7. Continue development work on the Kudu and Baynes projects with the objective of reaching a decision by September of 2020; on implementation of either or both projects with target implementation dates in the period between 2025 to 2030.
Table 8-1: National Integrated Resource Plan – Implementation Plan A and Schedule
The total cost (capital and operating over the period 2016 to 2035) of the recommended plan is in the range N$ 83,662 million to N$ 96,139 million. At the lower end of this scale, based on coal-fired base load plant technology, the cost would be made up of the components shown in Table 8-2.
System
Thermal (3) Import Plant Capacity Capacity Renewable Thermal Renewable (2) Thermal Import Total Peak Energy (2)
Hydro Solar PV Wind Biomass CSP 0 MW MW N$ millions MW GWhExisting 346.5 9.5 135.8 330 821.8
2015 1,200.82016 821.8 2,744.4 1,530.0 923.4 1,788.1 4,241.5 645.7 4,241.52017 70 20 911.8 1,295.9 1,713.9 928.0 1,907.2 4,549.2 692.5 4,549.22018 50 49 120 Paratus & Imp 26.3 1,104.5 343.1 3,305.1 2,011.2 1,598.3 1,170.6 4,780.1 733.4 4,780.12019 1,104.5 228.7 4,406.8 2,011.2 1,656.0 1,263.1 4,930.3 758.4 4,930.32020 20 1,124.5 1,108.4 3,305.1 2,063.8 1,697.8 1,338.6 5,100.2 785.9 5,100.22021 300 ICRE & Imp 370 1,054.5 1,048.1 2,063.8 2,701.2 522.7 5,287.7 815.9 5,287.72022 50 1,104.5 755.3 3,305.1 2,217.1 2,694.8 531.3 5,443.2 841.7 5,443.22023 1,104.5 537.9 4,406.8 2,217.1 2,797.4 591.7 5,606.1 868.5 5,606.12024 20 20 1,144.5 1,869.5 3,305.1 2,436.0 2,775.7 581.2 5,792.9 898.5 5,792.92025 300 Van Eck & Imp 188 1,256.5 2,573.1 2,423.3 3,422.6 145.0 5,990.9 930.7 5,990.92026 20 1,276.5 4,573.5 2,475.9 3,635.8 85.1 6,196.9 963.8 6,196.92027 50 1,326.5 3,083.3 2,826.3 3,532.9 65.5 6,424.8 1,001.0 6,424.82028 50 20 1,396.5 2,178.7 3,146.0 3,454.1 55.1 6,655.2 1,038.7 6,655.22029 50 1,446.5 2,167.4 3,483.6 3,369.1 42.6 6,895.3 1,077.6 6,895.32030 20 1,466.5 2,996.7 3,536.2 3,545.6 65.1 7,146.9 1,118.5 7,146.92031 20 1,486.5 3,693.8 3,702.7 3,623.0 79.4 7,405.1 1,158.7 7,405.12032 20 50 1,556.5 3,870.9 4,092.8 3,487.6 55.1 7,635.6 1,195.4 7,635.62033 20 1,576.5 3,561.7 4,259.3 3,586.4 72.2 7,917.9 1,239.3 7,917.92034 50 1,626.5 1,526.4 4,596.9 3,523.8 60.2 8,180.9 1,280.7 8,180.92035 50 1,676.5 4,947.3 3,488.0 54.2 8,489.5 1,328.5 8,489.5Total 346.5 229.5 149 80 250 855.8 350 584.3 41,357.7 22,034.0
Note: (1) For Scenario 6 of Option 2(2) The values shown do not include the contribution of Solar PV installations implemented under the Net Metering Program(3) Assumes the short-term emergency diesel generators would be rented and there would be no investment cost(4) Annual capital investment flow as per the typical capital disbursement schedule for each type of new plant(5) The capital investment required for solar PV installations under the Net Metering Program is not included
63,391.71055 1205.8 584.3
1,677
RetirementYear
Load ForecastEnergy
ProductionInvestment Cost (4), (5)
New Generation
GWh
New GenerationAddition(1)
Renewable (MW) (2)

The National Integrated Resource Plan Review and Update – Final Report
September 2016 Page 140 of 155
Table 8-2: Estimated Present Value of the Total Cost of the Recommended Plan
It is noted in Section 7.5.2 that Plan A could transition to Plan B when the current hurdles to the Kudu and Baynes projects are overcome. For information purposes, the Plan B Implementation Schedule is given in Table 8-3.
Table 8-3: National Integrated Resource Plan – Implementation Plan B and Schedule
Item N$ MillionsCapital cost 17 924 Fuel cost 13 427 O&M cost 33 904 Unserved energy (EUE) 761 Emissions 1 366 Subtotal 67 382 15 year end-effect 16 279 Total 83 662
System
Thermal (3) Import Plant Capacity Capacity Renewable Thermal Renewable (2) Thermal Import Total Peak Energy (2)
Hydro Solar PV Wind Biomass CSP 0 MW MW N$ millions MW GWhExisting 346.5 9.5 135.8 330 821.8
2015 1,200.82016 821.8 2,744.4 1,530.0 923.4 1,788.1 4,241.5 645.7 4,241.52017 70 20 911.8 1,295.9 1,713.9 928.0 1,907.2 4,549.2 692.5 4,549.22018 50 49 120 Paratus & Imp 26.3 1,104.5 343.1 2,814.1 2,011.2 1,598.3 1,170.6 4,780.1 733.4 4,780.12019 1,104.5 1,224.2 3,752.2 2,011.2 1,656.0 1,263.1 4,930.3 758.4 4,930.32020 20 1,124.5 3,408.5 2,814.1 2,063.8 1,697.8 1,338.6 5,100.2 785.9 5,100.22021 50 442 ICRE & Imp 370 1,246.5 4,446.8 2,414.2 2,427.0 446.5 5,287.7 815.9 5,287.72022 50 1,296.5 10,244.1 2,567.5 2,428.6 447.1 5,443.2 841.7 5,443.22023 20 1,316.5 11,450.0 2,733.9 2,425.4 446.9 5,606.1 868.5 5,606.12024 20 20 1,356.5 9,522.6 2,940.1 2,407.2 445.6 5,792.9 898.5 5,792.92025 40 150 Van Eck & Imp 188 1,358.5 2,219.7 4,311.4 1,507.6 171.9 5,990.9 930.7 5,990.92026 300 20 1,678.5 1,108.4 5,112.4 1,026.9 57.5 6,196.9 963.8 6,196.92027 1,678.5 738.9 5,140.2 1,216.9 67.6 6,424.8 1,001.0 6,424.82028 50 1,728.5 343.1 5,296.8 1,286.7 71.7 6,655.2 1,038.7 6,655.22029 1,728.5 228.7 5,296.8 1,512.7 85.8 6,895.3 1,077.6 6,895.32030 20 1,748.5 343.1 5,349.4 1,699.8 97.7 7,146.9 1,118.5 7,146.92031 1,748.5 1,755.2 5,349.4 1,942.4 113.3 7,405.1 1,158.7 7,405.12032 20 1,768.5 3,561.7 5,401.9 2,106.2 127.4 7,635.6 1,195.4 7,635.62033 1,768.5 3,561.7 5,401.9 2,351.4 164.6 7,917.9 1,239.3 7,917.92034 50 1,818.5 1,526.4 5,752.3 2,276.7 151.9 8,180.9 1,280.7 8,180.92035 50 1,868.5 0.0 6,102.7 2,234.1 152.7 8,489.5 1,328.5 8,489.5Total 646.5 229.5 149 80 300 697.8 350 584.3 61,267.2 9,380.4
Note: (1) For Scenario 5 of Option 2(2) The values shown do not include the contribution of Solar PV installations implemented under the Net Metering Program(3) Assumes the short-term emergency diesel generators would be rented and there would be no investment cost(4) Annual capital investment flow as per the typical capital disbursement schedule for each type of new plant(5) The capital investment required for solar PV installations under the Net Metering Program is not included
RetirementYear
Load ForecastEnergy
ProductionInvestment Cost (4), (5)
New Generation
GWh
New GenerationAddition(1)
Renewable (MW) (2)
70,647.61405 1047.8 584.3
1,869

The National Integrated Resource Plan Review and Update – Final Report
September 2016 Page 141 of 155
8.3 Monitoring, Review and Update of the NIRP The following actions are recommended to be put in place to ensure that implementation of the NIRP proceeds as planned, and that the NIRP is kept updated as circumstances and technologies change:
1. By the end of 2016, appoint a Steering Committee to review progress on the NIRP every 6 months, and formally report to the Minister of Mines and Energy within two weeks of every semi-annual meeting and recommend plausible actions. The Committee should be chaired by the MME, and include representatives of the ECB, NamPower, NAMCOR, the National Planning Commission, Ministry of Finance, Ministry of Environment and Tourism, the electricity distribution industry, and IPPs.
2. The Committee should annually review the major advances in technology, technology prices and the load forecast, and make recommendations to the Minister MME when such changes necessitate an adjustment or full review of the NIRP. Future reviews should also consider the potential impact of off-grid solutions.
3. From the onset and in subsequent reviews, the NIRP compliance with provisions of the Grid Code must be ensured. This compliance requirement equally applies to the Renewable Energy Policy as well.
4. Independent of the above annual review by the Committee, the NIRP should be fully reviewed and updated by the MME at intervals not exceeding five years.
5. The Committee should determine at what intervals the renewables grid integration study is to be reviewed and updated, to take actual developments into consideration, as well as advances in technology and other factors that could affect the results of such a study.
6. Electricity storage is considered a potential game-changer for the capability of the system to accommodate intermittent generation sources, and the ability of renewables to contribute capacity during peak demand periods. The Committee should therefore monitor the technical and cost developments of storage technologies as part of the implementation of the NIRP, and bring these on board once mature and economically viable.

The National Integrated Resource Plan Review and Update – Final Report
September 2016
Appendix A: Terms of Reference
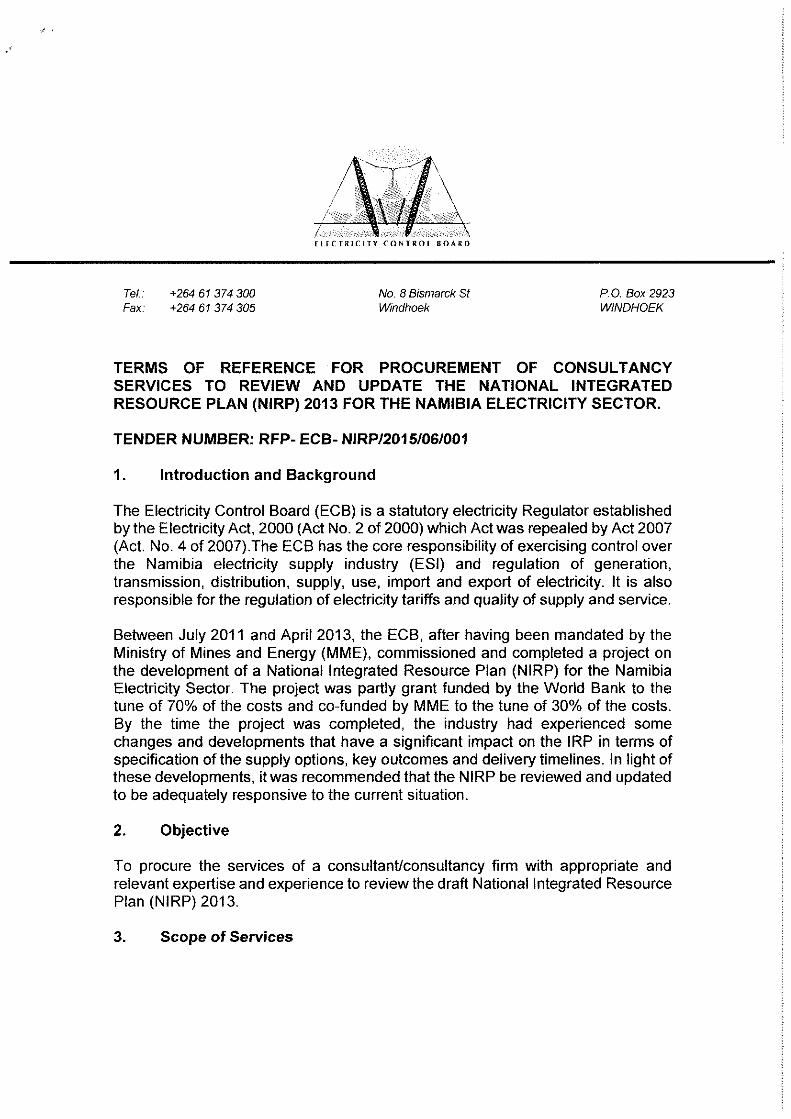


The National Integrated Resource Plan Review and Update – Final Report
September 2016
Appendix B: Data Collection Items


Data, Information and Assumptions Needed to Update NIRP 2013
1. Status of Existing Generating Resources – Capacity, Generation, Operating Mode ‐ Now and Planned, Technical Data
a. Ruacana Hydroelectric Station b. Van Eck Coal Plant c. Paratus Diesel d. Anixas Power Station e. Others?
NamPower, Generation Department
2. Power Imports – Contract supply amount, firm or interruptible power,
duration of agreement, price
a. Eskom
b. Mozambique
c. ZESA d. ZESCO e. Others?
NamPower, Trading Department
3. Power System Operations 2012‐2015 (Statistical Bulletin)
a. Peak Demand
b. Sales c. Losses d. Generation e. Number of customers
ECB, Statistical Bulletin, NamPower

4. Government Data
a. Vision 2030 b. White Paper on Energy Policy
c. Economic growth
d. Demographic data updates
e. Other inputs? NPC
Tender for White Paper Review
Ministry of Mines and Energy?
5. Load Forecast a. Aggregated statistical data by region and by customer type
b. Analysis of sales trends for last few years/explanations for any large
variances
c. Any recent load forecasts prepared d. Information on any large new loads expected to join the system
NamPower, Load Forecasting Department
Association of Mines
REDs – two largest?
6. Current Status of Major New Generation Options – specifics on progress
to date and realistic in‐service dates; “committed projects”
a. Kudu b. Other gas options – CNG? c. Coal‐fired plant d. Baynes and other hydro e. Import contracts
f. Others?
g. Associated transmission developments
NamPower, Planning and Trading Departments
Kudu Project Group
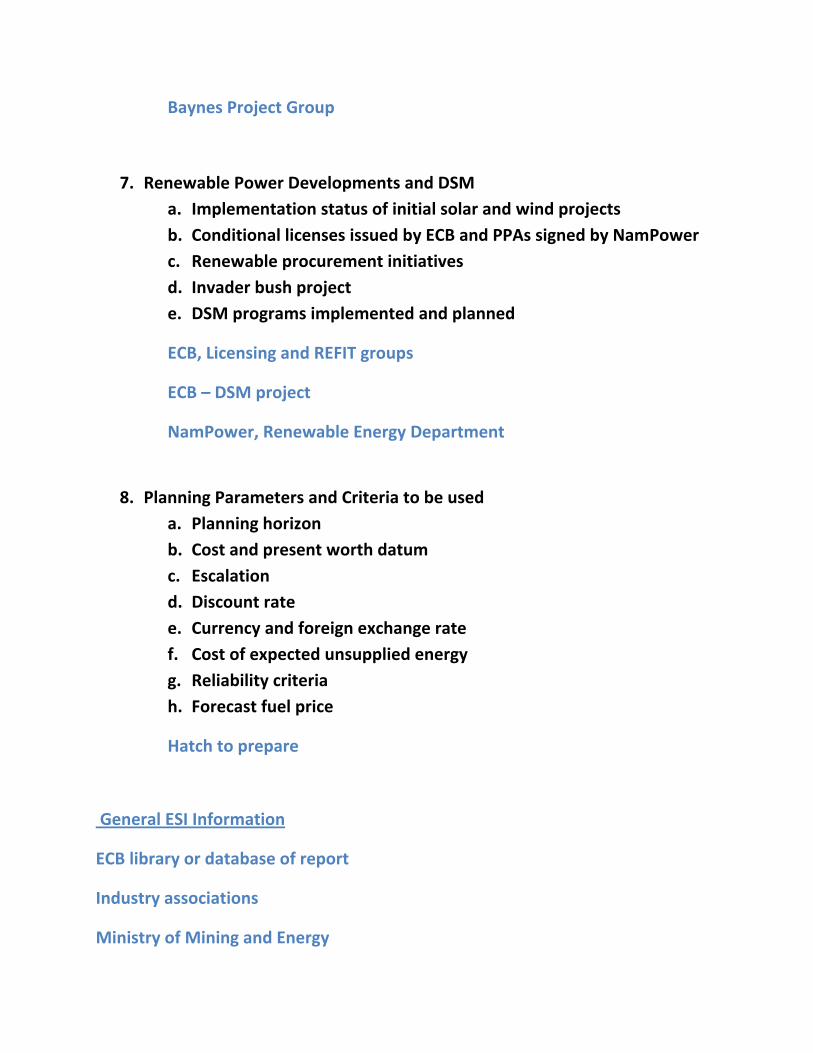
Baynes Project Group
7. Renewable Power Developments and DSM
a. Implementation status of initial solar and wind projects
b. Conditional licenses issued by ECB and PPAs signed by NamPower
c. Renewable procurement initiatives
d. Invader bush project e. DSM programs implemented and planned
ECB, Licensing and REFIT groups
ECB – DSM project
NamPower, Renewable Energy Department
8. Planning Parameters and Criteria to be used
a. Planning horizon b. Cost and present worth datum
c. Escalation d. Discount rate e. Currency and foreign exchange rate f. Cost of expected unsupplied energy
g. Reliability criteria h. Forecast fuel price
Hatch to prepare
General ESI Information
ECB library or database of report
Industry associations
Ministry of Mining and Energy

Review and Update of the National Integrated Resource Plan (NIRP)
Survey of Distributors Response by: __________________ Date:_____________
1 What has been the average annual rate of load growth in your distribution area over the last 5 years?
2 What do you consider to be the main contributing factors for recent/current load growth for each of your groups of customers?
Domestic ‐
Commercial ‐
Industrial ‐
3 Do you prepare long‐term load forecasts for your distribution area? If so can the most recent forecast be provided?
4 What do you consider will be the main reasons for future load growth in your domestic, commercial and industrial customer groups?
Domestic ‐
Commercial ‐
Industrial ‐
5 For each of your domestic, commercial and industrial customer groups, can you comment on the extent to which they have already
implemented demand side management opportunities such as energy efficient lighting, solar water heaters etc.?
Domestic ‐
Commercial ‐
Industrial ‐
6 In your distribution area, what would you say is the % of households connected to your network
Rural areas ‐
Urban areas ‐
7 To what extent do you think your customers have implemented behind the meter renewables based generation such as solar PV?
(please provide any specifc data that you have)
Domestic ‐
Commercial ‐
Industrial ‐

8 Are there cases where you currently buy power from Independent Power Producers embedded in your distribution area?
9 Are there some of your customers that have significant backup generation that could be operated to supply power to your distribtion system?
10 Is there a material amount of load in your distribution area that you are not able to supply due to delivery constraints in your system?
Please provide comments on the ESI at the national level that you would like to have considered in the preparation of the update to the NIRP
1
2
3
4
etc

The National Integrated Resource Plan Review and Update – Final Report
September 2016
Appendix C: Unit Addition/Retirement Schedules

Additions-Alt-2-B01-Coal.xls Namibia 9/6/2016
Individual Cumulative Discount (1)
Available Individual Cumulative Discount (1)
Available LOLP EUE
(MW) (MW) (MW) (%) (Day/Year) (%)
492 492 10 482 330 330 0 330
2016 492 482 330 0 330 812 646 167 26 0.02 0.000
2017 70 MW Solar and 20 MW Import 70 562 70 482 20 350 0 350 832 693 140 20 0.03 0.000
2018 50 MW Solar, 49 MW Wind, 120
MW HFO ICRE and Retirement of
Paratus and 20 MW Import
213 775 89 606 -20 330 0 330 936 733 202 28 0.00 0.000
2019 775 606 330 0 330 936 758 177 23 0.00 0.000
2020 20 MW Solar 20 795 20 606 330 0 330 936 786 150 19 0.01 0.000
2021 300 MW Coal and Retirement of 120
MW HFO ICRE, SPSA and ZESC
180 975 786 -250 80 0 80 866 816 50 6 0.59 0.013
2022 50 MW Wind 50 1,025 40 796 80 0 80 876 842 34 4 1.13 0.025
2023 1,025 796 80 0 80 876 869 7 1 1.79 0.038
2024 20 MW Solar and 20 MW Biomass 40 1,065 20 816 80 0 80 896 899 -3 0 1.80 0.038
2025 442 MW CC and Retirement of Van
Eck and ZESA
334 1,399 1150 -80 0 0 0 1150 931 219 24 1.72 0.047
2026 20 MW Solar and 50 MW CSP 70 1,469 20 1200 0 0 0 1200 964 236 24 1.47 0.046
2027 20 MW Biomass 20 1,489 1220 0 0 0 1220 1,001 219 22 1.71 0.052
2028 50 MW Wind and 50 MW CSP 100 1,589 40 1280 0 0 0 1280 1,039 241 23 1.11 0.030
2029 1,589 1280 0 0 0 1280 1,078 202 19 1.64 0.045
2030 20 MW Solar and 20 MW Biomass 40 1,629 20 1300 0 0 0 1300 1,119 181 16 1.70 0.047
2031 50 MW CSP 50 1,679 1350 0 0 0 1350 1,159 191 16 1.43 0.035
2032 20 MW Solar and 20 MW Biomass 40 1,719 20 1370 0 0 0 1370 1,195 174 15 1.50 0.036
2033 50 MW CSP 50 1,769 1420 0 0 0 1420 1,239 181 15 1.31 0.029
2034 1,769 1420 0 0 0 1420 1,281 139 11 1.98 0.046
2035 50 MW CSP 50 1,819 1470 0 0 0 1470 1,329 141 11 1.82 0.040
Note:
(2) It is assumed that the Namibia system will get 200 MW emergency assistance from neighboring systems for the period from 2016 to 2020 and it is increased to 400 MW for the remaining study period, which is
not included in the capacity reserve calculation
Unit/Plant Addition/Retirement Schedule - Alternative 2, Scenario 1
YearInternal External
Appendix C-1
Project Name
Annual
Peak
Reliability
(MW)
Addition/RetirementTotal
CapacityReserve
(2)
(1) The capacity reduced in calculation of the expected generation capacity at the time of system peak. It is assumed that solar PV will have no contribution to system peak while wind power contributes 20% of its
installed capacity

Additions-Alt-2-B02-LNG CC.xls Namibia 9/6/2016
Individual Cumulative Discount (1)
Available Individual Cumulative Discount (1)
Available LOLP EUE
(MW) (MW) (MW) (%) (Day/Year) (%)
492 492 10 482 330 330 0 330
2016 492 482 330 0 330 812 646 167 26 0.02 0.000
2017 70 MW Solar and 20 MW Import 70 562 70 482 20 350 0 350 832 693 140 20 0.03 0.000
2018 50 MW Solar, 49 MW Wind, 120
MW HFO ICRE and Retirement of
Paratus and 20 MW Import
213 775 89 606 -20 330 0 330 936 733 202 28 0.00 0.000
2019 775 606 330 0 330 936 758 177 23 0.00 0.000
2020 20 MW Solar 20 795 20 606 330 0 330 936 786 150 19 0.01 0.000
2021 300 MW CC and Retirement of 120
MW HFO ICRE, SPSA and ZESC
180 975 786 -250 80 0 80 866 816 50 6 0.48 0.010
2022 50 MW Wind 50 1,025 40 796 80 0 80 876 842 34 4 0.91 0.020
2023 1,025 796 80 0 80 876 869 7 1 1.43 0.031
2024 20 MW Solar and 20 MW Biomass 40 1,065 20 816 80 0 80 896 899 -3 0 1.44 0.030
2025 442 MW CC and Retirement of Van
Eck and ZESA
334 1,399 1150 -80 0 0 0 1150 931 219 24 1.53 0.040
2026 20 MW Solar and 50 MW CSP 70 1,469 20 1200 0 0 0 1200 964 236 24 1.29 0.037
2027 1,469 1200 0 0 0 1200 1,001 199 20 1.98 0.055
2028 50 MW Wind and 20 MW Biomass 70 1,539 40 1230 0 0 0 1230 1,039 191 18 1.84 0.049
2029 50 MW CSP 50 1,589 1280 0 0 0 1280 1,078 202 19 1.47 0.037
2030 20 MW Solar 20 1,609 20 1280 0 0 0 1280 1,119 161 14 1.97 0.050
2031 50 MW CSP 50 1,659 1330 0 0 0 1330 1,159 171 15 1.60 0.039
2032 20 MW Solar and 20 MW Biomass 40 1,699 20 1350 0 0 0 1350 1,195 154 13 1.71 0.038
2033 50 MW CSP 50 1,749 1400 0 0 0 1400 1,239 161 13 1.46 0.031
2034 20 MW Biomass 20 1,769 1420 0 0 0 1420 1,281 139 11 1.79 0.038
2035 50 MW CSP 50 1,819 1470 0 0 0 1470 1,329 141 11 1.66 0.034
Note:
(2) It is assumed that the Namibia system will get 200 MW emergency assistance from neighboring systems for the period from 2016 to 2020 and it is increased to 400 MW for the remaining study period, which is
not included in the capacity reserve calculation
Unit/Plant Addition/Retirement Schedule - Alternative 2, Scenario 2
YearInternal External
Appendix C-2
Project Name
Annual
Peak
Reliability
(MW)
Addition/RetirementTotal
CapacityReserve
(2)
(1) The capacity reduced in calculation of the expected generation capacity at the time of system peak. It is assumed that solar PV will have no contribution to system peak while wind power contributes 20% of its
installed capacity

Additions-Alt-2-B03-Kudu CC.xls Namibia 9/6/2016
Individual Cumulative Discount (1)
Available Individual Cumulative Discount (1)
Available LOLP EUE
(MW) (MW) (MW) (%) (Day/Year) (%)
492 492 10 482 330 330 0 330
2016 492 482 330 0 330 812 646 167 26 0.02 0.000
2017 70 MW Solar and 20 MW Import 70 562 70 482 20 350 0 350 832 693 140 20 0.03 0.000
2018 50 MW Solar, 49 MW Wind, 120
MW HFO ICRE and Retirement of
Paratus and 20 MW Import
213 775 89 606 -20 330 0 330 936 733 202 28 0.00 0.000
2019 775 606 330 0 330 936 758 177 23 0.00 0.000
2020 20 MW Solar 20 795 20 606 330 0 330 936 786 150 19 0.01 0.000
2021 442 MW CC and 50 MW CSP and
Retirement of 120 MW HFO ICRE,
SPSA and ZESC
372 1,167 978 -250 80 0 80 1058 816 242 30 1.96 0.045
2022 50 MW Wind 50 1,217 40 988 80 0 80 1068 842 226 27 1.99 0.047
2023 20 MW Biomass 20 1,237 1008 80 0 80 1088 869 219 25 2.00 0.048
2024 20 MW Solar and 20 MW Biomass 40 1,277 20 1028 80 0 80 1108 899 209 23 2.00 0.048
2025 300 MW Coal and Retirement of Van
Eck and ZESA
192 1,469 1220 -80 0 0 0 1220 931 289 31 0.50 0.013
2026 20 MW Solar 20 1,489 20 1220 0 0 0 1220 964 256 27 1.19 0.036
2027 1,489 1220 0 0 0 1220 1,001 219 22 1.73 0.052
2028 50 MW Wind and 20 MW Biomass 70 1,559 40 1250 0 0 0 1250 1,039 211 20 1.64 0.047
2029 50 MW CSP 50 1,609 1300 0 0 0 1300 1,078 222 21 1.31 0.035
2030 20 MW Solar 20 1,629 20 1300 0 0 0 1300 1,119 181 16 1.72 0.047
2031 50 MW CSP 50 1,679 1350 0 0 0 1350 1,159 191 16 1.43 0.035
2032 20 MW Solar and 20 MW Biomass 40 1,719 20 1370 0 0 0 1370 1,195 174 15 1.50 0.036
2033 50 MW CSP 50 1,769 1420 0 0 0 1420 1,239 181 15 1.31 0.029
2034 1,769 1420 0 0 0 1420 1,281 139 11 1.98 0.046
2035 50 MW CSP 50 1,819 1470 0 0 0 1470 1,329 141 11 1.82 0.040
Note:
Internal External
(2) It is assumed that the Namibia system will get 200 MW emergency assistance from neighboring systems for the period from 2016 to 2020 and it is increased to 400 MW for the remaining study period, which is
not included in the capacity reserve calculation
(1) The capacity reduced in calculation of the expected generation capacity at the time of system peak. It is assumed that solar PV will have no contribution to system peak while wind power contributes 20% of its
installed capacity
Appendix C-3
Project Name
Annual
Peak
Reliability
(MW)
Reserve (2)
Addition/RetirementTotal
Capacity
Unit/Plant Addition/Retirement Schedule - Alternative 2, Scenario 3
Year

Additions-Alt-2-B04-Kudu CC R.xls Namibia 9/6/2016
Individual Cumulative Discount (1)
Available Individual Cumulative Discount (1)
Available LOLP EUE
(MW) (MW) (MW) (%) (Day/Year) (%)
492 492 10 482 330 330 0 330
2016 492 482 330 0 330 812 646 167 26 0.02 0.000
2017 70 MW Solar and 20 MW Import 70 562 70 482 20 350 0 350 832 693 140 20 0.03 0.000
2018 50 MW Solar, 49 MW Wind, 120
MW HFO ICRE and Retirement of
Paratus and 20 MW Import
213 775 89 606 -20 330 0 330 936 733 202 28 0.00 0.000
2019 775 606 330 0 330 936 758 177 23 0.00 0.000
2020 20 MW Solar 20 795 20 606 330 0 330 936 786 150 19 0.01 0.000
2021 442 MW CC and 50 MW CSP and
Retirement of 120 MW HFO ICRE,
SPSA and ZESC
372 1,167 978 -250 80 0 80 1058 816 242 30 1.96 0.045
2022 50 MW Wind 50 1,217 40 988 80 0 80 1068 842 226 27 1.99 0.047
2023 20 MW Biomass 20 1,237 1008 80 0 80 1088 869 219 25 2.00 0.048
2024 20 MW Solar and 20 MW Biomass 40 1,277 20 1028 80 0 80 1108 899 209 23 2.00 0.048
2025 80 MW Biomass and 100 MW CSP
and Retirement of Van Eck and
ZESA
72 1,349 1100 -80 0 0 0 1100 931 169 18 1.93 0.049
2026 20 MW Solar and 50 MW CSP 70 1,419 20 1150 0 0 0 1150 964 186 19 1.83 0.038
2027 20 MW Biomass 20 1,439 1170 0 0 0 1170 1,001 169 17 2.01 0.046
2028 50 MW Wind and 20 MW Biomass 70 1,509 40 1200 0 0 0 1200 1,039 161 16 1.89 0.041
2029 50 MW CSP 50 1,559 1250 0 0 0 1250 1,078 172 16 1.55 0.029
2030 20 MW Solar and 20 MW Biomass 40 1,599 20 1270 0 0 0 1270 1,119 151 14 1.68 0.031
2031 20 MW Biomass 20 1,619 1290 0 0 0 1290 1,159 131 11 1.97 0.041
2032 20 MW Solar and 50 MW CSP 70 1,689 20 1340 0 0 0 1340 1,195 144 12 1.49 0.025
2033 50 MW CSP 50 1,739 1390 0 0 0 1390 1,239 151 12 1.25 0.020
2034 1,739 1390 0 0 0 1390 1,281 109 9 1.85 0.036
2035 50 MW CSP 50 1,789 1440 0 0 0 1440 1,329 111 8 1.67 0.031
Note:
Internal External
(2) It is assumed that the Namibia system will get 200 MW emergency assistance from neighboring systems for the period from 2016 to 2020 and it is increased to 400 MW for the remaining study period, which is
not included in the capacity reserve calculation
(1) The capacity reduced in calculation of the expected generation capacity at the time of system peak. It is assumed that solar PV will have no contribution to system peak while wind power contributes 20% of its
installed capacity
Appendix C-4
Project Name
Annual
Peak
Reliability
(MW)
Reserve (2)
Addition/RetirementTotal
Capacity
Unit/Plant Addition/Retirement Schedule - Alternative 2, Scenario 4
Year

Additions-Alt-2-B05-Kudu Baynes.xls Namibia 9/6/2016
Individual Cumulative Discount (1)
Available Individual Cumulative Discount (1)
Available LOLP EUE
(MW) (MW) (MW) (%) (Day/Year) (%)
492 492 10 482 330 330 0 330
2016 492 482 330 0 330 812 646 167 26 0.02 0.000
2017 70 MW Solar and 20 MW Import 70 562 70 482 20 350 0 350 832 693 140 20 0.03 0.000
2018 50 MW Solar, 49 MW Wind, 120
MW HFO ICRE and Retirement of
Paratus and 20 MW Import
213 775 89 606 -20 330 0 330 936 733 202 28 0.00 0.000
2019 775 606 330 0 330 936 758 177 23 0.00 0.000
2020 20 MW Solar 20 795 20 606 330 0 330 936 786 150 19 0.01 0.000
2021 442 MW CC and 50 MW CSP and
Retirement of 120 MW HFO ICRE,
SPSA and ZESC
372 1,167 978 -250 80 0 80 1058 816 242 30 1.96 0.045
2022 50 MW Wind 50 1,217 40 988 80 0 80 1068 842 226 27 1.99 0.047
2023 20 MW Biomass 20 1,237 1008 80 0 80 1088 869 219 25 2.00 0.048
2024 20 MW Solar and 20 MW Biomass 40 1,277 20 1028 80 0 80 1108 899 209 23 2.00 0.048
2025 40 MW Biomass and 150 MW CSP
and Retirement of Van Eck and
ZESA
82 1,359 1110 -80 0 0 0 1110 931 179 19 1.69 0.040
2026 20 MW Solar and 300 MW Hydro 320 1,679 20 1410 0 0 0 1410 964 446 46 0.00 0.000
2027 1,679 1410 0 0 0 1410 1,001 409 41 0.01 0.000
2028 50 MW Wind 50 1,729 40 1420 0 0 0 1420 1,039 381 37 0.02 0.000
2029 1,729 1420 0 0 0 1420 1,078 342 32 0.05 0.000
2030 20 MW Solar 20 1,749 20 1420 0 0 0 1420 1,119 301 27 0.07 0.001
2031 1,749 1420 0 0 0 1420 1,159 261 23 0.17 0.002
2032 20 MW Solar 20 1,769 20 1420 0 0 0 1420 1,195 224 19 0.32 0.004
2033 1,769 1420 0 0 0 1420 1,239 181 15 0.83 0.011
2034 50 MW CSP 50 1,819 1470 0 0 0 1470 1,281 189 15 0.59 0.008
2035 50 MW CSP 50 1,869 1520 0 0 0 1520 1,329 191 14 0.54 0.007
Note:
Internal External
(2) It is assumed that the Namibia system will get 200 MW emergency assistance from neighboring systems for the period from 2016 to 2020 and it is increased to 400 MW for the remaining study period, which is
not included in the capacity reserve calculation
(1) The capacity reduced in calculation of the expected generation capacity at the time of system peak. It is assumed that solar PV will have no contribution to system peak while wind power contributes 20% of its
installed capacity
Appendix C-5
Project Name
Annual
Peak
Reliability
(MW)
Reserve (2)
Addition/RetirementTotal
Capacity
Unit/Plant Addition/Retirement Schedule - Alternative 2, Scenario 5
Year

Additions-Alt-2-B06-Coal 600.xls Namibia 9/6/2016
Individual Cumulative Discount (1)
Available Individual Cumulative Discount (1)
Available LOLP EUE
(MW) (MW) (MW) (%) (Day/Year) (%)
492 492 10 482 330 330 0 330
2016 492 482 330 0 330 812 646 167 26 0.02 0.000
2017 70 MW Solar and 20 MW Import 70 562 70 482 20 350 0 350 832 693 140 20 0.03 0.000
2018 50 MW Solar, 49 MW Wind, 120
MW HFO ICRE and Retirement of
Paratus and 20 MW Import
213 775 89 606 -20 330 0 330 936 733 202 28 0.00 0.000
2019 775 606 330 0 330 936 758 177 23 0.00 0.000
2020 20 MW Solar 20 795 20 606 330 0 330 936 786 150 19 0.01 0.000
2021 300 MW Coal and Retirement of 120
MW HFO ICRE, SPSA and ZESC
180 975 786 -250 80 0 80 866 816 50 6 0.59 0.013
2022 50 MW Wind 50 1,025 40 796 80 0 80 876 842 34 4 1.13 0.025
2023 1,025 796 80 0 80 876 869 7 1 1.79 0.038
2024 20 MW Solar and 20 MW Biomass 40 1,065 20 816 80 0 80 896 899 -3 0 1.80 0.038
2025 300 MW Coal and Retirement of Van
Eck and ZESA
192 1,257 1008 -80 0 0 0 1008 931 77 8 0.63 0.013
2026 20 MW Solar 20 1,277 20 1008 0 0 0 1008 964 44 5 1.91 0.041
2027 50 MW CSP 50 1,327 1058 0 0 0 1058 1,001 57 6 1.31 0.027
2028 50 MW Wind and 20 MW Biomass 70 1,397 40 1088 0 0 0 1088 1,039 49 5 1.22 0.024
2029 50 MW CSP 50 1,447 1138 0 0 0 1138 1,078 60 6 0.85 0.017
2030 20 MW Solar 20 1,467 20 1138 0 0 0 1138 1,119 19 2 1.44 0.027
2031 20 MW Biomass 20 1,487 1158 0 0 0 1158 1,159 -1 0 1.91 0.035
2032 20 MW Solar and 50 MW CSP 70 1,557 20 1208 0 0 0 1208 1,195 12 1 1.22 0.021
2033 20 MW Biomass 20 1,577 1228 0 0 0 1228 1,239 -12 -1 1.76 0.030
2034 50 MW CSP 50 1,627 1278 0 0 0 1278 1,281 -3 0 1.39 0.023
2035 50 MW CSP 50 1,677 1328 0 0 0 1328 1,329 -1 0 1.24 0.020
Note:
Internal External
(2) It is assumed that the Namibia system will get 200 MW emergency assistance from neighboring systems for the period from 2016 to 2020 and it is increased to 400 MW for the remaining study period, which is
not included in the capacity reserve calculation
(1) The capacity reduced in calculation of the expected generation capacity at the time of system peak. It is assumed that solar PV will have no contribution to system peak while wind power contributes 20% of its
installed capacity
Appendix C-6
Project Name
Annual
Peak
Reliability
(MW)
Reserve (2)
Addition/RetirementTotal
Capacity
Unit/Plant Addition/Retirement Schedule - Alternative 2, Scenario 6
Year

Additions-Alt-2-B07-LNG CC 600.xls Namibia 9/6/2016
Individual Cumulative Discount (1)
Available Individual Cumulative Discount (1)
Available LOLP EUE
(MW) (MW) (MW) (%) (Day/Year) (%)
492 492 10 482 330 330 0 330
2016 492 482 330 0 330 812 646 167 26 0.02 0.000
2017 70 MW Solar and 20 MW Import 70 562 70 482 20 350 0 350 832 693 140 20 0.03 0.000
2018 50 MW Solar, 49 MW Wind, 120
MW HFO ICRE and Retirement of
Paratus and 20 MW Import
213 775 89 606 -20 330 0 330 936 733 202 28 0.00 0.000
2019 775 606 330 0 330 936 758 177 23 0.00 0.000
2020 20 MW Solar 20 795 20 606 330 0 330 936 786 150 19 0.01 0.000
2021 300 MW CC and Retirement of 120
MW HFO ICRE, SPSA and ZESC
180 975 786 -250 80 0 80 866 816 50 6 0.48 0.010
2022 50 MW Wind 50 1,025 40 796 80 0 80 876 842 34 4 0.91 0.020
2023 1,025 796 80 0 80 876 869 7 1 1.43 0.031
2024 20 MW Solar and 20 MW Biomass 40 1,065 20 816 80 0 80 896 899 -3 0 1.44 0.030
2025 300 MW CC and Retirement of Van
Eck and ZESA
192 1,257 1008 -80 0 0 0 1008 931 77 8 0.46 0.009
2026 20 MW Solar 20 1,277 20 1008 0 0 0 1008 964 44 5 1.20 0.026
2027 1,277 1008 0 0 0 1008 1,001 7 1 2.00 0.045
2028 50 MW Wind and 50 MW CSP 100 1,377 40 1068 0 0 0 1068 1,039 29 3 1.11 0.023
2029 1,377 1068 0 0 0 1068 1,078 -10 -1 1.92 0.040
2030 20 MW Solar and 20 MW Biomass 40 1,417 20 1088 0 0 0 1088 1,119 -31 -3 2.08 0.044
2031 50 MW CSP 50 1,467 1138 0 0 0 1138 1,159 -21 -2 1.90 0.041
2032 20 MW Solar and 20 MW Biomass 40 1,507 20 1158 0 0 0 1158 1,195 -38 -3 1.98 0.043
2033 50 MW CSP 50 1,557 1208 0 0 0 1208 1,239 -32 -3 1.77 0.035
2034 20 MW Biomass 20 1,577 1228 0 0 0 1228 1,281 -53 -4 2.00 0.042
2035 50 MW CSP 50 1,627 1278 0 0 0 1278 1,329 -51 -4 1.97 0.038
Note:
Internal External
(2) It is assumed that the Namibia system will get 200 MW emergency assistance from neighboring systems for the period from 2016 to 2020 and it is increased to 400 MW for the remaining study period, which is
not included in the capacity reserve calculation
(1) The capacity reduced in calculation of the expected generation capacity at the time of system peak. It is assumed that solar PV will have no contribution to system peak while wind power contributes 20% of its
installed capacity
Appendix C-7
Project Name
Annual
Peak
Reliability
(MW)
Reserve (2)
Addition/RetirementTotal
Capacity
Unit/Plant Addition/Retirement Schedule - Alternative 2, Scenario 7
Year

Additions-Alt-2-B08-MSE.xls Namibia 9/6/2016
Individual Cumulative Discount (1)
Available Individual Cumulative Discount (1)
Available LOLP EUE
(MW) (MW) (MW) (%) (Day/Year) (%)
492 492 10 482 330 330 0 330
2016 492 482 330 0 330 812 646 167 26 0.02 0.000
2017 70 MW Solar and 20 MW Import 70 562 70 482 20 350 0 350 832 693 140 20 0.03 0.000
2018 50 MW Solar, 49 MW Wind, 120
MW HFO ICRE and Retirement of
Paratus and 20 MW Import
213 775 89 606 -20 330 0 330 936 733 202 28 0.00 0.000
2019 775 606 330 0 330 936 758 177 23 0.00 0.000
2020 20 MW Solar 20 795 20 606 330 0 330 936 786 150 19 0.01 0.000
2021 260 MW HFO ICRE and Retirement
of 120 MW HFO ICRE, SPSA and
ZESC
140 935 746 -250 80 0 80 826 816 10 1 0.08 0.000
2022 50 MW Wind 50 985 40 756 80 0 80 836 842 -6 -1 0.16 0.001
2023 20 MW Biomass 20 1,005 776 80 0 80 856 869 -13 -1 0.21 0.001
2024 20 MW Solar and 50 MW CSP 70 1,075 20 826 80 0 80 906 899 7 1 0.07 0.000
2025 180 MW HFO ICRE and Retirement
of Van Eck and ZESA
72 1,147 898 -80 0 0 0 898 931 -33 -4 0.18 0.002
2026 20 MW Solar and 20 MW Biomass 40 1,187 20 918 0 0 0 918 964 -46 -5 0.34 0.002
2027 50 MW CSP 50 1,237 968 0 0 0 968 1,001 -33 -3 0.21 0.001
2028 50 MW Wind 50 1,287 40 978 0 0 0 978 1,039 -61 -6 0.43 0.003
2029 20 MW HFO ICRE 20 1,307 998 0 0 0 998 1,078 -80 -7 0.74 0.006
2030 20 MW Solar and 20 MW Biomass 40 1,347 20 1018 0 0 0 1018 1,119 -101 -9 0.89 0.009
2031 50 MW CSP 50 1,397 1068 0 0 0 1068 1,159 -91 -8 0.73 0.007
2032 20 MW Solar and 20 MW HFO ICRE 40 1,437 20 1088 0 0 0 1088 1,195 -108 -9 0.89 0.009
2033 20 MW Biomass and 50 MW CSP 70 1,507 1158 0 0 0 1158 1,239 -82 -7 0.51 0.003
2034 1,507 1158 0 0 0 1158 1,281 -123 -10 1.25 0.013
2035 50 MW CSP 50 1,557 1208 0 0 0 1208 1,329 -121 -9 1.37 0.014
Note:
Internal External
(2) It is assumed that the Namibia system will get 200 MW emergency assistance from neighboring systems for the period from 2016 to 2020 and it is increased to 400 MW for the remaining study period, which is
not included in the capacity reserve calculation
(1) The capacity reduced in calculation of the expected generation capacity at the time of system peak. It is assumed that solar PV will have no contribution to system peak while wind power contributes 20% of its
installed capacity
Appendix C-8
Project Name
Annual
Peak
Reliability
(MW)
Reserve (2)
Addition/RetirementTotal
Capacity
Unit/Plant Addition/Retirement Schedule - Alternative 2, Scenario 8
Year

Additions-Alt-2-B09-Coal HRen.xls Namibia 9/6/2016
Individual Cumulative Discount (1)
Available Individual Cumulative Discount (1)
Available LOLP EUE
(MW) (MW) (MW) (%) (Day/Year) (%)
492 492 10 482 330 330 0 330
2016 492 482 330 0 330 812 646 167 26 0.02 0.000
2017 70 MW Solar and 20 MW Import 70 562 70 482 20 350 0 350 832 693 140 20 0.03 0.000
2018 50 MW Solar, 49 MW Wind, 120
MW HFO ICRE and Retirement of
Paratus and 20 MW Import
213 775 89 606 -20 330 0 330 936 733 202 28 0.00 0.000
2019 20 MW Solar 20 795 20 606 330 0 330 936 758 177 23 0.00 0.000
2020 40 MW Solar 40 835 40 606 330 0 330 936 786 150 19 0.01 0.000
2021 300 MW Coal, 100 MW Wind and
Retirement of 120 MW HFO ICRE,
SPSA and ZESC
280 1,115 80 806 -250 80 0 80 886 816 70 9 0.24 0.005
2022 40 MW Solar 40 1,155 40 806 80 0 80 886 842 44 5 0.50 0.010
2023 100 MW Wind 100 1,255 80 826 80 0 80 906 869 37 4 0.36 0.007
2024 20 MW Biomass and 40 MW Solar 60 1,315 40 846 80 0 80 926 899 27 3 0.31 0.006
2025 Coal 300 MW, 100 MW Wind and
Retirement of Van Eck and ZESA
292 1,607 80 1058 -80 0 0 0 1058 931 127 14 0.07 0.001
2026 40 MW Solar 40 1,647 40 1058 0 0 0 1058 964 94 10 0.21 0.004
2027 40 MW Solar and 50 MW CSP 90 1,737 40 1108 0 0 0 1108 1,001 107 11 0.12 0.002
2028 40 MW Solar and 20 MW Biomass 60 1,797 40 1128 0 0 0 1128 1,039 89 9 0.12 0.003
2029 40 MW Solar and 50 MW CSP 90 1,887 40 1178 0 0 0 1178 1,078 100 9 0.09 0.001
2030 50 MW CSP 50 1,937 1228 0 0 0 1228 1,119 109 10 0.07 0.001
2031 20 MW Biomass 20 1,957 1248 0 0 0 1248 1,159 89 8 0.09 0.001
2032 50 MW CSP 50 2,007 1298 0 0 0 1298 1,195 102 9 0.07 0.001
2033 20 MW Biomass 20 2,027 1318 0 0 0 1318 1,239 79 6 0.10 0.001
2034 2,027 1318 0 0 0 1318 1,281 37 3 0.18 0.003
2035 50 MW CSP 50 2,077 1368 0 0 0 1368 1,329 39 3 0.16 0.002
Note:
(2) It is assumed that the Namibia system will get 200 MW emergency assistance from neighboring systems for the period from 2016 to 2020 and it is increased to 400 MW for the remaining study period, which is
not included in the capacity reserve calculation
Unit/Plant Addition/Retirement Schedule - Alternative 2, Scenario 9
YearInternal External
Appendix C-9
Project Name
Annual
Peak
Reliability
(MW)
Addition/RetirementTotal
CapacityReserve
(2)
(1) The capacity reduced in calculation of the expected generation capacity at the time of system peak. It is assumed that solar PV will have no contribution to system peak while wind power contributes 20% of its
installed capacity

Additions-Alt-2-B10-LNG CC HRen.xls Namibia 9/6/2016
Individual Cumulative Discount (1)
Available Individual Cumulative Discount (1)
Available LOLP EUE
(MW) (MW) (MW) (%) (Day/Year) (%)
492 492 10 482 330 330 0 330
2016 492 482 330 0 330 812 646 167 26 0.02 0.000
2017 70 MW Solar and 20 MW Import 70 562 70 482 20 350 0 350 832 693 140 20 0.03 0.000
2018 50 MW Solar, 49 MW Wind, 120
MW HFO ICRE and Retirement of
Paratus and 20 MW Import
213 775 89 606 -20 330 0 330 936 733 202 28 0.00 0.000
2019 20 MW Solar 20 795 20 606 330 0 330 936 758 177 23 0.00 0.000
2020 40 MW Solar 40 835 40 606 330 0 330 936 786 150 19 0.01 0.000
2021 300 MW CC, 100 MW Wind and
Retirement of 120 MW HFO ICRE,
SPSA and ZESC
280 1,115 80 806 -250 80 0 80 886 816 70 9 0.19 0.004
2022 40 MW Solar 40 1,155 40 806 80 0 80 886 842 44 5 0.41 0.008
2023 100 MW Wind 100 1,255 80 826 80 0 80 906 869 37 4 0.32 0.006
2024 40 MW Solar and 20 MW Biomass 60 1,315 40 846 80 0 80 926 899 27 3 0.29 0.004
2025 300 MW CC, 100 MW Wind and
Retirement of Van Eck and ZESA
292 1,607 80 1058 -80 0 0 0 1058 931 127 14 0.05 0.001
2026 40 MW Solar 40 1,647 40 1058 0 0 0 1058 964 94 10 0.13 0.003
2027 40 MW Solar and 50 MW CSP 90 1,737 40 1108 0 0 0 1108 1,001 107 11 0.08 0.002
2028 40 MW Solar and 20 MW Biomass 60 1,797 40 1128 0 0 0 1128 1,039 89 9 0.09 0.002
2029 40 MW Solar and 50 MW CSP 90 1,887 40 1178 0 0 0 1178 1,078 100 9 0.06 0.001
2030 50 MW CSP 50 1,937 1228 0 0 0 1228 1,119 109 10 0.05 0.001
2031 20 MW Biomass 20 1,957 1248 0 0 0 1248 1,159 89 8 0.07 0.001
2032 50 MW CSP 50 2,007 1298 0 0 0 1298 1,195 102 9 0.05 0.001
2033 20 MW Biomass 20 2,027 1318 0 0 0 1318 1,239 79 6 0.07 0.001
2034 2,027 1318 0 0 0 1318 1,281 37 3 0.13 0.002
2035 50 MW CSP 50 2,077 1368 0 0 0 1368 1,329 39 3 0.12 0.002
Note:
Internal External
(2) It is assumed that the Namibia system will get 200 MW emergency assistance from neighboring systems for the period from 2016 to 2020 and it is increased to 400 MW for the remaining study period, which is
not included in the capacity reserve calculation
(1) The capacity reduced in calculation of the expected generation capacity at the time of system peak. It is assumed that solar PV will have no contribution to system peak while wind power contributes 20% of its
installed capacity
Appendix C-10
Project Name
Annual
Peak
Reliability
(MW)
Reserve (2)
Addition/RetirementTotal
Capacity
Unit/Plant Addition/Retirement Schedule - Alternative 2, Scenario 10
Year

Additions-Alt-2-B11-MSE HRen.xls Namibia 9/6/2016
Individual Cumulative Discount (1)
Available Individual Cumulative Discount (1)
Available LOLP EUE
(MW) (MW) (MW) (%) (Day/Year) (%)
492 492 10 482 330 330 0 330
2016 492 482 330 0 330 812 646 167 26 0.02 0.000
2017 70 MW Solar and 20 MW Import 70 562 70 482 20 350 0 350 832 693 140 20 0.03 0.000
2018 50 MW Solar, 49 MW Wind, 120 MW
HFO ICRE and Retirement of Paratus
and 20 MW Import
213 775 89 606 -20 330 0 330 936 733 202 28 0.00 0.000
2019 20 MW Solar 20 795 20 606 330 0 330 936 758 177 23 0.00 0.000
2020 40 MW Solar 40 835 40 606 330 0 330 936 786 150 19 0.01 0.000
2021 260 MW HFO ICRE, 100 MW Wind
and Retirement of 120 MW HFO ICRE,
SPSA and ZESC
240 1,075 80 766 -250 80 0 80 846 816 30 4 0.02 0.000
2022 40 MW Solar and 20 MW Biomass 60 1,135 40 786 80 0 80 866 842 24 3 0.03 0.000
2023 100 MW Wind and 40 MW HFO ICRE 140 1,275 80 846 80 0 80 926 869 57 7 0.01 0.000
2024 40 MW Solar and 40 MW HFO ICRE 80 1,355 40 886 80 0 80 966 899 67 7 0.01 0.000
2025 20 MW Biomass, 100 MW CSP, 100
MW Wind and Retirement of Van Eck
and ZESA
112 1,467 80 918 -80 0 0 0 918 931 -13 -1 0.04 0.000
2026 40 MW Solar and 40 MW HFO ICRE 80 1,547 40 958 0 0 0 958 964 -6 -1 0.03 0.000
2027 40 MW Solar and 20 MW Biomass 60 1,607 40 978 0 0 0 978 1,001 -23 -2 0.05 0.001
2028 40 MW Solar and 40 MW HFO ICRE 80 1,687 40 1018 0 0 0 1018 1,039 -21 -2 0.05 0.000
2029 40 MW Solar and 50 MW CSP 90 1,777 40 1068 0 0 0 1068 1,078 -10 -1 0.03 0.000
2030 1,777 1068 0 0 0 1068 1,119 -51 -5 0.08 0.001
2031 50 MW CSP 50 1,827 1118 0 0 0 1118 1,159 -41 -4 0.07 0.001
2032 20 MW Biomass 20 1,847 1138 0 0 0 1138 1,195 -58 -5 0.09 0.001
2033 50 MW CSP 50 1,897 1188 0 0 0 1188 1,239 -52 -4 0.08 0.001
2034 20 MW Biomass 20 1,917 1208 0 0 0 1208 1,281 -73 -6 0.12 0.001
2035 50 MW CSP 50 1,967 1258 0 0 0 1258 1,329 -71 -5 0.12 0.001
Note:
(2) It is assumed that the Namibia system will get 200 MW emergency assistance from neighboring systems for the period from 2016 to 2020 and it is increased to 400 MW for the remaining study period, which is
not included in the capacity reserve calculation
Unit/Plant Addition/Retirement Schedule - Alternative 2, Scenario 11
YearInternal External
Appendix C-11
Project Name
Annual
Peak
Reliability
(MW)
Addition/RetirementTotal
CapacityReserve
(2)
(1) The capacity reduced in calculation of the expected generation capacity at the time of system peak. It is assumed that solar PV will have no contribution to system peak while wind power contributes 20% of its
installed capacity