nandan denim limited · chiripal industries ltd. (processing division) vishal fabrics ltd....
TRANSCRIPT

NANDAN DENIM LIMITED
Q2 & H1 FY18
RESULTS UPDATE
DECEMBER 2017

SAFE HARBOUR STATEMENT
This presentation and the following discussion may contain “forward lookingstatements” by Nandan Denim Limited (“Nandan Denim”) that are not historical innature. These forward looking statements, which may include statements relatingto future results of operations, financial condition, business prospects, plans andobjectives, are based on the current beliefs, assumptions, expectations, estimates,and projections of the management of Nandan Denim about the business, industryand markets in which it operates.
These statements are not guarantees of future performance, and are subject toknown and unknown risks, uncertainties, and other factors, some of which arebeyond Nandan Denim’s control and difficult to predict, that could cause actualresults, performance or achievements to differ materially from those in the forwardlooking statements. Such statements are not, and should not be construed, as arepresentation as to future performance or achievements of Nandan Denim. Inparticular, such statements should not be regarded as a projection of futureperformance of Nandan Denim. It should be noted that the actual performance orachievements of the company may vary significantly from such statements.

NANDAN DENIM LIMITED
DISCUSSION SUMMARY
Q2 & H1 FY18 Results, Financials & Outlook
Rationale for Capacity Expansion & Integration
Annexure
About Us
01 Q2 & H1 FY18 RESULTS & OUTLOOK

Q2 FY18 RESULTS – KEY HIGHLIGHTS
488 637
16.1% 15.3%
Q2 FY17 Q2 FY18
3,026
4,150
Q2 FY17 Q2 FY18
REVENUES EBITDA & EBITDA MARGIN PAT & PAT MARGIN
162 161
5.4% 3.9%
Q2 FY17 Q2 FY18
In Rs Mn
REVENUE BREAKUP – PRODUCT WISE
2,653 2,783
201 226 173 1,141
Q2 FY17 Q2 FY18
Denim Shirting Yarn & Others
67.1%87.7%
6.6%
REVENUE BREAKUP – DOMESTIC Vs. EXPORTS
2,782 3,873
244
277
Q2 FY17 Q2 FY18
Exports Domestic
91.9%
8.1%
93.3%
6.7%
5.5%
5
37 %
5.7% 27.5%
31 % -1 %
Q2 FY18 figures are as per IND-AS Standards

H1 FY18 RESULTS – KEY HIGHLIGHTS
972 1,245
16.1% 14.8%
H1 FY17 H1 FY18
6,031
8,387
H1 FY17 H1 FY18
REVENUES EBITDA & EBITDA MARGIN PAT & PAT MARGIN
320 322
5.3% 3.8%
H1 FY17 H1 FY18
In Rs Mn
REVENUE BREAKUP – PRODUCT WISE
5,304 5,711
418 428 310 2,248
H1 FY17 H1 FY18
Denim Shirting Yarn & Others
68.1%87.9%
6.9%
REVENUE BREAKUP – DOMESTIC Vs. EXPORTS
5,522 7,844
510
543
H1 FY17 H1 FY18
Exports Domestic
91.6%
8.4%
93.5%
6.5%
5.1%
6
39 %
5.1% 26.8%
28 % 1 %
H1 FY18 figures are as per IND-AS Standards

CONSOLIDATED PROFIT & LOSS STATEMENT
7
Q2 & H1 FY18 figures are as per IND-AS Standards
Particulars (Rs. in Mn) Q2 FY18 Q2 FY17 YoY% Q1 FY18 QoQ% H1 FY18 H1 FY17 YoY%
Revenue from Operations 4,149.8 3,026.3 37.1% 4,237.0 -2.1% 8,386.8 6,031.2 39.1%
COGS 2,818.0 2,023.2 39.3% 2,895.6 -2.7% 5,713.5 4,033.3 41.7%
Gross Profit 1,331.8 1,003.1 32.8% 1,341.4 -0.7% 2,673 1,998 33.8%
Gross Margins % 32.1% 33.1% -105 bps 31.7% 43 bps 31.9% 33.1% -125 bps
Employee Expenses 201.1 155.0 29.8% 213.0 -5.6% 414.1 307.0 34.9%
Other Expenses 494.1 360.4 37.1% 519.9 -5.0% 1,014.0 719.0 41.0%
EBITDA 636.6 487.7 30.5% 608.5 4.6% 1,245.1 971.9 28.1%
EBITDA Margin % 15.3% 16.1% -78 bps 14.4% 98 bps 14.8% 16.1% -127 bps
Depreciation 293.7 168.8 74.0% 293.2 0.2% 587.0 338.5 73.4%
Finance Cost 153.7 87.6 75.4% 140.0 9.8% 293.7 176.7 66.2%
Other Income 5.1 6.4 -21.0% 7.4 -31.9% 12.5 12.7 -1.4%
PBT 194.3 237.7 -18.3% 182.7 6.3% 377.0 469.4 -19.7%
Taxes 33.1 75.7 -56.3% 21.7 52.4% 54.7 149.5 -63.4%
PAT 161.2 162.0 -0.5% 161.1 0.1% 322.3 319.9 0.7%
PAT Margin % 3.9% 5.4% -147 bps 3.8% 8 bps 3.8% 5.3% -146 bps
EPS (Rs.) - Basic 3.35 3.37 -0.6% 3.35 0.0% 6.71 6.66 0.8%
CONSOLIDATED BALANCE SHEET
8
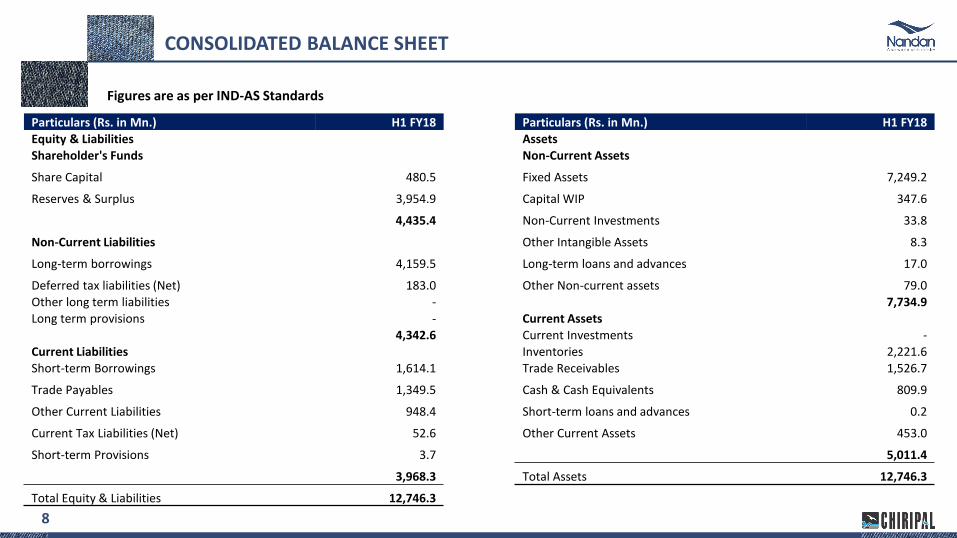
Figures are as per IND-AS Standards
Particulars (Rs. in Mn.) H1 FY18 Particulars (Rs. in Mn.) H1 FY18
Equity & Liabilities AssetsShareholder's Funds Non-Current Assets
Share Capital 480.5 Fixed Assets 7,249.2
Reserves & Surplus 3,954.9 Capital WIP 347.6
4,435.4 Non-Current Investments 33.8
Non-Current Liabilities Other Intangible Assets 8.3
Long-term borrowings 4,159.5 Long-term loans and advances 17.0
Deferred tax liabilities (Net) 183.0 Other Non-current assets 79.0 Other long term liabilities - 7,734.9 Long term provisions - Current Assets
4,342.6 Current Investments -
Current Liabilities Inventories 2,221.6 Short-term Borrowings 1,614.1 Trade Receivables 1,526.7
Trade Payables 1,349.5 Cash & Cash Equivalents 809.9
Other Current Liabilities 948.4 Short-term loans and advances 0.2
Current Tax Liabilities (Net) 52.6 Other Current Assets 453.0
Short-term Provisions 3.7 5,011.4
3,968.3 Total Assets 12,746.3
Total Equity & Liabilities 12,746.3

02 ABOUT US
ABOUT US: CHIRIPAL GROUP – EMERGING CONGLOMERATE
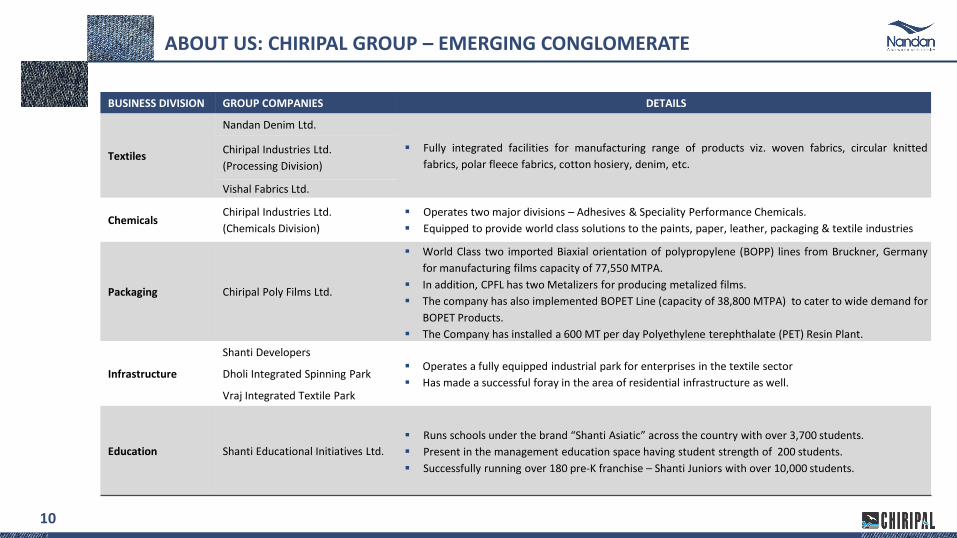
BUSINESS DIVISION GROUP COMPANIES DETAILS
Textiles
Nandan Denim Ltd.
▪ Fully integrated facilities for manufacturing range of products viz. woven fabrics, circular knitted
fabrics, polar fleece fabrics, cotton hosiery, denim, etc.Chiripal Industries Ltd.
(Processing Division)
Vishal Fabrics Ltd.
ChemicalsChiripal Industries Ltd.
(Chemicals Division)
▪ Operates two major divisions – Adhesives & Speciality Performance Chemicals.
▪ Equipped to provide world class solutions to the paints, paper, leather, packaging & textile industries
Packaging Chiripal Poly Films Ltd.
▪ World Class two imported Biaxial orientation of polypropylene (BOPP) lines from Bruckner, Germany
for manufacturing films capacity of 77,550 MTPA.
▪ In addition, CPFL has two Metalizers for producing metalized films.
▪ The company has also implemented BOPET Line (capacity of 38,800 MTPA) to cater to wide demand for
BOPET Products.
▪ The Company has installed a 600 MT per day Polyethylene terephthalate (PET) Resin Plant.
Infrastructure
Shanti Developers▪ Operates a fully equipped industrial park for enterprises in the textile sector
▪ Has made a successful foray in the area of residential infrastructure as well.Dholi Integrated Spinning Park
Vraj Integrated Textile Park
Education Shanti Educational Initiatives Ltd.
▪ Runs schools under the brand “Shanti Asiatic” across the country with over 3,700 students.
▪ Present in the management education space having student strength of 200 students.
▪ Successfully running over 180 pre-K franchise – Shanti Juniors with over 10,000 students.
10

ABOUT US: COMPANY OVERVIEW
STRONG PEDIGREE
STRONG FINANCIAL
PERFORMANCE *
LEADING INTEGRATED
DENIM MANUFACTURER
▪ Nandan Denim Limited is a part of a leading conglomerate, Chiripal Group, which was established in 1972 and is
currently diversified across several businesses like Textiles, Chemicals, Packaging, Infrastructure and Education.
▪ Nandan Denim commenced its operations in 1994 with textile trading business and forayed into textile
manufacturing in 2004. The company currently engages in manufacturing of denims, cotton fabrics and khakis.
▪ The company is run by a professional management team with an average experience of more than two decades.
▪ Consolidated Revenues, EBITDA and PAT were Rs 12,204 mn, Rs 1,899 mn and Rs 567 mn in FY17 having grown at CAGR of 15%, 15% and 16% over FY13 - FY17.
▪ Stable EBITDA margins of around 14% - 16% over FY13 - FY17.▪ FY17 Debt : Equity was 1.5:1.
▪ Nandan Denim has one of the largest denim fabric manufacturing capacities in the world.
▪ The company expanded its denim fabric capacity from 71 MMPA to 110 MMPA.
▪ The company has completed backward integration by expanding its spinning capacity from 54 TPD (tonnes per day) to 141 TPD which will result into higher operating margins.
▪ The company also owns a captive power plant of 15 MW.
11 * Figures are as per I-GAAP Standards

ABOUT US: INTEGRATED DENIM FABRIC FACILITY
KEY HIGHLIGHTS
▪ One of the largest denim fabric facility in the world and largest in India.
▪ Machinery with latest technology from Germany and Japan, capable of producing wide range of denim fabrics.
▪ ~10% domestic denim fabric market share.
▪ Sufficient power through 15 MW captive power plant.
Spinning
Spinning Capacity – 141 TPD
FIBRE YARN FABRIC
Ginned Cotton
70% of cotton requirement is met from Gujarat
Weaving & Processing
Denim – 110 MMPA
Shirting – 10 MMPA
12

ABOUT US: STRATEGIC LOCATION OF MANUFACTURING FACILTIES
THE GUJARAT ADVANTAGE
GUJARAT TEXTILE HUB OF INDIA
▪ Largest producer of denim fabric (65-70%) in India and third largest in the world.
▪ Largest producer of cotton in India.▪ Textile hub of India housing the entire
textile value chain.
LOW COST OF PRODUCTION
▪ Easy availability of key raw material – Cotton.▪ Uninterrupted power supply in state of Gujarat. ▪ Gujarat meets around 70% of the cotton
requirement.▪ Easy availability of skilled and unskilled labour.
SUPERIOR CONNECTIVITY
▪ Located in Ahmedabad, the financial capital of Gujarat.
▪ Superior infrastructure connectivity through roads, rail, airport and ports.
PROXIMITY TO MARKET
▪ Close proximity to machinery vendors, fabric dealers and leading garment manufacturers resulting in faster delivery and service.
▪ Lower marketing and transportation overheads.
GUJARAT TEXTILE POLICY – BENEFITS
▪ Interest Subsidy (in addition to Central subsidies) for 5 years: 7% - Spinning & garment facilities6% - Technical textiles5% - All other facilities
▪ Power tariff subsidy @ Rs 1/unit for 5 years.
▪ VAT/Entry Tax reimbursement for 8 years.
▪ 100% stamp duty reimbursement.
13

ABOUT US: LEVERAGING THE CHIRIPAL GROUP ECO-SYSTEM
LEVERAGE CHIRIPAL GROUP ECO-SYSTEM
▪ Access to the large customer network of the Chiripal Group.
▪ Successful customer acquisition and retention through the cross-leveraging of group capabilities and cross-selling of group offerings.
▪ One of the largest group level processing capacity of ~0.8 MMPD adding significant value to customers by fulfilling their printing, dyeing, bleaching, synthetic yarn and other processing requirements under one roof.
Nandan Denim
Denim fabric, shirting fabric
Chiripal Industries (Processing)
wovens, knitted, polar fleece, flock, hosiery, embroidery,synthetic adhesives and acrylic emulsions
Chiripal Industries
(Petrochemical)POY, FDY, DTY
Chiripal Polyfilms
Thermal Films, Tape Textile BOPP, Packaging films
Vishal FabricsShirting, Synthetic, Botton Weight, Bedsheets, dyeing, printing
Chiripal Customer NetworkDenim Fabric
Customer
14

ABOUT US: SUPERIOR MARKETING & DISTRIBUTION
MARKETING & DISTRIBUTION – DOMESTIC MARKETS
▪ Leveraging the strong agent-based domestic network of the Chiripal group.
▪ Strong pan-India network of around 35 – 40 distributors associated with the company for close to a decade.
▪ Strategic tie-ups with 10 firms to exclusively sell Nandan Denim’s products.
▪ Around 2/3rd of the orders are confirmed through long term agreements involving minimum yearly quantity commitment.
MARKETING & DISTRIBUTION – EXPORTS MARKETS
▪ Leveraging the strong agent-based global network of the Chiripal group.
▪ Strong global network of around 15 distributors spread across 8 countries – Peru, Mauritius, Hong Kong, Dubai, Thailand, Bangladesh, New York, Columbia.
▪ Export of denim fabric to over 28 countries across the globe.
▪ Merchant exports through various star export houses to give an additional boost to exports.
Nandan Denim has been able to grow its revenues at a CAGR of 15% over last 5 years, with steady EBITDA margins
15

ABOUT US: BUILDING GLOBAL PRESENCE
Nandan Denim exports its denim fabric to over 28 countries across the globe through its strong global dealer-distribution network.
USA
COLOMBIA
PANAMA
VENEZUELA
GUATEMALA
PERU
MOROCCO
EGYPT
SOUTH AFRICA
LESOTHO
PORTUGAL
GREECE
TURKEY DUBAI
CHINA
THAILAND
INDIA
BANGLADESH
PHILIPPINES
AUSTRALIA
INDONESIA
SRILANKA
MADAGASCAR
CHILE
HONDURAS
SOUTH KOREA
UZBEKISTAN
HONG KONG
16

ABOUT US: ACCEPTANCE FROM LEADING BRANDS
DOMESTIC BRANDS
GLOBAL BRANDS
DENIM FABRIC SUPPLIER TO MAJOR BRANDS AROUND THE WORLD
17

ABOUT US: CAPACITY EXPANSION
Capacity FY16 FY17
Spinning (TPD) 70 141
Fabric (MMPA)
Denim 99 110
Shirting 10 10
18

03 Rationale for Capacity Expansion & Integration
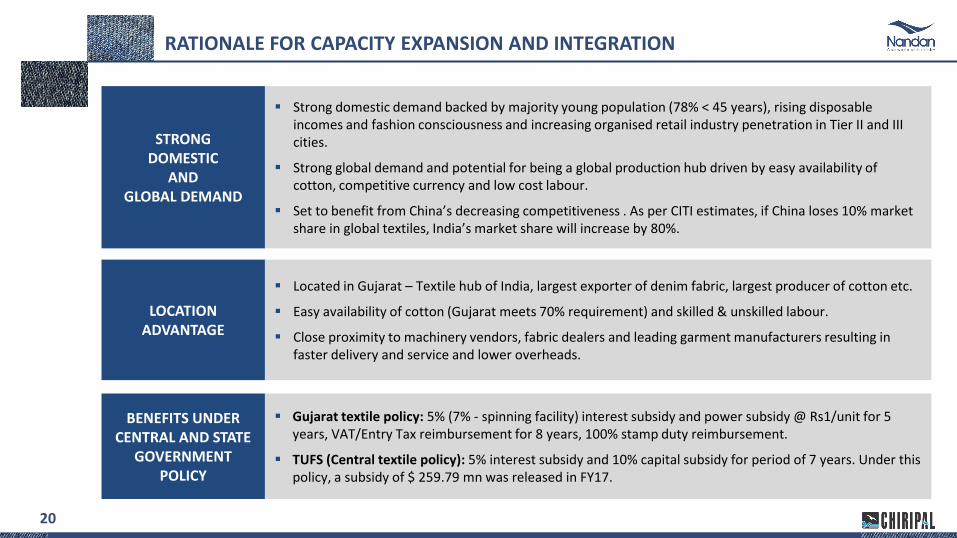
RATIONALE FOR CAPACITY EXPANSION AND INTEGRATION
STRONG DOMESTIC
AND GLOBAL DEMAND
LOCATION ADVANTAGE
BENEFITS UNDER CENTRAL AND STATE
GOVERNMENT POLICY
▪ Strong domestic demand backed by majority young population (78% < 45 years), rising disposable incomes and fashion consciousness and increasing organised retail industry penetration in Tier II and III cities.
▪ Strong global demand and potential for being a global production hub driven by easy availability of cotton, competitive currency and low cost labour.
▪ Set to benefit from China’s decreasing competitiveness . As per CITI estimates, if China loses 10% market share in global textiles, India’s market share will increase by 80%.
▪ Located in Gujarat – Textile hub of India, largest exporter of denim fabric, largest producer of cotton etc.
▪ Easy availability of cotton (Gujarat meets 70% requirement) and skilled & unskilled labour.
▪ Close proximity to machinery vendors, fabric dealers and leading garment manufacturers resulting in faster delivery and service and lower overheads.
▪ Gujarat textile policy: 5% (7% - spinning facility) interest subsidy and power subsidy @ Rs1/unit for 5 years, VAT/Entry Tax reimbursement for 8 years, 100% stamp duty reimbursement.
▪ TUFS (Central textile policy): 5% interest subsidy and 10% capital subsidy for period of 7 years. Under this policy, a subsidy of $ 259.79 mn was released in FY17.
20

RATIONALE FOR CAPACITY EXPANSION AND INTEGRATION
▪ Higher asset turnover along with improved operating margins will result in positive operating leverage and better return ratios.
IMPROVED MARGINS THROUGH
BACKWARD INTEGRATION
IMPROVEMENT IN ASSET TURNOVER AND RETURN RATIOS
▪ In-house production of cotton yarn would result in significant savings compared to purchase of yarn from the market.
▪ Integrated facility to help in better management of the working capital and improve the operational efficiencies.
▪ Better market response, efficient capacity utilisation and cost savings on captive yarn would result in higher EBITDA margins.
IMPROVED OPERATIONAL
FLEXIBILITY
▪ Integrated facility will improve the overall operational flexibility, helping the company to absorb the increasing market demand.
▪ Faster delivery and timely execution due to limited dependency on external factors along the value chain.
▪ Achieve optimum capacity utilisation.
▪ Maintain consistency and high quality standards.
21

04 Annexure

FINANCIAL SUMMARY
REVENUES (RS MN) EBITDA (RS MN) PAT (RS MN)
8,938
10,965 11,567 12,204
8,387
FY14 FY15 FY16 FY17 H1 FY18
1,327 1,654
1,911 1,899
1,245
(50)
450
950
1,450
1,950
2,450
FY14 FY15 FY16 FY17 H1 FY18
393 514
633 567
322
FY14 FY15 FY16 FY17 H1 FY18
MARGIN ANALYSIS (%) LEVERAGE ANALYSIS (RS MN) RETURN METRICS (%)
14.8% 15.1%16.5% 15.6% 14.8%
4.4% 4.7% 5.5% 4.6% 3.8%
FY14 FY15 FY16 FY17 H1 FY18
EBITDA Margin PAT Margin
4,307 4,709 5,296 6,422 6,354 2,165 2,588
3,384 4,201 4,435
2.0 1.8 1.6 1.5 1.4
FY14 FY15 FY16 FY17 H1 FY18
Debt Equity D/E
13.1% 14.1% 15.8% 15.7%10.8%
18.1% 19.6%21.6% 20.9%
14.9%
FY13 FY14 FY15 FY16 FY17
ROCE ROE
23
H1 FY18 Figures as per IND-AS

OPERATIONAL SUMMARY
DENIM FABRIC CAPACITY (MMPA)
76
99 99 110 110
79.2% 82.1% 81.2% 84.0%80.0%
FY14 FY15 FY16 FY17 H1 FY18
Capacity Capacity Utilisation
DENIM REALISATIONS (RS/METRE)
56.3
70.8 76.8 76.5
43.1
120.2132.7 135.3 131.6 135.6
FY14 FY15 FY16 FY17 H1 FY18
Denim Sales (Metres) Realisations
24

THANK YOU
Mr. Ashok BothraCFOEmail: [email protected]
Mr. Arun Prakash / Mr. Nilesh DalviIR Consultant Email: [email protected]
[email protected] No: +91 7506933892 / 9819289131