nanoporous gold formation by dealloying: a metropolis monte carlo study
TRANSCRIPT

Computer Physics Communications 184 (2013) 1562–1569
Contents lists available at SciVerse ScienceDirect
Computer Physics Communications
journal homepage: www.elsevier.com/locate/cpc
Nanoporous gold formation by dealloying: A MetropolisMonte Carlo studyO. Zinchenko, H.A. De Raedt ∗, E. Detsi, P.R. Onck, J.T.M. De HossonDepartment of Applied Physics, Zernike Institute for Advanced Materials, University of Groningen, Nijenborgh 4, NL-9747 AG, Groningen, The Netherlands
a r t i c l e i n f o
Article history:Received 3 December 2012Received in revised form30 January 2013Accepted 5 February 2013Available online 9 February 2013
Keywords:Monte Carlo simulationNanoporous materialsCatalystsSensorsActuators
a b s t r a c t
A Metropolis Monte Carlo study of the dealloying mechanism leading to the formation of nanoporousgold is presented. A simple lattice-gas model for gold, silver and acid particles, vacancies and productsof chemical reactions is adopted. The influence of temperature, concentration and lattice defects on thedealloying process is investigated and the morphological properties are characterized in terms of theEuler characteristic, volume, surface area and the specific surface area. It is shown that a minimal three-parameter model suffices to yield nanoporous gold structures which have morphological properties akinto those found in the experiment. The salient features of the structures found by simulation are that theligament size of the dealloyed material is of the order of 2–3 nm, the structure is disordered, percolatingand entirely connected.
© 2013 Elsevier B.V. All rights reserved.
1. Introduction
Sponge-like nanoporous metals with high specific surface areahave the potential to outperform existing (dense) materials invarious applications, including catalysts [1–3], electrochemicalsupercapacitors [4,5], biosensors [6], bone tissue engineering [7],heat exchanges and electrochemical actuators [8–12]. In particular,nanoporous metallic materials are very promising as actuationmaterials. In contrast to polymeric actuators they have higherstiffness and strength and in comparison with piezoelectricceramics they have less restricted strain amplitudes [9,12]. Themechanical properties of a porous overlayer are very differentfrom the bulk alloy to which it is attached, leading to brittlecrack propagation, stress corrosion cracking, and other undesirablematerials failure [13]. Fig. 1 shows scanning electron micrographsof a typical dealloyedmicrostructure (disorderednanoporous gold)at two differentmagnifications. This nanoporous samplewasmadeby selective dissolution of silver from a 6 carat white gold leaf,i.e. Au25Ag75 (wt%) in concentrated nitric acid (65%) and at roomtemperature. The open structure is percolating and the ligamentspacing is of the order of 10 nm [14–16].
Nanoporous metals are commonly synthesized by dealloying,in which the less noble components of an alloy are chemicallyor electrochemically dissolved. In the present work we areinterested in the formation of disordered nanoporous gold (NPG).
∗ Corresponding author. Tel.: +31 503634852; fax: +31 503634950.E-mail address: [email protected] (H.A. De Raedt).
0010-4655/$ – see front matter© 2013 Elsevier B.V. All rights reserved.doi:10.1016/j.cpc.2013.02.004
The formation of NPG is often explained in terms of atomicrearrangements at the interface between the metal and thesolution. As silver is dissolved, gold atoms are released fromsurface terraces and they reorganize themselves into clusters [17].The clusters form the initial surfaces of the ultimately three-dimensionally porous structure, and new gold atoms are suppliedto themasdissolutionpropagates to subsequent atomic layers [17].Thus, the process is governed by the diffusive redistribution ofcomponents on a crystal lattice.
Dealloying processes in alloys are a combination of intricatechemical and physical processes, rendering first-principle simula-tion prohibitively difficult. Therefore, to simulate these processes,simplified models that are amenable to computer simulation havebeen developed. All these models rely on ad-hoc assumptions thatserve to make the computational problem tractable. The validityof these assumptions cannot be justified from calculation basedon a more fundamental theory and are therefore to be judgedon their virtue in (1) reproducing salient features of nanoporousgold and (2) keeping the number of model parameters minimal.Consequently there are several different approaches, each havingits strong and weak points, to simulate dealloying. The evolving-surface finite-element method was used by Eilks and collabora-tors to investigate the dealloying of a binary alloy [18]. A phasefield model of diffusion-controlled phase transformation in multi-component systems was studied by Chen and coauthors [19]. Xuand coauthors adopted a level set model for solute precipitationand/or dissolution [20]. Erlebacher and coauthors employed a ki-netic Monte Carlo method to study the evolution of nanoporosityduring dealloying [21].

O. Zinchenko et al. / Computer Physics Communications 184 (2013) 1562–1569 1563
Fig. 1. Scanning electron micrographs of nanoporous gold made by selectivedissolution of silver from Au/Ag alloy immersed in nitric acid under freecorrosion conditions. (a) Cross-section of dealloyed Au25Ag75 (wt%) thin film. (b)magnification of (a) showing an open structure with ligament spacing of the orderof 10 nm.
In the present paper, we use the Metropolis Monte Carlo(MMC) technique to simulate both the chemical reaction processesand the movement of the various particles (gold, silver, acid,reaction products and vacancies). As is well-known [22,23], themotion of the particles in a Monte Carlo simulations is notrelated to the Newtonian equation of motion, let alone to thetime-evolution on the quantum mechanical level. It is thereforedangerous to interpret the transition rates which define the(kinetic or Metropolis) Monte Carlo processes as real physicalphenomena that actually occur in Nature. In some cases, it maybe possible to give a statistical interpretation of what is goingon on average but the connection to the real-time dynamics ofthe particles remains elusive. Keeping this in mind, our aim is toconstruct a simulation technique that captures the main featuresof the dealloying process and yields configurations of gold particlesof which the morphological properties are similar to those ofnanoporous gold produced in the laboratory. As the structuresobtained by dealloying are irregular in terms of pore and ligamentsize and are discrete (i.e. represented by a collection of voxels), wecharacterize the structures using techniques of integral geometry,namely in terms ofMinkowski functionals (the Euler characteristic,volume, surface area and mean breadth) [24–27]. This approachdoes not rely on interpolation techniques to transform binary datainto continuous surfaces/densities [15] or digital image processingtechniques [16]. For completeness, we mention that in the presentwork we do study coarsening [28,29] of the structures duringannealing.
2. Chemical reactions during dealloying
Dealloying is a common corrosion process during which themost chemically active components of an alloy are selectivelydissolved by acid. For the case at hand, disordered nanoporous goldis obtained by dissolving silver atoms from an Au/Ag alloy [21].The sample of an Au/Ag alloy is put in nitric acid for free corrosion.The mechanism of the formation of sponge-like nanoporous goldis diffusion and clustering of Au atoms while Ag atoms aredissolving [17]. Silver atoms dissolve in nitric acid according to oneor both of the following reactions [30,31]:Ag + 2HNO3 → AgNO3 + H2O + NO2, (1)3Ag + 4HNO3 → 3AgNO3 + 2H2O + NO. (2)
Products of these reactions are gas (NO or/and NO2) and liquid(AgNO3 andH2O). These reaction products are easily removed fromthe solid sample.
As the crystal lattice is rigid, one might expect that the porefraction in NPG reflects the fraction of atoms which are dissolved.However, simultaneous to the creation of porosity, a numberof other processes are active, including coarsening behind thedissolution front, various sources of plastic deformation, andcapillary forces [32]. As a result, macroscopic volume reductionby as much as 30% during dealloying is observed [32]. In spite ofthe volume reduction of a sample the specific surface area that wedefine here as the total surface area per unit of volume, can be large.
3. Model and methods
3.1. Lattice-gas and energy of a particle configuration
Lattice-gas computer simulationmodels are of wide-spread usefor studying of many-particle systems. They allow dealing witha large number of particles at a relatively modest computationalcost. The Au/Ag alloy has an FCC structure [33]. Therefore, inthe simulation, we work with FCC lattices to represent a 3Dstructure. Each lattice point of FCC lattice has 12 nearest neighborsand contains only one of the five objects namely Au, Ag, HNO3,liquid product of the chemical reaction (AgNO3 or H2O) andvacancy. In the following, we simply call these objects ‘‘particles’’.The movement of particles is restricted to exchange betweennearest-neighbor positions. This restriction prevents non-physicalbehavior like jumping of a particle from one edge of the system toanother. In other words only nearest neighbor hopping is allowed.Furthermore, thismechanism allows us to simulate the passivationeffect during which atoms of gold accumulate on the surfaceand locally block further dissolution [21]. Another restriction isthat solid particles cannot disconnect from the sample throughexchange with liquid particles. This restriction together with theclustering mechanism (Section 3.3) guarantees the full integrity ofthe dealloyed sample.
In the present work we do not take into account theinteraction between products of the chemical reaction (AgNO3and H2O) and the ‘‘interaction’’ between vacancies with otherparticles. The interaction with acid particles yields a more realisticdissolution and diffusion behavior [34]. Therefore we have 9possible combinations of particles (Ag–Ag, Au–Ag, Ag–Au, Au–Au,Ag–HNO3, HNO3–Ag, Au–HNO3, HNO3–Au and HNO3–HNO3)which contribute to the energy. The energy E of the lattice-gasmodel with pair potential interactions between nearest-neighborsis given by
E =
5α=1
5β=1
⟨i,j⟩
JαβMαi M
β
j +
5α=1
LxLyLzi=1
hα(z − 1)(Lz − 1)
Mαi . (3)
The variables α and β represent one of five particles: gold (α, β =
1), silver (α, β = 2), acid (α, β = 3), vacancies (α, β = 4), andreaction products (α, β = 5). The parameters Jαβ represent theinteraction constants between two particles α and β . As Jαβ = Jβα ,we have 15 different interaction constants. The notation ⟨i, j⟩indicates that the sum is over nearest-neighbor pairs of the FCClattice. The variable Mα
i is a binary variable which is equal to oneif particle α occupies site i, and is zero otherwise. The dimensionsof the lattice are denoted by Lx, Ly and Lz . The chemical potential ofparticle α is denoted by hα . In the last sum, the index i = (x, y, z)runs over all sites of the FCC lattice and the symbol z is the indexof particle α along the z-axis. Here we assume that the chemicalpotentials change linearly in the z direction and are uniform in theother two directions, mimicking the effect of an external potential.The first and the second term (see Eq. (3)) represent the interaction

1564 O. Zinchenko et al. / Computer Physics Communications 184 (2013) 1562–1569
energy and the chemical potential. Our motivation to include thecontribution of the chemical potential is to allow us to study theeffect of the external field on the dealloying process. Obviously, thenumber of free parameters in Eq. (3) is large (15) but, as we discussbelow, for the present purposes can be reduced to 3.
3.2. Metropolis Monte Carlo
In the present work, all simulations are performed using theMMCmethod [22,23] andwe focus on the properties of the systemin thermal equilibrium, not on the kinetics or diffusion of particleswhich are not incorporated in the MMC scheme. The simulationconsists of performing a certain number of Monte Carlo stepsto equilibrate the system and then to perform the dealloyingsimulation. Let us denote a configuration of particles on the latticeby the symbol ξ .
The Metropolis Monte Carlo method is a fairly generalalgorithm for generating a set of N different configurationsξ1, ξ2, ξ3, . . . , ξN of the system such that the frequency, withwhich a configuration ξ appears, converges to the probabilityP(ξ). Here P(ξ) is a specified probability distribution. As usual,we assume that the system under study is in equilibrium with itssurrounding and therefore P(ξ) is given by
P(ξ) = Z−1e−E(ξ)/kBT = Z−1e−βE(ξ). (4)
Here E(ξ) is the energy of the configuration ξ, T is the temperature,kB = 1.38×10⁻²³ JK−1 is the Boltzmann constant, β = 1/kBT , andthe partition function Z is given by
Z =
ξ
e−βE(ξ). (5)
One Metropolis Monte Carlo step consists of randomly pickinga new configuration and accepting or rejecting the new configu-ration with a prescribed acceptance probability. The initial con-figuration ξ1 can be any configuration of the system, e.g., anyarrangement of particles in the system. At the nth step the systemis in configuration ξn. Then the algorithmpicks a trial configurationξ ′ (usually a configuration which is close to ξn) and computes theratio
R =P(ξ ′)
P(ξn)= e−β(E(ξ ′)−E(ξn)). (6)
A pseudo-random number 0 ≤ p < 1 is generated and if p ≤ R,the system changes to the configuration ξ ′. Otherwise the systemremains in the configuration ξn. These MMC steps are repeatedN times, where N is a sufficiently large number. Note that theprobability of accepting a trial configuration ξ ′ is
Pξn,ξ ′ =
e−β(E(ξ ′)−E(ξn)) if E(ξ ′) − E(ξn) > 01 otherwise.
(7)
During a simulation, the total energy of the system is calculatedand used to monitor the approach to the equilibrium state.
The proposed MMC model features various input parameters.The parameters that affect the system energy are the temperatureT , the pair-wise interactions between nearest-neighbor particlesJαβ , the external fields acting on different particles through thechemical potential hα and the mobility of liquid and solid parti-cles. The temperature directly affects the acceptance probability ofthe MMC process (see Eq. (7)). The pair-wise interactions betweennearest-neighbor particles contribute to the energy of all differentpairs of particles (Au–Au, Au–Ag, Ag–Ag, Au–HNO3, Ag–HNO3 andHNO3–HNO3). The external fields hα control the chemical poten-tial of Au (α = 1), Ag (α = 2) and HNO3 (α = 3) particles, re-spectively. In terms of MMC steps, the mobility of the particles is
controlled through the probability of choosing a liquid versus an-other particle. In other words, more mobile particles have largerchances for making exchanges with nearest-neighbors. Themobil-ity parameter controls the speed of the corrosion and removal ofchemical reaction products.
According to Eq. (3), in the present model there are 15parameters (10 pair-wise interaction constants Jαβ and 5 constantshα defining the chemical potential) which enter the expression oftotal energy of the system. Extensive simulations lead us to theconclusion that for the purposes outlined in the introduction, themodel may be simplified significantly. In fact, it turns out that wemay assume that J13 = J23 = J33 = J14 = J24 = J34 = J15 = J25 =
J35 = J45 = 0 and h1 = h2 = h3 = h4 = h5 = 0. In this case, theenergy E of the system simplifies to
E =
2α=1
2β=1
⟨i,j⟩
JαβMαi M
β
j . (8)
Therefore, the model that we will focus on in the followinghas only 3 parameters. Our initial choice of these interactionparameters is guided by the work reported in Ref. [35]. One mightthink that these 3 interaction parameters can be fixed by fitting thephase diagram of the bulk gold–silver alloy to the phase diagramof the simple model Eq. (3), but as we are dealing with rather thinfilmshere and the effect of the electrolyte on the electrondensity ofthe alloy (with pores) is not readily incorporated in the J ′s, this is byno means evident. Therefore we leave the 3 J ′s as free parametersand adjust them until we find NPG structures that are similar tothose found in the experiment.
3.3. Chemical reactions and boundary conditions
In the present work we take into account only one of the twopossible chemical reactions (see Eq. (1)), the reason being thatthe second reaction has a smaller probability to occur. This canbe seen as follows. Each lattice point of the FCC lattice has 12nearest neighbor sites, which contains only one of the five differentparticles. Therefore each lattice site has 512
= 244140625differentconfigurations of neighbors. Of all these configurations, 177031761can lead to reaction Eq. (1) whereas only 29831692 can producereaction Eq. (2). This means that the probability for reaction Eq. (1)is about 0.73 and for Eq. (2) it is only 0.12. It is more likely that twonitric acid particles would be near a silver particle (Eq. (1)) than4 nitric acid particles would be near 3 particles of silver (Eq. (2)).Liquid products of the chemical reactions are replaced by new acidparticles when they reach a boundary of the sample. Finally, thesimulation stops when a certain amount (typically 99%) of silverparticles has been dissolved.
TheMonte Carlo algorithm thatwe have described above has anobvious limitation in that it allows for the possibility that clustersof particles become detached from each other. For instance, onecan imagine the case in which clusters of particles are connectedto each other through a thin silver ‘‘wire’’. This connection wouldeasily be dissolved by the nitric acid, leaving two disconnectedclusters of particles. As our MMC simulation proceeds by movingone particle at a time, it would take a lot of Monte Carlo stepsbefore the two disconnected clusters join again. A nice feature ofthe MMC method is that it is easy to add moves which involveclusters of particles and therefore speed up this process. Such aclustering mechanism guarantees the integrity of the system and,most importantly, provides a simple mechanism to obtain theexperimentally observed shrinkage of the sample [32]. Thus, inthe simulation we allow for movements that merge disconnectedclusters of particles by moving the smallest cluster to the closestpart of the sample, properly weighted by the correspondingBoltzmann factors.

O. Zinchenko et al. / Computer Physics Communications 184 (2013) 1562–1569 1565
We use periodic boundary conditions in the x and y directionsand open boundary condition in the z direction. The flow of acidions is along the z direction. Thus, our simulation model mimics aquasi-infinite film of Au/Ag alloy immersed in acid.
As the experiment was performed with Au/Ag films, thesystems which we simulate are rectangular parallelepipeds.The size dependence of the results was studied by performingnumerous tests, using lattice sizes ranging from 100× 100× 50 to300 × 300 × 50. Comparison of the specific surface area, ligamentsizes and patterns of the simulated structures shows that there isno significant dependence in this range of system sizes. This allowsus to use relatively small systems for the dealloying calculations.
4. Morphological analysis
To characterize the morphology of the gold structures quanti-tatively we calculated the Minkowski functionals [24,25]. A fun-damental theorem in integral geometry [24] states that in threedimensions, there are four Minkowski functionals namely the vol-ume whose morphology is to be determined, the area of the inter-face separating that volume from the rest of the system, the meanbreadth and the Euler characteristic [24,25]. The Euler character-istic (or Euler–Poincaré characteristic) is a topological invariant, anumber that describes the topological shape or structure, regard-less of the way the structure is bent. Comparison with the experi-ments ismade in terms of the specific surface area, the sample size,the relative size of the ligaments, and two-dimensional projectionsof the structure itself. The Minkowski functionals are closely re-lated to the principal curvatures of the surfaces of bodies compris-ing the structure, as defined in differential geometry [24,25]. As inthe simulation, the structures are already represented on a discretelattice, the integral-geometry approach is much easier to use thanthe corresponding differential-geometry. In practice, we computethe Minkowski functionals using the integral-geometry algorithmdescribed in [26,27].
The first step of calculation is to assign a small cube or sphereto each coordinate (on the FCC lattice) of a solid particle. Next,the algorithm discretizes the resulting structure using a regularcubic lattice with a fine mesh. This results in a 3D image in whichsome cubes (voxels) are filled and others are not. The final stepis to compute the Minkowski functionals of the 3D image on thisfine mesh, following the prescription given in [26,27]. In essence,the algorithm is very simple, a direct consequence of the integral-geometry approach. Each filled voxel of the regular cubic latticeis decomposed into disjoint sets of 8 vertices, 12 edges and 6faces. The morphological characterization of a 3D cubic patternamounts to the counting of the elementary geometric objects(cubes, vertices, edges and faces) that constitute the 3D image[26,27]. Overlapping vertices, edges or faces of neighboring voxelsare counted only once. According to integral geometry, the volume,the surface area and the Euler characteristic are given by
V = Ncub, (9)S = 2Nface − 6Ncub, (10)χ = Nface + Nvert − Ncub − Nedge, (11)
where Ncub,Nface,Nvert,Nedge is the total number of elementarycubes, faces, vertices and edges, respectively [26,27]. The specificsurface area is defined as
A = S/V , (12)
and follows directly from Eqs. (9) and (10).
Fig. 2. Relaxation of the total energy E of the system as a function of n, the numberof MMC steps per particle. For n < 3 × 10⁴ , the temperature T = 500 K, for3 × 104 < n < 6 × 10⁴ , the temperature T = 400 K and for n > 6 × 10⁴ , thetemperature T = 300 K. The plateaus indicate that quasi-equilibrium states werereached. System interaction constants are J11 = 0.047 eV, J22 = 0.043 eV, J12 =
0.037 eV. The system size is 100 × 100 × 50 (29.1 × 29.1 × 14.4 nm3).
5. Results and discussion
5.1. Equilibration
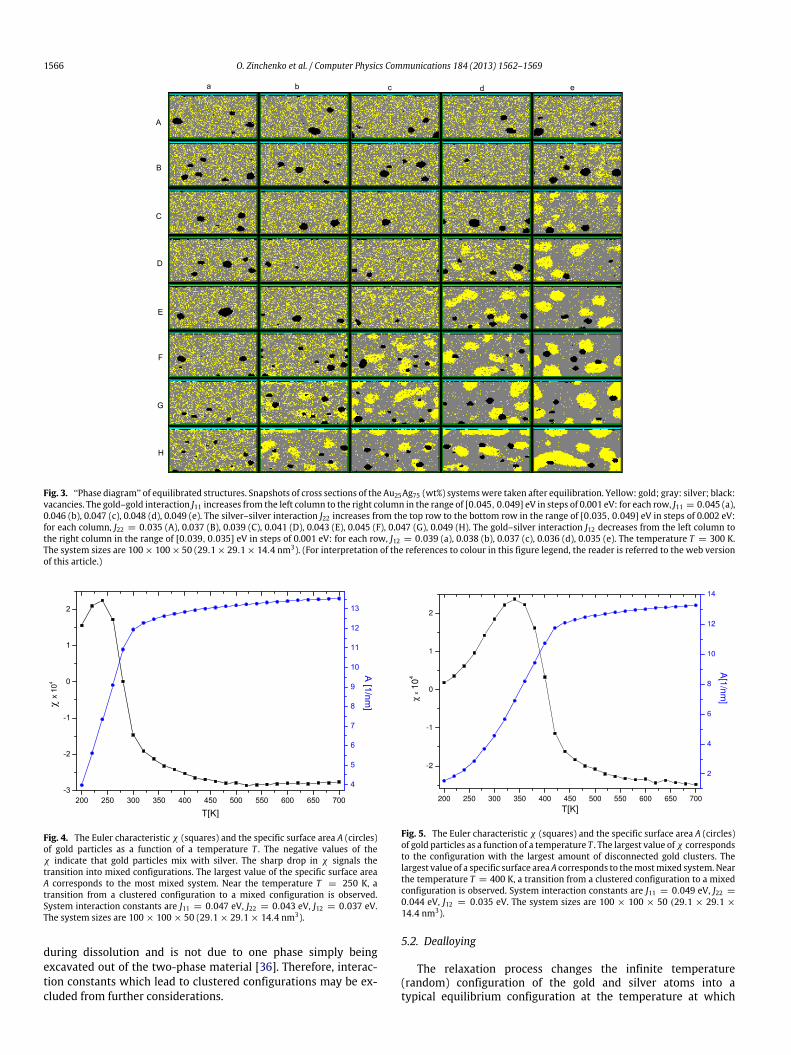
When the dealloying process is started, we assume that thealloy is in a quasi-equilibrium state. However, the correspondingatomic arrangement is not known a priori. Therefore, in theequilibration process, we take as the initial arrangement a randomdistribution of particles over the FCC lattice and use the MMCmethod to find the equilibrium state for the current set ofinput parameters. Evidently, in this phase of the simulation wedo not allow for chemical reaction processes. The relaxationprocess was performed by gradual cooling down (annealing) tothe desired dealloying temperature. This procedure forces thesystem to change gradually from the initial random rearrangementof atoms (which corresponds to infinite temperature) to anequilibrated state at the temperature at which the dealloyingis going to take place. A typical example of cooling a systemfrom infinite temperature down to 300 K is presented in Fig. 2where we plot the total energy E as a function of the numberof MMC cycles per particle n. Three plateaus indicate that threequasi-equilibrium states have been reached, corresponding to thespecified temperatures 500 K, 400 K and 300 K respectively.Repeating the equilibration simulation for different choices of theinteraction strength between gold and silver yields the ‘‘phasediagram’’ presented in Fig. 3. In this diagram one can clearlysee two distinct configurations: the mixed configuration and theclustered configuration.
The evolution of the Euler characteristic and specific surfacearea of gold structures (disregarding silver) during the relaxationprocess is shown in Figs. 4 and 5. Two different sets of interactionconstants were chosen for these simulations, corresponding to thetwo different types of equilibrium configurations. Relaxation withone set of interaction constants leaves the system in an atomicallymixed configuration (see Fig. 4) and relaxation with another setproduces gold clusters immersed in silver (Fig. 5). Atomicallymixed configurations yield a negative value of Euler characteristicwhich is of the order ofNAu, number of gold particles in the system.In the case of a clustered configuration the Euler characteristicχ ≈ NCl, where NCl is a number of disconnected gold clusters.
Prior to dissolution the alloy must be homogeneous with nophase separation [36]. Porosity evolution thus forms dynamically
1566 O. Zinchenko et al. / Computer Physics Communications 184 (2013) 1562–1569
Fig. 3. ‘‘Phase diagram’’ of equilibrated structures. Snapshots of cross sections of the Au25Ag75 (wt%) systemswere taken after equilibration. Yellow: gold; gray: silver; black:vacancies. The gold–gold interaction J11 increases from the left column to the right column in the range of [0.045, 0.049] eV in steps of 0.001 eV: for each row, J11 = 0.045 (a),0.046 (b), 0.047 (c), 0.048 (d), 0.049 (e). The silver–silver interaction J22 increases from the top row to the bottom row in the range of [0.035, 0.049] eV in steps of 0.002 eV:for each column, J22 = 0.035 (A), 0.037 (B), 0.039 (C), 0.041 (D), 0.043 (E), 0.045 (F), 0.047 (G), 0.049 (H). The gold–silver interaction J12 decreases from the left column tothe right column in the range of [0.039, 0.035] eV in steps of 0.001 eV: for each row, J12 = 0.039 (a), 0.038 (b), 0.037 (c), 0.036 (d), 0.035 (e). The temperature T = 300 K.The system sizes are 100× 100× 50 (29.1× 29.1× 14.4 nm3). (For interpretation of the references to colour in this figure legend, the reader is referred to the web versionof this article.)
Fig. 4. The Euler characteristic χ (squares) and the specific surface area A (circles)of gold particles as a function of a temperature T . The negative values of theχ indicate that gold particles mix with silver. The sharp drop in χ signals thetransition into mixed configurations. The largest value of the specific surface areaA corresponds to the most mixed system. Near the temperature T = 250 K, atransition from a clustered configuration to a mixed configuration is observed.System interaction constants are J11 = 0.047 eV, J22 = 0.043 eV, J12 = 0.037 eV.The system sizes are 100 × 100 × 50 (29.1 × 29.1 × 14.4 nm3).
during dissolution and is not due to one phase simply beingexcavated out of the two-phase material [36]. Therefore, interac-tion constants which lead to clustered configurations may be ex-cluded from further considerations.
Fig. 5. The Euler characteristic χ (squares) and the specific surface area A (circles)of gold particles as a function of a temperature T . The largest value ofχ correspondsto the configuration with the largest amount of disconnected gold clusters. Thelargest value of a specific surface areaA corresponds to themostmixed system.Nearthe temperature T = 400 K, a transition from a clustered configuration to a mixedconfiguration is observed. System interaction constants are J11 = 0.049 eV, J22 =
0.044 eV, J12 = 0.035 eV. The system sizes are 100 × 100 × 50 (29.1 × 29.1 ×
14.4 nm3).
5.2. Dealloying
The relaxation process changes the infinite temperature(random) configuration of the gold and silver atoms into atypical equilibrium configuration at the temperature at which

O. Zinchenko et al. / Computer Physics Communications 184 (2013) 1562–1569 1567
Fig. 6. ‘‘Phase diagram’’ of dealloyed structures. Snapshots of cross sections of the Au25Ag75 (wt%) dealloyed systems. Yellow: gold; gray: silver; red: products of chemicalreactions; black: vacancies. The gold–gold interaction J11 increases from the left column to the right column in the range of [0.045, 0.049] eV in steps of 0.001 eV: for eachrow, J11 = 0.045 (a), 0.046 (b), 0.047 (c), 0.048 (d), 0.049 (e). silver–silver interaction J22 increases from the top row to the bottom row in the range of [0.035, 0.049] eV insteps of 0.002 eV: for each column, J22 = 0.035 (A), 0.037 (B), 0.039 (C), 0.041 (D), 0.043 (E), 0.045 (F), 0.047 (G), 0.049 (H). The gold–silver interaction J12 decreases from theleft column to the right column in the range of [0.039, 0.035] eV in steps of 0.001 eV: for each row, J12 = 0.039 (a), 0.038 (b), 0.037 (c), 0.036 (d), 0.035 (e). The temperatureT = 300 K. The system sizes are 100 × 100 × 50 (29.1 × 29.1 × 14.4 nm3). (For interpretation of the references to colour in this figure legend, the reader is referred to theweb version of this article.)
Fig. 7. Snapshots of cross sections of equilibrated structures of the Au25Ag75 (wt%) sample (B) and corresponding dealloyed structures (A) for different temperatures. Thetemperature increases from the left column to the right column in the range of [200, 400] K in steps of 50 K: for each row, T = 200 K (a), 250 K (b), 300 K (c), 350 K (d),400 K (e). Yellow: gold; gray: silver; black: vacancies; red: products of chemical reactions; cyan: nitric acid. System interaction constants are J11 = 0.047 eV, J22 = 0.043 eV,J12 = 0.037 eV. The system sizes are 100 × 100 × 50 (29.1 × 29.1 × 14.4 nm3). (For interpretation of the references to colour in this figure legend, the reader is referred tothe web version of this article.)
the dealloying is going to take place. To start the dealloying, theonly change to the Monte Carlo algorithm is the inclusion of thechemical reaction processes. The simulation of the dealloying isperformed using the same set of model parameters J11, J12 and J22as in the equilibration process. The fact that in the simplifiedmodelEq. (8), there is no nearest-neighbor interaction between acid andmetal particles does not prevent a chemical reaction between theseparticles to take place. Indeed, by construction, in the Monte Carloalgorithm such reactions can take place whenever silver and acidparticles are nearest neighbors.
A ‘‘phase diagram’’ of dealloyed structures is presented in Fig. 6.In this diagram one can distinguish three distinct configurations -configurations with gold clusters that accumulated mostly in thebottom of the sample (e.g. the system with J11 = 0.045 eV, J22 =
0.035 eV, J12 = 0.039 eV, T = 300 K), configurations with disor-dered NPG (e.g. the system with J11 = 0.047 eV, J22 = 0.043 eV,
J12 = 0.037 eV, T = 300 K) and configurations which correspondto clustered equilibrated configurations (e.g. the systemwith J11 =
0.049 eV, J22 = 0.049 eV, J12 = 0.035 eV, T = 300 K). Simulationswith different temperatures produce distinct structures (see Fig. 7)that exhibit all of the three ‘‘phases’’.
Comparing the two ‘‘phase diagrams’’ (Figs. 3 and 6), we mayconclude that the NPG structures can only be obtained within anarrow range of interaction parameters. Within this range, thesestructures are robust to changing of interaction parameters.
The evolution of the Euler characteristic and the specific surfacearea of gold particles during the dealloying process are shown inFig. 8. The plateau-like regions in Fig. 8 correspond to the stagewhen acid reaches the bottom of the sample. The constant Eulercharacteristic during this stage is due to the fact that the systemexhibits percolation. In this stage, creating additional holes in thesystem is very difficult. The slow decrease of a specific surface area
1568 O. Zinchenko et al. / Computer Physics Communications 184 (2013) 1562–1569
Fig. 8. The Euler characteristic χ (squares) and the specific surface area A (circles)of gold particles as a function of n, the number of MMC steps per particle. Theconstant Euler characteristics χ during the final stage indicate that the systemsare percolating. The slow decrease of A at the final stage of the simulation is dueto further equilibration of the samples. Solid squares and circles: J11 = 0.047 eV,J22 = 0.043 eV, J12 = 0.037 eV, T = 300 K. Open squares and circles: J11 =
0.046 eV, J22 = 0.035 eV, J12 = 0.038 eV, T = 300 K. The system sizes are100 × 100 × 50 (29.1 × 29.1 × 14.4 nm3).
A with the increasing number of MMC steps is due to annealing ofthe sample.
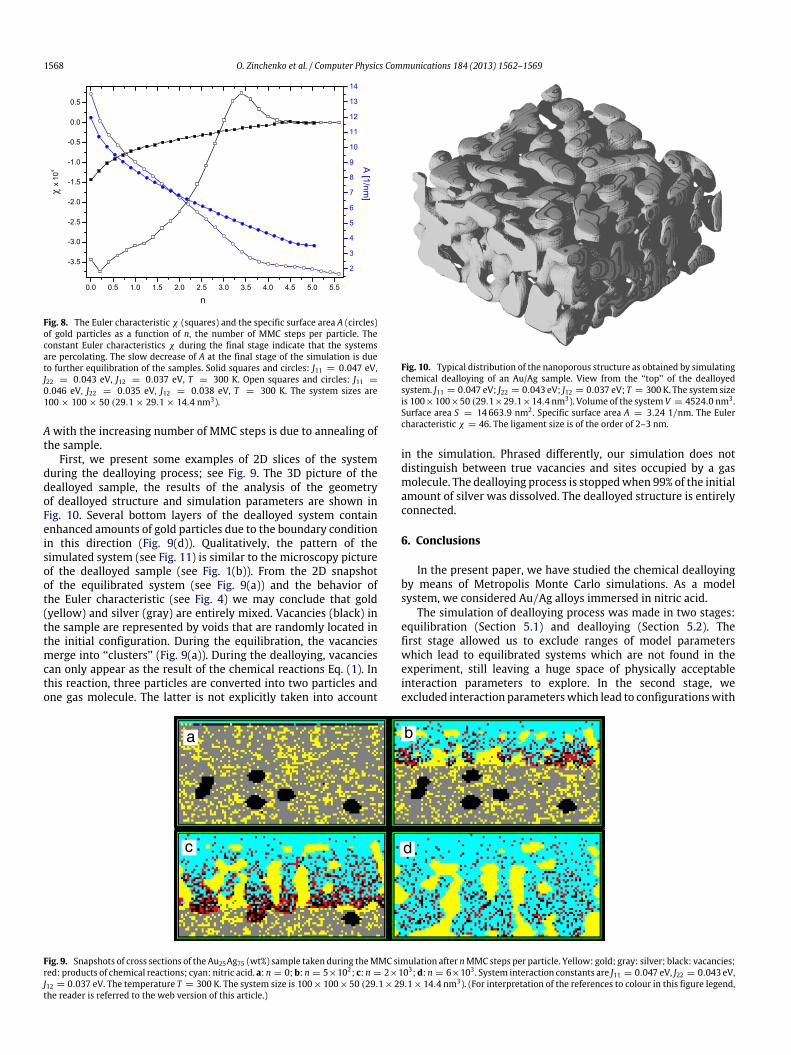
First, we present some examples of 2D slices of the systemduring the dealloying process; see Fig. 9. The 3D picture of thedealloyed sample, the results of the analysis of the geometryof dealloyed structure and simulation parameters are shown inFig. 10. Several bottom layers of the dealloyed system containenhanced amounts of gold particles due to the boundary conditionin this direction (Fig. 9(d)). Qualitatively, the pattern of thesimulated system (see Fig. 11) is similar to the microscopy pictureof the dealloyed sample (see Fig. 1(b)). From the 2D snapshotof the equilibrated system (see Fig. 9(a)) and the behavior ofthe Euler characteristic (see Fig. 4) we may conclude that gold(yellow) and silver (gray) are entirely mixed. Vacancies (black) inthe sample are represented by voids that are randomly located inthe initial configuration. During the equilibration, the vacanciesmerge into ‘‘clusters’’ (Fig. 9(a)). During the dealloying, vacanciescan only appear as the result of the chemical reactions Eq. (1). Inthis reaction, three particles are converted into two particles andone gas molecule. The latter is not explicitly taken into account
Fig. 10. Typical distribution of the nanoporous structure as obtained by simulatingchemical dealloying of an Au/Ag sample. View from the ‘‘top’’ of the dealloyedsystem. J11 = 0.047 eV; J22 = 0.043 eV; J12 = 0.037 eV; T = 300 K. The system sizeis 100×100×50 (29.1×29.1×14.4 nm3). Volume of the system V = 4524.0 nm3 .Surface area S = 14 663.9 nm2 . Specific surface area A = 3.24 1/nm. The Eulercharacteristic χ = 46. The ligament size is of the order of 2–3 nm.
in the simulation. Phrased differently, our simulation does notdistinguish between true vacancies and sites occupied by a gasmolecule. The dealloying process is stoppedwhen 99% of the initialamount of silver was dissolved. The dealloyed structure is entirelyconnected.
6. Conclusions
In the present paper, we have studied the chemical dealloyingby means of Metropolis Monte Carlo simulations. As a modelsystem, we considered Au/Ag alloys immersed in nitric acid.
The simulation of dealloying process was made in two stages:equilibration (Section 5.1) and dealloying (Section 5.2). Thefirst stage allowed us to exclude ranges of model parameterswhich lead to equilibrated systems which are not found in theexperiment, still leaving a huge space of physically acceptableinteraction parameters to explore. In the second stage, weexcluded interaction parameterswhich lead to configurationswith
a b
c d
Fig. 9. Snapshots of cross sections of the Au25Ag75 (wt%) sample taken during theMMC simulation after nMMC steps per particle. Yellow: gold; gray: silver; black: vacancies;red: products of chemical reactions; cyan: nitric acid. a: n = 0; b: n = 5×10²; c: n = 2×10³;d: n = 6×10³ . System interaction constants are J11 = 0.047 eV, J22 = 0.043 eV,J12 = 0.037 eV. The temperature T = 300 K. The system size is 100×100×50 (29.1×29.1×14.4 nm3). (For interpretation of the references to colour in this figure legend,the reader is referred to the web version of this article.)

O. Zinchenko et al. / Computer Physics Communications 184 (2013) 1562–1569 1569
Fig. 11. Plane cut taken from the system shown in Fig. 10, showing the typicaldistribution of gold particles as obtained by simulating chemical dealloying of anAu/Ag sample.
gold clusters that accumulatedmostly at the bottom of the sample.As a result, only a narrow range of interaction parameters yieldsacceptable physically realistic structures. All these structures arerobust to changes of the interaction parameters within this range.
A relevant conclusion in relation to experiments is that simula-tions provide insight in the processing–structure relationship. Es-sential parameters turn out to be the Au fractions, the chemicalpotentials for the acid ions and the vacancy concentrations. Thestructures of the nanoporous gold are found to be robust to changesof all these parameters provided these are in a particular range. Incase of robustness the Au fractions are ranging between 20% and30%, the chemical potentials for the acid ions between 0 and 0.1 eVand the vacancy concentration in the range up to 10.
Further, the salient features of the structures found bysimulation are that the ligament size of dealloyed material is ofthe order of 2–3 nm, the structure is disordered, percolating andentirely connected. Compared to the initial volume of the system,the dealloying process leads to a reduction of the film thicknessby about 10%. The specific surface area of simulated structureA = 3.24 1/nm corresponds to the specific surface area whichwas calculated analytically for the random structurewith ligamentdiameter of 1.14 nm [37].
Acknowledgments
The authors are grateful to The Netherlands Organizationfor Scientific Research (NWO-The Hague, Mozaiek 2008 BOODossiernr: 017.005.026) and the Zernike Institute for AdvancedMaterials for financial support.
References
[1] A. Wittstock, V. Zielasek, J. Biener, C. Friend, M. Baumer, Science 327 (2010)319.
[2] L. Nagle, J. Rohan, Int. J. Hydrog. Energy 36 (2011) 10319.[3] C. Xu, X. Xu, J. Su, Y. Ding, J. Catal. 252 (2007) 243.[4] X. Lang, H. Yuan, Y. Iwasa, M. Chen, Scr. Mater.[5] H. Liu, G. Zhu, J. Power Sources 171 (2007) 1054.[6] K. Hu, D. Lan, X. Li, S. Zhang, Anal. Chem. 80 (2008) 9124.[7] T.D.E.E.L. Swan, K.C. Popat, Biomaterials 26 (2005) 1969.[8] J. Weissmuller, R. Viswanath, D. Kramer, P. Zimmer, R. Wurschum, H. Gleiter,
Science 300 (2003) 312.[9] H. Jin, X.Wang, S. Parida, K.Wang, M. Seo, J. Weissmuller, Nano Lett. 10 (2010)
187.[10] J. Biener, A. Wittstock, L. Zepeda-Ruiz, M. Biener, V. Zielasek, D. Kramer, et al.,
Nature Mater. 8 (2009) 47.[11] H. Jin, J. Weissmuller, Adv. Eng. Mater. 12 (2010) 714.[12] E. Detsi, S. Punzhin, J. Rao, P.R. Onck, J.T.M. DeHosson, ACSNano 6 (2012) 3734.[13] R. Li, K. Sieradzki, Phys. Rev. Lett. 68 (1992) 1168.[14] H. Rösner, S. Parida, D. Kramer, C. Volkert, J. Weismüller, Adv. Eng. Mater. 9
(2007) 535.[15] T. Fujita, L.-H. Qian, K. Inoke, J. Erlebacher, M.-W. Chen, Appl. Phys. Lett. 92
(2008) 251902.[16] J. Wang, R.Z.J. Xia, Y. Ding, X. Zang, Y. Chen, J. Mater. Sci. 47 (2012) 5013.[17] J. Erlebacher, K. Sieradzki, Scr. Mater. 49 (2003) 991.[18] C. Eilks, C. Elliot, J. Comput. Phys. 227 (2008) 9727.[19] Q. Chen, N. Ma, K. Wu, Y. Wang, Scr. Mater. 50 (2004) 471.[20] Z. Xu, H. Huang, X. Li, P. Meakin, Comput. Phys. Comm. 183 (2012) 15.[21] J. Erlebacher, M. Aziz, A. Karma, N. Dimitrov, K. Sieradzki, Nature 410 (2001)
450.[22] D. Landau, K. Binder,Monte Carlo Simulations in Statistical Physics, Cambridge
University Press, 2000.[23] M. Newman, G. Barkema, Monte Carlo Methods in Statistical Physics, Oxford:
Clarendon press, 1999.[24] H. Hadwiger, Vorlesungen ber Inhalt. Oberflche und Isoperimetrie, Springer
Verlag, Berlin, 1957.[25] L. Santalo, Integral Geometry and Geometric Probability, Addison-Wesley,
1976.[26] K. Michielsen, H. De Raedt, J.T.M. De Hosson, Adv. Image Electr. Phys. 125
(2002) 119.[27] K. Michielsen, H. De Raedt, Integral-geometry morphological image analysis,
Phys. Rep. 347 (2001) 461.[28] J. Erlebacher, Phys. Rev. Lett. 106 (2011) 225504.[29] K. Kolluri, M. Demkowicz, Acta Mater. 59 (2011) 7645.[30] A. Groysman, Corrosion for Everybody, Springer, 2009.[31] R. Maurice, F. Norris, K. Ray, Living chemistry, Ginn, 1955.[32] S. Parida, D. Kramer, C. Volkert, H. Rosner, J. Erlebacher, J. Weissmuller, Phys.
Rev. Lett. 97 (2006) 035504.[33] S. Kakani, A. Kakani, Material Science, New Age International Publishers, 2006.[34] S.A. Policastro, R.G. Kelly, J.C. Carnahan, E. Carson, P.F. Reynolds Jr., 212th
Electrochemical Society Meeting MA2007-02, 949 (2007).[35] M. Gimenez, A. Ramirez-Pastor, E. Leiva, Surf. Sci. 600 (2006) 4741.[36] J. Erlebacher, J. Electrochem. Soc. 151 (2003) C614.[37] E. Detsi, E.D. Jong, A. Zinchenko, Z. Vucovic, I. Vucovic, S. Punzhin, K. Loos,
G. ten Brinke, H. De Raedt, P.R. Onck, J.T.M. De Hosson, Acta Mater. 59 (2011)7488.