nasa technical memorandum 84900 a unique flight test
TRANSCRIPT

NASA Technical Memorandum 84900
A UNIQUE FLIGHT TEST FACILITY: DESCRIPTION AND RESULTS
Robert R . Meyer, J r .
November 19 82

NASA Technica l Memorandum 84900
A UNIQUE FLIGHT TEST FACILITY: DESCRIPTION AND RESULTS
Robe r t R . Meyer , Jr . Ames Resea r ch Cen t e r D r y d e n F l igh t R e s e a r c h ~ a c i l i t ~ E d w a r d s , Cal i fornia
National Aeronauticsand Space Admtnstraton

A UNIQUE FLIGHT TEST FACILITY: DESCRIPTION AND RESULTS
Abstract
Robert R. Meyer . J r . * NASA Ames Research Center
Dryden Flight Research Facility Edwards, California
STS-1 first shuttle flight (space transportation system 1)
The Dryden Flight Research Facility has devel- T absolute temperature oped a unique research facility for conducting aerodvnamic and fluid mechanics exoeriments in TPS thermal protection system flight: A low aspect ratio fin, referred to as the flight test fixture (FTF), is mounted on the underside of x chordwise distance from leading edge, the fuselage of an F-104G aircraft. The F-104lFTF positive aft facilitv is described. and the canabilities are dis- clzssei. The capabilities include (1) a large Mach number envelope (0.4 to 2.0) , including the region through Mach 1.0; (2) the potential ability to test articles larger than those that can be tested in wind tunnels: (3) the larpe chord Revnolds number enve- . . . lope (greater than 4i million); k d (4) the ability to define small increments in friction drag between two test surfaces. Data are presented from experiments that demonstrate some of the capabilities of the FTF , includine the shuttle thermal nrotection svstem air- - load tests, instrument development, and base drag studies. Proposed skin friction experiments and instrument evaluation studies are also discussed.
Nomenclature
C base drag coefficient Db
Cf local friction coefficient
P - P, C
P pressure coefficient, -
9
C * critical or sonic pressure coefficient P
C
DFRF
FTF
h
local chord
Dryden Flight Research Facility
night test fixture
boundary layer rake probe height, dimen- sion given from surface to center of probe
Mach number
local static pressure
total pressure ahead of shock
total pressure behind shock
pulse code modulation
2 dynamic pressure, 0.7M p
R Reynolds number
*Aerospace Engineer
Y spanwise distance from r w t , positive down
u/ue velocity ratio, local velocityledge velocity
a angle of attack
$ angle of sideslip
A increment
6 boundary layer thickness
6* boundary layer displacement thickness
V absolute viscosity
Subscripts:
avg average condition
e edge condition
FTF based on flight test fixture
8 based on momentum thickness
, referenced to calculated free-stream condi- tions
Superscript:
( ) ' based on reference temperature method
Introduction
Ex~erimental aerodvnamic and fluid mechanics investtgations are primarily conducted in ground- bused wind tunnel facilities such as those inventoried in Ref. 1. However, these wind tunnel facilities often impose certain limitations on the experimental inves- tieator. such as scale effects due to unit Revnolds " number, size limitations for models or test specimens due to test section dimensions, improper scaling of noise or turbulence levels in the wind tunnel, &d unreliable data near a Mach number of 1.0 due to problems such 8s shocks renected off the tunnel walls Another Limlting factor in ground facilities 1s the need to conduct tests in several wind tunnels to span a wide range of Mach numbers (for example, incom- nressible s ~ e e d s to about twice the meed of sound. ~. which are representative of present fighteriinter- ceptor aircraft). In some instances, conduct in^ an investigation in hght using the "flying wind tunnel"

concept, wherein an aircraft is used as a carrier vehicle for an experiment. can avoid some or all of the above noted wind tunnel limitations. while main- taining operational costs that are competitive with those of wind tunnels.
Some excellent generic research investigations have been previously conducted in flight, including those documented in-Refs . 2 to 5. To meet the contin- uing need to conduct such investigations in flight using the concept of an aircraft for a carrier vehicle, the Dryden Flight Research Facility (DFRF) has modi- fied an F-104G aircraft to carry a low aspect ratio fin on the underside of the fuselage. This fin, commonly referred to as the flight test fixture (FTF) , was originally built in the 1960's for panel flutter studies, but has evolved into present use for aeronautics investigations in such areas as skin friction drag, base drag, shuttle tile airloads, and aeronautic instrument develo~ment. The fin has its own air
shock strength on the FTF transonically) . Both croes sections are shown in Fig. 3. Configurations are changed by an easily removed and installed noseshape.
Instrumentation
The FTF uses a pulse code modulation (pcm) system for data acquisition. The pcm is capable of multiplexing 40 channels at a maximum frequency response of 80 Hz. During flight, data from the pcm are transmitted to the ground via telemetry, as well as being recorded by an onboard recorder. Signals that exceed the 80-Hz limit of the pcm are recorded by the onboard recorder and can be played back after the flight for analysis.
A pitot-static probe, mounted on a bwm extending from the forward portion of the FTF (Fig. 2 ) , provides air data measurements for the FTF. The boom is
data system for d;termination of FTF reference canted 3O nose down in an attempt to minimize mis- parameters such as Mach number, altitude, and alignment of the probe with the local streamlines dynamic pressure. It also contains its own inde~en- during aircraft trim angle-of-attack conditions. dent instrumentation svstem. which is orimarilv. oriented towards aerodynamic measurements. Mach numbers of 0.4 to 2 .O, dynamic pressures of ovcr 90 kPa (1900 psO. and unit Reynolds numbers of
6 6 approximately 6.6 X 10 perm (2.0 X 10 per ft) to 6 6 23.0 X 10 per m (7.0 X 10 per f t ) are achievable
with the F-104GfFTF combination.
This reDort describes the F-104lFTF facilitv. its -~ ~. - -~ ~, . ~~~
capabilities, and past and proposed uses. The operating envelope in terms of Mach number, dynamic pressure, and Reynolds number is discussed. The flow environmenton the FTF is shown in terms of chordwlse pressure distributions, boundary layer thiclcness characteristics, and hlft photographs. While it is recognized that many aerodynamic and fluid mechanicsexperiments require ground-based wind tunnel facilities, examples of experiments that are enhanced or made possible by the capabilities of the FTF are provided.
Flight Test Fixture Description
General Description
The flight test fixture is a low aspect ratio fm-like shape which is mounted vertically on the underside of the F-104G carrier aircraft, with its longitudinal axis aligned along the aircraft's lower fuselage centerline (Figs. 1 and 2). The chord length is 203 cm (80 in.). the semispan is 61 cm (24 in. 1 , and for the major part of its length, except the forebody, the thickness is a constant 16.3 cm (6.4in.).
The FTF i s constructed primarily of aluminum and has a nominal weight of 136 kg (300 lb) .
Originally designed to conduct panel flutter tests, the FTF was modified and instrumented to conduct aeronautic investigations, generally related to local flow aerodynamics. The FTF can be flown readily in two svmmetrical cross-sectional confipurations:
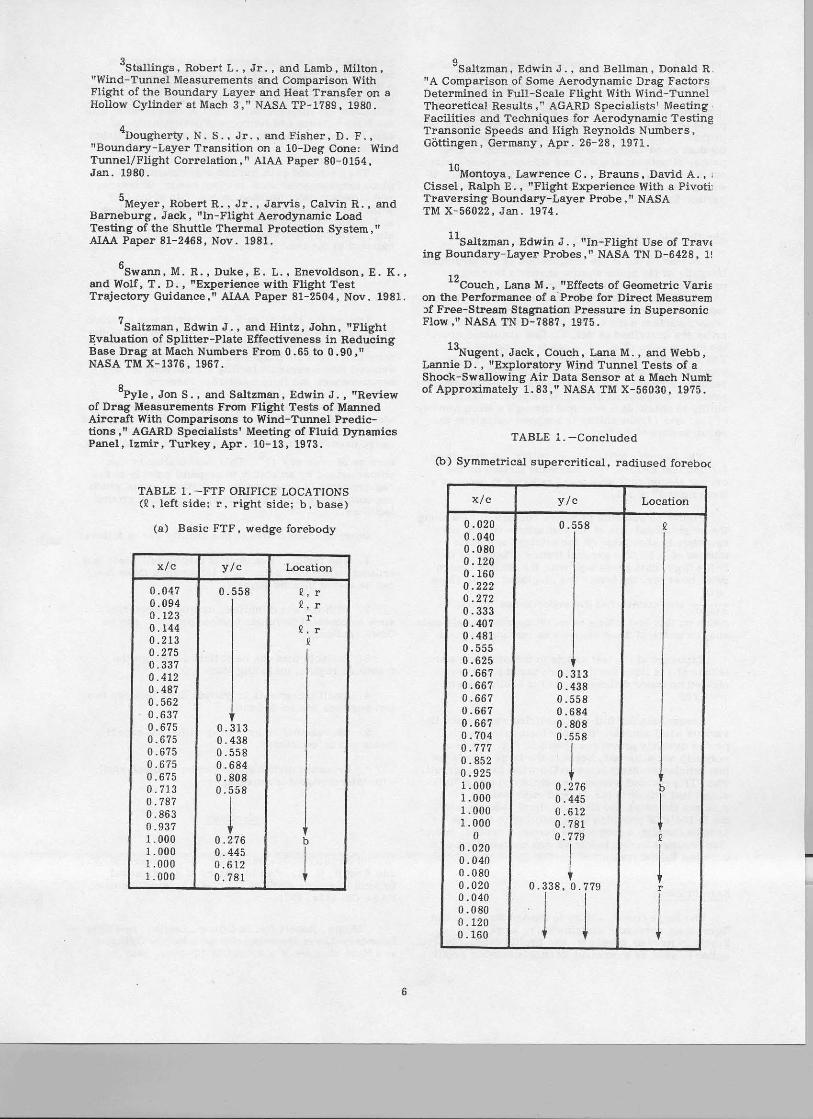
The FTF is equipped with flush static pressure orifices for measurement of chordwise and spanwise pressure distributions, and boundary layer rakes for measurement of boundary layer profiles. Flush static pressure orifices are located on both sides of the FTF. The locations of the orifices are shown in Fig. 4 and listed in Table 1.
Boundary layer rakes can be mounted on both the left and right sides of the FTF. The rakes can be positioned where needed, but are indicated in Fig. 4 at a typical location of approximately the SO-percent chord and midspan of the FTF. Details of the rake geometry are shown in Fig. 5 and listed in Table 2.
Pressure measurements for both pressure distributions and boundary layers were obtained by a 48-port Scanivalve and two other individual differential pressure transducers. The Scanivalve and individual pressure transducers are rcfcrenced to FTF boom--- static pressure, which is measured by a precision absolute pressure transducer. It should be noted that the use of a Scanivalve (one transducer) eliminates bias error between Dressure measurements (for example, between iifferent probes on the rakes or between the left and right side of the FTF) . This single transducer provides a great amount of precision where incremental boundary layer differences between different surfaces require definition.
For the data presented with forced transition, transition was obtained using No. 36 nominal 0.850-mm (0.026-in.) diameter carborundum grains bonded to the surface of the FTF with plastic adhesive in vertical strips 1.27 cm (0.5 in. ) wide. Flow visualization from tufts was provided by short lengths of parachute cord attached to the sides of the FTF with tape.
The F- 104C aircraft has an independent instru- mentation system which is not discussed in this paper. with the exception of the aircreft flicrht traiectorv midance svsiem . The kev element ;f this-mid&ce - - ~ ~ - - - - system is 'special cockpii display (Fig. 6) , which is part of an integrated system that provides the pilot .-.
(1) the basic FTF shape with n sharp yeading edge with flight trajectory guidance. 'b) The trajectory (wcdpe forcbody ) . and (2) the radiused forebody guidance system uplinks engineering parameters incorporating the front portion of a symmetrical super- calculated on a ground-based computer (using air- critical airfoil (the purpose of which is to reduce the craft or FTF telemetry, or both) to the cockpit display
2
in real time. In Fig. 6, the four display indicators are noted. The vertical needle is typically used for bank error during constant Mach, alpha, and altitude turns. The horizontal needle can be used for Reynolds number error, and the turn needle is nor- mally used for FTF O0 sideslip error. The speed bug is normally used for Mach number error.
Description of FTF Flow Environment
Pressure distribution data and boundaq layer characteristics have been obtained for both the basic FTF wedze forehody and the symmetrical supercritical noseshape (radius& forebodyj . Pressure trans- ducers sensing local pressures from mirror image locations on both sides of the FTF provide an excellent source of real-time data (by means of the uplink dis- play) for the pilot to determine when the FTF sideslip angle is zero. Date presented herein were obtained at zero sideslip on the FTF, which implies the same flow field on both sides of the FTF. Consequently, data discussions in this section apply to both sides of the FTF.
Figure 7 presents FTF chordwise pressure distri- butions on the left and right side leading edge, and base pressures for the wedge forebody configuration and the symmetrical supercritical noseshape (radiused forehody) at selected FTF Mach numbers of 0.57, 0.86, and 1.22. For simplification, only pressure data on the left side centerline of the radiused forebody are presented. The data at x/c = 1.00 are base pressure coefficients, which are presented as reference for base drag experiments.
For the wedge forehody (triangle symbols), the negligible difference UI pressure coefficient (C_)
r between the left and right side leading edge (X/C = 0 to 0.15) indicates that the FTF is at a side- slip of OO. At an FTF Mach number of 0.86 (Fig. 7(b) ) , a peak occurs in the pressure distribution at approximately 2Opercent chord. The pressure coefficient level of the peak exceeds the critical level (C,*) and terminates in an abrupt increase in pres- r
sure, which indicates the presence of a normal shock.
For the symmetrical supercritical nose, radiused forebody (circle symbols), the shape of the pressure distribution near the leadina edze {s much different and more negative in level than The data for the wedge forehody. Similarly, in Fig. 7 (b) (MFTF = 0.86). the data for the radiused forebody
exceeds the critical level (C_* ) and terminates in an r
abrupt increase in the pressure at approximately 15- to 20-percent chord, which also indicates the presence of a normal shock. However, this abrupt increase in pressure is smaller in magnitude than that indicated in the data for the wedge forebody. This demonstrates the expected reduced strength of the normal shock for the symmetrical supercritical noseshape, radiused forebody.
Figure 8 presents spanwise variation of pressure coefficient at x/c = 0.67 for both the basic FTF wedge forebody and the symmetrical supercritical noseshape. Data are presented for a transonic (M = 0.86) and a. supersonic (M = 1.22) case. In Fig. 8(a), spanwise pressure distribution is virtually constant at the transonic Mach number presented. In Fig. 8(b),
at an average supersonic Mach number of 1.22, the data for the basic FTF wedre forehodv show a soan- - = wise variation of approximately 0.15 pressure coef- ficient, while no variation is noted for the symmetrical supercritical noseshape. These spanwise variations of oressure are considered neelieible . indicatine a - - . quasi-two-dimensional environment for both forghody configurations.
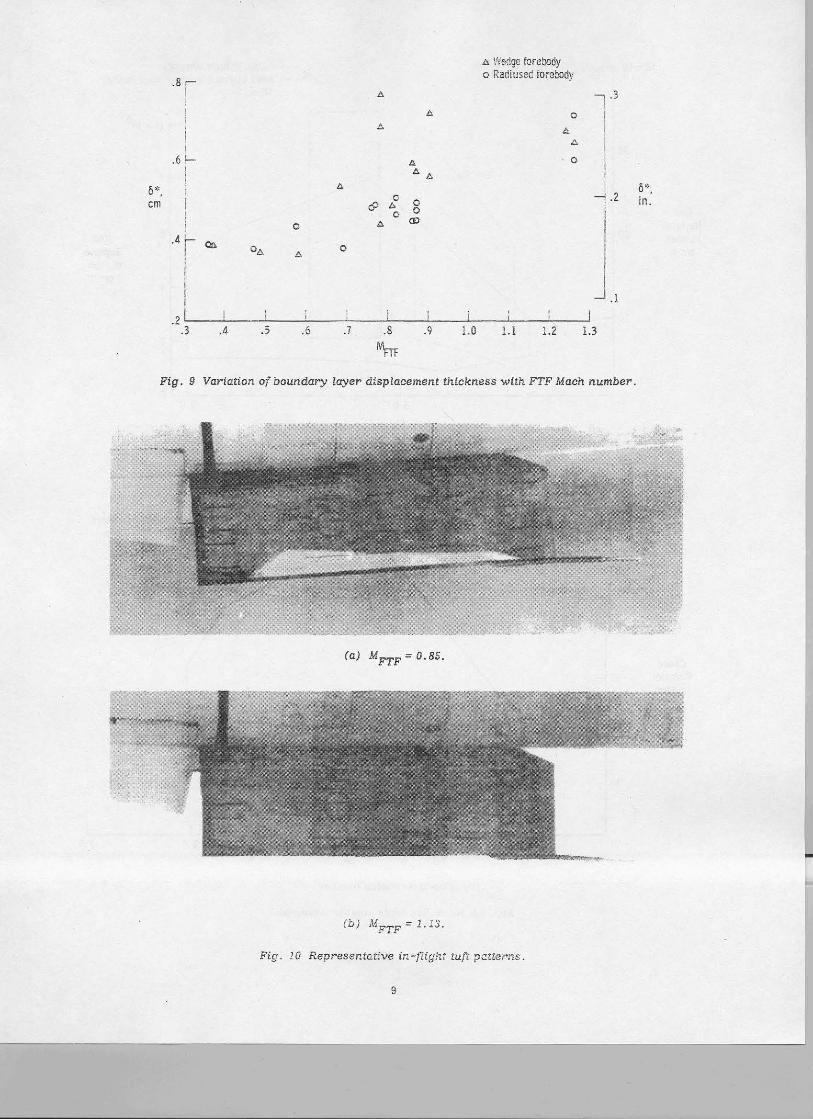
Figure 9 presents boundary layer displacement thickness (6*) versus FTF Mach number for both the wedge nose &d the symmetrical supercritical nose- shape, with transition fixed at 7.5 and 5.0 percent, respectively. The data show that the symmetrical supercritical noseshape decreases the displacement thickness transonically (MFTF = 0.65 to 0.93) relative
to the wedm forebodv. Both forehodv confieurations show trenzs of increked displacement thickkess as MFTF = 0.80 is approached. which corresponds lo the
Mach numbers which show evidence of normal shock formation in the pressure data of Fig. 7 . The scatter in the data near MmF = 0.80 (for both forebodies) is
. -. attributed to boundary layer instabilities caused by the normal shock formation.
Figure 10 shows representative in-flight tuft photographs for the wedge nose configuration at transonic and supersonic FTF Mach numbers of 0.85 and 1.13, respectively. In Fig. 10(a) at an FTF Mach number of 0.85. some unsteadiness is indicated in the second column of tufts (x/c = 0.30). Thc unsteadiness is probably the result of the upstream normal shock wave noted earlier from pressurc distribution and boundary layer thickness data. Otherwise, the tufts amear stable and aliened strairht back. In Fir. ai -an FTF Mach numb& of 1.13:'the tufts appear stable and aligned straight back. The straight-back nppear- ance of the tufls in Figs. IO(a) and 10(b) nre indicative of quasi-two-dimensional flow and agree with the previously noted negligible variation of spanwise pressure in Fig. 8.
F-lO4/FTF Capabilities
Envelope
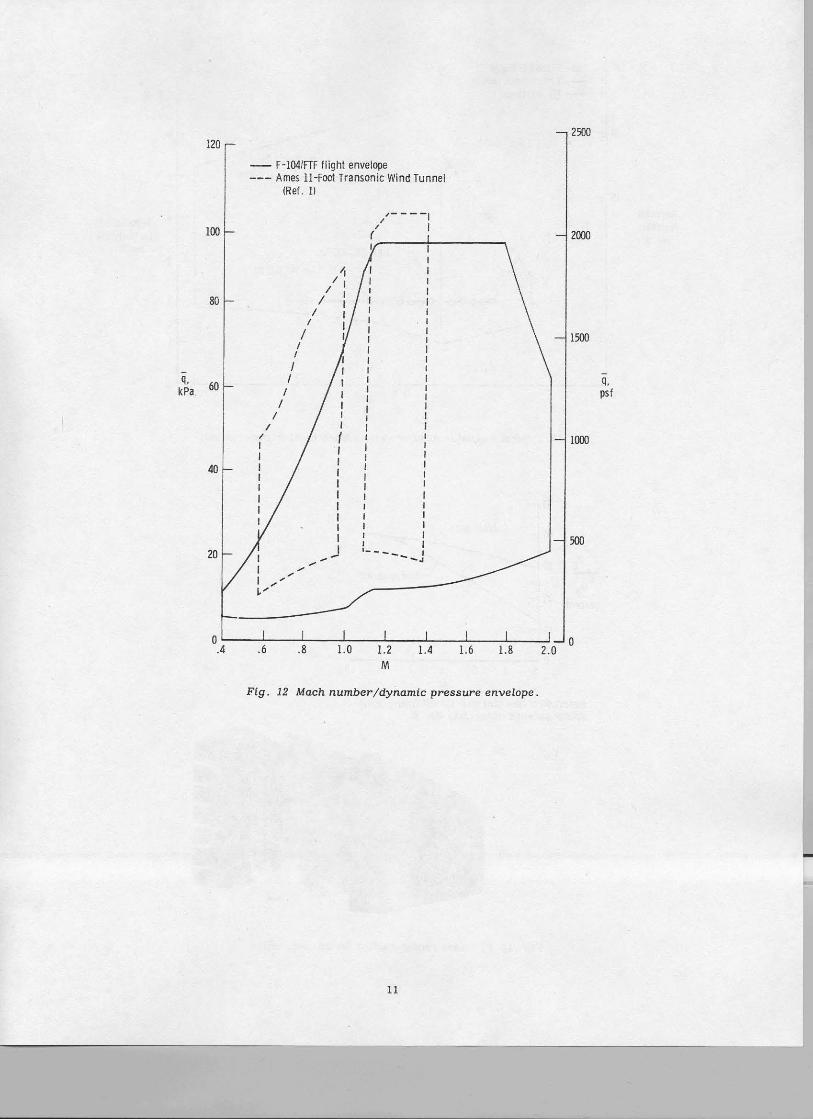
The F-lO4tFTF facility has some unique opera- tional envelooe caoabilities with resoect to wind tunnels. ~ h i s e capabilities includea larger Mach number, Reynolds number, and dynamic pressure envelope than most wind tunnels, and the capability for testing large or full-scale test articles. Addi- tionally, data can be obtained on the FTF near and through a Mach number of 1.0 with little or no adverse effects. For comDarison. Fies . 11 and 12 resent . " - ~ -- - - ~ ~
Reynolds number and dynamic pressure versus Mach number envelopes for the F-104/FTF and the NASA
Ames ll-Foot Transonic Wind Tunnel. ( l ) The Ames Il-foot wind tunnel is used for comparison because it has one of the largest envelopes of any transonic wind tunnel.
Figure I l (a) presents unit Reynolds number enve- lopes for the F-104/FTF and the Ames ll-foot wind tunnel. The wind tunnel has unit Reynolds number advantages over the FTF; however, the F-104/FTF has a much larger Mach envelope than the wind tunnel (M = 0.4 to 2.0 for the F-lO4lFTF compared to M = 0.5 to 1.4 for the Ames ll-Foot Transonic Wind Tunnel).

At least two separate wind tunnel facilities would be reouired to soan the Mach number envelooe of the F - ~ O ~ I F T T . The Mach number gap in the '~mes ll-foot wrnd runnel cnvelope represents the area near a Mach number of i .0 , whcrc i t is normally difficult to obtain reliable data in a wind tunnel.
Figure l l@) compares Reynolds number envelopes for the two facilities. based on representative test specimen chord lengths. These chord lengths might be reoresentative of airfoil tests. for examole. The wind tunnel envelope is based on a test specimen chord of 0.61 m (2 f t ) , which was felt to be representative of a test article that could be tested throuphout the Mach number range presented (M = 0.5 to 1 .%), and the FTF envelooe is baaed on the 2.0-m (60-in . ) chord of the FTF. :or this example, the F - 1 0 4 / ~ ~ ~ ' s h o w s signifi- cantly more Reynolds number capability than the wind tunnel. For example, at a Mach number of 0.8, the F-104lFTF is caoable of a Revnolds number of 40 miilion , whic'h is represeritative of a large transport aircraft. This example points out the potential capa- bility of the F-104lFTF to greatly exceed the capability of wind tunnels when large chord Reynolds numbers are desired.
Figure 12 presents the dynamic pressure Cq) versus Mach number envelope for the F-104lFTF and the Ames ll-Foot Transonic Wind Tunnel. The fieure " indicates a slightly higher maximum dynamic pressure capability in the wind tunnel, but for a much smaller ranee of Mach number. However. laree or full-scale test&Uclcs may cause blockage of thewind tunnel circuit and lower the dynamic pressure capability by as much as half thc values indicated. Blockaec con- straints do not, of course, limit the dynamic pressure envelope of the F-104lFTF.
Flight Guidance and Trajectories
The F-104lFTF facility is equipped with a special cockpit display (Fig. 6), which is part of an inte- grated system that provides the pilot with flight
trajectory guidance. (6) T h i ~ system results in signi- ficant imprwement in the accuracy and speed with which ~ i l o t s annroach and maintain desired flizht test . . - conditions or trajectories. The result is thar some unique trajectorres are routinely flown, includrng constant Reynolds number profiles for fluld mechanics experiments (such as skin friction), dynamic pressure versus Mach number orofiles for airload tests. and constant Mach numbe;, altitude, and angle-of-attack turns for performance tests.
Fieure 13 Dresents an examole of the type of t rajectkes anb the accuracy with which they can be flown. The two horizontal lines represent constant
6 6 Reynolds numbers of 6.6 X 10 per m (2.0 X 10 per ft) 6 6 and 16.4 X 10 per m (5.0 X 10 per ft) . Plotted along
with these lines are flight data obtained using uplink for trajectory guidance to fly these desired values of unit Reynolds number. Another possible trajectory is shown bv the vertical line. which represents a constant Mach number trajectory while varying Reynolds number.
The uplink is also used, as was mentioned earlier, to maintain a zero sideslip condition on the FTF during fluid mechanics experiments.
Typical Experiments
This section presents typical experiments which have been conducted or are proposed to be conducted on the FTF. Experiments that are enhanced by the unique capabilities of the F-104lFTF are noted.
Base Drag
The blunt base of the FTF (8 percent of the chord) has been used to conduct experiments for the reduc- tion of base drag at subsonic and transonic speeds. The fin-like blunt base confieuration of the FTF is - -
considered to be representadve of present and future blunt-based fuselages and blunt trailing-edged stabilizing surfaces of reentrv or h v ~ e r s o n i ~ vehicles. ~ e f e r e n c e l describes and dihcusseYan earlv use of , - - ~ -
thc FTF for determining, in flight, the effc&vencss of splitter plates in reducing base drag at subsonic speeds and high chord Revnolds numbers. Fieure 14 shows rear views of the dismounted FTF with the blunt base, splitter plate. and vented cavity config- urations, and data from Ref. 8 , which documents an experiment conducted more recently than that in Ref. I .
Reference I notes that the increment in base pressure coefficient for the splitter plate is very similar to the increments obtained on a two- dimensional wind tunnel model. even though the flight results represented higher Reynolds numbers and contained three-dimensional effects (an outboard end). Other base pressure data obtained from the FTF are reported in Ref. 9.
The FTF provides a capability to conduct experi- ments on a full-scale, blunt base, fin-like configura- tion at Mach numbers from 0.4 to 2.0 and at high Reynolds numbers. Additionally, the capability to conduct representative base drag reduction experi- ments has been demonstrated.
Instrument Evaluation
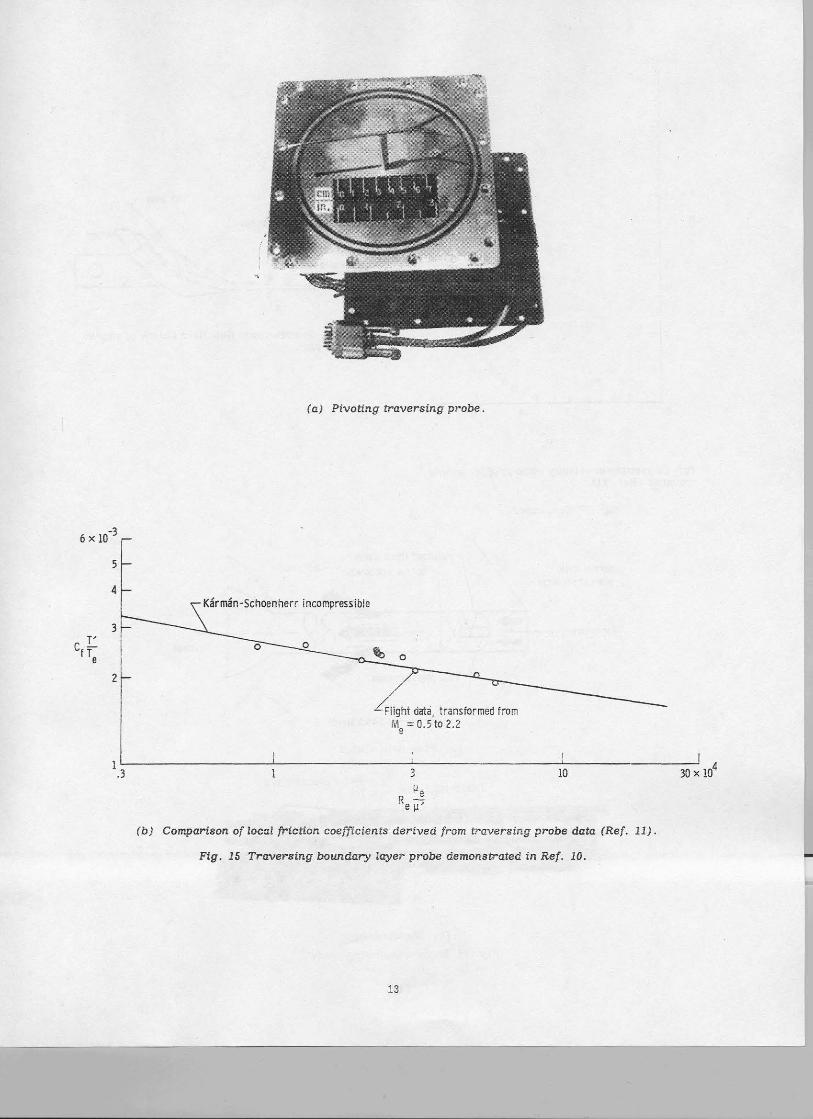
The independent instrumentation system and well documented now field of the FTF make it a useful test bed for flight instrumentation evaluation and develop- ment. Both traversing and pivoting traversing boundam laver orobes have thus far been evaluated. - - . and Several airspeed probes are proposed for evaluation usmg the FTF.
The pivoting traversing boundary layer probe evaluation is discussed in Ref. 10. The device, shown in Fig. 15(a), was mounted on the right side of the FTF about midspan at the 60-percent chord. The pivoting probe was a derivative of the screw-driven iraversing probes reported in Ref. 11, except that the pitot element was allowed to pivot into the local airstream as well as traverse the boundary layer. The unit successfully measured simultaneously flow angularity, probe height, and pitot pressure through the boundary layer. Figures 15@) and 15(c) show
typical results obtained with the traversing probe. (11)
References 12 and 13 describe unique air data probes, primarily intended for use at supersonic speeds. One is referred to as a share-plow probe (Fig. 16) and the other as a shock-swallowing probe (Fig. 17). The intent of both probes is to measure

true total pressure at supersonic speeds, p , rather tl
than the usual total pressure behind the shock, p t2 ' -
It has been proposed that the existing pitot-static probe on the FTF be replaced by these unique air data probes. This would provide a unique capability to conduct an in-flight operational evaluation of these probes at both supersonic and subsonic speeds with- out interfering with the aircraft (pilot's) system. It would also provide an in-flight calibration for com- parison to existing wind tunnel data.
Shuttle Tile Airload Tests
To contribute to the certification of the structural integrity of the space shuttle orbiter's thermal protection system before the first shuffle flight (April 1981), in-flight and wind tunnel aerodynamic load tests of several simulated local areas of the orbiter surface were conducted. Flight tests of six areas are described in Ref. 5. One simulated area, the elevon cove (Fig. l a ) , was tested on the FTF. The FTF was used for this test because of (1) the capability to expose actual full-scale shuttle tiles to r eas t i c airloads. (2) the large Mach numberldynilmic pressure envelope of the carrier aircraft, (3) the ability to obtain data near and through a Mach number of 1.0, and (4) the ability to respond quickly to the requirements of the test.
The launch profiles shown in Fig. 19 were flown for this test article. The maximum airload on the orbiter elevon cove area was predicted to occur at a Mach number of 1.1.
Figure 20 presents pressure coefficient data along the longidudinal axis of the test article (which cor- responds to chordwise on the orbiter) at a Mach number of 1.1. The Feneral trends (slooes) of the F-104 flight data agree well with the orbite; design data; however, the levels are displaced. The slope
was considered the important parameter to
match on this test article to correctly simulate airloads and the match of these slopes was considered good.
Exposure of the test article to the pressure simu- lations at 1.4 times the design dynamic pressure showed no major deficiencies of the orbiter elevon cove TPS
Several' similar full-scale articles were tested in various wind tunnels. In those tests, the launch profile dynamic pressures shown in Fig. 19 were normallv not achieved. because the lawe size of the ~~
test urticlcs severeiy blocked the wind tunnel circuit. The FTF provide.5 a unique capability to test a "full- scale" test article to the desired combinations of dynamic pressure and Mach number. Additionally, the F-104/FTf provided the capability to test the articles through a complete M versus q profile, rather than testing discrete points as was normally done in the wind tunnel tests.
Skin Friction
The large chord, ability to change forebody con- fimrations (uressure distribution). laree Mach/ ~D .- . . -
Reynolds number envelope, and profile capability (via uplink), such as a constant Reynolds number profile,
make the FTF a unique facility for conducting skin friction experiments. DFRF i s currently developing a laree force balance (Fie. 21) to be installed flush on the sydcs oi the FTF at about 80-pcrccnt chord. This will allow the dir?ct measurement of skin frlction with the force balance and concurrent determinat~on of skin friction from boundary layer measurement using existing rakes.
The proposed skin friction experiments would place excrescencies such as rivet heads, fasteners, and different paint finishes on one side of the FTF while the other side would be maintained as a clean and smwth "control." By f lykg the FTF at O0 side- slip, both the experiment and control sides could be exposed to the same flow environment simultaneously.
Concluding Remarks
During the 1960's, an F-104 aircraft was modified to carry a low aspect ratio fin on the underside of the fuselage for the purpose of conducting panel flutter tests in a flight environment. This test fixture has evolved into a versatile facility for the conduct of aerodynamics and fluid mechanics research.
The aircraftltest fixture combination has demon- strated a capability for a wide variety of aerodynamics and fluid mechanics experiments over a Mach number range extending from 0.4 to 2.0 and a chord Reynolds
6 number of over 40 X 10 . This combination is also characterized by an ability to respond quickly to the requirements of a test and by operational costs which are competitive with or less than comparable mound facilities.
Other characteristics of this facility are as follows:
1. The facility is capable of testing full-scale test articles, which are potentially larger than those that can be tested in wind tunnels.
2 . With the use of uplink, unique trajectories, , such as constant Reynolds number profiles. can be
flown routinely.
3. Reliable data can be obtained through the transonic region, including Mach 1.0.
4 . Small increments in friction drag between two test surfaces can be defined.
5 . Representative base drag reduction experi- ments can be conducted.
6. Pressure distributions can be changed easily with interchangeable noseshapes.
References
lpirrello. C. J.. Hardin. R . D . . Heckart. M. V.. . ~~-~~~ . and Brown, K: R . , ' l ~ n inventory of ~eronauti'cal Ground Research Facilities, Volume I-Wind Tunnels ," NASA CR-1874. 1971
'guinn, Robert D. , and Gong, Leslie, %-Flight Boundary-Layer Measurements on a Hollow Cylinder at a Mach Number of 3.0,'' NASA TP-1764, 1980.
3~tallines. Robert L.. J r . . and Lamb. Milton. " ~ m d - ~ u n n ; Measurements and Comparison Wlth Fhght of thc Boundary Lnycr irnd Iiea: Transfer on a Hollow Cylinder at Mach 3 . " IASA TP-1789. 1980
*~ougherty, N . S . , J r . , and Fisher, D. F . , "Boundarv-Laver Transition on a 10-Dee Cone: Wind ~unnell~iightkorrelation ," AIAA paper-80-0154, Jan. 1980.
' ~ e y e r , Robert R. , Jr.. Jarvis, Calvin R. , and Barneburg , Jack, "In-Flight Aerodynamic Load Testing of the Shuttle Thermal Protection System ," AIAA Paper 81-2468, Nov. 1981.
'Swam, M . R., Duke. E. L.. Enevoldson, E. K . . and Wolf, T. D. , "Experience with Flight Test Trajectory Guidance ," AIAA Paper 81-2504, Nov. 1981.
7~altzman , Edwin J . , and Hintz, John, "Flight Evaluation of Splitter-Plate Effectiveness in Reducing Base Drag at Mach Numbers From 0.65 to 0.90 ," NASA TM X-1376, 1967.
'Pyle , Jon S., and Salteman, Edwin J . , "Review of Drag Measurements From Flight Tests of Manned Aircraft With Comparisons to Wind-Tunnel Predic- tions ," AGARD Specialists' Meeting of Fluid Dynamics Panel, lzmir, Turkey, Apr. 10-13, 1973.
TABLE 1. -FTF ORIFICE LOCATIONS (P . left side; r , right side: b , base)
(a) Basic FTF, wedge forebody
$Saltzman, Edwin J . , and Bellman, Donald R "A Comparison of Some Aerodynamic Drag Factors Determined in Full-Scale Flight With Wind-Tunnel Theoretical Results ," AGARD Specialists' Meeting Facilities and Techniques for Aerodynamic Testing Transonic Speeds and High Reynolds Numbers, Gottingen, Germany, Apr. 26-28, 1971.
1°~ontoya, Lawrence C. , Brauns . David A, , . Cissel , Ralph E . , "Flight Experience With a Pivoti Traversing Boundary-Layer Probe ," NASA TM X-56022, Jan. 1974.
ll~altzman, Edwin J . , "In-Flight Use of Travt ing Boundary-Layer Probes ," NASA TN D-6428, l!
12~ouch, Lana M. , "Effects of Geometric Varir on the Performance of a'Probe for Direct Measurem ~f Free-Stream Stagnation Pressure in Supersonic Flow ," NASA TN D-7887. 1975.
131iugent, Jack, Couch, Lana M . , and Webb, Lannie D. , "Exploratory Wind Tunnel Tests of a Shock-Swallowing Air Data Sensor at a Mach Numt of Approldmately 1.83 ," NASA TM X-56030, 1975.
TABLE 1. -Concluded
(b) Symmetrical supercritical, radiused foreboc

TABLE 2. -UOTZDrl !:T LATER RAKE
?F.(?BE :i:;:GE3-
( o ) Wedge forebody, basic FTF.
Fig. 1 Flight test fixture ins!a!ied on iower fuselage of F-104 e a r n e r aircrac".
Fig. 2 Flight test f;xiarr with .wcdp ;^oreboCy ;.shape Dimensions i n ceniirnetsrs :incr.esj.
[b) Radiused forebody, modified wi th forward porfion of symmetrical supercritical airfoil.
Fig. S Cross sections of presently avaiiable FTF 8fore30diea.
o Left side n Right ride 0 Base x Present rake location
I D ~ ~ O 0 0 0 0'0 0% 0 EB 0 I + E 1 j k
(cj Basic FTF, wedge forebody
c ie!! side n Right side x Present rake iocation
( b ) Symmctr~ici.! supercri f ical , radiused forebody.
Fig. 4 Orifice locations for FTF.
Rake ni;mbzr Rake 12
Conical head
. .
' h 5 3 Li%! \
1
Flg. 5 BouiaSorj !ayer rake 'one on each s ide ) .

Wedge forebody- Radiused forebody- A Lei! side o LeS side A Richt side x Base
.8 I
Fig. 6 Cockpit displny for flight h-cjecroiy 0 .2 .4 .6 .8 !.O guidance, uplink. x!c
(ci MFTF = 1.22.
WeNe forebody- Radiused forebody- A Lefi side 0 Le!! side Fig. 7 Concluded. A Righ! side X Base
-.S r +Base
1% - . 4 k 0 0 °
C i a 2 A 4 : g g : : : @: : z z i A Wedge forebody 3 0 Symmetrica! supercritical
-.4 forebody
-.3 .4 ! j
0 0 0 0 0 0
.2 .4 .6 . .8 1.0 Cp -.2 XlC A A A A A
-.! (a) MFTF = 0.51.
0 .5 1.0
Wedge foreboby- Radiused forebody- A Leff side 0 Lefi side A Right side x Base + Base
I A
( 0 ) MFTF = 0.88. avg
A Wedge forebody o Svffmetricai SuDercritical
I C . in -.2 r forebody !
P a
- -'+-/-+ .1
i 14 I
I I i I .2 1 I .4 1
I 0 .5 1.0 -
0 . 7 - .4 .6 .8 i.0 xic y:c
Fig. 7 Typical FTF cordwise pressure 6istribu:ion Fig. 8 Spanwise variation of pressure coefficient at zero sidesiip. for both forebody configurctions at ix/cJ = 0.67.
QVg
6* ' . 2 in.
I
i
Fig. 9 Variation o f boundary layer displacement thickness with FTF Mach number.
(bi MFTF = 1 . 2 3 .
Fig. 1Li Represectottve in-gig&: tuft ?lctterns
9

--- Ames li-~cni rans sonic Wind Tunne! (Ref. 1)
Unit Reynolds number,
per m
( a ) Unit Reynolds number.
Chord Reynolds number
( b ) Chord Reynolds number.
Unit Reynolds number,
per fl
Fig . 1 1 Mach-Reynolds number envelope
- F-~MIFTF flight envelope --- Ames 11-Fwt Transonic Wind Tunnel (Ref. 1)
Fig. 12 Mach nurnber/dynarnic pressure envelope.

Progrannied proiile envelope
Reynolds number,
per m
Fig. 13 Typical Reynolds number versus Mach number trajectories
0 1 1 i I I I I
.3 .4 .5 .6 .7 .8 .9 M
Reduction of base drag on F-lOci test fixture using splitter plate and vented cavity (Rei. 81.
Reynolds number,
per R
Fig. 14 FTF base configurations tested and results
12
( a ) Pivoting traversing probe
4 - Ka'rma'n-Schoenherr incompressible
T' C - f T e
2 -
Flight data, transformed from Ale =0.5 iO 2.2
!
(b) Comparison of local friction coefficients derived from traversing probe data (Ref. 1 1 )
Ffg. 15 Traversing bormdary layer probe demonstrated in Ref. 10.

Fig. 16 Geometry and flow field sketch o f share- plow probe.
(C) Conveniio~.al velocity ratio profile: single fraverse (Ref. 11).
Fig. 2 1 Concluded.
Internal static
Total pressure tube
(a) Plow field ske:ch.
~-Zrii openin? :; of 4:
(bi Photograph.
F i g . 17 Shock-swaliowicg proje
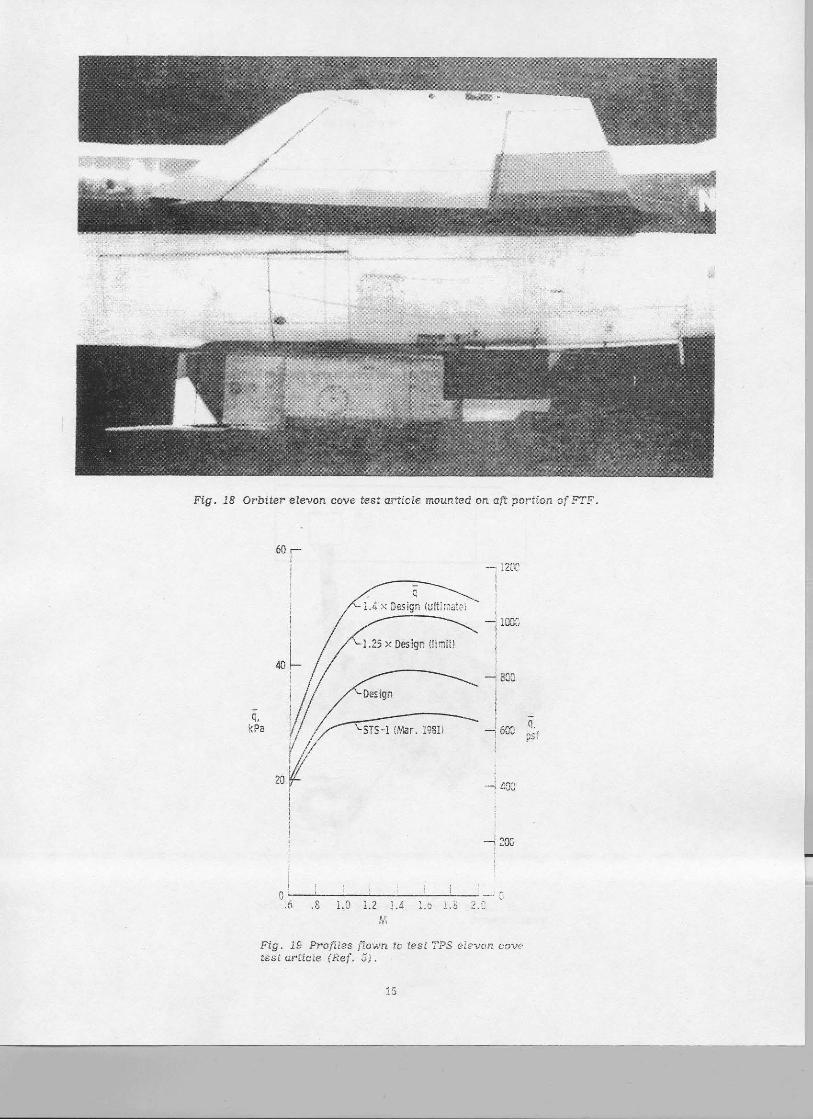
Fig. 18 Orbiter elevori cove tes: a!-tick maunfed on aft ?orrio.n of FTF
Fig. I9 FroA:se )?own ?n Ies: YPS eleven cnvc rfsl urticle { R e f . 5).

FIW Flow 4 - + -.-.
Tile cross sedion
X, in .
-15 -10 -5 a 5 ! ! I I
Fig. 20 Comparison of flight test results and orbiter design data for elevon cove test article. M = I . 1 ; Ref. 5 .
Fig. 21 Large force balance usec foi' skin friction measurements.

*For sale by the National Technical Information Service, Springfield, Virginia 22161
1. Report No.
NASA TM-84900 2. Government Accession No. 3. Recipient's Catalog No.
4. Title and Subtitle
A UNIQUE FLIGHT TEST FACILITY: DESCRIPTION AND RESULTS
7. Authorlrl Robert R . Meyer, J r .
9. Performing Organization Name and Addres
Ames Research Center Dryden Flight Research Facility Edwards, California 93523
12. Sponsoring Agency Name and Address
National Aeronautics and Space Adminstration Washington, D .C. 20546
15. Supplementary Nater
5. RepoR Date
November 1982 6. Performing Organization Code
RTOP 505-31-44
8 . Performing Organization Report No.
10. Work Unit No.
11. Contract or Grant No.
13. Type of Report and Period Covered
Technical Memorandum
14. Sponroring Agency Code
This paper was presented as ICAS Paper 82-5.3.3 at the 13th Congress of the International Council of the Aeronautical Sciences (1CAS)lAIAA Aircraft Systems and Technology Conference at Seattle, Washington, August 22-27, 1982. .
16. Abstract
The Dryden Flight Research Facility has developed a unique research facility for conducting aerodynamic and fluid mechanics experiments in flight. A low aspect ratio fin, referred to as the flight test fixture (FTF), is mounted on the underside of the fuselage of an F-104G aircraft. The F-104GlFTF facility is described, and the capabilities are discussed. The capabilities include (1) a large Mach number envelope (0.4 to 2.0). including the region through Mach 1 .O; (2) the potential ability to test articles larger than those that can be tested in wind tunnels; (3) the large chord Reynolds number envelope (greater than 40 million); and (4) the ability to define small increments in friction drag between two test surfaces. Data are presented from experiments that demonstrate some of the capabilities of the FTF, including the shuttle thermal protection system airload tests, instrument develop- ment, and base drag studies. Proposed skin friction experiments and instrument evaluation studies are also discussed.
17. Key Words (Suggested by Author(r1I
High Reynolds number Skin-friction drag Base drag Boundary layer measurements Pressure distributions
18. Distribution Statement
Unclassified-Unlimited
Star category 09
19. Security Clasif. (of this report1
Unclassified -
20. Security Ctarrif. (of this pagel
Unclassified 21. No. of Pager
17.
22. Price'
A02