nasa technical memorandum 87601
TRANSCRIPT

NASA Technical Memorandum 87601
",
NASA-TM-87601 19860001446
INVESTIGATION OF COMPOSITE MATERIAL PROPERTYREQUIREMENTS FOR SONIC FATIGUE RESEARCH
HOWARD V. L· PATRICK
•'":
•
AUGUST 1985
NI\S/\National Aeronautics andSpace Administration
Langley Research CenterHampton, Virginia 23665
LIC,!(-\[,'l', f~f\,S"!\
I !1\IV\P iON, VmC:\f'lIf\


•
i
SUMMARY
This paper presents experimental techniques for determining the
extensional and bending stiffness characteristics for symmetric laminates.
Vibrational test techniques for determining the dynamic modulus and material
damping are also discussed.
Partial extensional stiffness results initially indicate that the
laminate theory used for predicting stiffness is accurate. It is clearly
shown that the laminate theory can only be as accurate as the physical
characterisitcs describing the lamina, which may vary significantly.
It is recommended that all of the stiffness characteristics in both
extension and bending be experimentally determined to fully verify the
laminate theory. Dynamic modulus should be experimentally evaluated to
determine if static data adequately predicts dynamic behavior. Material
damping should also be ascertained because laminate damping is an order of
magnitude greater than found in common metals and can signficant1y effect the
displacement response of composite panels.
INTRODUCTION
Graphite-epoxy composite materials have become of great interest to the
aeronautics and space industry because of their high strength and stiffness to
weight ratios. Acoustically induced material fatigue is of concern because of
the intense fluctuating pressure fields generated by aircraft and spacecraft
propulsion systems on structures.
Scientists would like to mathematically predict the displacement response
of composite panels to acoustically induced random pressure fields. The panel
strains can be evaluated once the displacement response has been ascertained.
2
Various investigators (1-3)* have developed theories which predict the
deflection response of symmetric laminate plates. Solution of these equations
requires determination of the extensional and bending stiffness matrices which
can be predicted theoretically (4) based upon certain physical characteristics
of the lamina. This laminate theory is based upon the static experimental
material characteristics of a single unidirectional lamina.
Concern exists about the validity of using static material properties in
a dynamic analytic model. The modulus (a measure of stiffness) can be
determined indirectly by mechanically vibrating laminate cantilever beams
(5-8).
The investigation reported herein presents methods for experimentally
verifying the static stiffness matrices for symmetric laminates. A technique
for determining some important dynamic characteristics will also be
addressed. Partial experimental data for the extensional matrix for a
T300/5208 graphite-epoxy angle-ply laminate is also presented. This laminate
plate consisted of nominally I-rom (0.040-in.) thick 8-ply material having a
lay-up of [0°, 45°, -45°, 90 0 ]s, where the subscript s denotes symmetric
lay-up.
This study considered those factors that effect the behavior of composite
materials. It was determined that dynamic behavior is of upmost importance
and includes stiffness, material damping and structural damping
characteristics. Verification of the laminate theory under dynamic as well as
static conditions, thin versus thick plate and small versus large deflection
conditions is required. Major factors controlling material characteristics
include manufacturing and material variability as well as environmental
conditions, especially moisture and temperature.
* refers to reference
•
•

3
Long term goals should include the study of fatigue characteristics with
sinusoidal and random excitation with appropriate frequency distribution.
Another important material characteristic is creep, the slow change of
physical dimensions associated with prolonged exposure to stress and
temperature. Finally, new composite construction (lay-up) and material
compositions should also be investigated.
LIST OF SYMBOLS
base displacement amplitude
base acceleration amplitude
extensional stiffness matrix
A! .1.J
B· .1.J
B! .1.J
E
E*
E'
E' ,
G
h
I
k
L
A~~, inverse stiffness matrix
coupling stiffness matrix
B~~, inverse stiffness matrix
bending stiffness matrix
D~~, inverse stiffness matrix
energy dissipated per cycle
static modulus of elasticity
effective complex modulus
dynamic modulus (storage modulus)
loss modulus
shear modulus
beam thickness
area moment of inertia of beam cross section
lamina layer number
beam length

M
N
r
Us
V
w
x
K
\)
(J
t
<Pr
moment
force
transformed reduced lamina stiffness
mode number
strain energy in beam at maximum displacement
shear force
beam deflection
distance along beam from fixed end
distance along beam from fixed end to center of strain gage
distance from laminate midplane to kth lamina layer
beam shear strain
beam extensional strain
specimen loss factor
curvature
eigenvalue of rth mode
mass per unit length of beam
damping ratio
Poisson's ratio
normal stress
shear stress
characteristic function describing beam-deflection curve
angular resonance frequency of rth mode
4
BACKGROUND
Static Conditions
Classical laminate theory allows prediction of laminate stiffness
characteristics based upon the physical characteristics of unidirectional
lamina where:

B ••1J
5
N
I (Qij)k (zk - zk_1)k=l
N2 2
1/2 I (Qij )k (z - Zk_1 ) [ 1 ]k=l
k
N3 3
1/3 I (Qij )k (zk - zk_1)k=l
•
Aij is called the extensional stiffness, Bij the coupling stiffness, and
Dij the bending stiffness. Knowing the transformed reduced lamina stiffness
Qij (4) and zk, which is the distance from the plate middle surface to the
k-th layer, the stiffness matrices can be calculated. The unidirectional
reinforced plies (lamina) from which the laminates are constructed possess
four engineering elastic constants Ell' the modulus in the direction of the
reinforcing filamant, E22, the modulus transverse to the filamant direction,
G12, the longitudinal shear modulus and, v12, Poisson's ratio. When a
laminate is fabricated with materially orthotropic lamina, the stiffness
reduces to a 3 by 3 symmetric matrix.
The assumption used in the derivation of the laminate theory are similar
to those used in the standard hypothesis for plates and shells. This approach
could actually be called the classical thin lamination or plate theory.
The basic stress and deformation hypothesis is based upon the assumption
that the laminate consists of perfectly bonded laminae, bonds are assumed to
infinitesimally thin as well as non-shear-deformable. That is, the
displacement are continuous across lamina boundaries so that no lamina can
slip relative to one another. The laminate acts, therefore, as a single layer
with very special properties, but nevertheless acts as a single layer of
material (4).

6
If the laminate is thin, a line originally straight and perpendicular to
the middle surface of the laminate is assumed to remain straight and
perpendicular to the middle surface when the laminate is extended and bent.
This assumption is equivalent to ignoring shear strains perpendicular to the
middle surface, i.e., Yxz = Yyz = O. In addition, the normals are
presumed to have constant length so that the strain perpendicular to the
middle surface is ignored, i.e., £z = 0 (4).
Figure 1 shows a typical stress and strain variations of a laminate of
dissimilar lamina. As previously stated, the strain is assumed to vary
linearly across the plate but Qij can be different for each lamina layer.
Because of this difference in lamina stiffness, the stress variation through
the laminate thickness is not necessarily linear as shown in Figure 1.
o 0The force-moment relationships for a laminate, where Ex' £y' and
oYxy are the normal and shear strains at the middle surface Kx ' Ky ' and
K xy the curvature, is:
Nx
NY
Nxy
Mx
MY
Mxy
All AI2 AI60 Bll BI2 B
I6£ Kx x
A12
A22
A26
0 + B12
B22
B26
£ KY Y
A16
A26
A66
0 B16
B26
B66Yxy K xy
BllB
12B
160
°11 D12 °16[2]£ Kx x
B12
B22 B260
+ °12 °22 °26£ KY Y
B16 B26 B660
°16 °26 °66Yxy

7
where Nx ' Ny, and Nxy are the normal and shear forces per unit width,
Mx and My are the bending moments per unit width in the x and y directions
respectfully, and Mxy is the twisting moment per unit width.
For the symmetric case we are considering, the laminas are geometrically
symmetric around the middle surface as well as materially similar, the
coupling matrix Bij vanishes. Further simplifications can exist if the
laminate is extensionally balanced, Al2 ::: A26 ::: 0, i.e. no shear coupling,
or balanced in bending where Dl6 ::: D26 ::: 0, i.e. no coupling between
bending and twisting.
When performing experiments, the loads are applied and the resulting
deformations are measured. The resultant forces and moments are written in
terms of the middle surface extensional strains and curvatures as:
[ 3]
Because of experimental techniques, the deformations are the dependent
variables and it is advantageous to invert the force-moment equation. For a
symmetric laminate, the coupling matrix B vanishes, and the inversion is
simply 00):
D~l H~} [4 ]
•
Note that this relationship is much more complex if the laminate is not
symmetric. Let us denote A-I ::: A' and n- I ::: D' and in expanding we have:

8
0, , ,
E: All A12
A16x
0, , ,
E: A12
A22
A26Y
to, , ,
A16
A26
A66xy
, , ,K D
llD
12D
16x
, , ,K = D12
D22 D26Y
, , ,K D
16D
26D
66xy
Nx
NY
Nxy
Mx
MY
Mxy
[5 ]
[6 ]
Verification of one set of stiffnesses implies verification of the other set
because the two sets, A and D, and A' and D', are the inverse of one another.
The stiffness matrices can readily be calculated from the inverted form.
Dynamic Conditions
Because lamina material characteristics obtained from static tests are
used to predict the laminate stiffness characteristics, the dynamic stiffness
characteristics should also be addressed. Schultz and Tsai report (6) up to
20% variation of stiffness between dynamic and static measurements for 6 and
8-layer angle-ply glass/epoxy laminates. Other investigators (7) using
two-layer cross-ply E-glass/epoxy laminates, have found very good agreement
between static and dynamic stiffness.
Both of these investigations are based upon mechanically vibrating
cantilever beams at resonance and then calculating the dynamic modulus E',
based upon classical vibration analysis. This modulus is a measure of
stiffness and when compared to values obtained from static tests, gives an
indication if the stiffness is different under dynamic conditions.
..

9
STATIC EXPERIMENTAL TECHNIQUES
Extensional Stiffness in Tension
The extensional matrix coefficients can readily be determined by applying
unaxial forces to the laminate in preferred directions. Let us first consider
the case where, Ny = Nxy 0, then from Equation 5 we have,
o - A' Nex - 11 x'
•
considering are symmetric, there is no coupling between extension and bending,
i.e. Bij = 0, and the strains remain the same across the surface, eO = e,
therefore A1'1 = e IN, A' = e IN and A1'6 = Y IN. We need only apply ax x 12 y x xy x
known uniaxial stress to a specimen, measure the surface strain and determine
the coefficients.
Similarly, we can apply a uniaxial force Ny where Nx = Nxy = °and
measure the surface strain and determine Ai2 = exlNy ' AZ2 = eylNy and
A2'6 = Y IN.xy Y
This extensional data can be determined by a simple tensile test using
standard laboratory techniques (11). Figure 2 shows the specimen size
recommended for composites. A simple tensile testing machine is used for
applying loads and instrumentation for a strain gage rosette is required, in
addition, two specimens are needed to obtain adequate information. These
specimens, as shown in Figure 3, consist of; first sample with its outer
fibers aligned with the longitudinal axis (x-direction); and the second with
its outer fiber 90° to the longitudinal axes. A 45° strain gage rosette
should be placed on one of the surfaces near the middle of the test specimen.
The shear strain can be obtained from the relationship

10
with the rosette layout shown in Figure 4. From these two test specimens
we then can determine Ail' AZ2 ' Ai2' Ai6' and AZ6 as described above.
A minimum of three specimens each, of the 0°, and 90° orientations,
should be tested. More reliable data could also be obtained by having strain
gage rosettes on both surfaces and base the strain values on the average of
the two gages. This procedure should result in statistically significant
data.
Extensional Stiffness in Shear
The stiffness coefficient A66
is obtained by placing a laminate specimen
in pure shear. For this case Nx = Ny = 0 and from Equation 5 we have
Y IN • We can also verify the shear coupling coefficients wherexy xy
A1'6 = £ IN andx xy
the tension tests.
A2'6 = £ IN . both of which can also be determined duringy xy'
There exists no standard shear tests for composite laminates. Spiegel
(12) and Herakovich (13) discuss the advantages and disadvantages of various
types of shear tests. The technique that is probably the most valid is the
picture-frame shear test (14). Validity is based upon the specimen being in
pure shear and void of extraneous normal forces or moments associated with the
technique, stress concentrations or fixture characteristics. The major
disadvantage of the picture-frame shear test is the large size of the test
specimen which is typically on the order of 44.5-cm (17.5-in.) square (14).
A shear test technique that is considered reasonably accurate and also
uses a small test specimen is the double V-notch shear test which is commonly
called the Iosipescu Shear Test (15). A slight variation of this test
technique is called the asymmetrical Four-Point Bend (AFPB) test (16). It has

11
been shown theoretically (12, 16) and experimentally (12) that the Iosipescu
Shear Test is accurate when used with composite laminates, The AFPB Shear
Test is probably the most accurate of the two methods. The Isoipescu Shear
Test is comprised of a simple compression test fixture shown schematically in
Figure 5.
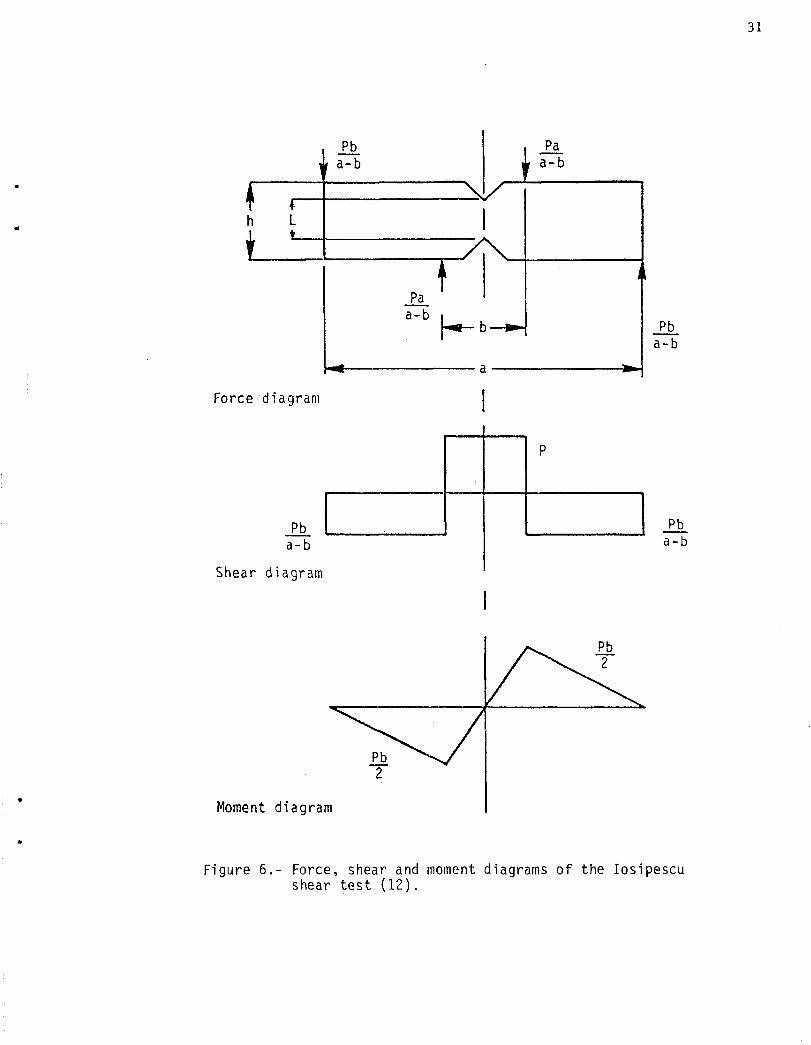
Inspection of Figure 6 shows that at the double V-notch, the beam is in '
pure shear with no moment. The magnitude of the shear stress in the constant
shear stress region is governed by external equilibruim requirements of the
specimen and is seen to be just the applied load P. Iosipescu (15) showed
that, because of the 90° V-notch in the test specimen, constant shear exists
all of the way across the beam between the notches. To experimentally
determine the shear stress we measure the normal strain at a 45° angle at the
middle of the test specimen between the V-notches as related by the sketch of
Mohr's circle in Figure 7. A small strain gage should be used because of the
relatively small region of pure shear. Because the specimen is so narrow, the
strain should be measured on both sides of the test specimen and the average
value used on the applicable strain Yxy. From Equation 5, we have
A' - Y IN66 - xy xy·
We could verify the shear coupling coefficients by measuring the strain
using a strain gage rosette in the test region. Again from Equation 5, we
would have A1'6 = £ IN and AZ'6 = £ IN • This particular measurementx xy y xy
would probably be inaccurate because of the small size of the test section
between the notches.
Bending Stiffness for Bending Moments
Examination of Equation 6 shows that we can determine the bending
stiffness coefficients by applying pure bending moments to the test specimen.

12
For example, let My = Mxy = 0, we could then determine D11 = Kx/Mx '
and D'16 = K 1M.xy x Similarly, we could take the case for
= K 1M , andy y
Let us examine what we mean by curvature, K. Shown in Figure 8 is a
plate in the xy plane where Wo is the midplane deflection in the z-direction
owoand 8 = -ax. It can be readily shown (4) that the curvatures are;
02WO
-2 axoy. This curvature can be measured directly, or
the deflection can be measured and then the curvature can be determined from
the above relationships.
Optical holographic techniques can be used for determining the components
of curvature by measuring the interference fringes (17-19). These
measurements are valid for plates in anticlastic bending which is only
applicable for laminates that do not have coupling between the pure bending
moments, Mx and My, and the twisting moment Mxy ' i.e., Di6 = D26 = o. In
other words, holographic techniques can only be used if the bending matrix,
Dij' is balanced such as in cross-ply laminates. Major disadvantages of
using holographic interferometry include the large instrumentation costs,
difficulty and cost of measuring, interpreting the interference fringe
patterns, and the difficulty of putting thin laminates 1-3 rom (0.04-0.12 in.)
in appropriate bending under known conditions.
various investigators (5-8) have used a technique for determining bending
stiffness characteristics by using a simply loaded cantilever beam and
measuring the strain near the support. A rectangular shaped beam has a

13
parabolic shear stress distribution in the x-z plane with a maximum value at
the midplane but zero at the surfaces. We can, therefore, measure the strain
at the surface due to the effects of curvature without being concerned with
shear forces in the x-z plane,
o~ecause we have no normal stress at the midplane during bending, € vanishes
or
and we have
where !I.
x, y, xy, and u = upper surface
lower surface.
h~i
and [7]
•
Experiments should be performed using two sets of cantilever beams, one
with the beam axis with the outer fibers aligned with the beam axis and the
other with the outer fiber aligned 90° (perpendicular) with the beam axis or
shown in Figure 9. Strain gages should be mounted on both surfaces of the
cantilever beam near the support where the magnitude of the moment is large.
From these strain gages, we can determine ex' €y, and Yxy; with the
upper side in tension and the lower one in compression. Note that the
magnitude of the moment at the center of each strain gage is different because
of slightly different geometrically locations relative to the end of the beam,
as can be seen from Figure 4.
Because· of the small loads required to bend the beam in the range of
curvature desired, much care must be used in the experimental procedure, as
well as the size of the beam. A reasonable beam size would be in the order of
1 in. wide by 6-in. long. The concentrated load should actually be a
distributed load along a transverse line at the end of the beam as shown in
Figure 10.

14
Let us examine the case for the simply loaded cantilever beam with
Mxy 0; from Equation hand from Equation 6:My = = 7: zt<x = £
X
2£ 2£
Di1Mx therefore, Di1x similarly we have Di2
y andK = = 'hM""; = hMx x x
For the beam with the orthogonal outer fiber direction where, Mx =
Mxy = 0, we would have from Equations 6 and 7, and
2yxy
D26 =~. Care should be taken with the sign of the coefficient becausey
of the direction of the curvature; basing the strain magnitude upon the
average of the upper end lower surface strain gages, while taking into
consideration, one is in tension and the other in compression.
Bending Stiffness for Twisting Moments
The last bending stiffness coefficient is associated with the twisting
moment·Mxy • The saddle test or four point loading of a plate can be used to
determine D66 as well as the shear modulus. G. This technique has been
successfully used for laminate plates (6, 20). The saddle test is
accomplished by placing four equal forces at the corners of a square plate as
shown in Figure 11. The forces are perpendicular to the plate with those
forces at the first and third (diagonal) corners being upward and the other
two forces downward. The corner loads create a twisting moment resulting in
the square plate assuming a hyperbolic paraboloid, or a saddle shape. The
matrix coefficent, D66' is calculated using the relationship (4, page 181)

•
15
where the P is the applied load at the corners, L is the diagonal
(corner-to-corner) distance of the plate and we the deflection at the
corners with respect to the center of the plate. The shear modulus can also
be calculated using the relationships (20)
G
where h is plate thickness.
Extreme care must be used in performing the saddle test because of the
very small forces, less than one Newton, required when testing 1-2 rom
(0.04-0.08 in.) thick plates. Alignment becomes critical and instrumentation
used for measuring the corner deflection, we should not impose forces on the
plate.
ENVIRONMENTAL CONSIDERATIONS
The effects of environmental conditions on static and dynamic properties
is of utmost importance. High temperature and diffusion of moisture into
resin materials are of major concern. It has been reported (21) that a hot
moist environment alters the stiffness and damping characteristics of graphite
epoxy composites. Some investigators (22) performing static flexural tests of
graphite/epoxy beams, concluded that moisture and temperature can actually
change the mode of failure.
Another parameter that affects material characteristics of composite
materials is the time parameter. Resin/fiber composites have stiffness and
strength properties which are a function of time or have viscoelastic
characteristics (23).

16
Because of these factors it is very important to perform the experiments
under documented and similar conditions of humidity and temperature. It is
recommended that all tests be performed as close to Standard Laboratory
Atmosphere (SLA) conditions as possible. The SLA is air at 23 ± 2 °C and 50 ±
5% relative humidity.
DYNAMIC EXPERIMENTAL TECHNIQUES
Stiffness
As mentioned before, dynamic tests can be used to determine the dynamic
modulus of elasticity, E', which is a measure of stiffness. In other words,
we cannot determine the stiffness matrices under dynamic conditions. We can
determine Ell and E22' the modulus in the principal and orthogonal axis as
well as material damping characteristics~
The forced vibration response technique is the most widely used method
for characterizing the dynamic behavior of composites (24). Both stiffness
and damping can be determined. The stiffness is found from the forced
resonant frequency of a cantilever beam and damping from knowledge of the
classical analytical relationships for flexural vibration of a beam.
Let us denote the dynamic modulus, sometimes referred to as the storage
modulus, as E' which can be determined from the relationship (7):
[E~IJl/2 [8]
where the eigenvalues, ArL, have been tabulated by Bishop and Johnson (25),
~ is the mass per unit length, wr is the beam resonant circular frequency of
mode r, I is the 2nd moment of area of the beam and L is the beam length.
The technique involves using a center-driven double-cantilever beam
specimen. A sketch of this type of test specimen is shown in Figure 12.

•
•
17
Flexural vibrations of the one-piece specimen are induced by vertical motions
of the shaker table which is mounted at the middle of the specimen. Vibration
frequency and amplitude are controlled by adjusting the electrical current to
the shaker coil. Specimen resonant frequency is determined by driving the
beam at various resonant modes.
Strain gages would be mounted on the surface of the beam and an
accelerometer mounted on the shaker. Resonant frequencies are then determined
by varying the shaker frequency and observing the strain-acceleration
Lissajous patterns on an oscilloscope as shown in Figure 13. This Lissajous
pattern is produced by plotting the strain signal against the base
acceleration signal. Beam resonant frequency is located by maximizing the
ratio of strain amplitude to input acceleration amplitude.
The double-beam cantilever test specimen must be balanced to minimize
frictional losses. By using the signals from strain gages mounted on both
beams located equal distance from the base t the test apparatus can be
balanced. The two strain gage signals from opposing beams are exactly in
phase when the Lissajous pattern is 45-deg. line. Small weights can be
attached to the end of the beams to balance the specimen. If the two beams
are not in phase t the Lissajous pattern forms an ellipse. Having obtained the
resonant frequency wrt the dynamic modulus E' is obtained by manipulating
Equation 8. A reasonably sized test specimen would be 2.5-cm (I-in.) width
and 30.5-cm (12-in.) double length (2-L).
Damping
Let us define an effective complex modulus t E*t with the relationship
E* = E' + iE" [9]
where E" is called the loss modulus (imaginary). The specimen loss factor,
nSt is related to the complex modulus by the equation (26)

E' ,ns = -- = 2\1E'
18
[10]
where \1 is the damping ratio. Specimen damping can be computed by using the
definition of specimen loss factor (26)
where
and
Dsns =--21TUs
D = 1TV as o 0
1L M(x)2
U J dxs ="2 ,0 E I
[ll ]
[12]
[13]
where Ds and Us are the energy dissapated per cycle and strain energy in
the beam at maximum displacement respectfully. The unknown shear force t VOt
and bending moment t M(x)t are found from the characteristic function
describing the mode shapes (25) and the measured strain at a known location on
the beam. The base amp1itude t aOt can be found from the measured base
acceleration and resonant frequency. Gibson (8) showed that the resulting
equation for specimen loss factor iS t
).. 4>'''(0)4>'' (x )ha·r roo22 L ()) dx)r 0
[14]
The loss factor is always positive in this relationship because 4>"(0) for ar
cantilever beam is negative (25). Equation 14 can be used to compute the loss
..factor from measured values of ()) tat £(x )t hand L and tabulated values ofroo
and 4>"'(0) (25).r
The testing technique described is referred to as the resonant-dwell
technique (8) versus the bandwidth technique (5 t 6). The forced vibration
test was selected over the amplitude decay test not only because of the

•
•
19
ability to control both amplitude and frequency of vibration, but also because
damping can be determined at a single frequency and amplitude. During
resonant dwell testing, the specimen is usually driven in its first or 2nd
mode; while the resonant frequency, input acceleration and bending strain are
measured. Damping is determined using equation 14 and dynamic modulus
(storage modulus) is determined using equation 8.
Tests should be performed at small amplitude-to-thickness ratios, w(L)/h,
because of air damping. Gibson (8) performed tests as described using an
aluminum specimen in air and in vacuum, and found that air damping is neglible
when w(L)/h < 0.5.
To ascertain the effectivenss of frequency on stiffness and damping, the
resonant-dwell technique can be used by driving the beam at higher modes.
Usi~g this technique, Schultz and Tsai (5) measured resonant frequencies as
high as 10k Hz. These higher mode tests should be performed in a vacummn
because of air frictional effects, i.e., air damping loss could become
appreciable even at small amplitudes. Air damping would be proportional to
velocity squared because of aerodynamic viscous drag effects.
Gibson (8) shows that thermoelastic loss factors are directly relatd to
frequency, therefore, material heating could create problems. This
investigator also reported excessive specimen loss factors at maximum strain
amplitudes exceedings 10-3 for a [0°/90°] Scotchply specimen. Based upon
this latter information, tests should be performed in the amplitude
i d d . < 10-3 •n epen ent range, 1.e., at €
PARTIAL RESULTS
A few tension tests have been performed on 8-ply T300/5208 (9)
graphite-epoxy angle ply laminates. This laminate consisted of nomially 1-mm

20
(0.04-in.) thick material having a lay-up of [0°, 45°, -45°, 900 ]s. These
tension tests were performed per ASTM standard test D3039-76 [11] as outlined
in this report. The strain was measured along the principal (longitudinal)
and orthogonal (transverse) axis; therefore, no shearing coupling data was
determined, i.e., A16.
The results of these tensile tests are shown in Table I, where
orientation refers to the outer fiber alignment in the direction of applied
tensile load. In other words, two types of tensile test samples were used,
the first set was with the outer fibers aligned with the longitudinal specimen
axis and the second set with the outer fibers orthogonal to the longitudinal
axis.
Based upon a lamina thickness of 0.127-mm (O.005-in.) the laminate theory
predicts Ah == Ail == -5.756 Gm/N for a total laminate thickness of 1.016-mm
(0.040-in.). Inspection of Table I shows that Ail == A22 within 1.2% and
Ai2 == Ail within 0.9%.
The main concern is to determine if the laminate theory is valid. Review
of Table I shows that Ail and Ai2 were with in approximately 3%, also Ai2
and AZl were within approximately 4% when comparing laminate theory with
experimental results~ One could readily conclude that the laminate theory is
accurate, at least for the limited extensional case considered.
Remembering that the laminate theory uses experiment results based on
lamina experimental data, let us investigate lamina data for the T300/S208
composition. Lamina properties from various references are shown in Table
II. Inspection of this table shows variation between the reported lamina

•
21
material characteristics of 35% for Ell' 7% for E22' 30% for G12' and
36% for v1Z. The comparison made in Table I was based upon O'Brien's (27)
data because of the known similarity of composition and curing process.
One reasonable conclusion that can be made at this point in the
experimental process is that the laminate theory is only as accurate as the
lamina data. This conclusion is in turn only valid if we assume that the
laminate experimental data being reported is composed of the lamina reported
by O'Brien. In the future, it is highly recommended that lamina material
characteristics Ell, E22' G12 and v12 be experimentally verified for
each "batch" of laminate plates that is fabricated. This lamina data
gathering should only be terminated when sufficient statistical information is
collected which provides confidence in the repeatability of the lamina
material fabrication process.
CONCLUSIONS AND RECOMMENDATIONS
1. Both dynamic and static material property measurements should be
performed. Both laminate and single-ply tests are required. Variability
of these properties will be dependent upon the actual materials used in
fabricating the laminate (fibers and resin), the details of the
manufacturing process, environmental conditions (temperature and moisture)
and the actual test methods.
2. It is imperative that the laminate theory be verified under dynamic
conditions. These studies should consider the frequency distribution of
the excitation. This investigation should also involve short wave lengths
and large amplitudes •

22
3. Very few standard test techniques are available for determining material
properties of laminates. Many test techniques have been proposed but have
not been accepted by the composite material testing community. The only
standard test that is being used is for tensile testing of laminate
specimens. There exist no tests for determining the dynamic stiffness
matrix elements in extension, coupling or bending.
4. Short term goals include determining the dynamic stiffness and material
damping characteristics of the laminates presently being investigated.
The extensional and bending stiffness elements under static conditions
should also be completed.
ACKNOWLEDGEMENTS
I thank Dr. Gene Goglia, Director of the NASA/ASEE Summer Faculty
Fellowships Program, for giving me the opportunity to perform research at the
NASA Langley Research Center. Great appreciation is extended to
Dr. John S. Mixson for his guidance and support during the summer program. I
also appreciated the help extended to me by Karen E. Heitman, Dr. C. Mei,
C. Prasad, and Carl E. Rucker.
It should"be noted that the study being reported is based upon a ten week
period and was sponsored by the NASA/ASEE Summer Faculty Fellowship Program.
The author had access to NASA Langley Research Center tec~nical personnel as
well as the Technical Library and reviewed approximately thirty reports.
REFERENCES
1. Mei, C. and Wentz, K. R., "Large-Amplitude Random Response of Angle-Ply
Laminated Composites Plates," AIAA J., VoL 20, No. 10, 1981, pp.
1450-1458.

23
2. Wentz, K. R., Paul, D. B., and Mei, C., "Large Deflection Random Response
of Symmetric Laminated Composite Plates," Shock and Vibration Bullentin,
Bulletin 52, Part 5, May 1982.
3. Mei, C., "Large Deflectin Multimode Response of Clamped Rectangular
Panels to Acoustic Excitation," Vol. I, AFWAL-TR-83-3121, Dec. 1983.
4. Jones, R. M., "Mechanics of Composite Materials," McGraw Hill, 1975.
5. Schultz, A. B., and Tsai, S. W., "Dynamic Moduli and Damping Ratios in
Fiber-Reinforced Composites," J. Composite Materials, Vol. 2, No.3, July
1968, pp. 368-379.
6. Schultz, A. B., and Tsai, S. W., "Measurements of Complex Dynamic Moduli
for Laminated Fiber-Reinforced Composites," J. Composite Materials, Vol.
3, July 1969, pp. 434-443.
7. Gibson, R. F., and Plunkett, R., "Dynamic Mechanical Behavior of
Fiber-Reinforced Composites: Measurement and Analysis," J. Composite
Materials, Vol. 10, Oct. 1976, pp. 325-341.
8. Gibson, R. F., and Plunkett, R., "A Forced Vibration Technique for
Measurement of Material Damping," Experimental Mechanics, Vol. 17, No.8,
Aug. 1977, pp. 297-302.
9. DOD/NASA Advanced Composites Design Guide, July 1983.
10. Tsai, S. W., "Structural Behavior of Composite Materials," NASA CR-71,
July 1964.
11. "Standard Test Method for Tensile Properties of Fiber-Resin Composites,"
ASTM Designation: D3039-76 (Reapproved 1982).
12. Spiegel, B.S., "An Experimental and Analytical Investigation of the
Iosipescu Shear Test for Composite Materials," M.Sc. Thesis, Engr. Mech.,
Old Dominion University, Aug. 1984.
24
13. Herakovich, C. T., Bergner, H. W., and Bowles, D. E., "A Comparative
Study of Composite Shear Specimen Using the Finite Element Method," ASTM
STP 734, C. C. Chamis, Editor, ASTM PCN 04-734000-33, 1979, pp. 129-151.
14. Rouse, M., "Postbuckling of Flat Unstiffened Graphite-Epoxy Plates Loaded
in Shear," AIAA Paper No. 85-0771-CP, 1985.
15. Iosipescu, N. , "New Accurate Procedure for Single Shear Testing for
Metals," J. Materials, Vol. 2, No. 3, Sept, 1967, pp. 537-566.
16. Slepetz, J. M., Zageski, T. F., and Novello, R. , "In-Plane Shear Test for
Composite Materials," AMMRC TR 78-30, July 1978.
17. Snell, M. B., and Marchant, M. J. , "Determination of the Flexural
Stiffness of Carbon Composite Plates by Holographic Interferometry," J.
Strain Analysis, Vol. 19, No.4, 1984 pp. 249-259.
18. Marchant, M. J., and Snell, M. J., "Determination of the Flexural
Stiffness of Thin Plates from Small Deflection Measurements Using Optical
Holography," J. Strain Analysis, Vol. 17, No.1, 1982, pp. 53-61.
19. Colles, M. J. and Swift, D. W., "Measurement of Curvature and Bending
Stiffness of Thin Carbon Composite Plates Using Holographic
Interferometry," SPIE (The International Society for Optical
Engineering), Vol. 369 Max Born, 1982, pp. 502-509.
20. Hernessey, J. M., Whitney, J. M., and Riley, M. B., "Experimental Methods
of Determining Shear Modulus of Fiber Reinforced Composite Material,"
AFML-TR-65-42, Sept. 1965.
21. Maymon, G., Briley, R. P., and Rehfield, L. W., "Influence of Moisture
Absorption/Elevated Temperature of the Dynamic Behavior of Resin Matrix
Composites: Preliminary Results," Advanced Composite
Materials-Environmental Effects, ASTM STP 658, 1978.
•
•
25
22. Whitney, J. M., and Husman, G. E., "Use of the Flexure Test for
Determining Environmental Behavior of Fibrous Composites," Exptl. Mech.
Vol. 18, No.5, May 1978, pp. 185-190.
23. Hiel, C., Cardon, A. H., and Brinson, H. F., "The Nonlinear Viscoelastic
Response of Resin Matrix Composite Laminates," NASA CR 3772, July 1984.
24. Bert, C. W., and Clary, R. R., "Evaluation of Experimental Methods of
Determining Dynamic Stiffness and Damping of Composite Materials,"
Composite Materials: Testing and Design (Third Conference) ASTM STP 546,
1974, pp. 250-265.
25. Bishop, R. E. D., and Johnson, D. C., "The Mechanics of Vibration,"
Cambridge University Press, 1960, p. 382.
26. Lazan, B. J., "Damping of Materials and Members in Structural Mechanics,"
Pergamon Press, Oxford, 1968.
27. O'Brien, T. K., "Mixed-Mode Strain-Energy-Release Rate Effects on Edge
Delamination of Composites," ASTM STP 836, pp. 125-142.
28. Soni, S. R., "A New Look at Commonly Used Failure Theories in Composite
Laminates," AIM CP 831, 24th Structures, Structural Dynamics and
Materials Conference, May 2-4, 1983, Part I, pp. 171-179.
29. Ryder, J. T., S Crossman, F. W., "A Study of Stiffness, Residual Strength
and Fatigue Life Relationships for Composite Laminates," NASA CR-172211,
October, 1983 •

TABLE I
T300/5208 Laminate
8-Ply Experimental Extensional Stiffness Data
26
, , , ,Sample Orien. l' All A22 -A12 -A21 Ell E22 V12
Comment (deg) (mm) (~) (~) (~) (~) (GPa) (GPa) (unitless)N N N N
A-1-T 0 1.054 17.96 --- 5.389 --- 52.18 --- 0.300
A-2-T 0 1.062 18.34 --- 5.629 --- 51.37 --- 0.304
A-3-T 0 1.044 18.43 --- 5.455 --- 51.99 --- 0.298
A-4-T 0 1.034 18.63 --- 5.507 --- 51.93 --- 0.296
A-5-T 0 1.064 18.03 --- 5.282 --- 52.13 --- 0.304
A-6-T 0 1.186 18.49 --- 5.575 --- 45.63 --- 0.305
A-7-T 0 1.036 18.62 --- 5.656 --- 51.82 --- 0.304
B-1-T 90 1.034 --- 18.36 --- 5.511 --- 52.70 0.300
B-2-T 90 1.029 -- 18.45 --- 5.647 --- 52.70 0.306
B-3-T 90 1.039 --- 18.79 --- 5.356 --- 51.24 0.293
B-4-T 90 1.034 --- 17.93 --- 5.511 --- 53.96 0.307
B-5-T 90 1.041 --- 17.39 --- 5.611 --- 52.22 0.323
B-6-T 90 1.034 --- 18.00 --- 5.670 --- 53.73 0.315
mean --- 1.053 18.36 18.15 5.499 5.551 51.01 52.76 0.304
6* --- 0.041 0.27 0.49 0.134 0.117 2.39 1.00 0.008
% Diff. --- 3.7 2.7 3.7 4.5 3.6 8.7 5.6 2.0
,Theoretical Values: All
DOD/NASA design data:
* Standard deviation
, ,= 18.86 em/n, A
12= A
21= 05.756 Gm/n and t =
= E22 = 55.9 GPa and V = 0.31
1.016 nun,

•
TABLE II
T300/5208 Lamina Properties
Ell E22 G12 v12 Reference
(GPa) (GPa) (GPa) ---
147 10.9 6.41 0.38 (9)
134 10.5 5.5 0.30 (27)
181 10.3 7.17 0.28 (28)
163 10.2 6.48 0.39 (29)
27

2n 3 -x
z t---4---l
LAMINATEVARIATION
OF STRAIN
CHARACTERISTIC
MODULI
VARIATION
OF STRESS
28
Ftgure 1. Hypothetical variation of strain and stress through the laminate thickness. (4)
Discontinuous FibersType of Reinforcement
Continuous Fibers
rom in. mm in.
BoronGraphiteGlass
0.50K to 2.540.508 to 2.540.762 to 3.275
0.020100.1000.020100.1000.030 10 0.125
1.016 to 5.081.016 lu 5.081.524 106.55
11.040 to 0.2000.040 10 0.2000.060 to 0.250
r3BmmC1.51n.! Ga~~u::"~~th , • 3RmmCl.5in'1mln.l.mum.. Spe,_"lmen Widt.h I: m.lnlmum SDe~lmen
Wldtr
I .I I
,-_-,'---1-
I 0 0'----'-.I
Spe~·lmen
Th)('kness
Non-Bond laminate tabs on two sides and al holh ends. Tabs arc applied to lhe end of the test composite with a suitahleadhesive. Each tab is a minimum of 38 mm (1.5 in.) long hy the width of the laminate and a thickness of approxImately 1.5 104limes the thickness of the lest composite.
•
figure 2. Tensile Test Specimen (11 )

outer tfiberdirection y x
outer... ~ fi ber
direction
29
Figure 3.- Tensile specimen test arrangement.
•
B
x
..Figure 4.- Strain gage rosette .

p
30
Figure 5.- Schematic of the Iospiescu shear test fixture (12).
LOJ
Pba-b
h,--'----r--'Pa
a-b
31
Paa-b r-- b ..£Q..
a-b
t4IlIr-------a-------~
Force diagram
p
..£Q..a-b
Shear diagram
Pba-b
OJ
PbT
Moment diagram
PbT
Figure 6.- Force, shear and moment diagrams of the Iosipescushear test (12).

32
.., • (f. -(f. I I" Itmax =~z.... = lTl2
Fi~ure 7.- Mohr's ctrcle for bidimensionalpure shear stress state (15).
/I
"I
.IQwo
C ~/3~ Lzcp
DEFORMEDCROSS SECTION
~-==-/ X,U
B
C'-----'0
z
UNDEFORMEDCROS S SECTION
Figure 8.- Geometry of deformation in the x-zpl ane (4).

33
..
a. side view
b. plan view
Figure 9.- Simply loaded cantilever beam.
--!~~ ........... --1
rigged support
•
..
y
z
Figure 10.- Cantilever beam.
Nx
x

34
UNDElOIM'D Pl7- - - -/
p
Figure 11~~ Twisting of a square plate (4).
L -----1
t lOWER CLAMPING BLOCKSHAKER MOTION
CLAMPING
~ SC~EWl SPECIMEN
Fi~ure 12.- Double-cantilever beam specimenconfiguration (8).

...
•
•
Figure 13.- Lissa~ous patterns generated by strain(~ertlcal) and acceleration (horizontal)slgnals (8) .
35

1. Report No.
NASA TM-87601I2. Government Accession No. 3. Recipient's Catalog No.
4. Title and Subtitle
INVESTIGATION OF COMPOSITE MATERIALS PROPERTYREQUIREMENTS FOR SONIC FATIGUE RESEARCH
7, Author(s)
Howard V. L. Patrick*
9. Performing Organization Name and AddressNASA Langley Research CenterHampton, VA 23665-5225
12. Sponsoring Agency Name and Address
National Aeronautics and Space AdministrationWashington, DC 20546
5. Report Date
August 19856. Performing Organization Code
505-33-53-038. Performing Organization Report No.
10. Work Unit No.
11. Contract or Grant No.
14. Sponsoring Agency Code
•
15. Supplementary Notes *Embry-Ridd1e Aeronautical University, Daytona Beach, Florida
The author performed this work while working at Langley under the 1985NASA!ASEE Summer Faculty Fellowship Program.
16. Abstract
This paper presents experimental techniques for determiningbending stiffness characteristics for symmetric laminates.techniques for determining the dynamic modulus and materialdiscussed.
the extensional andVibrational testdamping are also
Partial extensional stiffness results intially indicate that the laminatetheory used for predicting stiffness is accurate. It is clearly shown that thelaminate theory can only be as accurate as the physical characteristicsdescribing the lamina, which may vary significantly.
It is recommended that all of the stiffness characteristics in both extensionand bending be experimentally determined to fully verify the laminate theory.Dynamic modulus should be experimentally evaluated to determine if static dataadequately predicts dynamic behavior. Material damping should also beascertained because laminate damping is an order of magnitude greater thanfound in common metals and can significantly effect the displacement responseof composite panels.
17. Key Words (Suggested by Author(s))
Sonic fatigueMaterial propertiesComposites
18. Distribution Statement
Unclassified - Unlimited
Subject Category - 71
..
19. Security Classif. (of this report)
Unclassified20. Security Classif. (of this page)
Unclassified21. No. of Pages
36
22. Price
A03
N-305 For sale by the National Technical Information Service, Springfield. Virginia 22161

