nasa/tm—2017–219511 autogenic-feedback training exercise
TRANSCRIPT

NASA/TM—2017–219511
Autogenic-Feedback Training Exercise (AFTE) Mitigates the Effects of Spatial Disorientation to Simulated Orion Spacecraft Re-entry: Individual Differences Patricia S. Cowings NASA Ames Research Center William B. Toscano NASA Ames Research Center Millard F. Reschke NASA Johnson Space Center Fiyori Gebreyesus University of California, San Diego Christopher Rocha San Jose State University Foundation
May 2017
ii
NASA STI Program…in Profile
Since its founding, NASA has been dedicated to the advancement of aeronautics and space science. The NASA scientific and technical information (STI) program plays a key part in helping NASA maintain this important role. The NASA STI program operates under the auspices of the Agency Chief Information Officer. It collects, organizes, provides for archiving, and disseminates NASA’s STI. The NASA STI program provides access to the NTRS Registered and its public interface, the NASA Technical Reports Server, thus providing one of the largest collections of aeronautical and space science STI in the world. Results are published in both non-NASA channels and by NASA in the NASA STI Report Series, which includes the following report types:
• TECHNICAL PUBLICATION. Reports of completed research or a major significant phase of research that present the results of NASA programs and include extensive data or theoretical analysis. Includes compilations of significant scientific and technical data and information deemed to be of continuing reference value. NASA counterpart of peer-reviewed formal professional papers but has less stringent limitations on manuscript length and extent of graphic presentations.
• TECHNICAL MEMORANDUM.
Scientific and technical findings that are preliminary or of specialized interest, e.g., quick release reports, working papers, and bibliographies that contain minimal annotation. Does not contain extensive analysis.
• CONTRACTOR REPORT. Scientific
and technical findings by NASA-sponsored contractors and grantees.
• CONFERENCE PUBLICATION. Collected papers from scientific and technical conferences, symposia, seminars, or other meetings sponsored or co-sponsored by NASA.
• SPECIAL PUBLICATION.
Scientific, technical, or historical information from NASA programs, projects, and missions, often concerned with subjects having substantial public interest.
• TECHNICAL TRANSLATION.
English-language translations of foreign scientific and technical material pertinent to NASA’s mission.
Specialized services also include creating custom thesauri, building customized databases, and organizing and publishing research results. For more information about the NASA STI program, see the following: • Access the NASA STI program home
page at http://www.sti.nasa.gov • E-mail your question via the Internet to
[email protected] • Phone the NASA STI Help Desk at
(757) 864-9658 • Write to:
NASA STI Information Desk Mail Stop 148 NASA Langley Research Center Hampton, VA 23681-2199

iii
NASA/TM—2017–219511
Autogenic-Feedback Training Exercise (AFTE) Mitigates the Effects of Spatial Disorientation to Simulated Orion Spacecraft Re-entry: Individual Differences Patricia S. Cowings NASA Ames Research Center William B. Toscano NASA Ames Research Center Millard F. Reschke NASA Johnson Space Center Fiyori Gebreyesus University of California, San Diego Christopher Rocha San Jose State University Foundation National Aeronautics and Space Administration Ames Research Center Moffett Field, California
March 2017

iv
Acknowledgements
1 2 3 4 5 6 7 8 9
We would like to thank the student interns, shown above, who supported this research project. Their names and schools are as follows:
1. Edwin Levin, Hartnell College 2. Arun Kumar, San Jose State University 3. Neika Sharifian, North Carolina State University 4. William Lee, Palo Alto High School (William B. Toscano, NASA Ames Research Center) 5. Anika Khetrapal, Pleasanton High School 6. Fiyori Gebreyesus, University of California, San Diego 7. Mikaela Johnson, Spelman College 8. Michelle Scire, California State University, Fresno 9. Dylan Abrams, University of Southern California
This project was funded by NASA’s Human Research Program (HRP), Human Health Countermeasures (HHC) Element.
Available from:
NASA STI Program STI Support Services, Mail Stop 148
NASA Langley Research Center Hampton, VA 23681-2199
This report is also available in electronic form at http://www.sti.nasa.gov or http://ntrs.nasa.gov/

v
Table of Contents
List of Figures and Tables ............................................................................................ vi 1. Background .............................................................................................................. 1 2. Study Objectives ....................................................................................................... 3 3. Method ...................................................................................................................... 3
3.1 Participants ..................................................................................................... 3 3.2 Physiological Measures ................................................................................. 3 3.3 Standard Rotating Chair Test ......................................................................... 3 3.4 Autogenic Feedback Training Exercise (AFTE) ........................................... 4 3.5 Manual Dexterity and Mental Arithmetic Task ............................................. 6 3.6 Orion Re-entry Tests ..................................................................................... 6 3.7 Symptom Diagnostic Scale ............................................................................ 8 3.8 Seat Egress and Walk Test ............................................................................. 9
4. Results ....................................................................................................................... 10 4.1 Symptom Reports .......................................................................................... 10 4.2 Keypad Entry Task ........................................................................................ 12 4.3 Calculating Individual Stress Profiles ........................................................... 13 4.4 Physiological Data of Individuals during AFTE and Orion Tests ................ 15 4.5 Physiological Data of Groups during Orion Test .......................................... 21
5. Discussion ................................................................................................................ 22 References .................................................................................................................... 24 Appendix A. Standart Rotating Chair Tests of all Participants: Z-scores .................... 26 Appendix B. Training Data of all Treatment Subjects following 2 and 4 hours
of AFTE .................................................................................................. 38 Appendix C. Physiological Data of all Participants during Simulated Orion
Re-entry Tests 1 and 4 ............................................................................ 49
vi
List of Figures and Tables
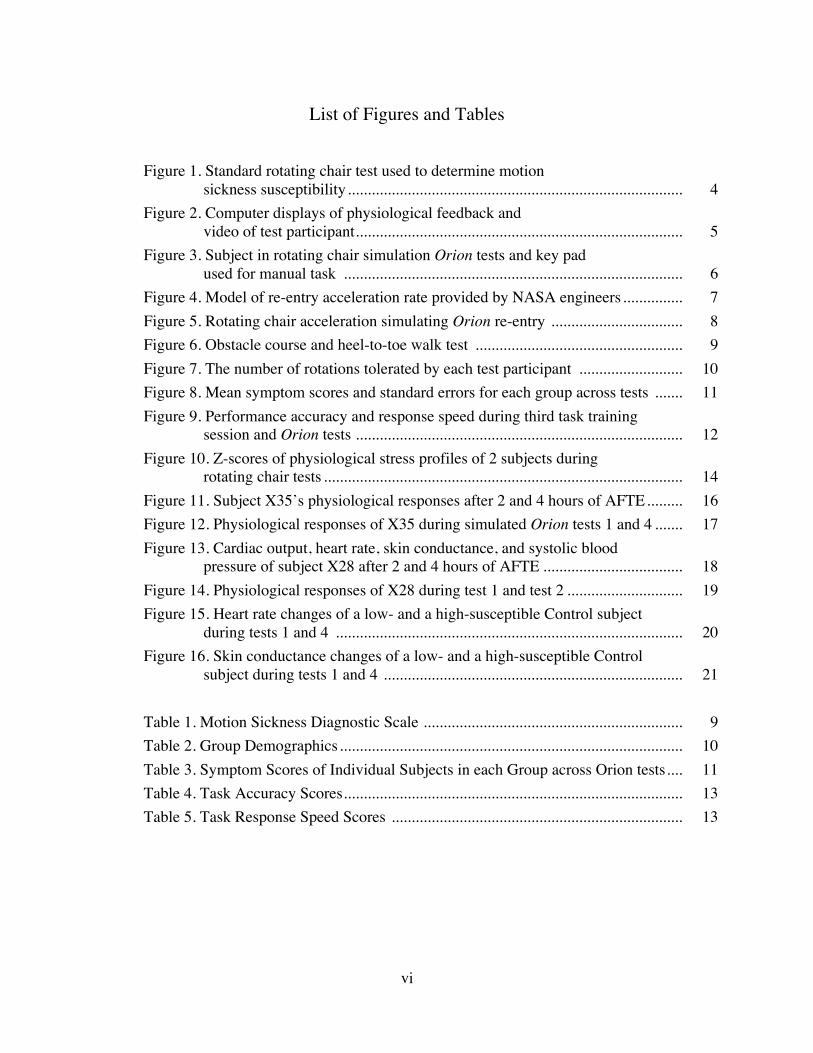
Figure 1. Standard rotating chair test used to determine motion sickness susceptibility .................................................................................... 4
Figure 2. Computer displays of physiological feedback and video of test participant .................................................................................. 5
Figure 3. Subject in rotating chair simulation Orion tests and key pad used for manual task ..................................................................................... 6
Figure 4. Model of re-entry acceleration rate provided by NASA engineers ............... 7 Figure 5. Rotating chair acceleration simulating Orion re-entry ................................. 8 Figure 6. Obstacle course and heel-to-toe walk test .................................................... 9 Figure 7. The number of rotations tolerated by each test participant .......................... 10 Figure 8. Mean symptom scores and standard errors for each group across tests ....... 11 Figure 9. Performance accuracy and response speed during third task training
session and Orion tests .................................................................................. 12 Figure 10. Z-scores of physiological stress profiles of 2 subjects during
rotating chair tests .......................................................................................... 14 Figure 11. Subject X35’s physiological responses after 2 and 4 hours of AFTE ......... 16 Figure 12. Physiological responses of X35 during simulated Orion tests 1 and 4 ....... 17 Figure 13. Cardiac output, heart rate, skin conductance, and systolic blood
pressure of subject X28 after 2 and 4 hours of AFTE ................................... 18 Figure 14. Physiological responses of X28 during test 1 and test 2 ............................. 19 Figure 15. Heart rate changes of a low- and a high-susceptible Control subject
during tests 1 and 4 ....................................................................................... 20 Figure 16. Skin conductance changes of a low- and a high-susceptible Control
subject during tests 1 and 4 ........................................................................... 21 Table 1. Motion Sickness Diagnostic Scale ................................................................. 9 Table 2. Group Demographics ...................................................................................... 10 Table 3. Symptom Scores of Individual Subjects in each Group across Orion tests .... 11 Table 4. Task Accuracy Scores ..................................................................................... 13 Table 5. Task Response Speed Scores ......................................................................... 13

1
Autogenic-Feedback Training Exercise (AFTE) Mitigates the Effects of Spatial Disorientation to
Simulated Orion Spacecraft Re-entry: Individual Differences
Patricia S. Cowings1, William B. Toscano1, Millard F. Reschke2,
Fiyori Gebreyesus3, and Christopher Rocha4
NASA has identified a potential risk of spatial disorientation to future astronauts during re-entry of the proposed Orion spacecraft. The purpose of this study was to determine if a 6-hour physiological training procedure, Autogenic-Feedback Training Exercise (AFTE), can mitigate these effects. Twenty subjects were assigned to two groups (AFTE and Control) matched for motion sickness susceptibility and gender. All subjects received a standard rotating chair test to determine motion sickness susceptibility; three training sessions on a manual performance task; and four exposures to a simulated Orion re-entry test in the rotating chair. Treatment subjects were given two hours of AFTE training before Orion tests 2, 3, and 4. A diagnostic scale was used to evaluate motion sickness symptom severity. Results showed that 2 hours of AFTE significantly reduced motion sickness symptoms during the second Orion test. AFTE subjects were able to maintain lower heart rates and skin conductance levels and other responses than the control group subjects during subsequent tests. Trends show that performance was less degraded for AFTE subjects. The results of this study indicate that astronauts could benefit from receiving at least 2 hours of preflight AFTE. In addition, flight crews could benefit further by practicing physiologic self-regulation using mobile devices.
1. Background The Orion spacecraft is the vehicle NASA plans to use during future human exploration missions beyond low Earth orbit which includes the Moon, Mars, and the asteroid belt. Conical in shape like the Apollo capsules, Orion will carry up to six crewmembers during launch and re-entry. The purpose of this study was to test a method for helping astronauts to adapt to spaceflight and re-adapt to Earth. The study addresses Human Research Program (HRP) Risks: 1) Risk of Therapeutic Failure due to Ineffectiveness of Medication; and 2) Risk of Impaired Control of Spacecraft, Associated Systems and Immediate Vehicle Egress due to Vestibular/Sensorimotor Alterations Associated with Spaceflight and Gap SM11: Can crewmember spatiomotor abilities
1 NASA Ames Research Center; Moffett Field, California. 2 NASA Johnson Space Center; Houston, Texas. 3 University of California, San Diego; San Diego, California. 4 San Jose State University Foundation; Moffett Field, California.

2
be more accurately predicted and can countermeasures and training techniques be developed to mitigate spatial disorientation during space flight? NASA has identified a potential risk to future astronauts during re-entry of the Orion spacecraft, when medications to control symptoms of dizziness or nausea may not be effective for all crew and often lead to adverse side effects. This study tested a countermeasure—a 6-hour physiological training procedure, Autogenic-Feedback Training Exercise (AFTE)—which has been found to be an effective alternative method for controlling these symptoms2, 6-10, 17. AFTE combines Autogenic Therapy22, Biofeedback23, and Jacobsonian Progressive Relaxation24. In earlier studies14, 16, AFTE has been shown to improve pilot performance during emergency search and rescue missions when compared to an untrained control group of pilots who had similar hours of flight experience. It is particularly noteworthy that AFTE improved crew coordination and communication performance, as these factors are emphasized in Cockpit Resource Management approaches to the management of human error accidents. AFTE treatment effects were demonstrated in those dimensions involving communications with crewmembers, crew briefings, workload delegation, planning, and overall technical proficiency. Another study compared AFTE to promethazine an anti-motion sickness medication currently used by space crews and showed AFTE to be significantly more effective in preventing motion sickness symptoms without side effects; the side effects of promethazine had significant negative impact on cognitive performance6, 15, 17. AFTE has been previously tested in space11, 22 as a countermeasure for motion sickness aboard the Shuttle. Six astronauts were tested—three received preflight AFTE (no medication) and three controls who took medication during the flight. Two of the three AFTE astronauts were asymptomatic while the third experienced only mild symptoms on mission day 1. Two of the control astronauts experienced multiple vomiting episodes on the first 3 days of the mission and the third astronaut experienced only mild to moderate symptoms on these days. AFTE was also evaluated with two cosmonauts during a six month mission on the Russian Space Station 12, 20 as a means of improving crew performance, emotional health, and post-flight orthostatic intolerance. One cosmonaut showed good physiological control during both preflight training and self-practice AFTE sessions during the mission. During egress from the vehicle and post-flight tilt tests of orthostatic intolerance this individual did not become pre-syncopal. Psychophysiological methods of using multiple physiological responses can be described as patterns of response magnitudes, latencies, and covariance and are referred to as individual stress profiles. These profiles are repeatable and stable over time1, 3-5, 13, 21, and when combined with measures of performance (e.g., reaction time, short term memory) and subjective reports (e.g., mood, symptoms experienced) enable investigators to use this converging indicators method to characterize individual differences in responses to environmental stimuli. These methods were used in the current study to assess the impact of simulated Orion re-entry tests on participants. The effects of sensorimotor adaptations in the spaceflight environment appear as multiple symptoms during re-entry and egress from the vehicle. Some crewmembers experience nausea, vomiting, diminished visual acuity, impaired gait, and/or inability to maintain balance while standing up. Cognitive performance effects have not been consistently recorded. A hand-operated control is planned for use by crews during Orion descent to provide the astronaut with unrestricted access to the avionics and their applications thereby enabling uninterrupted manual control of

3
vehicle systems. The current study included a manual control task that subjects performed during a rotating chair test which produced angular accelerations that were similar to what crew may experience during Orion re-entry. In addition, tests of gait and balance were conducted following the rotating chair tests based on an existing protocol for post-flight tests of crew. 2. Study Objectives 1. Expose subjects to Coriolis (cross-coupled angular) accelerations in a rotating chair to elicit
spatial disorientation and motion sickness symptoms similar to what crew experience during spacecraft re-entry.
2. Measure physiological responses, spatial disorientation, and motion sickness symptoms experienced during and immediately following rotating chair tests.
3. Examine human performance during rotation and after rotation has stopped. 4. Evaluate the effects of AFTE for mitigating symptoms and performance degradations during
rotating chair tests. 5. Determine the minimum amount of AFTE training needed to achieve these goals. 3. Method 3.1 Participants Twenty men and women, ages ranging from 24 to 65, participated in the study. Subjects were initially given a standard rotating chair test (described below) to determine how long they could tolerate rotation. Tests were terminated when subjects reported severe malaise. Subjects were then assigned to either an AFTE or no treatment Control group (n=10 per group) where the groups were matched based on motion sickness tolerance (test duration) during a standard rotating chair test. 3.2 Physiological Measures The physiological measures recorded during AFTE training included: electrocardiography, respiration, blood flow to hands and feet, muscle activity of arms and legs, skin temperature, blood pressure, skin conductance, cardiac output and stroke volume. During the standard rotating chair test, task training, and Orion tests the responses measured included heart rate, respiration rate, skin conductance, blood volume pulse, skin temperature of the left hand, and muscle activity of the arms and legs. 3.3 Standard Rotating Chair Test A standard rotating chair test was used to determine each subject’s motion sickness tolerance and assigning subjects to groups based on their test duration. Tests began with an initial speed of 6 rpm which was held constant for 5 minutes. The chair speeds were increased by 2 revolutions per minute (rpm) at 5 minute intervals until the tests were terminated. Figure 1 shows the acceleration steps and motion sickness susceptibility ranges. During each rotational period at a constant speed, the subjects executed 150 randomized head movements in four directions (left, right, front, or back). Head movement commands were computer generated and subjects made 45 degree head tilts from the head upright position. The duration to complete one head movement sequence (e.g., tilt head ‘left’ followed by head ‘up’) was 2 seconds. After each 5 minute period of rotation there was a 30 second pause where the subject stopped making head movements but

4
chair rotation was continued. At this time motion sickness symptoms were rated by an observer in the room with the subject using a standard symptom diagnostic scale described in Section 3.7. If the subject reported only mild symptoms the chair speed was increased 2 rpm and the subject resumed making head movements. Tests were terminated when subjects reported severe malaise (diagnostic points equal to or greater than 8) or when the observer stopped the test if the subject was too symptomatic to continue.
Figure 1. Standard rotating chair test used to determine motion sickness susceptibility.
3.4 Autogenic-Feedback Training Exercise (AFTE) AFTE involves training subjects to voluntarily control several of their own physiological responses over a 6-hour training program (twelve 30-minute daily sessions). Emphasis was placed on training individuals to control the parameters that changed the most during their initial motion sickness test. Subjects were instructed to increase and decrease their response levels during ten 3-minute alternating trials. Physiological data were recorded during training sessions while subjects were seated in a reclining chair in a separate room. Twenty four physiological responses were measured and selected parameters displayed to subjects as visual feedback. AFTE is a combined application of several physiological and perceptual training techniques that include Autogenic Therapy, progressive relaxation, and biofeedback. Autogenic Therapy consists of self-suggestion exercises designed to induce specific bodily sensations (e.g., warmth and heaviness in the arms and legs). However, during AFTE training, subjects learn to both increase and decrease response levels (bi-directional training)9-13. Increases in sympathetic activation during “arousal trials” were elicited immediately by presenting a stimulus to the subject (e.g., telling a joke, speaking loudly, etc.) to make his heart beat faster. Decreases in sympathetic activation during “relaxation trials,” were achieved when the trainer instructed subjects in specific self-suggestion exercises of Autogenic Therapy (e.g., breathing regulation, muscle relaxation, and hand-warming). The subject was expected to change from active-goal directed thinking during arousal to a more passive mental state during relaxation. This method improves the subject’s ability to perceive physical sensations associated with the direction of change. Only repetition and practice are required before physiological control is achieved. The effect of AFTE is to normalize autonomic balance by reducing over-reactivity to stressful stimuli
Highsusceptible6–8rpm
Moderatesusceptible10–12rpm
Lowsusceptible14rpmorhigher

5
and maintaining optimal response levels (resting baseline). Physiological control is achieved using operant conditioning methods and providing biofeedback in the form of numeric and analog visual displays, auditory tones, and verbal instruction. The trainer monitors all feedback displays throughout training and observes how these parameters co-vary (e.g., if increased heart rate is associated with peripheral vasoconstriction or dilation). The trainer directs the subject’s attention to a specific response (e.g., heart rate) and can set a threshold level to trigger a tone when his heart rate increases or turn off the tone when heart rate decreases. If the subject succeeds in turning on the tone, the trainer can progressively adjust the threshold higher—thus “shaping” the response magnitude and direction of change. For example, during arousal trials as the subject’s heart rate increases to 72 a tone would go on, and if he is successful in keeping the tone on the trainer can gradually adjust the threshold higher to achieve a higher heart rate. Conversely, during relaxation the subject is instructed to keep the tone off by lowering his heart rate below 74, then 72, then 70, etc. Multiple tones of different frequencies can be provided for any physiological response with the trainer deciding the response targets for each parameter for a given individual. Analog waveforms are provided as additional feedback. For example, the subject is instructed to maintain constant respiration rate using the numerical display and constant respiration volume by matching the analog waveforms of respiration traces displayed on the screen. Figure 2 shows the trainer’s console and video view of test participants.
Figure 2. Computer displays of physiological feedback and video of test participant.
In AFTE sessions 1 to 4 (total 2 hours), the trainer introduces displays of all 24 physiological measures and decides which type of feedback works bests for the individual subject. Some subjects need verbal feedback while others work best with visual and/or auditory feedback. During AFTE sessions 5 to 8 (total 4 hours), the trainer begins to remove feedback displays by encouraging the subject to pay attention to his own internal physical sensations which can be used in place of external cues. AFTE sessions 9 to 12 (total 6 hours) are devoted to maintaining bi-directional control of physiological responses while introducing distractions. For example, subjects make head movements as instructed by a pre-recorded voice or while experiencing increased rotational velocities in the chair with no head movements and therefore, no symptoms. In this way, subjects learn to transfer learned autonomic control achieved in a quiet darkened room to more distracting environments.
6
3.5 Manual Dexterity and Mental Arithmetic Task This task involved subtracting from100 by 5s and entering the result into a key pad. A wireless number key pad was attached with Velcro™ to the right armrest (or dominant hand) of the rotating chair. Each subject received three, 35-minute task-training sessions on consecutive days. Training sessions included the following conditions:
• 5 minutes resting baseline (no task) • 5-minute task with no head movements and eyes open • 5 minutes resting baseline (no task) • 5-minute task with no head movements and eyes closed • 5 minutes resting baseline (no task) • 5-minute task with head movements and eyes closed • 5 minutes resting baseline (no task)
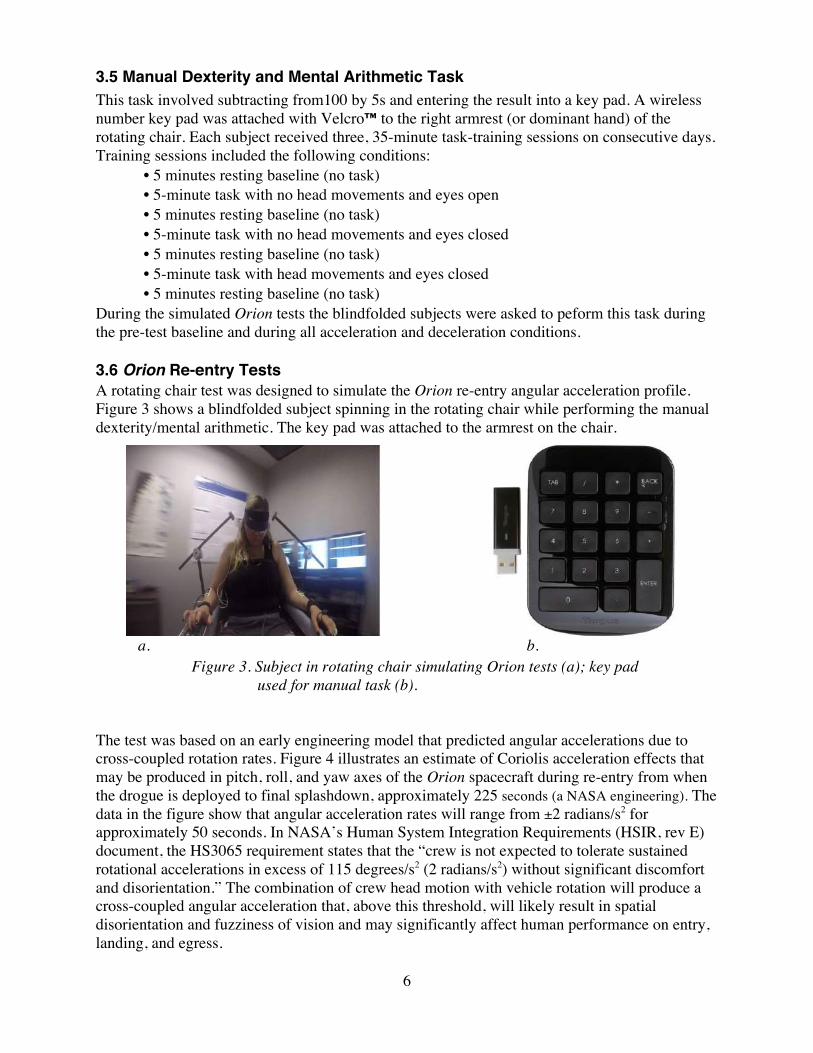
During the simulated Orion tests the blindfolded subjects were asked to peform this task during the pre-test baseline and during all acceleration and deceleration conditions. 3.6 Orion Re-entry Tests A rotating chair test was designed to simulate the Orion re-entry angular acceleration profile. Figure 3 shows a blindfolded subject spinning in the rotating chair while performing the manual dexterity/mental arithmetic. The key pad was attached to the armrest on the chair.
a. b.
Figure 3. Subject in rotating chair simulating Orion tests (a); key pad used for manual task (b).
The test was based on an early engineering model that predicted angular accelerations due to cross-coupled rotation rates. Figure 4 illustrates an estimate of Coriolis acceleration effects that may be produced in pitch, roll, and yaw axes of the Orion spacecraft during re-entry from when the drogue is deployed to final splashdown, approximately 225 seconds (a NASA engineering). The data in the figure show that angular acceleration rates will range from ±2 radians/s2 for approximately 50 seconds. In NASA’s Human System Integration Requirements (HSIR, rev E) document, the HS3065 requirement states that the “crew is not expected to tolerate sustained rotational accelerations in excess of 115 degrees/s2 (2 radians/s2) without significant discomfort and disorientation.” The combination of crew head motion with vehicle rotation will produce a cross-coupled angular acceleration that, above this threshold, will likely result in spatial disorientation and fuzziness of vision and may significantly affect human performance on entry, landing, and egress.

7
Figure 4. Model of re-entry acceleration rate provided by NASA engineers.
The simulated Orion re-entry test in the rotating chair consisted of:
• 5-minute pre-test resting baseline (no rotation or head movements) • 5 minutes performing the task (no rotation or head movements) • 20-second acceleration to 20 rpm (head movements and task) • 2 minutes at 20 rpm (head movements and task) • 15-second deceleration to 5 rpm (head movements and task) • 90 seconds at 5 rpm (head movements and task) • 5-second deceleration to stop (no head movements or task) • 75 seonds remaining stationary (head movements and task) • egress from chair and walk through obstacle course
A pre-recorded voice command generated by a computer instructed the subject to make head movements in random order at 2 second intervals. Figure 5 illustrates the acceleration and duration rates of this test. The chair was in motion for a total of 245 seconds during which time subjects performed the manual dexterity and mental arithmetic task. It is important to note that there are combined vestibular effects of angular accelerations of the chair (z-axis rotation) and Coriolis acceleration due to cross-coupled rotations during head movements that may produce disorientation and nausea. The cross-coupled vestibular stimulus can be estimated as the vector cross product of the rotational rates of the chair, ω1, and the head, ω2, where ω1 and ω2 represent magnitudes of angular velocity in radians/second. For example, in the current experiment one of the head movements starts with the head upright (0°) with the head right to a stop at 45o and then returns to a stop at 0o. This roll movement takes 1 second in each direction. If one assumes a sinusoidal profile for this 2-second movement, the peak slew rate for this roll motion is ω2 = (45o/2)(0.5 Hz)(2 π rad/s/Hz) = π 22.5o/s (π rad / 180o) = π2/8 rad/s = 1.234 rad/s. When the chair rotates in the yaw axis at ω2 = 6 rpm (0.628 rad/s), the cross-coupled rotational velocities for the chair and the assumed peak head slewing rate, given by (ω1×ω2), is 0.77 rad/s2. When the chair

8
rotates at 20 rpm (2.094 rad/s), the corresponding peak cross-coupled rotational acceleration is 2.57 rad/ s2.
Figure 5. Rotating chair acceleration simulating Orion re-entry. 3.7 Symptom Diagnostic Scale A standard motion sickness symptom diagnostic scale (see Table 1) was used for assessing malaise levels experienced by subjects. The Coriolis Sickness Susceptibility Index (CSSI) has been a standard for measuring self-reports of the severity of motion sickness for more than 40 years2-15. The presence or absence and/or strength of symptoms was assessed subjectively by the subject (none “0,” mild “1,” moderate “2,” or severe “3”). These symptoms include drowsiness, sweating, salivation, pallor (by asking a crewmate), and nausea. Other symptoms were rated as Additional Qualifying Symptoms (ADQ) and were scored as none, mild, or moderate levels only. These include increased warmth, dizziness, and headache. Stomach sensations were evaluated on five levels. Stomach awareness is described as not nausea and not particularly uncomfortable but as an increased awareness of the stomach (e.g., hunger). It was scored as either none (0) or mild (1). Stomach discomfort is described as not nausea but becoming increasingly uncomfortable (e.g., lump in the throat or stomach distended by gas). It was scored as either none (0) or moderate (2). Nausea was reported when it could clearly be differentiated from stomach awareness and stomach discomfort and was reported as none (0), mild (1), moderate (2), or severe (3). Actual vomiting was indicated as “yes” or “no” and “how often?”. Total scores of 8 points were considered severe malaise.

9
Table 1. Motion Sickness Diagnostic Scale
Questions none mild moderate severe 0 1 2 3
Are you feeling warmer? n/a Do you have any dizziness? n/a Do you have a headache? n/a Are you drowsy? Are you salivating more? Do you have facial pallor? Are you sweating? Do you feel stomach awareness?
n/a n/a
Do you have stomach discomfort?
n/a n/a
Do you have any nausea? Have you vomited today? yes _______ no _______ If yes, how often?
3.8 Seat Egress and Walk Test Testing began with the blindfolded subject seated upright in the stationary rotating chair. The blindfold was then removed and the subject was asked to stand up and remain stationary for approximately 5 to 10 seconds. The subject was then instructed to walk through an obstacle course (see Figure 6).
Figure 6. The obstacle course is 10 feet long (left); the heel-to-toe walk test (right).

10
4. Results Subjects were assigned to groups based on number of rotations tolerated during a standard rotating chair test as shown in Figure 7. Table 2 lists group means and standard errors for age and rotations tolerated and the number of men and women participating in each group.
Figure 7. Vertical bars in the graph represent the number of rotations tolerated by
each test participant. Red = Control subjects, green = AFTE subjects.
Table 2. Group Demographics
Treatment Gender Age: Mean (se) Rotations Tolerated: Mean (se)
AFTE 3f, 7m 35.9 (3.7) 170.6 (39.8) Control 3f, 7m 35.2 (3.2) 176 (45.3)
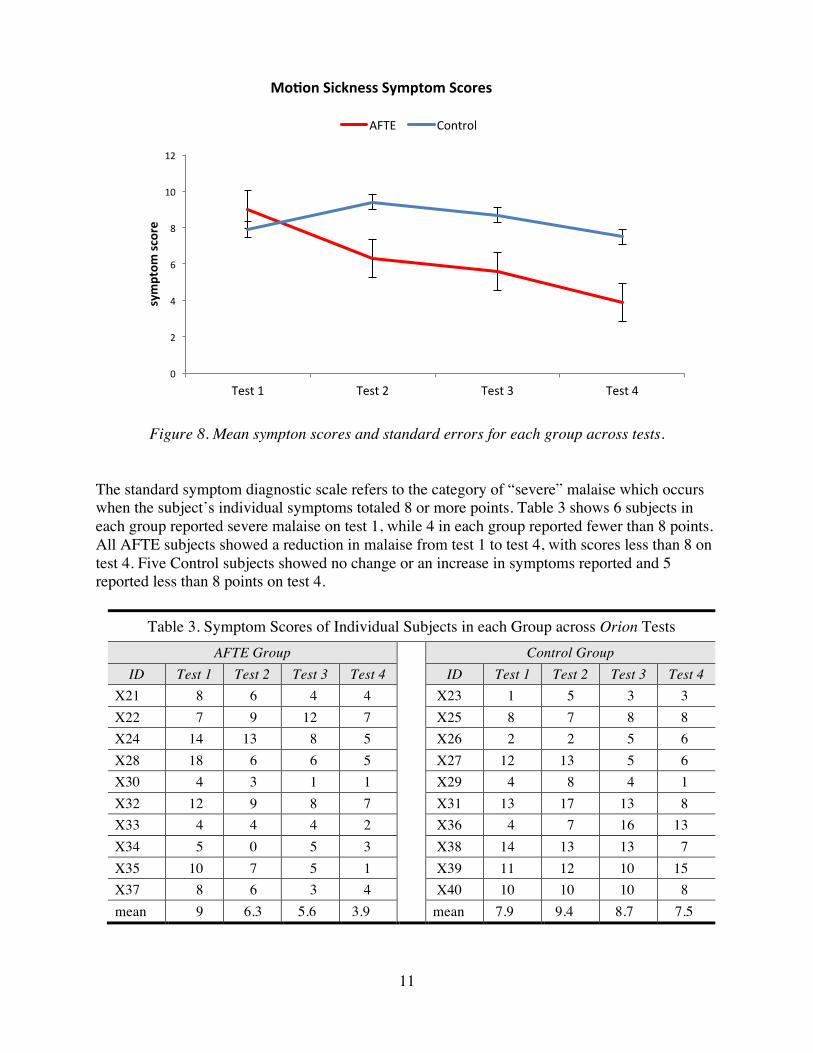
4.1 Symptom Reports Figure 8 shows group means and standard errors of motion sickness symptom scores across the four simulated Orion re-entry tests. Repeated measures ANOVA (2 groups x 4 tests) on symptom data revealed a significant 2-way interaction (DF=3, 54, F=3.15, p < 0.03). Post hoc t-test comparisons between groups showed no significant differences on test 1 (p<0.30); however tests 2, 3, and 4 were significant (p<0.05, p<0.043, p<0.013, respectively). Within group comparisons for the AFTE group were significant for test 1 versus 2 (p<0.024); test 1 versus 3 (p<0.019); and test 1 versus 4 (p<0.001). Within group comparisons for the Control group were significant for test 1 versus 2; where scores on the second test were higher (p<0.047). There were no significant differences between test 1 versus 3, and test 1 versus 4.
38 46 46 54 70 80 100120 120 144 144
156 180 180 180250 250
366420
520
0
100
200
300
400
500
600
X31-m
X36-f
X37-f
X39-m
X21-m
X24-m
X32-m
X22-m
X27-m
X26-m
X30-f
X38-m
X28-m
X29-f
X34-f
X25-m
X40-f
X35-m
X33-m
X23-m
cumula&
vero
ta&o
ns
subjectID
StandardRota&ngChairTest-CSSI
11
Figure 8. Mean sympton scores and standard errors for each group across tests. The standard symptom diagnostic scale refers to the category of “severe” malaise which occurs when the subject’s individual symptoms totaled 8 or more points. Table 3 shows 6 subjects in each group reported severe malaise on test 1, while 4 in each group reported fewer than 8 points. All AFTE subjects showed a reduction in malaise from test 1 to test 4, with scores less than 8 on test 4. Five Control subjects showed no change or an increase in symptoms reported and 5 reported less than 8 points on test 4.
Table 3. Symptom Scores of Individual Subjects in each Group across Orion Tests AFTE Group Control Group
ID Test 1 Test 2 Test 3 Test 4 ID Test 1 Test 2 Test 3 Test 4 X21 8 6 4 4 X23 1 5 3 3 X22 7 9 12 7 X25 8 7 8 8 X24 14 13 8 5 X26 2 2 5 6 X28 18 6 6 5 X27 12 13 5 6 X30 4 3 1 1 X29 4 8 4 1 X32 12 9 8 7 X31 13 17 13 8 X33 4 4 4 2 X36 4 7 16 13 X34 5 0 5 3 X38 14 13 13 7 X35 10 7 5 1 X39 11 12 10 15 X37 8 6 3 4 X40 10 10 10 8 mean 9 6.3 5.6 3.9 mean 7.9 9.4 8.7 7.5
0
2
4
6
8
10
12
Test1 Test2 Test3 Test4
symptom
score
Mo&onSicknessSymptomScores
AFTE Control

12
4.2 Keypad Entry Task Figure 9 shows group performance during the last task training session and during the four Orion tests. Both groups showed significant decrements in accuracy from training to test 1 (p<0.005). A significant decrement in response speed was found for the Control group (p<0.01) but not for AFTE. Repeated measures ANOVA (2 groups x 4 tests) were performed on task accuracy and response speed during Orion tests. A significant two-way interaction was found for accuracy (DF=3, 54, F=2.8, p<0.048). However, post-hoc t-tests between groups were not significant for accuracy or response speed. Within-group comparisons for accuracy were not significant for the AFTE group, however, the Control group showed a significant improvement on tests 1 versus 3 and test 1 versus 4 (both p<0.01). Within-group comparisons for response speed were not significant for the AFTE group, however, the Control group showed a significant improvement on tests 1 versus 3 and test 1 versus 4 (p<0.01 and p<0.04, respectively).
Figure 9. Performance accuracy and response speed during task training #3 and Orion tests.
Table 4 on the next page shows each individual’s data in the last task-training session and during all Orion tests. Eight of the 10 AFTE subjects achieved at least 90 percent correct on test 4, while only 5 of 10 Control subjects reached 90 percent. Table 4 also shows individual response speed scores. Table 5 shows the individual response speed scores.
50
60
70
80
90
100
Training Test1 Test2 Test3 Test4
%correct
PerformanceAccuracy
AFTE Control
0.00
0.20
0.40
0.60
0.80
1.00
Training Test1 Test2 Test3 Test4
respon
ses/second
PerformanceResponseSpeed
AFTE Control

13
Table 4. Task Accuracy Scores (% correct) of Individuals in each Group during Training and Orion Tests
AFTE Group Control Group
ID Training 3
Test 1
Test 2
Test 3
Test 4 ID Training
3 Test
1 Test
2 Test
3 Test
4 X21 94 91 93 86 91 X23 99 83 95 96 99 X22 86 76 61 68 64 X25 80 54 50 80 86 X24 96 86 86 80 90 X26 96 96 99 98 98 X28 97 89 87 94 91 X27 89 54 75 83 84 X30 97 90 91 90 98 X29 94 92 80 85 85 X32 91 73 86 88 91 X31 94 89 85 90 92 X33 97 95 95 97 96 X36 66 24 35 47 22 X34 96 94 92 97 90 X38 95 89 83 88 90 X35 96 84 83 88 93 X39 69 44 53 55 71 X37 93 76 59 65 57 X40 89 81 82 91 91 mean 95 85 83 85 86 mean 87 71 74 81 82
Table 5. Task Response Speed Scores (responses/sec) of Individuals in each Group during Training and Orion Tests
AFTE Group Control Group
ID Training 3
Test 1
Test 2
Test 3
Test 4 ID Training
3 Test
1 Test
2 Test
3 Test
4 X21 .87 .70 .68 .71 1.00 X23 .94 .34 .75 .71 .90 X22 .35 .42 .07 .25 .21 X25 .32 .13 .22 .44 .44 X24 .50 .42 .42 .38 .54 X26 1.08 1.20 1.23 1.27 .96 X28 .99 .80 .49 .34 .36 X27 .47 .21 .36 .56 .41 X30 .73 .46 .49 .64 .62 X29 .48 .59 .31 .45 .49 X32 .56 .36 .30 .35 .39 X31 .77 .37 .58 .74 .84 X33 .91 .86 1.01 1.08 1.04 X36 .23 .09 .15 .07 .03 X34 .46 .91 .89 .82 .36 X38 .66 .58 .44 .55 .56 X35 .50 .35 .24 .09 .39 X39 .19 .07 .17 .21 .29 X37 .62 .36 .21 .20 .24 X40 .39 .24 .33 .41 .46 mean .65 .56 .48 .49 .52 mean .55 .38 .45 .54 .53 4.3 Calculating Individual Stress Profiles Our method for describing an individual’s stress profile involves a z-score transformation of the physiological measures so that an individual’s response change to a stimulus is adjusted relative to his pre-test resting baseline mean and standard deviation, therefore z = (x – mean
baseline)/standard deviationbaseline. This procedure enables us to plot all physiological variables on the
14
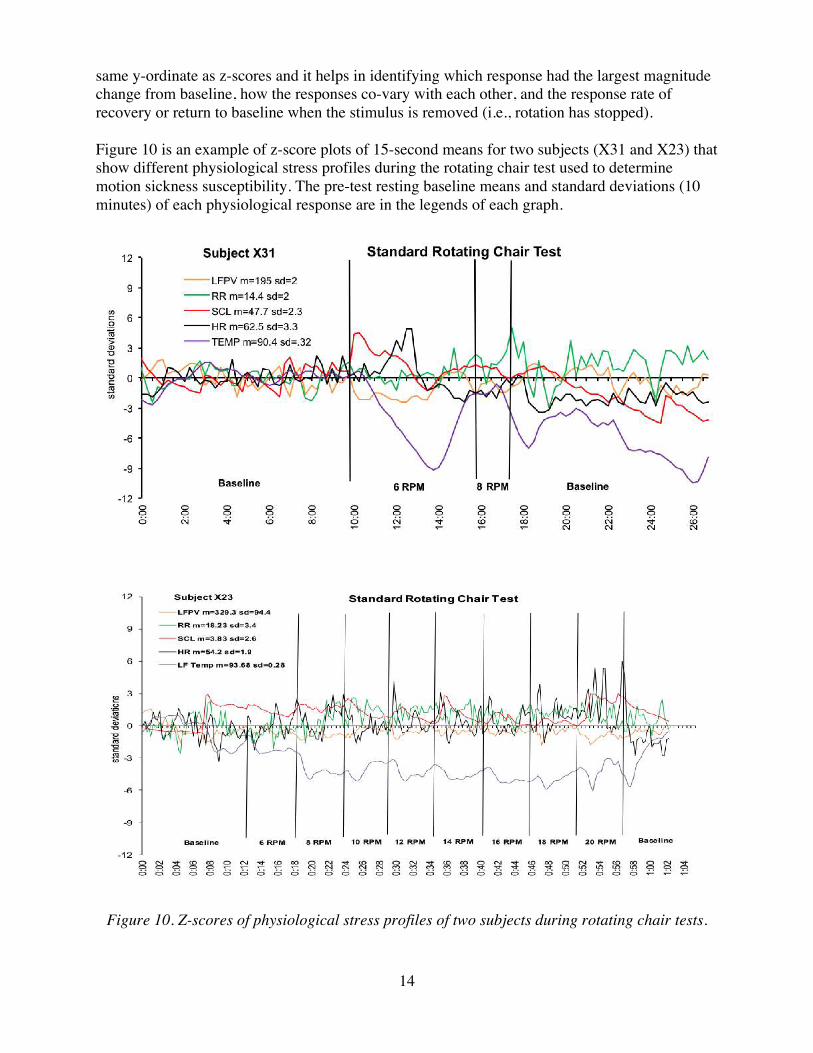
same y-ordinate as z-scores and it helps in identifying which response had the largest magnitude change from baseline, how the responses co-vary with each other, and the response rate of recovery or return to baseline when the stimulus is removed (i.e., rotation has stopped). Figure 10 is an example of z-score plots of 15-second means for two subjects (X31 and X23) that show different physiological stress profiles during the rotating chair test used to determine motion sickness susceptibility. The pre-test resting baseline means and standard deviations (10 minutes) of each physiological response are in the legends of each graph.
Figure 10. Z-scores of physiological stress profiles of two subjects during rotating chair tests.
15
Appendix A contains graphs of z-score stress profiles for all 20 subjects during the initial standard rotating chair test used to determine motion sickness susceptibility. It was observed that all 20 subjects showed largest response magnitudes in measures of skin conductance and peripheral blood flow. 4.4 Physiological Data of Individuals during AFTE and Orion Tests Two important objectives of this study were to: 1) determine the minimum amount of AFTE needed to achieve learned control, and 2) evaluate the effect of AFTE for mitigating symptoms and improving performance. As in most learning paradigms, individuals learn at different rates. However, the results from this study showed that effective control was achieved by most subjects after 2 hours of AFTE. Figure 11 is an example of one subject’s level of physiological control (a low motion sickness susceptible) after 2 hours of AFTE. Each training session included 6 minutes of pre- and post-baseline and ten 3-minute trials of self-induced arousal followed by relaxation (total of 42 minutes). The graphs show cardiac output, heart rate, skin conductance, and systolic blood pressure. The level of skill at controlling multiple responses is based on three criteria: 1) latency—how quickly the response occurs at the start or end of a trial; 2) magnitude of the response change; and 3) duration—maintaining a response level in the desired direction for the entire trial. The subject in Figure 11 showed rapid response changes at the start of each trial and could maintain relatively stable response levels throughout each 3-minute trial. Note that the trials alternated between “relaxation” (R) and “arousal” (A) beginning at the 6-minute elapsed time with a relax trial. Arousal responses are increased levels for all parameters and the rate of change was the same for all responses. Appendix B contains graphic depictions of all physiological data following 2 and 4 hours of AFTE for all ten AFTE subjects who participated in this study.

16
Figure 11. Subject X35 physiological responses after 2 and 4 hours of AFTE. Figure 12 on the next page shows the physiological responses of subject X35 during Orion tests 1 and 4 where heart rate decreases, respiration rate and volume stabilizes, and skin conductance is much lower after training (test 4, 6 hours AFTE). Similar physiological response levels were observed after 2 and 4 hours of AFTE.
2
3
4
5
liter
s/m
in
Cardiac Output 2-hours of AFTE 4-hours of AFTE
BSLNRARARARARABSLN
50
60
70
80
90
100
110
beat
s pe
r min
ute
Heart Rate
30
35
40
45
50
00:0
0 03
:00
06:0
0 09
:00
12:0
0 15
:00
18:0
0 21
:00
24:0
0 27
:00
30:0
0 33
:00
36:0
0 39
:00 m
icro
Seim
ens
Elapsed Time
Skin Conductance
110
120
130
140
00:0
0 03
:00
06:0
0 09
:00
12:0
0 15
:00
18:0
0 21
:00
24:0
0 27
:00
30:0
0 33
:00
36:0
0 39
:00
mm
Hg
Elapsed Time
Systolic Blood Pressure

17
Figure 12. Physiological responses of X35 during simulated Orion test 1 (severe motion sickness= 10 points) and test 4 (minimal symptoms= 1 point).
40
60
80
100
120
140
00:00 01:40 03:20 05:00 06:40 08:20 10:00 11:40 13:20 15:00
beat
s pe
r min
ute
Elapsed Time
X35 Low Susceptible Heart Rate Orion 1
Orion 4
Resting No Rotation
Task No Rotation 20 rpm+Task
5 rpm + Task
stop No Task
egress & walk
10
15
20
25
30
brea
ths
per m
inut
e
X35 -Respiration Rate sto
0
10
20
30
40
50
mic
rosi
emen
s
X35 - Skin Conductance Level sto
(no AFTE)
(6 hours
AFTE)

18
It was important to determine if a high motion sickness susceptible subject could also learn sufficient control of physiological responses to mitigate symptoms in the Orion tests with only 2 hours of AFTE training. Figure 13 shows data of subject X28 during training sessions after 2 and 4 hours of AFTE. Data of AFTE session 4 (2 hours AFTE), which was administered before the Orion test 2, indicate some control as all parameters respond in the appropriate directions during arousal (A) and relax (R) trials. Note, however, that this subject’s physiological control improved with practice following an additional 2 hours of training (AFTE session 8).
2
3
4
lite
rs/m
in
Cardiac Output AFTE-4 AFTE-8
BASELINE RARARARARA
50
60
70
80
be
ats
pe
r m
inu
te
Heart Rate
BASELINE RARARARARA
1
6
11
16
21
26
0:0
0:00
0:0
3:00
0:0
6:00
0:0
9:00
0:1
2:00
0:1
5:00
0:1
8:00
0:2
1:00
0:2
4:00
0:2
7:00
0:3
0:00
0:3
3:00
0:3
6:00
0:3
9:00
mic
ro S
Elapsed Time
Skin Conductance
110
115
120
125
130
135
140
0:0
0:0
0
0:0
3:0
0
0:0
6:0
0
0:0
9:0
0
0:1
2:0
0
0:1
5:0
0
0:1
8:0
0
0:2
1:0
0
0:2
4:0
0
0:2
7:0
0
0:3
0:0
0
0:3
3:0
0
0:3
6:0
0
0:3
9:0
0
mm
Hg
Elapsed Time
Systolic Blood Pressure
Figure 13. Cardiac output, heart rate, and skin conductance of subject X28 after 2 (AFTE 4) and 4 (AFTE 8) hours of AFTE. (Note: blood pressure measures during AFTE 8 were not collected due to malfunctioning equipment.)
Figure 14 on the next page shows subject X28’s heart rate, skin conductance level, and respiration rate during Orion test 1( before AFTE), and test 2 (2 hours of AFTE). These data indicate a reduced arousal response to the stimulus. His motion sickness symptom scores

19
decreased from 18 to 5 points (severe to minor malaise) and task response speed improved from 0.8 to 0.36 responses per second.
Figure 14. Physiological responses of X28 during test 1 (severe malaise=18 points) and
test 2 (mild malaise= 6 points).
50 55 60 65 70 75 80 85 90 95
100 00
:00
01:0
0
02:0
0
03:0
0
04:0
0
05:0
0
06:0
0
07:0
0
08:0
0
09:0
0
10:0
0
11:0
0
12:0
0
13:0
0
14:0
0
15:0
0
16:0
0
beat
s pe
r min
ute
Time
X28 Heart Rate of High Susceptible Orion 1
Orion 2
Resting no rotation
Task no rotation 20 rpm + Task
5 rpm + Task stop
egress & walk
noAFTE2hoursAFTE
0
10
20
30
40
50
mic
rom
hos
X28 - Skin Conductance Level
5
10
15
20
25
30
35
40
brea
ths
per m
inut
e
X28 - Respriation Rate

20
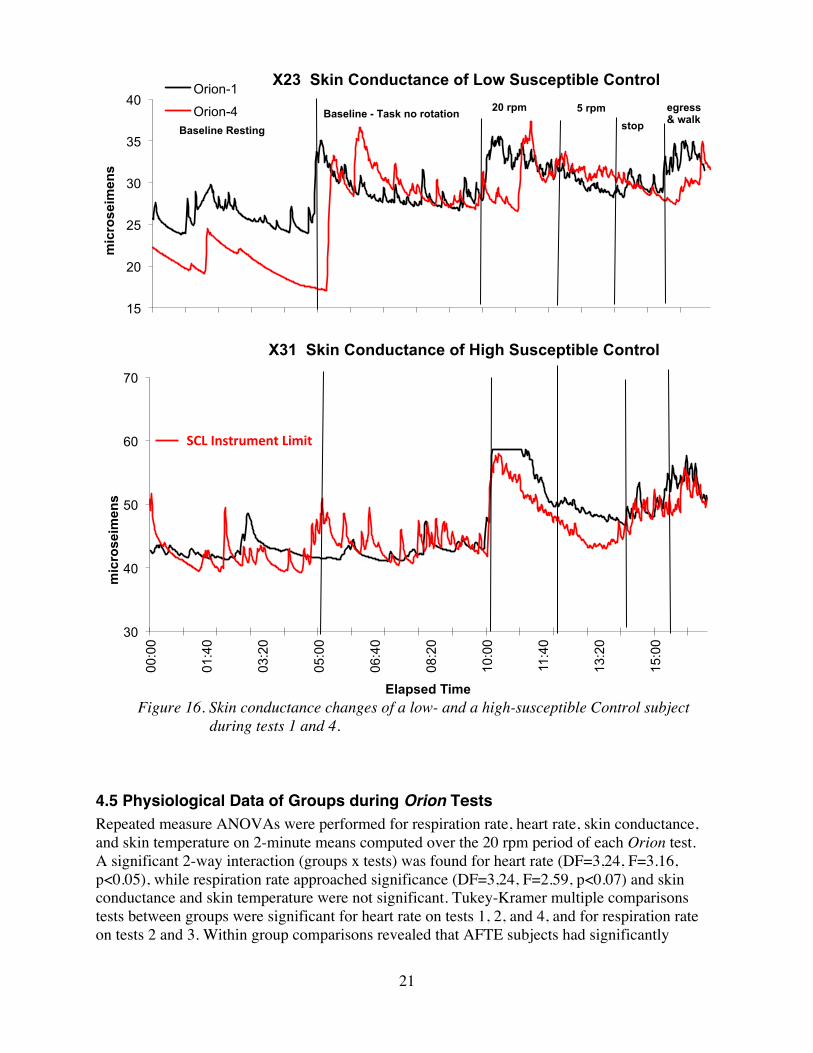
Large individual differences in physiological stress profiles were observed in this study. For the purposes of this report we include the data of two control subjects: X23 (low motion sickness susceptible) and X31 (high motion sickness susceptible). Figures 15 and 16 compare heart rates and skin conductance levels of both subjects. The figures illustrate two important observations. First, there are little or no differences in response levels of either control group subject during Orion test 1 versus Orion test 4. Second, low-susceptible subjects generally tend to demonstrate more stable response levels with less variability than high-susceptible subjects. Appendix C contains graphs of physiological data of all 20 participants on tests 1 and 4.
Figure 15. Heart rate changes of a low- and a high-susceptible Control subject during tests 1 and 4.
40
50
60
70
80
90
100
beat
s pe
r min
ute
X23 Heart Rate of Low Susceptible Control Orion 1 Orion 4 Baseline Resting Baseline - Task
no rotation 20 rpm 5 rpm stop
egress & walk
40
50
60
70
80
90
100
110
120
130
00:0
0
01:4
0
03:2
0
05:0
0
06:4
0
08:2
0
10:0
0
11:4
0
13:2
0
15:0
0
beat
s pe
r min
ute
Elapsed Time
X31 Heart Rate of High Susceptible Control
21
Figure 16. Skin conductance changes of a low- and a high-susceptible Control subject
during tests 1 and 4. 4.5 Physiological Data of Groups during Orion Tests Repeated measure ANOVAs were performed for respiration rate, heart rate, skin conductance, and skin temperature on 2-minute means computed over the 20 rpm period of each Orion test. A significant 2-way interaction (groups x tests) was found for heart rate (DF=3,24, F=3.16, p<0.05), while respiration rate approached significance (DF=3,24, F=2.59, p<0.07) and skin conductance and skin temperature were not significant. Tukey-Kramer multiple comparisons tests between groups were significant for heart rate on tests 1, 2, and 4, and for respiration rate on tests 2 and 3. Within group comparisons revealed that AFTE subjects had significantly
15
20
25
30
35
40 m
icro
seim
ens
X23 Skin Conductance of Low Susceptible Control Orion-1
Orion-4 Baseline Resting
Baseline - Task no rotation 20 rpm 5 rpm stop
egress & walk
30
40
50
60
70
00:0
0
01:4
0
03:2
0
05:0
0
06:4
0
08:2
0
10:0
0
11:4
0
13:2
0
15:0
0
mic
rose
imen
s
Elapsed Time
X31 Skin Conductance of High Susceptible Control
SCLInstrumentLimit

22
lower heart rates on test 3 (test 1 [no training] compared to test 3 [4 hours of AFTE]) and test 4 (6 hours of AFTE). AFTE subjects significantly reduced respiration rates on tests 2, 3, and 4 when compared to test 1. Control group subjects did not change significantly across tests for any of the responses measured. Significance levels were set at p<0.05 for between and within group comparisons. 5. Discussion The objectives of this study were successfully met. The simulated Orion re-entry tests in the rotating chair did elicit motion sickness symptoms and impaired task performance compared to task training without rotation. AFTE subjects significantly reduced motion sickness symptoms after 2 hours of training and showed further improvements in mitigating symptoms with additional training (4 and 6 hours). Both groups showed a significant performance decrement when task training #3 without rotation was compared to the first Orion test. Although no significant group changes in task performance were observed across Orion tests, trends show that performance data including visual observation of correct head movements and egress/walk parameters were less degraded for AFTE subjects. In this study the effectiveness of AFTE was evaluated using a modified rotating chair test referred to as simulated Orion test. However, there are two concerns with this test protocol. First, the test was designed to elicit severe motion sickness malaise (equal to or greater than 8 symptom points) in all participants during their initial exposure. In fact, only 12 of 20 (60%) participants reached their severe malaise endpoint. Second, if the test was more provocative there may have been a more significant impact on task performance. Previous studies have shown that AFTE mitigates symptons during stronger stimulus conditions (e.g., high performance aircraft and standard rotating chair tests). It has been our observation that most people reach a learning plateau at controlling their responses within the first 2 hours of AFTE but some individuals require more time to transfer this skill to stressful or distracting situations. We believe that additional self-administered practice sessions can improve physiological control for these individuals. This could be accomplished by providing individuals with small ambulatory physiological monitors and streaming the data to a mobile device to display the measures during self-practice AFTE. This study found significant differences in heart rate between groups with AFTE subjects showing lower heart rates after training than before while Control subjects heart rates did not change. Although skin conductance levels trended lower (reduced sympathetic activation) across tests for both groups these changes were not significant. The statistical analyses revealed large subject variance (individual differences in physiological responses to motion sickness stimuli) which likely influenced the group effects. One possible explanation for the large subject variance observed is based on a psychophysiological principle referred to as individual response stereotypy. It states that individuals have different response hierarchies to a given stimulus or stressor. For example, some people show large magnitude heart rate responses while others may show greater reactivity for skin conductance or peripheral circulation. As discussed previously in the Results (Section 4), our use of z-score transformation of the physiological measures provides a simple means for interpretation of individual stress profiles.

23
The results of this study and earlier investigations of AFTE indicate that spaceflight crews could benefit in a number of ways from receiving a minimum of 2 hours of preflight training. This training can also improve operational efficiency, mitigate spatial disorientation during planetary descent and landing, and prevent post-flight orthostatic intolerance.
24
References 1. Andreassi JL. Psychophysiology Human Behavior & Psychological Response, 2nd ed.
Lawrence Erlbaum Associates, Publishers; Hilldale New Jersey, 1989. 2. Acromite M, Davis C, Cowings P, Toscano W. Operational Applications of Autogenic
Feedback Training Exercise as a Treatment for Airsickness in the Military. Proceedings of the International Workshop on the Psychophysiological Aspects of Flight Safety in Aerospace Operations, p 29-32, Warsaw, Poland, September 2011.
3. Cowings P, Toscano W. (2009) Behavioral Health and Performance, Technical Gap Analysis White Paper: Sub-Element 6.3.2.2 Behavioral Health Management, in Behavioral health and performance technical gap analyis white papers. SBJ & MK Kaiser (Eds) NASA/TM-2009-215381.
4. Cowings PS, Naifeh KH, Toscano WB. The stability of individual patterns of autonomic responses to motion sickness stimulation. Aviat Space Environ Med 1990; 61:399–405.
5. Cowings PS, Suter S, Toscano WB, Kamiya J, Naifeh K. General autonomic components of motion sickness. Psychophysiology 1986; 23:542–51.
6. Cowings PS, Toscano WB. Autogenic feedback training exercise is superior to promethazine for the treatment of motion sickness. J Clin Pharm 2000; 40(10):1154–65.
7. Cowings PS, Toscano WB, Timbers A, et al. Autogenic-feedback training exercise: a treatment for airsickness in military pilots. Int J Aviat Psych 2005; 15:395– 412.
8. Cowings PS. Autogenic-feedback training: a treatment for motion and space sickness. In: Crampton GH, ed. Motion and space sickness. Boca Raton, FL: CRC Press 1990:353–72.
9. Cowings PS, Billingham J, Toscano WB. Learned control of multiple autonomic responses to compensate for the debilitating effects of motion sickness. In: Barber TX, et al, eds. Biofeedback and self-control. Chicago: Aldine Publishing Co.; 1978.
10. Cowings PS, Toscano WB. The relationship of motion sickness susceptibility to learned autonomic control for symptom suppression. Aviat Space Environ Med 1982; 53:570 –5.
11. Cowings PS, Toscano WB, Kamiya J, et al. (1988) Final report. Spacelab-3 flight experiment 3AFT23: Autogenic-Feedback Training as a preventive method for space adaptation syndrome. NASA Technical Memorandum 89412. Moffett Field, CA: NASA Ames Research Center.
12. Cowings PS, Toscano WB, Taylor B, et al. Monitoring and correcting autonomic function aboard MIR: NASA Technology used in space to facilitate adaptation. Proceedings of the First Biennial Space Biomedical Investigators Workshop, League City, Texas, 1999, Jan 11-13. League City, TX: University Space Research Association; 1999:117-9
13. Cowings PS, Toscano W.B, DeRoshia C, Taylor B, Hines A, Bright A, Dodds, A. (2007) Converging Indicators for Assessing Individual Differences in Adaptation to Extreme Environments. Aviat Space Environ Med 2007; 78(5,Supp;.):B195-215.
14. Cowings, P.S., Toscano, W.B., Timbers, A., Casey, C., Hufnagel, J. (2005). Autogenic Feedback Training Exercise: A Treatment for Airsickness in Military Pilots. The International Journal of Aviation Psychology, 15(4), 395-412.

25
15. Cowings, P.S., &Toscano, W.B. (2001). Improving Operational Readiness on Earth and in Space: Autogenic-Feedback Training Exercise. Proceedings of American Institute of Aviation (AIAA) Conference of Space Station Utilization-Crew Payload Training for the International Space Station. Reference number AIAA-200105103, pp. 1260-1273.
16. Cowings, P.S., Toscano, W.B., Keller, M.A., Burge, J.D. (2001). Autogenic-Feedback Training Exercise Improves Pilot Performance: Enhanced Functioning Under Search and Rescue Flying Conditions. The International Journal of Aviation Psychology. 11(3), 305-315.
17. Cowings, P. S., Toscano, W. B., DeRoshia, C., Miller, N. E. (2000). Promethazine as a Motion Sickness Treatment: Impact on Human Performance and Mood States. Aviat Space & Environ. Med. 71(10):1013-32.
18. Cowings PS, Psychophysiology of Spaceflight and Aviation. Pol J Aviat. Med Psychol; 2013, 19(3):9-16.
19. Kornilova, L.M., Cowings, P.S., Arlaschenko, N.I., Korneev, D.Y., Sagalovich, S.V., Sarantseva, A.V., Toscano, W.B., and Kozlovskaya, I.B. (2003) Individual characteristics of correction of the Cosmonauts’ vegetative status with a method of adaptive biofeedback. Aviakosm Ekolog Med. 37(1), 67-72.
20. Toscano W. Psychophysiological studies in extreme environments, Polish Journal of Aviation Medicine and Psychology, 2013; 19(4): 19-24.
21. Toscano WB, Cowings PS. (1994) The effects of autogenic-feedback training on motion sickness severity and heart rate variability in astronauts. NASA Technical Memorandum 108840. Moffett Field, CA: NASA Ames Research Center.
22. Schultz, J.H. and Luthe, W. Autogenic Therapy. Vol. I: Autogenic Methods. New York: Grune & Stratton, 1969
23. Miller, N.E. “Learning of Visceral and Glandular Responses.” Science, Vol. 163, No. 3866, 1969, pp. 434-445.
24. Jacobson, E. (1938). Progressive relaxation. Chicago: University of Chicago Press.
26
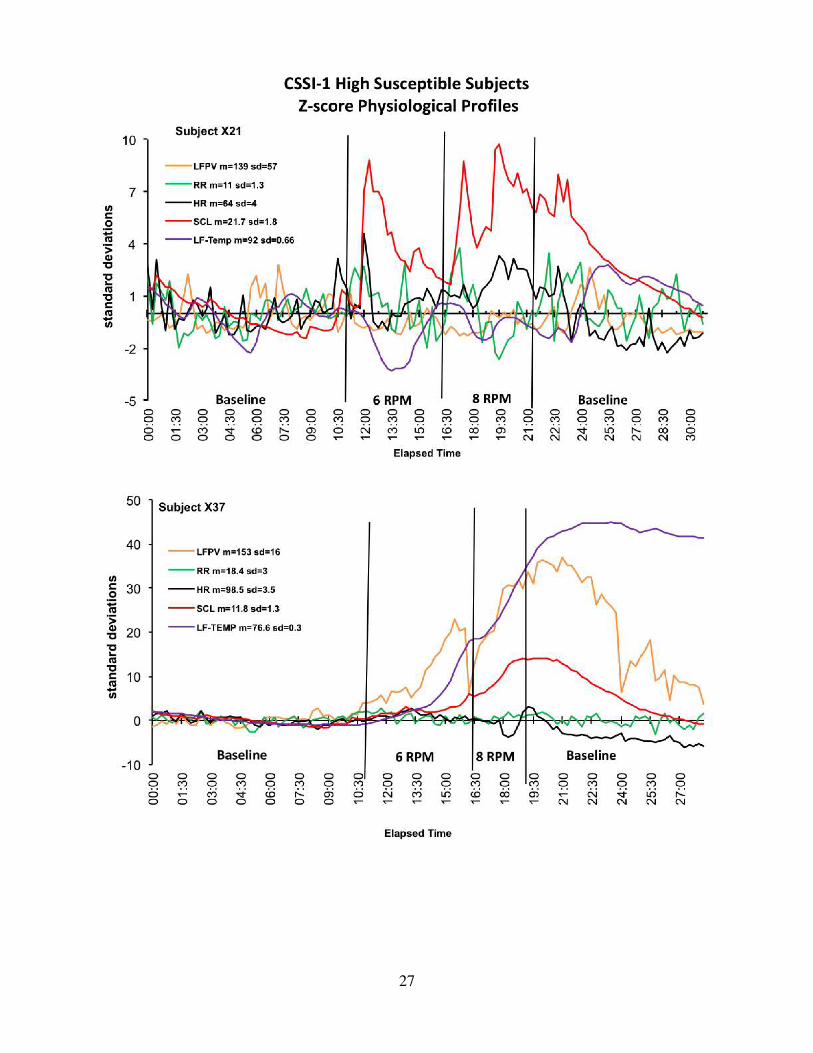
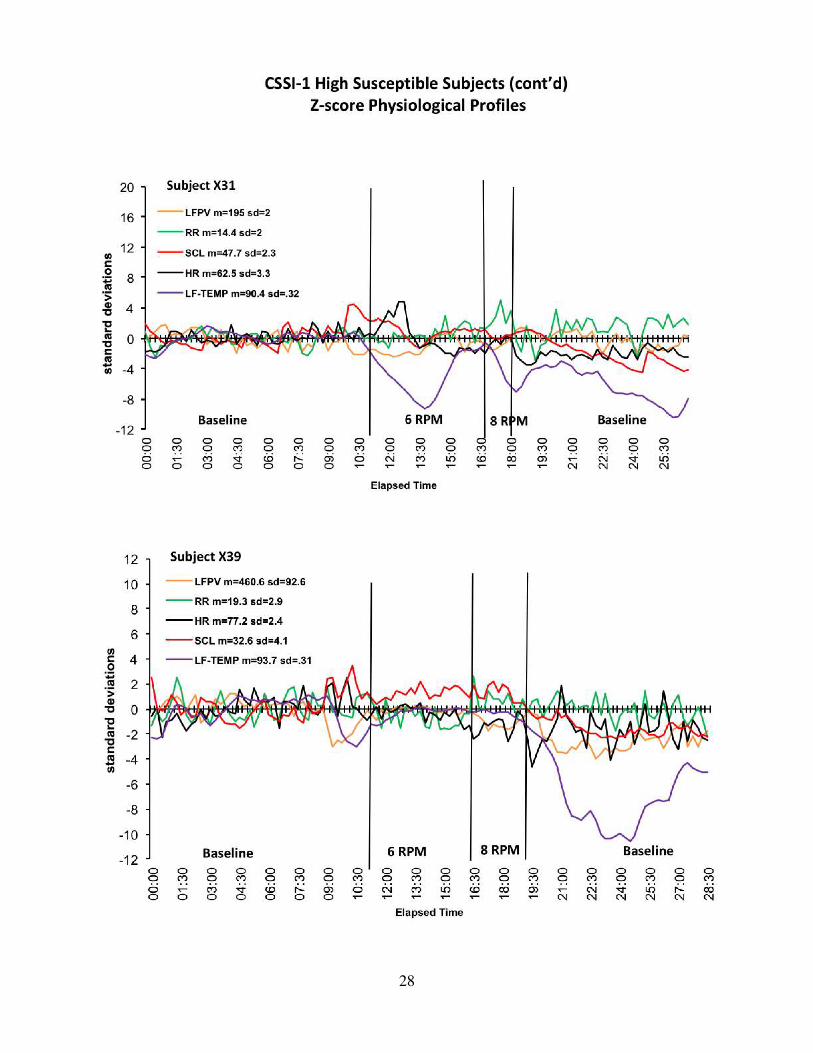
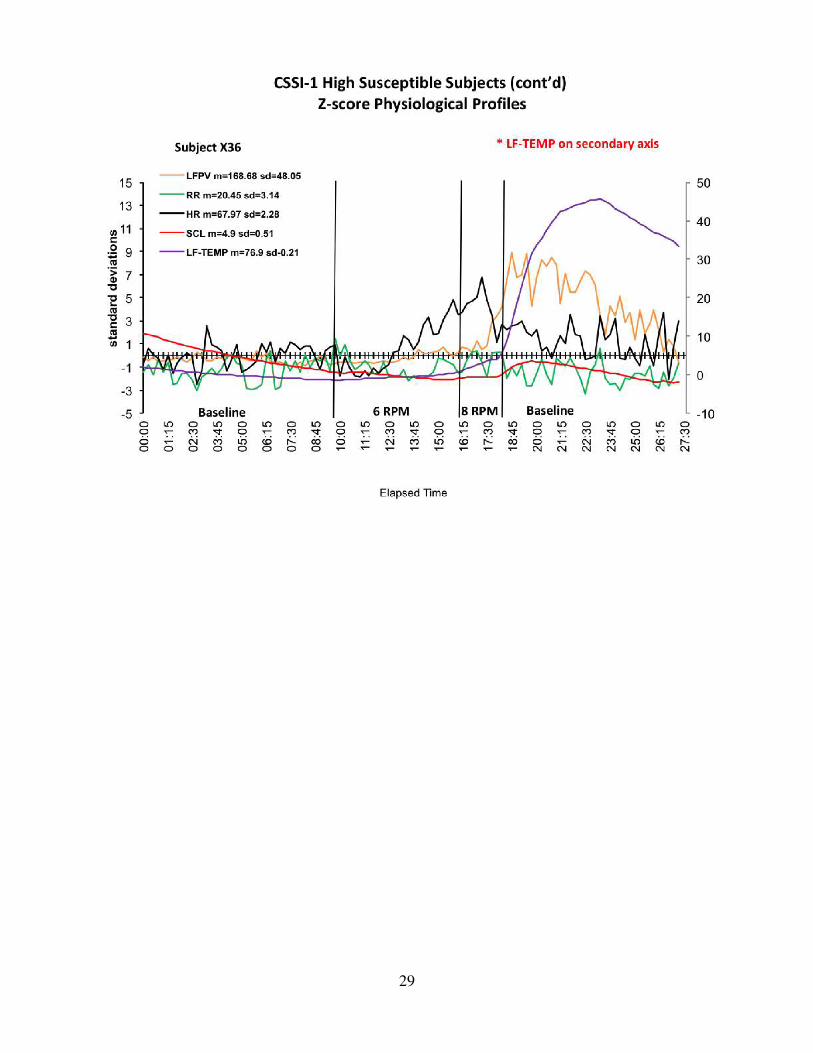
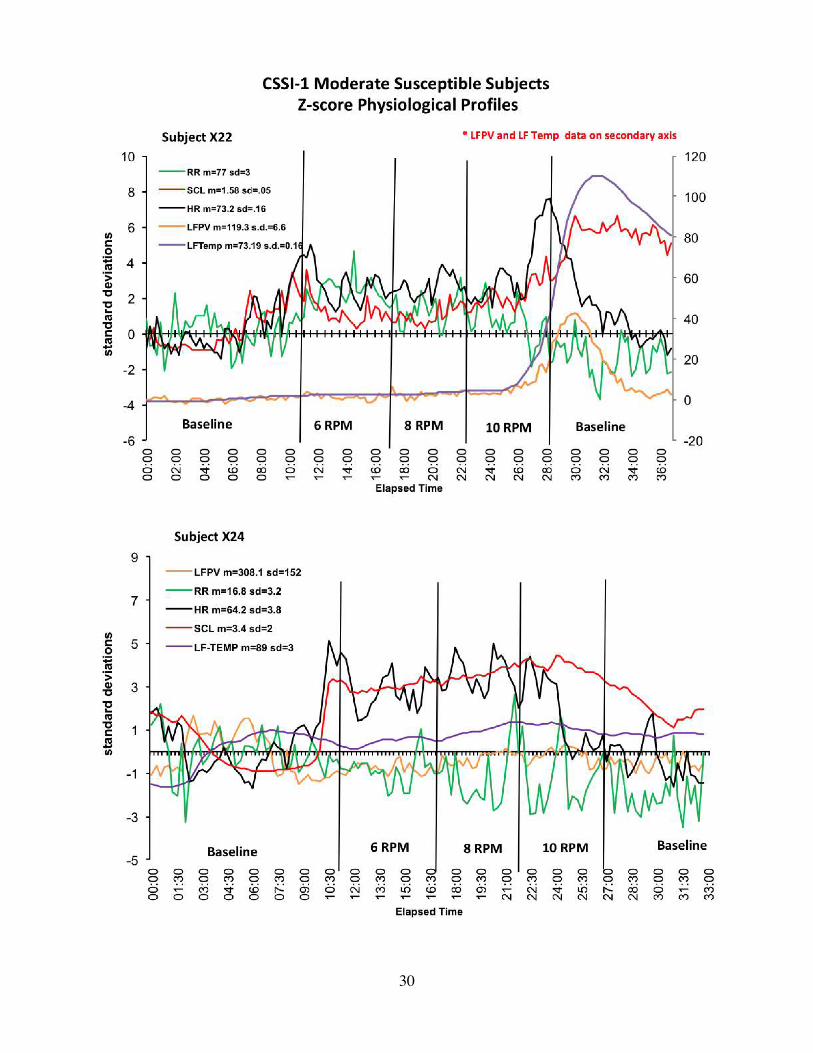
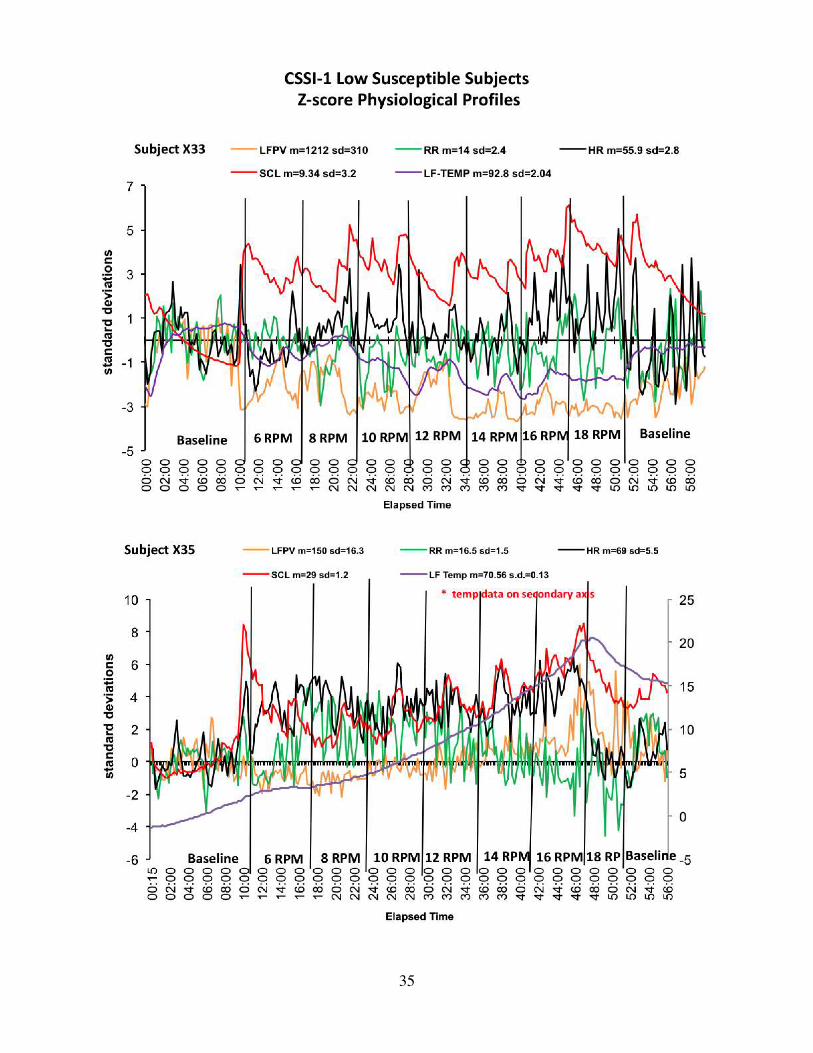
Appendix A. Standard Rotating Chair Tests of all Participants: Z-scores The data of the standard rotating chair test are included in Appendix A for all participants. Z-score graphs are ordered first with the subjects who were most susceptible to motion sickness (tolerated 6 to 8 rpm), followed by moderate susceptibles (tolerated 10 to 12 rpm) and low susceptibles (tolerated 14 rpm or more). Z-score normalization is used to characterize individual differences in “Physiological Stress Profiles.” It is important to note that that with these normalized scores it is readily seen that the physiological responses that changed most from baseline for all subjects were peripheral circulation and skin conductance and as such were most sensitive to this stimulus. Some subjects show vasoconstriction as a stress response (decreased skin temperature and reduced finger pulse volume) while others show the opposite responses. Some subjects show large magnitude changes in heart rate while some show little change in this response. All of the principles of psychophysiology are reflected in these data and are used to both characterize and interpret responses.
27
28
29
30

31

32

33

34
35

36

37

38
Appendix B. Training Data of All Treatment Subjects following 2 and 4 hours of AFTE The psychophysiological principle of Individual Response Stereotypy is apparent in these data. For example, some subjects who are “cardiac responders” show much larger learned changes in heart rate than others. Some subjects show little change in heart rate but make larger learned changes in cardiac output, peripheral blood volume, or skin conductance.
39
HighSusceptibleSubjects

40
HighSusceptibleSubjects(cont’d)

41
ModerateSusceptibleSubjects

42
ModerateSusceptibleSubjects(cont’d)

43
ModerateSusceptibleSubjects(cont’d)

44
ModerateSusceptibleSubjects(cont’d)

45

46
ModerateSusceptibleSubjects(cont’d)

47
LowSusceptibleSubjects

48
LowSusceptibleSubjects(cont’d)

49
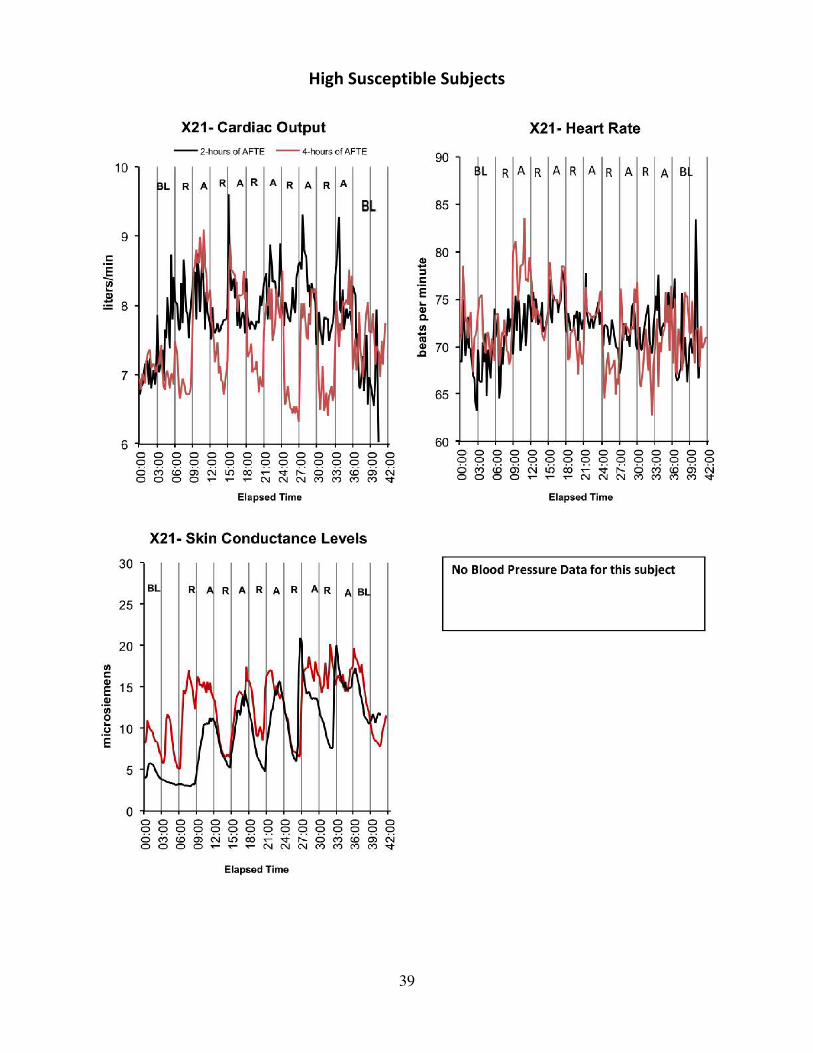
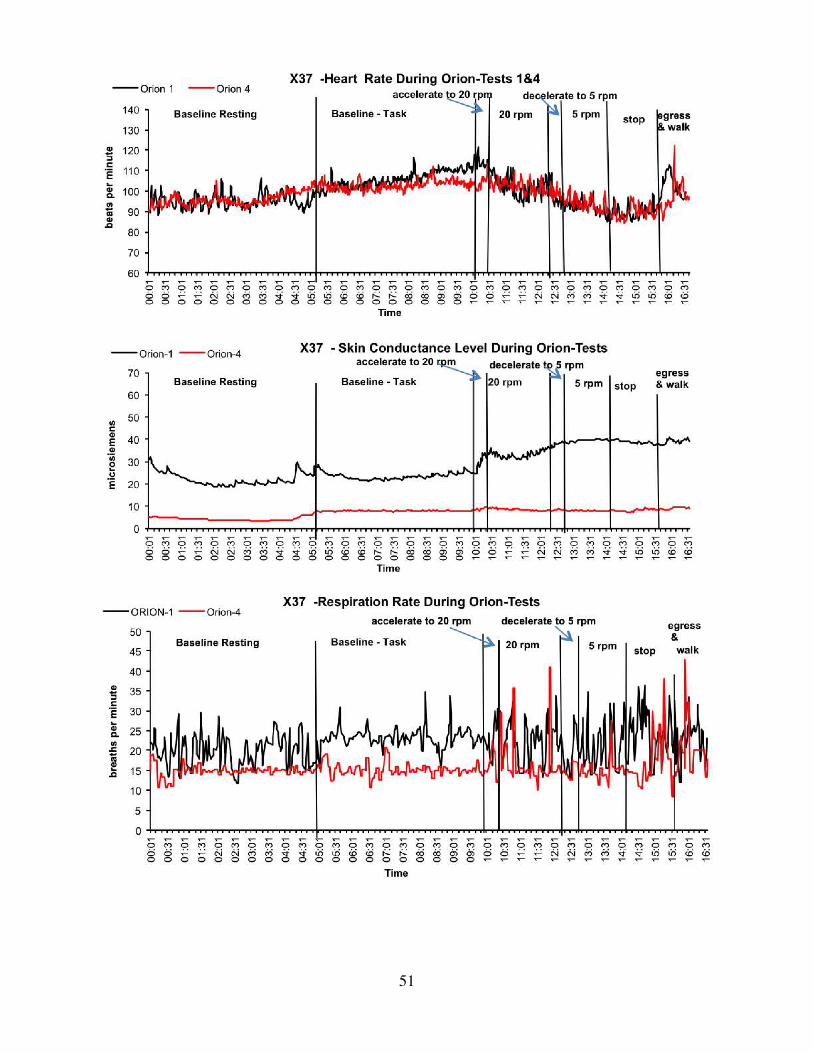
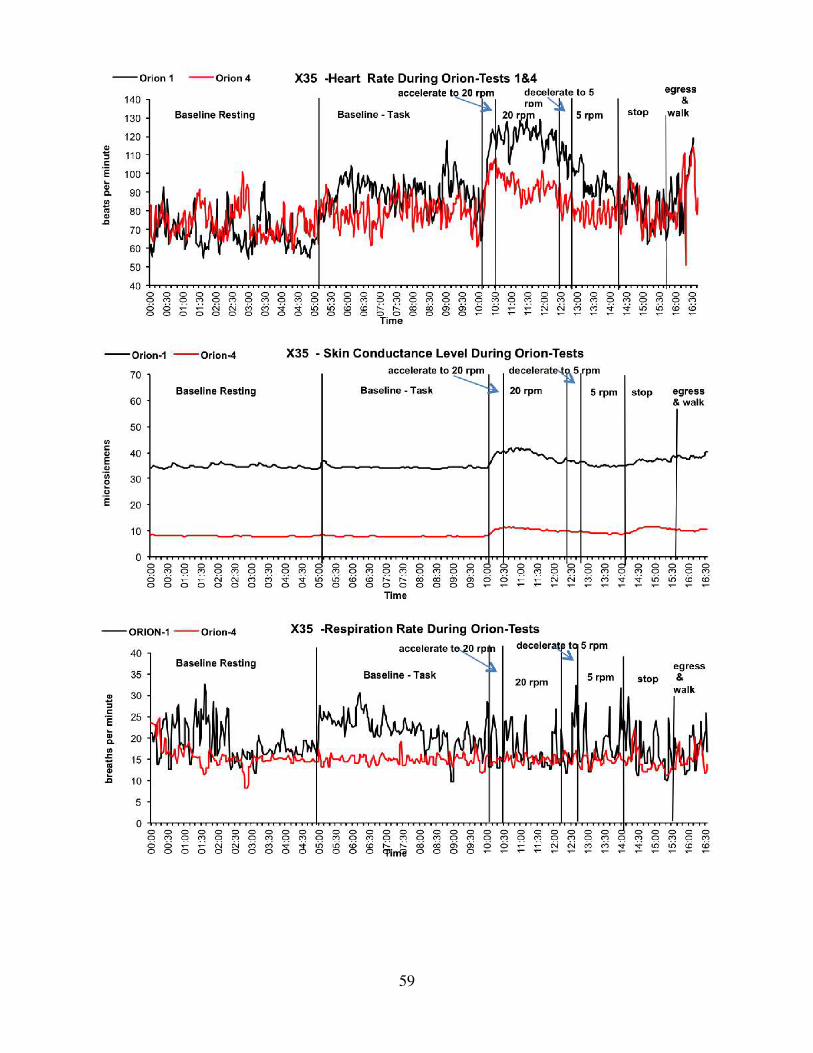
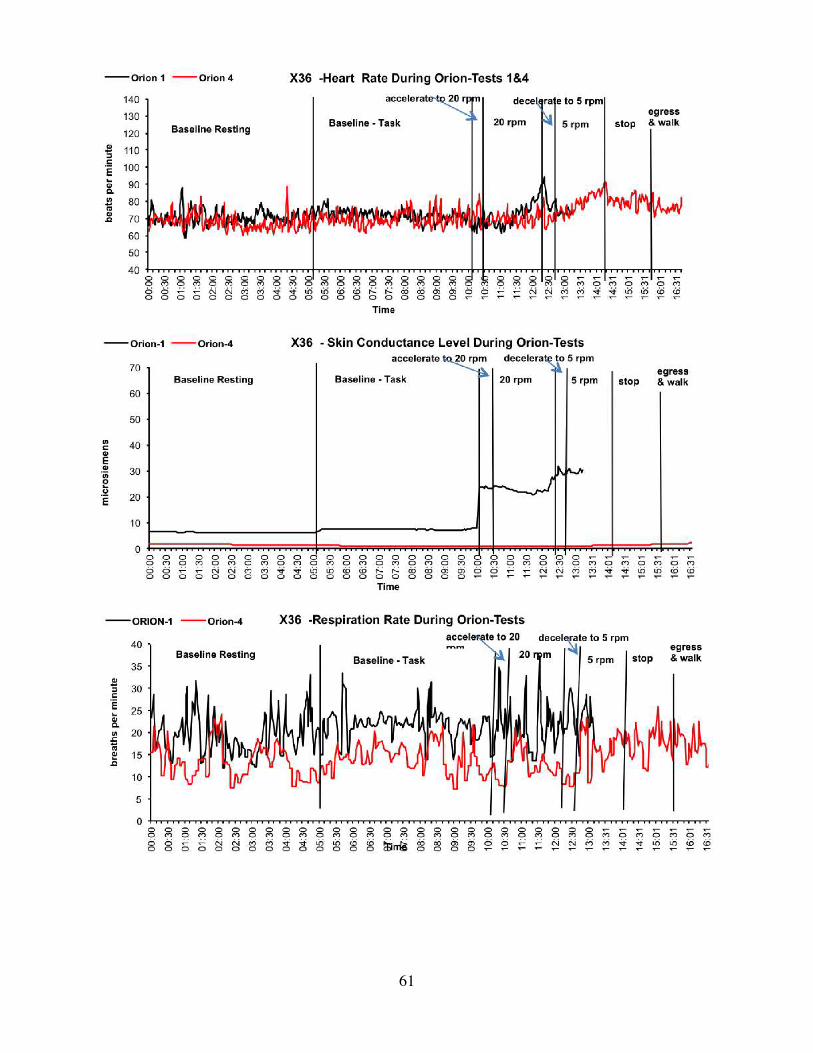
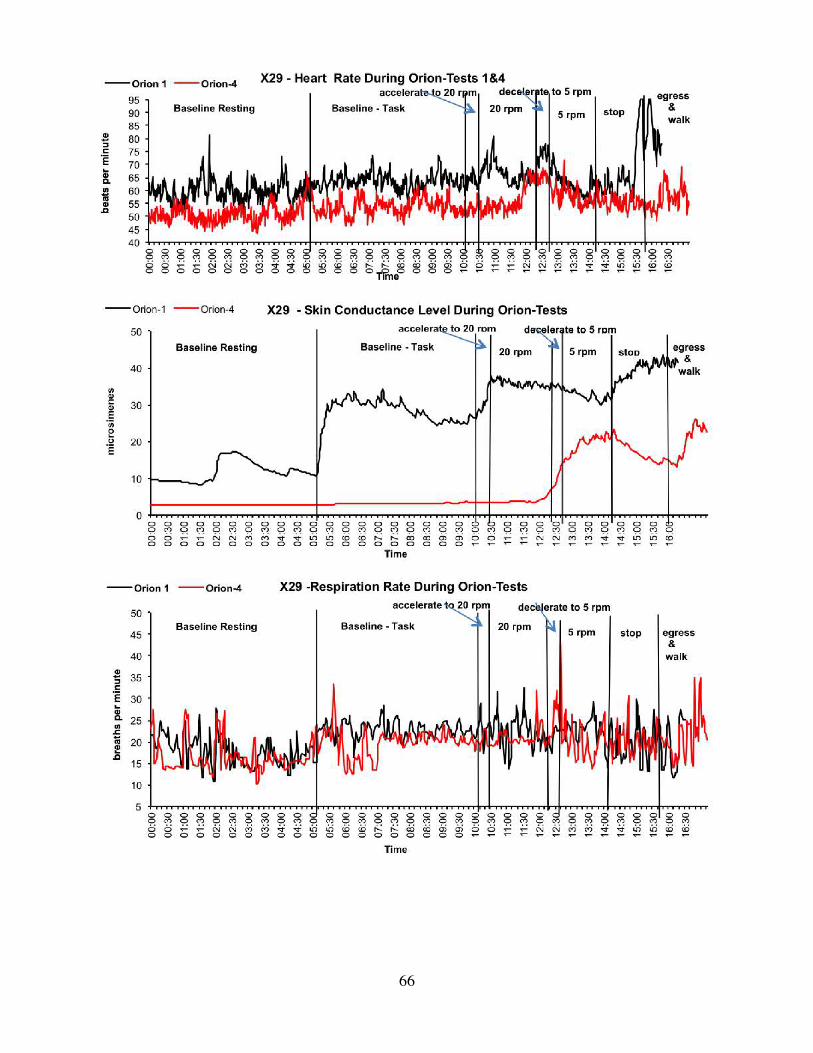
Appendix C. Physiological Data of all Participants during Simulated Orion Re-entry Tests 1 and 4
50
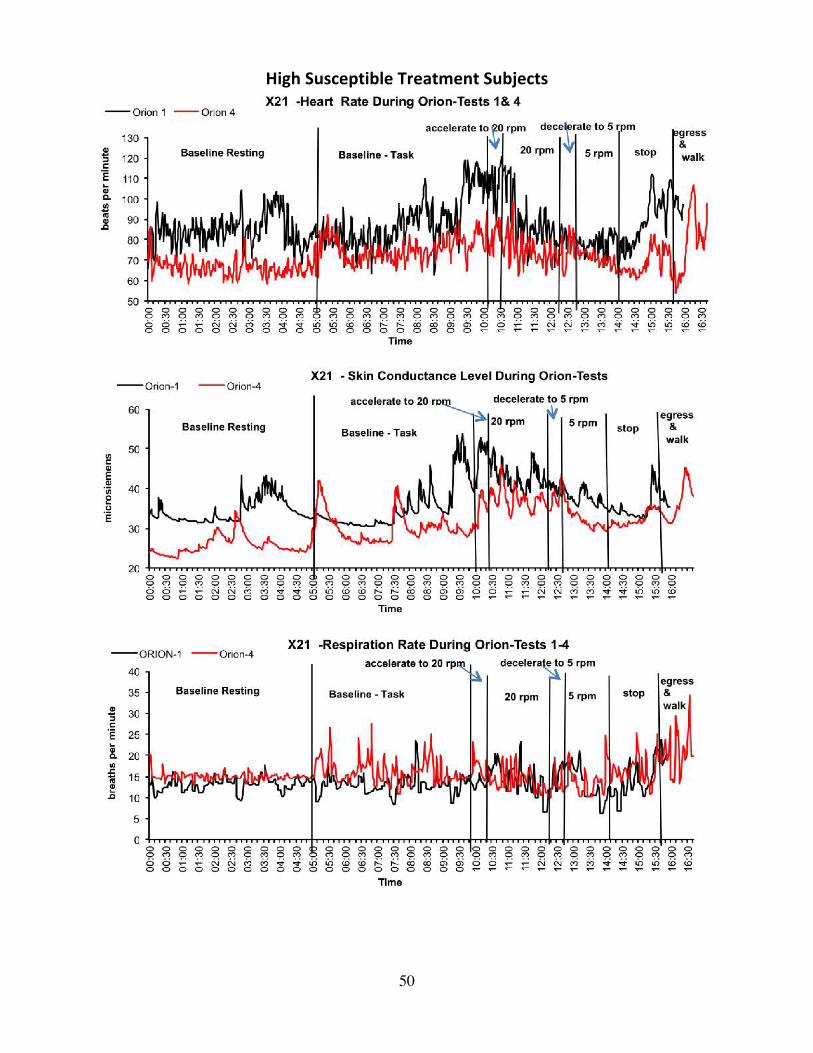
HighSusceptibleTreatmentSubjects
51

52
ModerateSusceptibleTreatmentSubjects

53

54

55

56

57
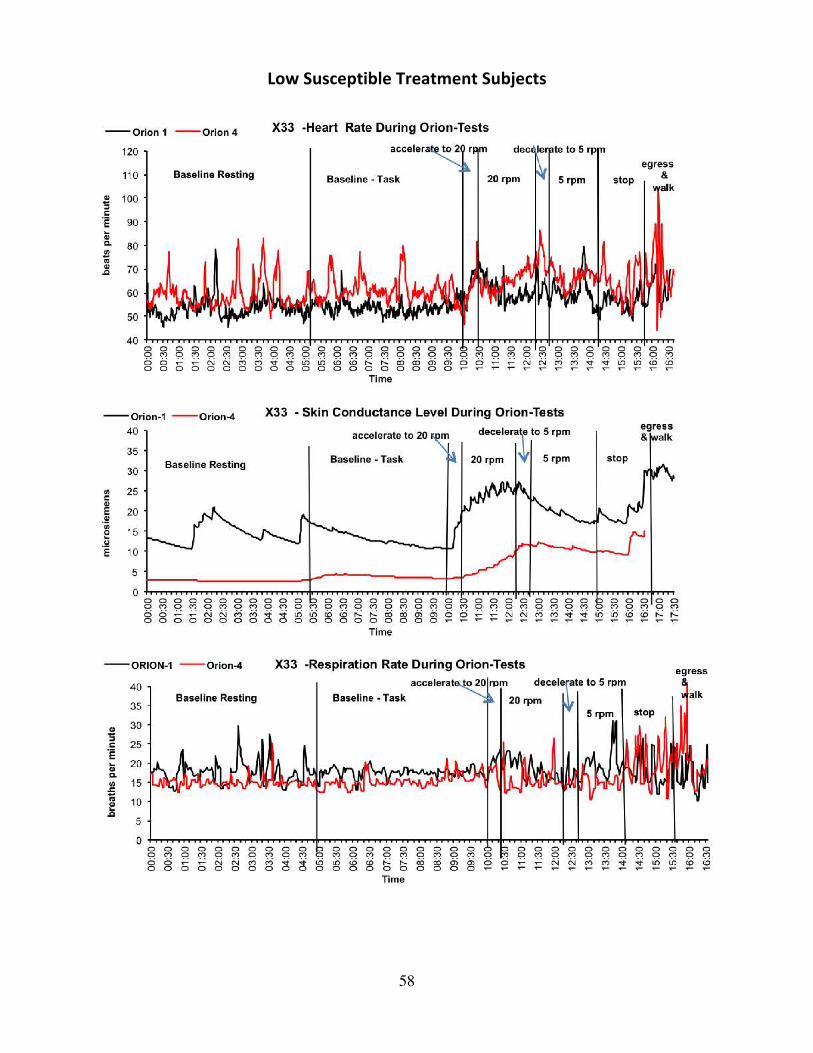
58
LowSusceptibleTreatmentSubjects
59

60
ControlGroup,HighSusceptibleSubjects
61

62

63

64
ModerateSusceptibleSubjects
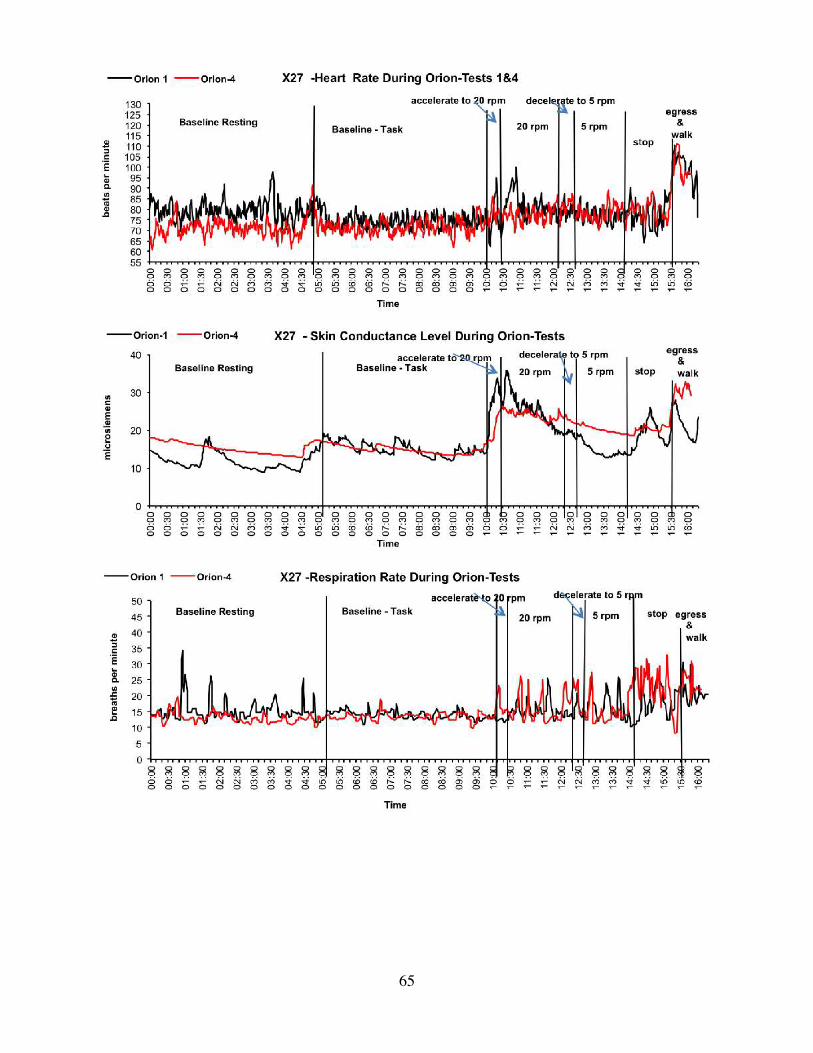
65
66

67
LowSusceptibleSubjects

68
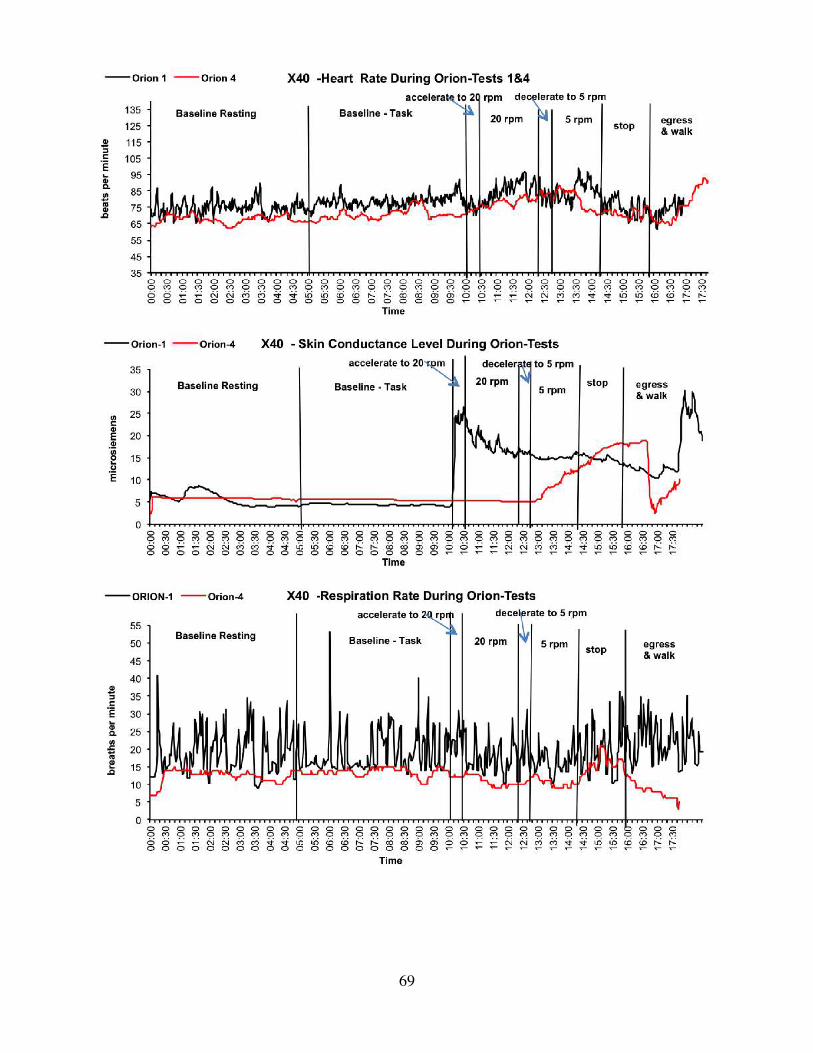
69