natcatservice loss events worldwide 2014 - … loss events worldwide 1980 – 2015 number of severe...
TRANSCRIPT
NatCatSERVICELoss events worldwide 1980 – 2015
March 2016

NatCatSERVICE
© 2016 Münchener Rückversicherungs-Gesellschaft, Geo Risks Research, NatCatSERVICE – As at March 2016
Natural loss events worldwide 2015 Geographical overview
1,060 registered
events
Source: Munich Re, NatCatSERVICE, 2016
DroughtUSA Jan–Oct
EarthquakeNepal 25 Apr
Winter Storm NiklasEurope 30 Mar–1 Apr
Severe stormsUSA 7–10 Apr
Typhoon MujigaeChina1–5 Oct
Severe stormsUSA 23–28 May
EarthquakePakistan, Afghanistan 26 Oct
Heat waveIndia, PakistanMay–Jun
TornadoChina 1 Jun
Winter stormAustralia19–24 Apr
Flash floodsChile 23–26 Mar
Flash floodsGhana2–5 Jun
FloodsMalawi, MozambiqueJan–Mar
LandslideGuatemala 1 Oct
Flash floodsUSA 2–6 Oct
Winter stormUSA, Canada 16–25 Feb
Severe stormsUSA 18–21 Apr
WildfiresUSA 12 Sep–8 Oct
Heat waveEuropeJun–Aug
Typhoon SoudelorChina, Taiwan 2–13 Aug
Meteorological events(Tropical storm, extratropical storm, convective storm, local storm)
Hydrological events(Flood, mass movement)
Climatological events(Extreme temperature, drought, forest fire)
Geophysical events(Earthquake, tsunami, volcanic activity)
Selection ofcatastrophes
Registered loss events

NatCatSERVICE
© 2016 Münchener Rückversicherungs-Gesellschaft, Geo Risks Research, NatCatSERVICE – As at March 2016
Loss events worldwide 1980 – 2015Number of relevant events by peril
Number
Accounted events have caused at least one fatality and/or produced normalized losses ≥ US$ 100k, 300k, 1m, or 3m (depending on the assigned World Bank income group of the affected country).
Meteorological events(Tropical storm, extratropical storm, convective storm, local storm)
Hydrological events(Flood, mass movement)
Climatological events(Extreme temperature, drought, forest fire)
Geophysical events(Earthquake, tsunami, volcanic activity)
NatCatSERVICE
© 2016 Münchener Rückversicherungs-Gesellschaft, Geo Risks Research, NatCatSERVICE – As at March 2016
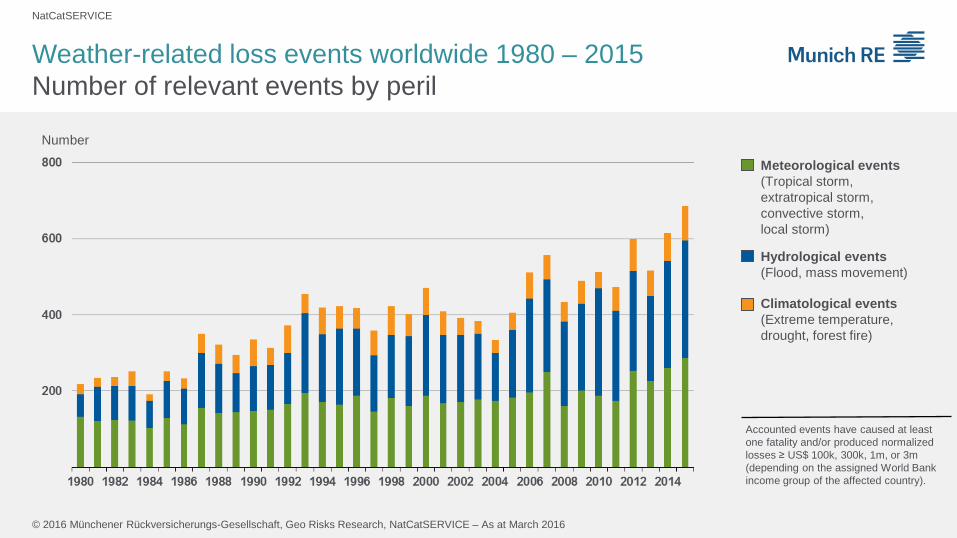
Weather-related loss events worldwide 1980 – 2015Number of relevant events by peril
Number
Accounted events have caused at least one fatality and/or produced normalized losses ≥ US$ 100k, 300k, 1m, or 3m (depending on the assigned World Bank income group of the affected country).
Meteorological events(Tropical storm, extratropical storm, convective storm, local storm)
Hydrological events(Flood, mass movement)
Climatological events(Extreme temperature, drought, forest fire)
NatCatSERVICE
© 2016 Münchener Rückversicherungs-Gesellschaft, Geo Risks Research, NatCatSERVICE – As at March 2016
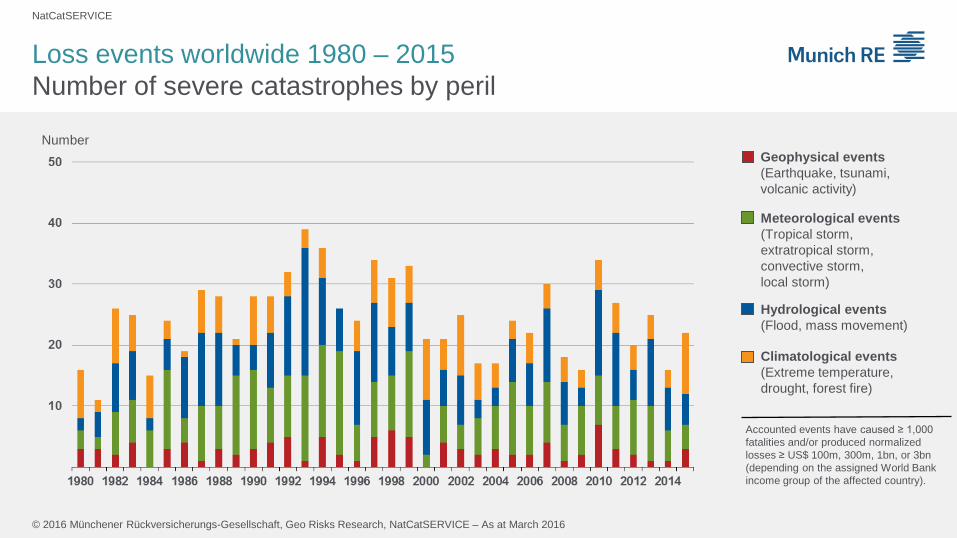
Loss events worldwide 1980 – 2015Number of severe catastrophes by peril
Number
Meteorological events(Tropical storm, extratropical storm, convective storm, local storm)
Hydrological events(Flood, mass movement)
Climatological events(Extreme temperature, drought, forest fire)
Geophysical events(Earthquake, tsunami, volcanic activity)
Accounted events have caused ≥ 1,000 fatalities and/or produced normalized losses ≥ US$ 100m, 300m, 1bn, or 3bn (depending on the assigned World Bank income group of the affected country).
NatCatSERVICE
© 2016 Münchener Rückversicherungs-Gesellschaft, Geo Risks Research, NatCatSERVICE – As at March 2016
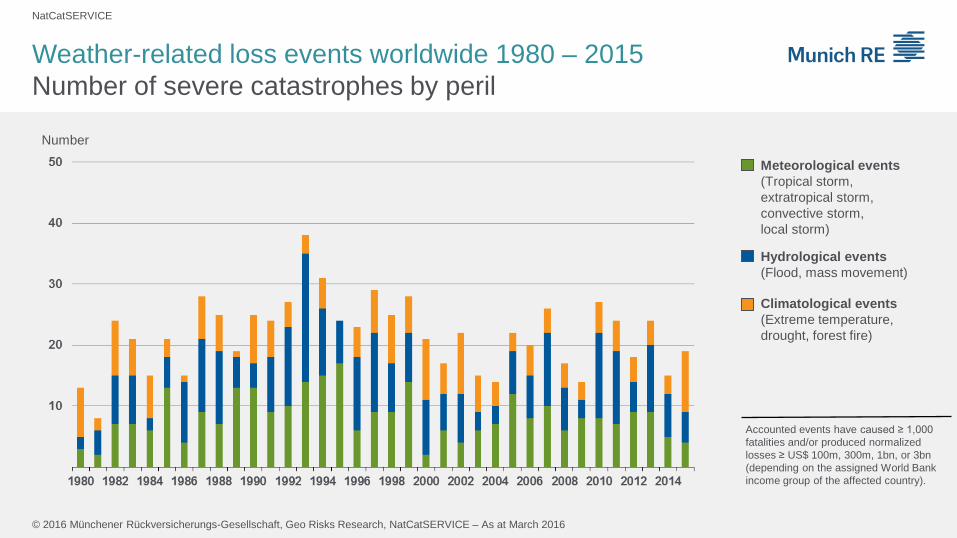
Weather-related loss events worldwide 1980 – 2015Number of severe catastrophes by peril
Number
Accounted events have caused ≥ 1,000 fatalities and/or produced normalized losses ≥ US$ 100m, 300m, 1bn, or 3bn (depending on the assigned World Bank income group of the affected country).
Meteorological events(Tropical storm, extratropical storm, convective storm, local storm)
Hydrological events(Flood, mass movement)
Climatological events(Extreme temperature, drought, forest fire)
NatCatSERVICE
© 2016 Münchener Rückversicherungs-Gesellschaft, Geo Risks Research, NatCatSERVICE – As at March 2016
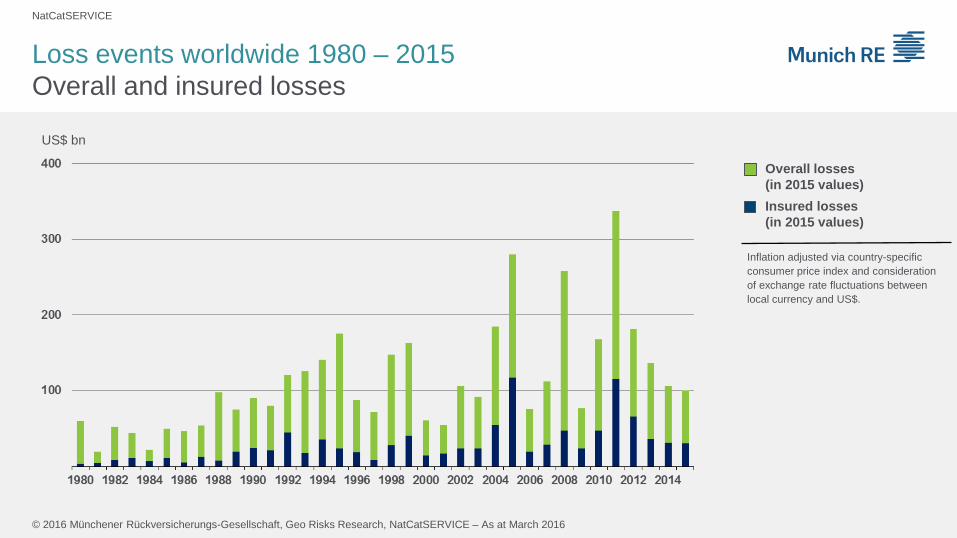
Loss events worldwide 1980 – 2015 Overall and insured losses
US$ bn
Overall losses (in 2015 values) Insured losses (in 2015 values)
Inflation adjusted via country-specific consumer price index and consideration of exchange rate fluctuations between local currency and US$.
NatCatSERVICE
© 2016 Münchener Rückversicherungs-Gesellschaft, Geo Risks Research, NatCatSERVICE – As at March 2016
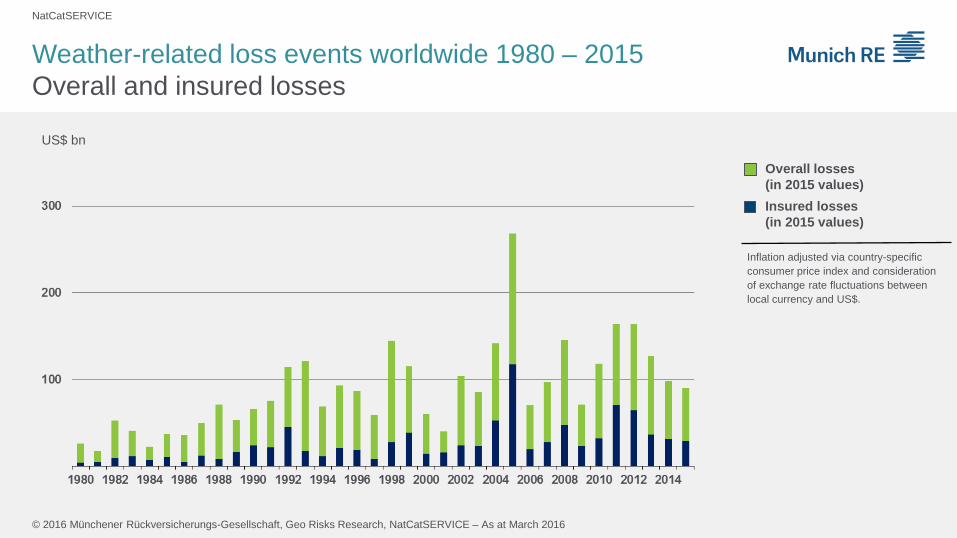
Weather-related loss events worldwide 1980 – 2015 Overall and insured losses
US$ bn
Overall losses (in 2015 values) Insured losses (in 2015 values)
Inflation adjusted via country-specific consumer price index and consideration of exchange rate fluctuations between local currency and US$.

NatCatSERVICE
© 2016 Münchener Rückversicherungs-Gesellschaft, Geo Risks Research, NatCatSERVICE – As at March 2016
Loss events worldwide 1980 – 2015Overall losses: nominal, inflation adjusted, and normalized
US$ bn
Nominal overall losses
Inflation adjusted overall losses
Normalized overall losses
Inflation adjusted via country-specific consumer price index and consideration of exchange rate fluctuations between local currency and US$.
Normalization via local GDP developments measured in US$.
NatCatSERVICE
© 2016 Münchener Rückversicherungs-Gesellschaft, Geo Risks Research, NatCatSERVICE – As at March 2016
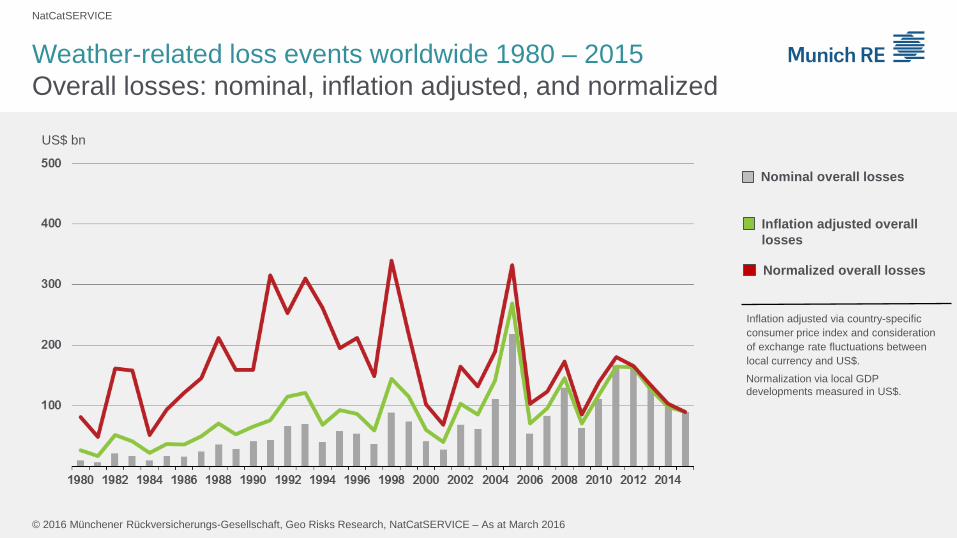
Weather-related loss events worldwide 1980 – 2015Overall losses: nominal, inflation adjusted, and normalized
US$ bn
Nominal overall losses
Inflation adjusted overall losses
Normalized overall losses
Inflation adjusted via country-specific consumer price index and consideration of exchange rate fluctuations between local currency and US$.
Normalization via local GDP developments measured in US$.
NatCatSERVICE
© 2016 Münchener Rückversicherungs-Gesellschaft, Geo Risks Research, NatCatSERVICE – As at March 2016
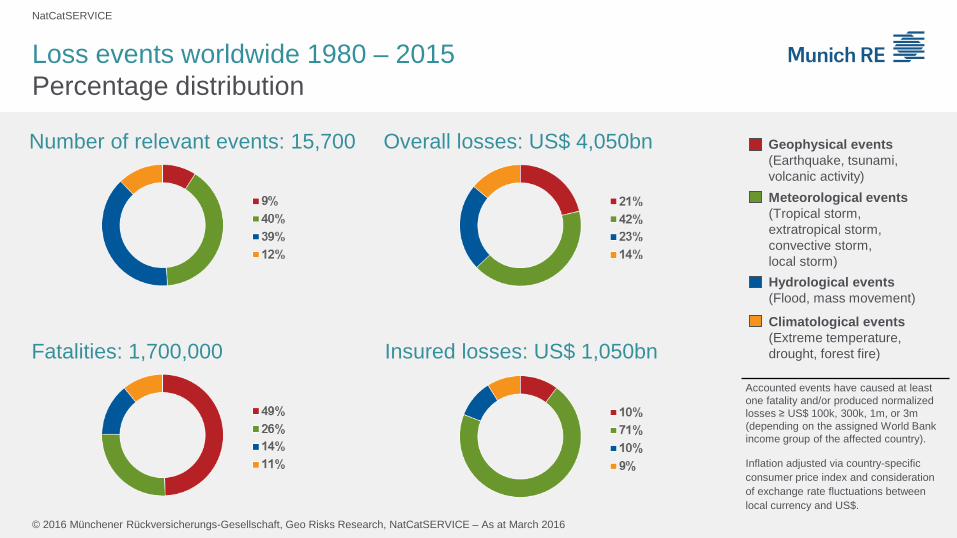
Loss events worldwide 1980 – 2015Percentage distribution
Overall losses: US$ 4,050bn Number of relevant events: 15,700
Fatalities: 1,700,000 Insured losses: US$ 1,050bn
Meteorological events(Tropical storm, extratropical storm, convective storm, local storm)Hydrological events(Flood, mass movement)
Climatological events(Extreme temperature, drought, forest fire)
Geophysical events(Earthquake, tsunami, volcanic activity)
Inflation adjusted via country-specific consumer price index and consideration of exchange rate fluctuations between local currency and US$.
Accounted events have caused at least one fatality and/or produced normalized losses ≥ US$ 100k, 300k, 1m, or 3m (depending on the assigned World Bank income group of the affected country).

NatCatSERVICE
© 2016 Münchener Rückversicherungs-Gesellschaft, Geo Risks Research, NatCatSERVICE – As at March 2016
Weather-related loss events worldwide 1980 – 2015Percentage distribution
Overall losses: US$ 3,200bn Number of relevant events: 14,300
Fatalities: 860,000 Insured losses: US$ 940bn
Meteorological events(Tropical storm, extratropical storm, convective storm, local storm)Hydrological events(Flood, mass movement)
Climatological events(Extreme temperature, drought, forest fire)
Inflation adjusted via country-specific consumer price index and consideration of exchange rate fluctuations between local currency and US$.
Accounted events have caused at least one fatality and/or produced normalized losses ≥ US$ 100k, 300k, 1m, or 3m (depending on the assigned World Bank income group of the affected country).
NatCatSERVICE
© 2016 Münchener Rückversicherungs-Gesellschaft, Geo Risks Research, NatCatSERVICE – As at March 2016
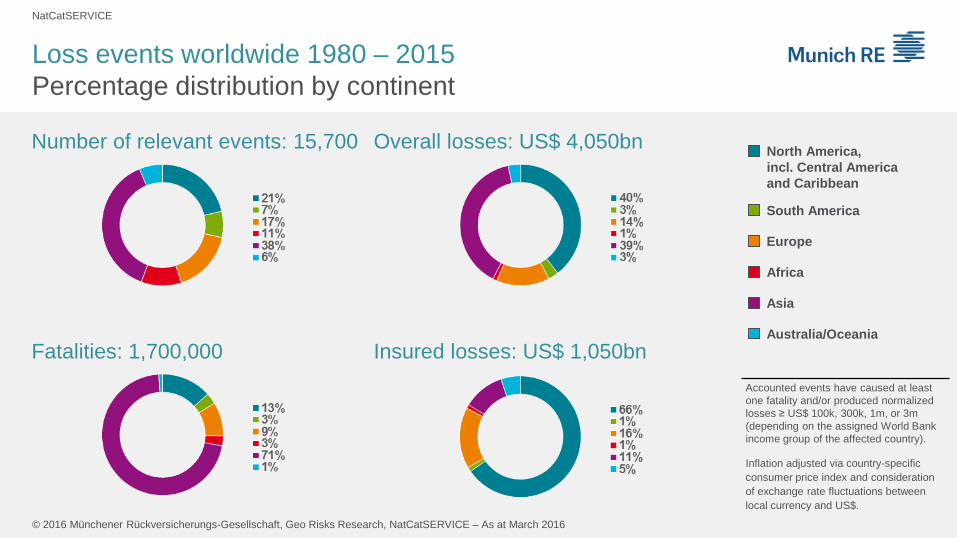
Loss events worldwide 1980 – 2015 Percentage distribution by continent
South America
Europe
Africa
North America, incl. Central Americaand Caribbean
Asia
Australia/Oceania
Overall losses: US$ 4,050bn Number of relevant events: 15,700
Fatalities: 1,700,000 Insured losses: US$ 1,050bn
Inflation adjusted via country-specific consumer price index and consideration of exchange rate fluctuations between local currency and US$.
Accounted events have caused at least one fatality and/or produced normalized losses ≥ US$ 100k, 300k, 1m, or 3m (depending on the assigned World Bank income group of the affected country).

NatCatSERVICE
© 2016 Münchener Rückversicherungs-Gesellschaft, Geo Risks Research, NatCatSERVICE – As at March 2016
Weather-related loss events worldwide 1980 – 2015 Percentage distribution by continent
South America
Europe
Africa
North America, incl. Central Americaand Caribbean
Asia
Australia/Oceania
Overall losses: US$ 3,200bn Number of relevant events: 14,300
Fatalities: 860,000 Insured losses: US$ 940bn
Inflation adjusted via country-specific consumer price index and consideration of exchange rate fluctuations between local currency and US$.
Accounted events have caused at least one fatality and/or produced normalized losses ≥ US$ 100k, 300k, 1m, or 3m (depending on the assigned World Bank income group of the affected country).
NatCatSERVICE
© 2016 Münchener Rückversicherungs-Gesellschaft, Geo Risks Research, NatCatSERVICE – As at March 2016
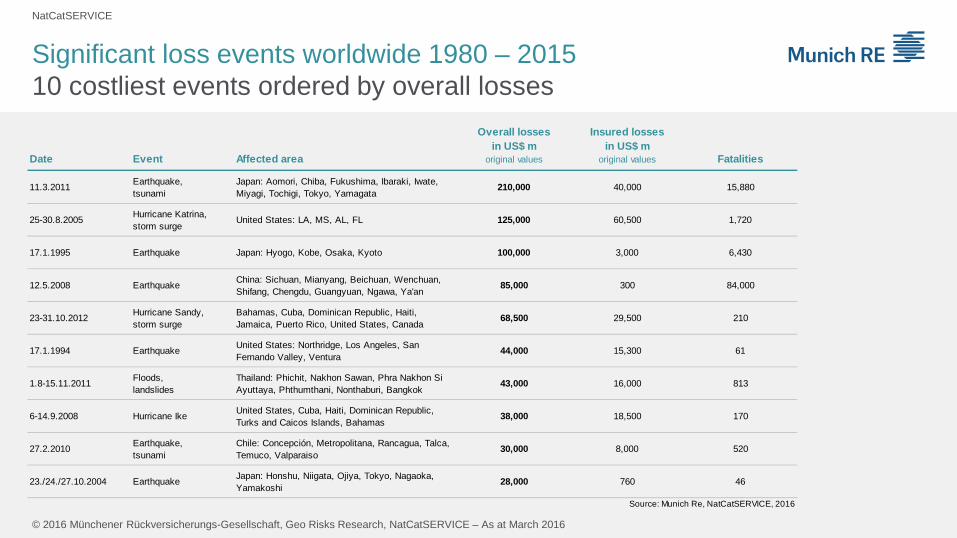
Significant loss events worldwide 1980 – 201510 costliest events ordered by overall losses
Date Event Affected area
Overall lossesin US$ m
original values
Insured lossesin US$ m
original values Fatalities
11.3.2011 Earthquake, tsunami
Japan: Aomori, Chiba, Fukushima, Ibaraki, Iwate, Miyagi, Tochigi, Tokyo, Yamagata
210,000 40,000 15,880
25-30.8.2005 Hurricane Katrina, storm surge
United States: LA, MS, AL, FL 125,000 60,500 1,720
17.1.1995 Earthquake Japan: Hyogo, Kobe, Osaka, Kyoto 100,000 3,000 6,430
12.5.2008 Earthquake China: Sichuan, Mianyang, Beichuan, Wenchuan, Shifang, Chengdu, Guangyuan, Ngawa, Ya'an
85,000 300 84,000
23-31.10.2012 Hurricane Sandy, storm surge
Bahamas, Cuba, Dominican Republic, Haiti, Jamaica, Puerto Rico, United States, Canada
68,500 29,500 210
17.1.1994 Earthquake United States: Northridge, Los Angeles, San Fernando Valley, Ventura
44,000 15,300 61
1.8-15.11.2011 Floods, landslides
Thailand: Phichit, Nakhon Sawan, Phra Nakhon Si Ayuttaya, Phthumthani, Nonthaburi, Bangkok
43,000 16,000 813
6-14.9.2008 Hurricane Ike United States, Cuba, Haiti, Dominican Republic, Turks and Caicos Islands, Bahamas
38,000 18,500 170
27.2.2010 Earthquake, tsunami
Chile: Concepción, Metropolitana, Rancagua, Talca, Temuco, Valparaiso
30,000 8,000 520
23./24./27.10.2004 Earthquake Japan: Honshu, Niigata, Ojiya, Tokyo, Nagaoka, Yamakoshi
28,000 760 46
Source: Munich Re, NatCatSERVICE, 2016

NatCatSERVICE
© 2016 Münchener Rückversicherungs-Gesellschaft, Geo Risks Research, NatCatSERVICE – As at March 2016
Significant loss events worldwide 1980 – 201510 costliest events ordered by insured losses
Date Event Affected area
Overall lossesin US$ m
original values
Insured lossesin US$ m
original values Fatalities
25-30.8.2005 Hurricane Katrina, storm surge
United States: LA, MS, AL, FL 125,000 60,500 1,720
11.3.2011 Earthquake, tsunami
Japan: Aomori, Chiba, Fukushima, Ibaraki, Iwate, Miyagi, Tochigi, Tokyo, Yamagata
210,000 40,000 15,880
23-31.10.2012 Hurricane Sandy, storm surge
Bahamas, Cuba, Dominican Republic, Haiti, Jamaica, Puerto Rico, United States, Canada
68,500 29,500 210
6-14.9.2008 Hurricane Ike United States, Cuba, Haiti, Dominican Republic, Turks and Caicos Islands, Bahamas
38,000 18,500 170
23-27.8.1992 Hurricane Andrew United States: FL, LA; Bahamas 26,500 17,000 62
22.2.2011 Earthquake New Zealand: Canterbury, Christchurch, Lyttelton 24,000 16,500 185
1.8-15.11.2011 Floods, landslides
Thailand: Phichit, Nakhon Sawan, Phra Nakhon Si Ayuttaya, Phthumthani, Nonthaburi, Bangkok
43,000 16,000 813
17.1.1994 Earthquake United States: Northridge, Los Angeles, San Fernando Valley, Ventura
44,000 15,300 61
19-24.10.2005 Hurricane Wilma Bahamas, Cuba, Haiti, Jamaica, Mexico, United States
22,000 12,500 44
June - September 2012
Drought United States: AR, CO, GA, IA, IL, IN, KS, KY, MO, MS, MT, NE, OH, OK, SD, TN, TX, WI, WY
25,000 12,000
Source: Munich Re, NatCatSERVICE, 2016
NatCatSERVICE
© 2016 Münchener Rückversicherungs-Gesellschaft, Geo Risks Research, NatCatSERVICE – As at March 2016
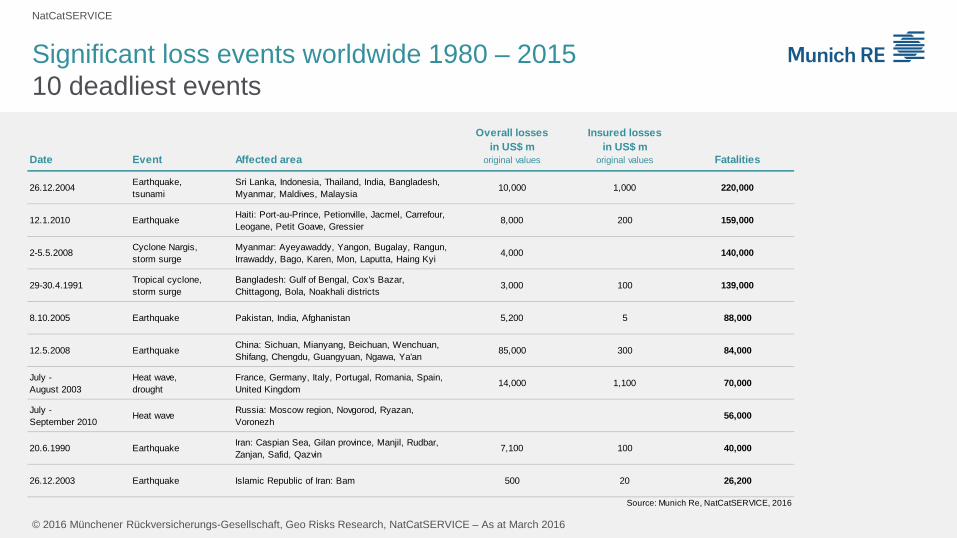
Significant loss events worldwide 1980 – 201510 deadliest events
Date Event Affected area
Overall lossesin US$ m
original values
Insured lossesin US$ m
original values Fatalities
26.12.2004 Earthquake, tsunami
Sri Lanka, Indonesia, Thailand, India, Bangladesh, Myanmar, Maldives, Malaysia
10,000 1,000 220,000
12.1.2010 Earthquake Haiti: Port-au-Prince, Petionville, Jacmel, Carrefour, Leogane, Petit Goave, Gressier
8,000 200 159,000
2-5.5.2008 Cyclone Nargis, storm surge
Myanmar: Ayeyawaddy, Yangon, Bugalay, Rangun, Irrawaddy, Bago, Karen, Mon, Laputta, Haing Kyi
4,000 140,000
29-30.4.1991 Tropical cyclone, storm surge
Bangladesh: Gulf of Bengal, Cox's Bazar, Chittagong, Bola, Noakhali districts
3,000 100 139,000
8.10.2005 Earthquake Pakistan, India, Afghanistan 5,200 5 88,000
12.5.2008 Earthquake China: Sichuan, Mianyang, Beichuan, Wenchuan, Shifang, Chengdu, Guangyuan, Ngawa, Ya'an
85,000 300 84,000
July - August 2003
Heat wave, drought
France, Germany, Italy, Portugal, Romania, Spain, United Kingdom
14,000 1,100 70,000
July - September 2010
Heat wave Russia: Moscow region, Novgorod, Ryazan, Voronezh
56,000
20.6.1990 Earthquake Iran: Caspian Sea, Gilan province, Manjil, Rudbar, Zanjan, Safid, Qazvin
7,100 100 40,000
26.12.2003 Earthquake Islamic Republic of Iran: Bam 500 20 26,200
Source: Munich Re, NatCatSERVICE, 2016
NatCatSERVICE
© 2016 Münchener Rückversicherungs-Gesellschaft, Geo Risks Research, NatCatSERVICE – As at March 2016
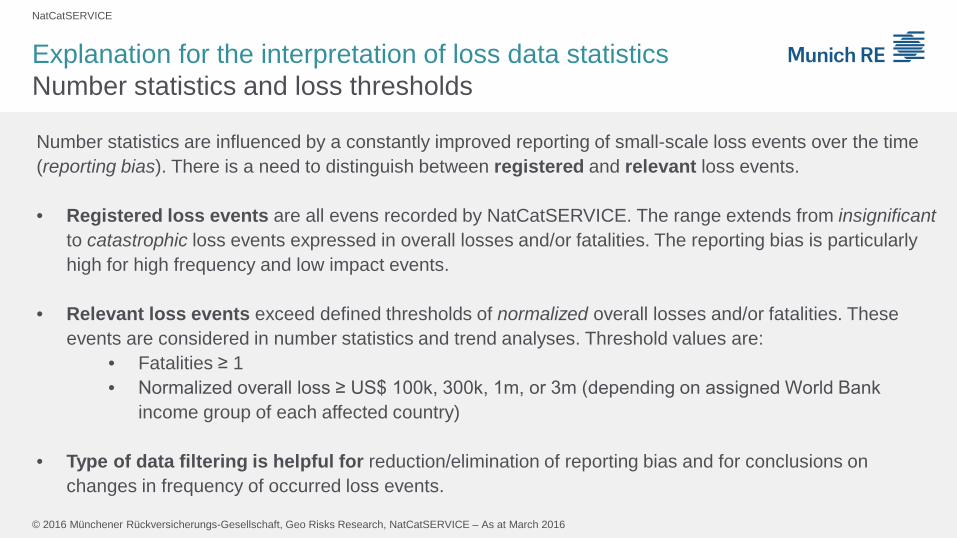
Number statistics are influenced by a constantly improved reporting of small-scale loss events over the time (reporting bias). There is a need to distinguish between registered and relevant loss events.
• Registered loss events are all evens recorded by NatCatSERVICE. The range extends from insignificantto catastrophic loss events expressed in overall losses and/or fatalities. The reporting bias is particularly high for high frequency and low impact events.
• Relevant loss events exceed defined thresholds of normalized overall losses and/or fatalities. These events are considered in number statistics and trend analyses. Threshold values are:
• Fatalities ≥ 1• Normalized overall loss ≥ US$ 100k, 300k, 1m, or 3m (depending on assigned World Bank
income group of each affected country)
• Type of data filtering is helpful for reduction/elimination of reporting bias and for conclusions on changes in frequency of occurred loss events.
Explanation for the interpretation of loss data statisticsNumber statistics and loss thresholds
NatCatSERVICE
© 2016 Münchener Rückversicherungs-Gesellschaft, Geo Risks Research, NatCatSERVICE – As at March 2016
Explanation for the interpretation of loss data statisticsInflation adjustment and normalization of NatCat loss dataThree ways of presenting loss data:
• Nominal losses: values as they originally occurred• Inflation adjusted losses: accounting for changes in monetary equivalent• Normalized losses: accounting for growth of values and assets
Inflation adjustment: Loss value in local currency is adjusted to inflation via the country’s consumer price index (CPI) under consideration of exchange rate fluctuations between the local currency and the US$.
Normalization: Loss value in US$ is normalized via the development of locally resolved (1°x1°) nominal gross domestic product data in US$ between year of occurrence and today.
Inflation adjusted loss data is helpful for…• How high would a historic loss value be in today’s money?
Normalized loss data is helpful for…• What losses would a historic event cause when exposing today’s values and assets?• Conclusions on loss drivers like changes on the hazard side or effectivity of
prevention measures