national adult cardiac surgery audit (nacsa)
TRANSCRIPT
NATIONAL ADULT CARDIAC SURGERY AUDIT
(NACSA)2020 SUMMARY REPORT (2016/17-2018/19 DATA)
CONTENTS
Executive summary 1
1. Introduction 31.1 Activity levels and trends: similar numbers of operations overall, but fewer elective CABG operations 31.2 Reassuringly low mortality rates but variable morbidity rates 4
2. Quality Improvement Metrics 72.1 No improvement in proportion of urgent CABG performed within 7 days of coronary angiography 72.2 Some improvement in proportion of elective cardiac operations with day of surgery admission (DOSA) but more
patients could be offered this 92.3 No improvement in waiting times for elective CABG 112.4 Higher proportion of first time CABG patients having urgent surgery 132.5 Patients are experiencing a shorter post-op length of stay (PLOS) following first time CABG 15
3. Areas for moving towards quality improvement metrics 173.1 Aortic Valve Replacement (AVR) 173.2 Emergency Aortic Surgery 22
References 28
Thanks and acknowledgements 29
1 National Adult Cardiac Surgery Audit (NACSA) 2020 Summary Report (2016/17-2018/19 data)
EXECUTIVE SUMMARY
PROCEDURE NUMBERS
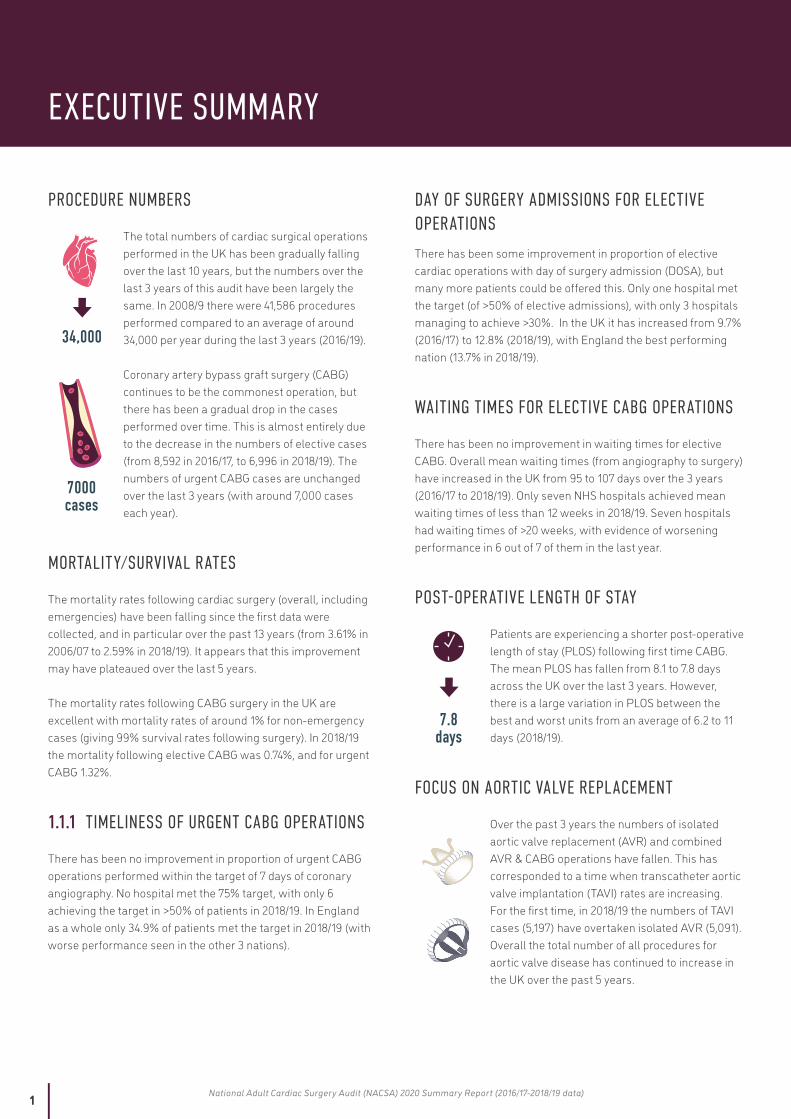
The total numbers of cardiac surgical operations performed in the UK has been gradually falling over the last 10 years, but the numbers over the last 3 years of this audit have been largely the same. In 2008/9 there were 41,586 procedures performed compared to an average of around 34,000 per year during the last 3 years (2016/19).
Coronary artery bypass graft surgery (CABG) continues to be the commonest operation, but there has been a gradual drop in the cases performed over time. This is almost entirely due to the decrease in the numbers of elective cases (from 8,592 in 2016/17, to 6,996 in 2018/19). The numbers of urgent CABG cases are unchanged over the last 3 years (with around 7,000 cases each year).
MORTALITY/SURVIVAL RATES
The mortality rates following cardiac surgery (overall, including emergencies) have been falling since the first data were collected, and in particular over the past 13 years (from 3.61% in 2006/07 to 2.59% in 2018/19). It appears that this improvement may have plateaued over the last 5 years.
The mortality rates following CABG surgery in the UK are excellent with mortality rates of around 1% for non-emergency cases (giving 99% survival rates following surgery). In 2018/19 the mortality following elective CABG was 0.74%, and for urgent CABG 1.32%.
1.1.1 TIMELINESS OF URGENT CABG OPERATIONS
There has been no improvement in proportion of urgent CABG operations performed within the target of 7 days of coronary angiography. No hospital met the 75% target, with only 6 achieving the target in >50% of patients in 2018/19. In England as a whole only 34.9% of patients met the target in 2018/19 (with worse performance seen in the other 3 nations).
DAY OF SURGERY ADMISSIONS FOR ELECTIVE OPERATIONS
There has been some improvement in proportion of elective cardiac operations with day of surgery admission (DOSA), but many more patients could be offered this. Only one hospital met the target (of >50% of elective admissions), with only 3 hospitals managing to achieve >30%. In the UK it has increased from 9.7% (2016/17) to 12.8% (2018/19), with England the best performing nation (13.7% in 2018/19).
WAITING TIMES FOR ELECTIVE CABG OPERATIONS
There has been no improvement in waiting times for elective CABG. Overall mean waiting times (from angiography to surgery) have increased in the UK from 95 to 107 days over the 3 years (2016/17 to 2018/19). Only seven NHS hospitals achieved mean waiting times of less than 12 weeks in 2018/19. Seven hospitals had waiting times of >20 weeks, with evidence of worsening performance in 6 out of 7 of them in the last year.
POST-OPERATIVE LENGTH OF STAY
Patients are experiencing a shorter post-operative length of stay (PLOS) following first time CABG. The mean PLOS has fallen from 8.1 to 7.8 days across the UK over the last 3 years. However, there is a large variation in PLOS between the best and worst units from an average of 6.2 to 11 days (2018/19).
FOCUS ON AORTIC VALVE REPLACEMENT
Over the past 3 years the numbers of isolated aortic valve replacement (AVR) and combined AVR & CABG operations have fallen. This has corresponded to a time when transcatheter aortic valve implantation (TAVI) rates are increasing. For the first time, in 2018/19 the numbers of TAVI cases (5,197) have overtaken isolated AVR (5,091). Overall the total number of all procedures for aortic valve disease has continued to increase in the UK over the past 5 years.
7000 cases
7.8days
34,000
2 National Adult Cardiac Surgery Audit (NACSA) 2020 Summary Report (2016/17-2018/19 data)
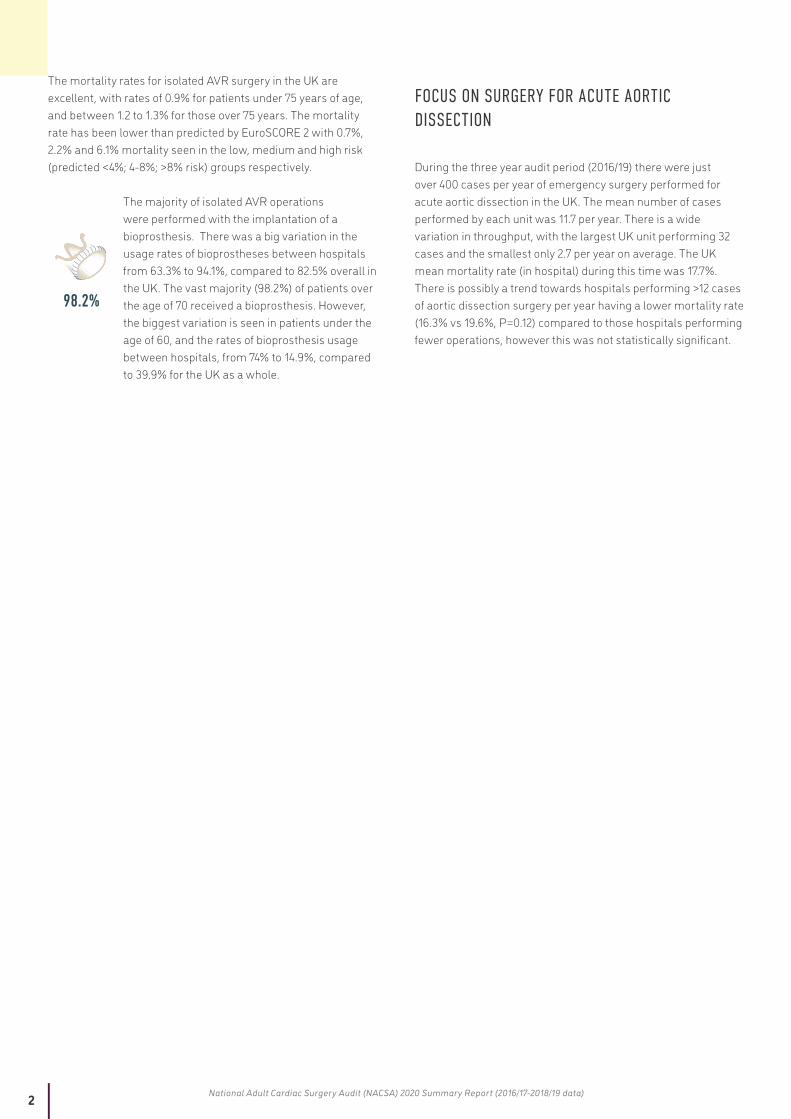
The mortality rates for isolated AVR surgery in the UK are excellent, with rates of 0.9% for patients under 75 years of age, and between 1.2 to 1.3% for those over 75 years. The mortality rate has been lower than predicted by EuroSCORE 2 with 0.7%, 2.2% and 6.1% mortality seen in the low, medium and high risk (predicted <4%; 4-8%; >8% risk) groups respectively.
The majority of isolated AVR operations were performed with the implantation of a bioprosthesis. There was a big variation in the usage rates of bioprostheses between hospitals from 63.3% to 94.1%, compared to 82.5% overall in the UK. The vast majority (98.2%) of patients over the age of 70 received a bioprosthesis. However, the biggest variation is seen in patients under the age of 60, and the rates of bioprosthesis usage between hospitals, from 74% to 14.9%, compared to 39.9% for the UK as a whole.
FOCUS ON SURGERY FOR ACUTE AORTIC DISSECTION
During the three year audit period (2016/19) there were just over 400 cases per year of emergency surgery performed for acute aortic dissection in the UK. The mean number of cases performed by each unit was 11.7 per year. There is a wide variation in throughput, with the largest UK unit performing 32 cases and the smallest only 2.7 per year on average. The UK mean mortality rate (in hospital) during this time was 17.7%. There is possibly a trend towards hospitals performing >12 cases of aortic dissection surgery per year having a lower mortality rate (16.3% vs 19.6%, P=0.12) compared to those hospitals performing fewer operations, however this was not statistically significant.
98.2%
3 National Adult Cardiac Surgery Audit (NACSA) 2020 Summary Report (2016/17-2018/19 data)
1. INTRODUCTION
This annual report looks at all Adult Cardiac Surgery undertaken in the UK over the past 3 years - between 1st April 2016 and 31st March 2019. It is a summary of all the NHS hospitals around the UK, as well as five private hospitals and one hospital from the Republic of Ireland.
The data are complete for all NHS work in England, Wales and Northern Ireland. Unfortunately, due to unresolved data protection issues at the time of analysis, this is the first report in over 10 years that does not have complete data from every hospital in the UK for the last financial year (2018/19). This relates more to issues around permission to transmit data to NICOR than non-compliance with the audit. Data have not been submitted from 5 hospitals (2 NHS in Scotland and 3 Private providers in England). Sadly, this makes some year to year comparisons incomplete at a UK level. However, where this occurs it is highlighted within the report and tables. It is anticipated that this will have been resolved for next year’s report.
1.1 ACTIVITY LEVELS AND TRENDS: SIMILAR NUMBERS OF OPERATIONS OVERALL, BUT FEWER ELECTIVE CABG OPERATIONS
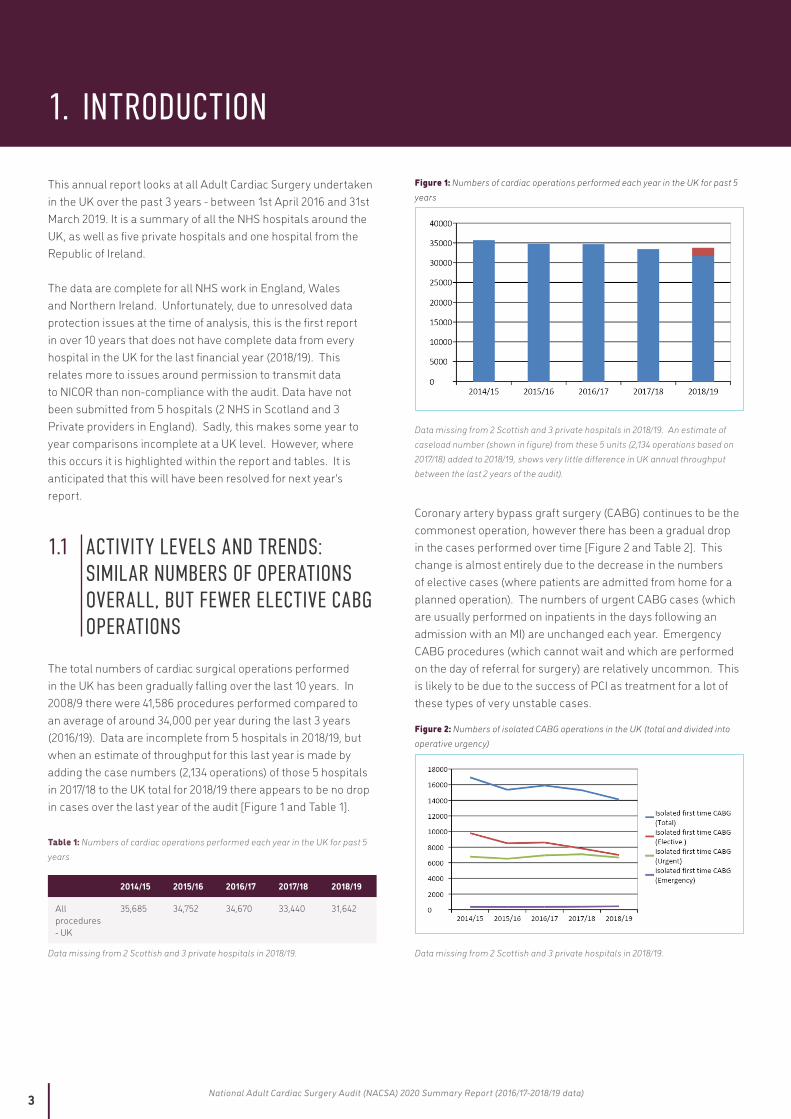
The total numbers of cardiac surgical operations performed in the UK has been gradually falling over the last 10 years. In 2008/9 there were 41,586 procedures performed compared to an average of around 34,000 per year during the last 3 years (2016/19). Data are incomplete from 5 hospitals in 2018/19, but when an estimate of throughput for this last year is made by adding the case numbers (2,134 operations) of those 5 hospitals in 2017/18 to the UK total for 2018/19 there appears to be no drop in cases over the last year of the audit [Figure 1 and Table 1].
Table 1: Numbers of cardiac operations performed each year in the UK for past 5 years
2014/15 2015/16 2016/17 2017/18 2018/19
All procedures - UK
35,685 34,752 34,670 33,440 31,642
Data missing from 2 Scottish and 3 private hospitals in 2018/19.
Figure 1: Numbers of cardiac operations performed each year in the UK for past 5 years
Data missing from 2 Scottish and 3 private hospitals in 2018/19. An estimate of caseload number (shown in figure) from these 5 units (2,134 operations based on 2017/18) added to 2018/19, shows very little difference in UK annual throughput between the last 2 years of the audit).
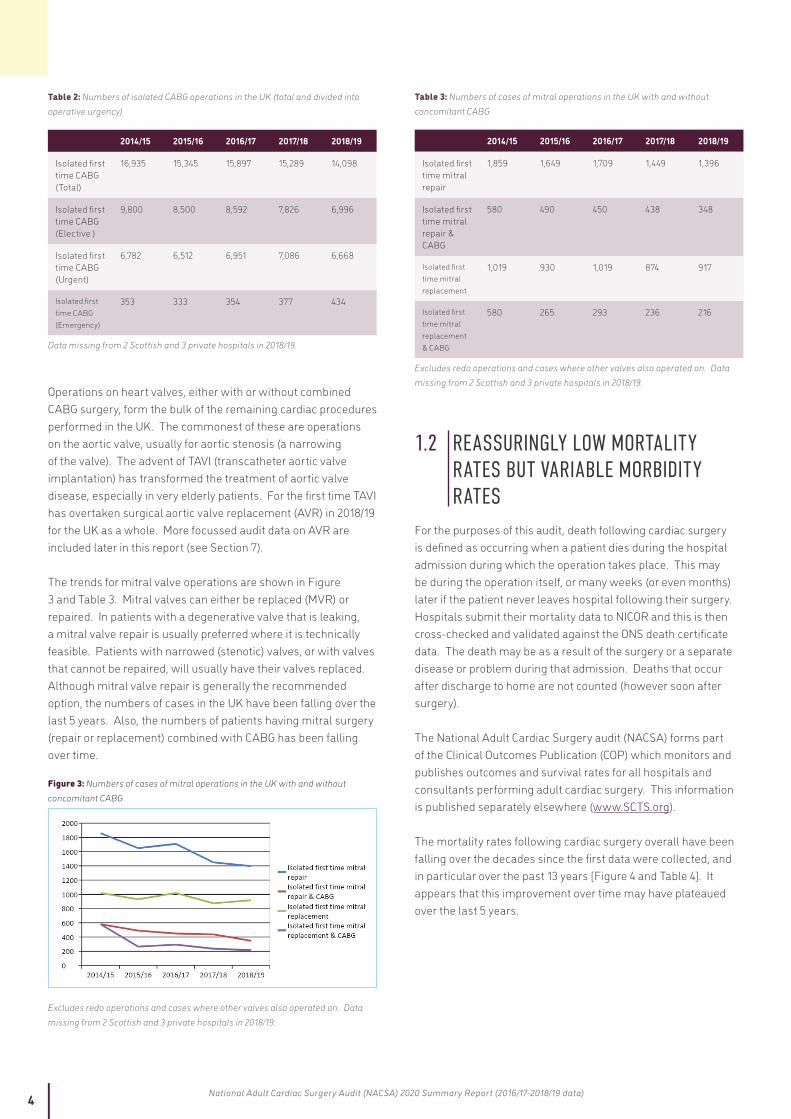
Coronary artery bypass graft surgery (CABG) continues to be the commonest operation, however there has been a gradual drop in the cases performed over time [Figure 2 and Table 2]. This change is almost entirely due to the decrease in the numbers of elective cases (where patients are admitted from home for a planned operation). The numbers of urgent CABG cases (which are usually performed on inpatients in the days following an admission with an MI) are unchanged each year. Emergency CABG procedures (which cannot wait and which are performed on the day of referral for surgery) are relatively uncommon. This is likely to be due to the success of PCI as treatment for a lot of these types of very unstable cases.
Figure 2: Numbers of isolated CABG operations in the UK (total and divided into operative urgency)
Data missing from 2 Scottish and 3 private hospitals in 2018/19.
4 National Adult Cardiac Surgery Audit (NACSA) 2020 Summary Report (2016/17-2018/19 data)
Table 2: Numbers of isolated CABG operations in the UK (total and divided into operative urgency)
2014/15 2015/16 2016/17 2017/18 2018/19
Isolated first time CABG (Total)
16,935 15,345 15,897 15,289 14,098
Isolated first time CABG (Elective )
9,800 8,500 8,592 7,826 6,996
Isolated first time CABG (Urgent)
6,782 6,512 6,951 7,086 6,668
Isolated first time CABG (Emergency)
353 333 354 377 434
Data missing from 2 Scottish and 3 private hospitals in 2018/19.
Operations on heart valves, either with or without combined CABG surgery, form the bulk of the remaining cardiac procedures performed in the UK. The commonest of these are operations on the aortic valve, usually for aortic stenosis (a narrowing of the valve). The advent of TAVI (transcatheter aortic valve implantation) has transformed the treatment of aortic valve disease, especially in very elderly patients. For the first time TAVI has overtaken surgical aortic valve replacement (AVR) in 2018/19 for the UK as a whole. More focussed audit data on AVR are included later in this report (see Section 7).
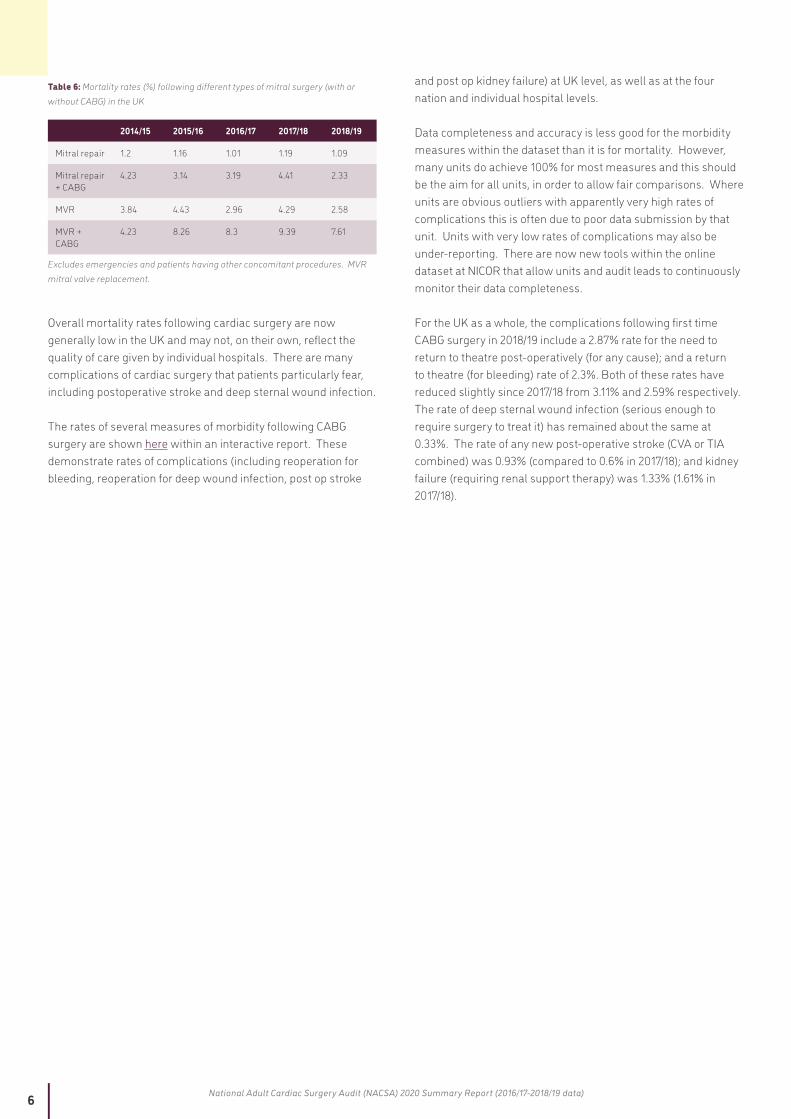
The trends for mitral valve operations are shown in Figure 3 and Table 3. Mitral valves can either be replaced (MVR) or repaired. In patients with a degenerative valve that is leaking, a mitral valve repair is usually preferred where it is technically feasible. Patients with narrowed (stenotic) valves, or with valves that cannot be repaired, will usually have their valves replaced. Although mitral valve repair is generally the recommended option, the numbers of cases in the UK have been falling over the last 5 years. Also, the numbers of patients having mitral surgery (repair or replacement) combined with CABG has been falling over time.
Figure 3: Numbers of cases of mitral operations in the UK with and without concomitant CABG
Excludes redo operations and cases where other valves also operated on. Data missing from 2 Scottish and 3 private hospitals in 2018/19.
Table 3: Numbers of cases of mitral operations in the UK with and without concomitant CABG
2014/15 2015/16 2016/17 2017/18 2018/19
Isolated first time mitral repair
1,859 1,649 1,709 1,449 1,396
Isolated first time mitral repair & CABG
580 490 450 438 348
Isolated first time mitral replacement
1,019 930 1,019 874 917
Isolated first time mitral replacement & CABG
580 265 293 236 216
Excludes redo operations and cases where other valves also operated on. Data missing from 2 Scottish and 3 private hospitals in 2018/19.
1.2 REASSURINGLY LOW MORTALITY RATES BUT VARIABLE MORBIDITY RATES
For the purposes of this audit, death following cardiac surgery is defined as occurring when a patient dies during the hospital admission during which the operation takes place. This may be during the operation itself, or many weeks (or even months) later if the patient never leaves hospital following their surgery. Hospitals submit their mortality data to NICOR and this is then cross-checked and validated against the ONS death certificate data. The death may be as a result of the surgery or a separate disease or problem during that admission. Deaths that occur after discharge to home are not counted (however soon after surgery).
The National Adult Cardiac Surgery audit (NACSA) forms part of the Clinical Outcomes Publication (COP) which monitors and publishes outcomes and survival rates for all hospitals and consultants performing adult cardiac surgery. This information is published separately elsewhere (www.SCTS.org).
The mortality rates following cardiac surgery overall have been falling over the decades since the first data were collected, and in particular over the past 13 years [Figure 4 and Table 4]. It appears that this improvement over time may have plateaued over the last 5 years.

5 National Adult Cardiac Surgery Audit (NACSA) 2020 Summary Report (2016/17-2018/19 data)
Table 4: Crude annual mortality rates (%) following all cardiac surgery (including emergencies) in the UK since 2006
2006/
07
2007/
08
2008/
09
2009/
10
2010/
11
2011/
12
2012/
13
2013/
14
2014/
15
2015/
16
2016/
17
2017/
18
2018/
19
3.61 3.13 3.26 3.22 3.33 3.05 2.99 2.74 2.59 2.56 2.41 2.69 2.59
Figure 4: Crude annual mortality rates (%) following all cardiac surgery (including emergencies) in the UK since 2006
Excludes redo operations and cases where other valves also operated on. Data missing from 2 Scottish and 3 private hospitals in 2018/19.
The mortality rates for the last 5 years following CABG surgery are shown in Figure 5 and Table 5. Overall the rates in the UK are excellent with mortality rates of around 1% for non-emergency cases (giving 99% survival rates following surgery). In 2018/19 the mortality following elective CABG was 0.74%, and for urgent CABG 1.32%.
Figure 5: Mortality rates (%) following isolated first time CABG (for UK)
Table 5: Mortality rates (%) following isolated first time CABG (for UK)
UK 2014/15 2015/16 2016/17 2017/18 2018/19
CABG (Urgent and elective)
0.99 0.86 1.0 0.95 1.03
CABG (Urgent)
1.45 1.23 1.4 1.17 1.32
CABG (Elective)
0.68 0.58 0.68 0.74 0.74
Mortality rates following different types of mitral valve surgery are shown in Figure 6 and Table 6. Results following isolated mitral repair surgery are excellent with mortality rates of just over 1% during the last 5 years. As would be expected, the addition of CABG increases the risk of both MVR and mitral repair operations. These patients have a combination of both coronary artery and valve disease, are usually a sicker cohort and often have a different pathology (ischaemic rather than degenerative) within their mitral valve. MVR and CABG combined is the highest risk with a mortality of 7.61% in 2018/19. This compares to reported rates in the UK of around 11% in 2001 (National Adult Cardiac Surgical Database report 2000/2001).1
Figure 6: Mortality rates (%) following different types of mitral surgery (with or without CABG) in the UK. Excludes emergencies and patients having other concomitant procedures. MVR mitral valve replacement.
6 National Adult Cardiac Surgery Audit (NACSA) 2020 Summary Report (2016/17-2018/19 data)
Table 6: Mortality rates (%) following different types of mitral surgery (with or without CABG) in the UK
2014/15 2015/16 2016/17 2017/18 2018/19
Mitral repair 1.2 1.16 1.01 1.19 1.09
Mitral repair + CABG
4.23 3.14 3.19 4.41 2.33
MVR 3.84 4.43 2.96 4.29 2.58
MVR + CABG
4.23 8.26 8.3 9.39 7.61
Excludes emergencies and patients having other concomitant procedures. MVR mitral valve replacement.
Overall mortality rates following cardiac surgery are now generally low in the UK and may not, on their own, reflect the quality of care given by individual hospitals. There are many complications of cardiac surgery that patients particularly fear, including postoperative stroke and deep sternal wound infection.
The rates of several measures of morbidity following CABG surgery are shown here within an interactive report. These demonstrate rates of complications (including reoperation for bleeding, reoperation for deep wound infection, post op stroke
and post op kidney failure) at UK level, as well as at the four nation and individual hospital levels.
Data completeness and accuracy is less good for the morbidity measures within the dataset than it is for mortality. However, many units do achieve 100% for most measures and this should be the aim for all units, in order to allow fair comparisons. Where units are obvious outliers with apparently very high rates of complications this is often due to poor data submission by that unit. Units with very low rates of complications may also be under-reporting. There are now new tools within the online dataset at NICOR that allow units and audit leads to continuously monitor their data completeness.
For the UK as a whole, the complications following first time CABG surgery in 2018/19 include a 2.87% rate for the need to return to theatre post-operatively (for any cause); and a return to theatre (for bleeding) rate of 2.3%. Both of these rates have reduced slightly since 2017/18 from 3.11% and 2.59% respectively. The rate of deep sternal wound infection (serious enough to require surgery to treat it) has remained about the same at 0.33%. The rate of any new post-operative stroke (CVA or TIA combined) was 0.93% (compared to 0.6% in 2017/18); and kidney failure (requiring renal support therapy) was 1.33% (1.61% in 2017/18).
7 National Adult Cardiac Surgery Audit (NACSA) 2020 Summary Report (2016/17-2018/19 data)
2. QUALITY IMPROVEMENT METRICS
2.1 NO IMPROVEMENT IN PROPORTION OF URGENT CABG PERFORMED WITHIN 7 DAYS OF CORONARY ANGIOGRAPHY
QI Metric Description/Name Urgent CABG performed within 7 days of coronary angiography
Why is this important? Most patients with NSTEMI requiring revascularisation with CABG should be operated on during the same hospital admission (ESC/EACTS Revascularisation Guidelines 2018).2 This is because the highest risk of a further MI or death is in the first month following the initial presentation. Timely surgery is therefore associated with better patient outcomes. Patients usually require 5 days antiplatelet therapy cessation prior to surgery in order to reduce the risks of bleeding at surgery. The optimal window for surgery is between 5 to 7 days following diagnosis (and referral). Longer waits for surgery as an inpatient uses considerable hospital resources and blocks ward beds from allowing other admissions.
QI theme Safety and Effectiveness
What is the standard to be met? The Commissioning for Quality and Innovation framework (CQUIN) target recommended that 100% of patients should meet the target of undergoing urgent CABG within 7 days of angiography.3 In the 2019 NCAP report no NHS centre met this target. As a result a revised target of 75% was set for this audit cycle.
Key references to support the metric ESC/EACTS Revascularisation Guidelines2 CQUIN target3
Numerator All patients requiring urgent first time CABG receiving this within 7 days of the diagnostic angiogram
Denominator All patients requiring urgent first time CABG
Trend No significant improvement over the last three years
Variance Only 6 centres achieve this in over 50% of cases; no centre achieves the standard.
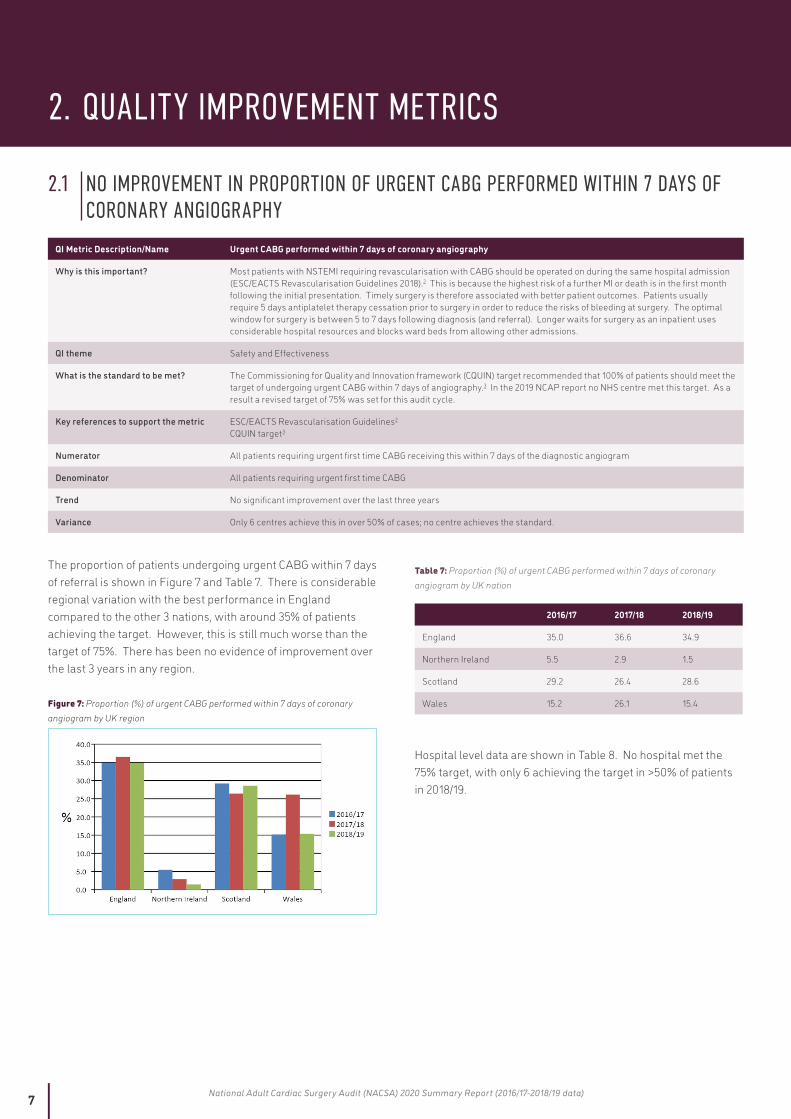
The proportion of patients undergoing urgent CABG within 7 days of referral is shown in Figure 7 and Table 7. There is considerable regional variation with the best performance in England compared to the other 3 nations, with around 35% of patients achieving the target. However, this is still much worse than the target of 75%. There has been no evidence of improvement over the last 3 years in any region.
Figure 7: Proportion (%) of urgent CABG performed within 7 days of coronary angiogram by UK region
Table 7: Proportion (%) of urgent CABG performed within 7 days of coronary angiogram by UK nation
2016/17 2017/18 2018/19
England 35.0 36.6 34.9
Northern Ireland 5.5 2.9 1.5
Scotland 29.2 26.4 28.6
Wales 15.2 26.1 15.4
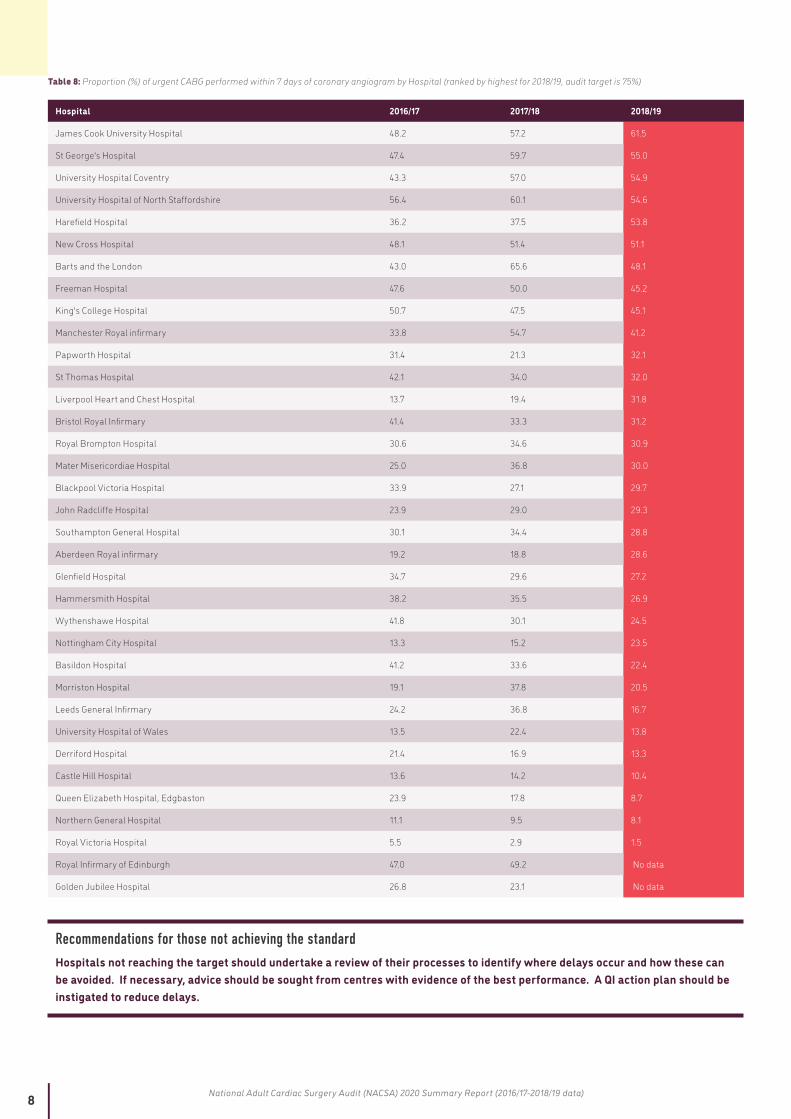
Hospital level data are shown in Table 8. No hospital met the 75% target, with only 6 achieving the target in >50% of patients in 2018/19.
8 National Adult Cardiac Surgery Audit (NACSA) 2020 Summary Report (2016/17-2018/19 data)
Table 8: Proportion (%) of urgent CABG performed within 7 days of coronary angiogram by Hospital (ranked by highest for 2018/19, audit target is 75%)
Hospital 2016/17 2017/18 2018/19
James Cook University Hospital 48.2 57.2 61.5
St George's Hospital 47.4 59.7 55.0
University Hospital Coventry 43.3 57.0 54.9
University Hospital of North Staffordshire 56.4 60.1 54.6
Harefield Hospital 36.2 37.5 53.8
New Cross Hospital 48.1 51.4 51.1
Barts and the London 43.0 65.6 48.1
Freeman Hospital 47.6 50.0 45.2
King's College Hospital 50.7 47.5 45.1
Manchester Royal infirmary 33.8 54.7 41.2
Papworth Hospital 31.4 21.3 32.1
St Thomas Hospital 42.1 34.0 32.0
Liverpool Heart and Chest Hospital 13.7 19.4 31.8
Bristol Royal Infirmary 41.4 33.3 31.2
Royal Brompton Hospital 30.6 34.6 30.9
Mater Misericordiae Hospital 25.0 36.8 30.0
Blackpool Victoria Hospital 33.9 27.1 29.7
John Radcliffe Hospital 23.9 29.0 29.3
Southampton General Hospital 30.1 34.4 28.8
Aberdeen Royal infirmary 19.2 18.8 28.6
Glenfield Hospital 34.7 29.6 27.2
Hammersmith Hospital 38.2 35.5 26.9
Wythenshawe Hospital 41.8 30.1 24.5
Nottingham City Hospital 13.3 15.2 23.5
Basildon Hospital 41.2 33.6 22.4
Morriston Hospital 19.1 37.8 20.5
Leeds General Infirmary 24.2 36.8 16.7
University Hospital of Wales 13.5 22.4 13.8
Derriford Hospital 21.4 16.9 13.3
Castle Hill Hospital 13.6 14.2 10.4
Queen Elizabeth Hospital, Edgbaston 23.9 17.8 8.7
Northern General Hospital 11.1 9.5 8.1
Royal Victoria Hospital 5.5 2.9 1.5
Royal Infirmary of Edinburgh 47.0 49.2 No data
Golden Jubilee Hospital 26.8 23.1 No data
Recommendations for those not achieving the standardHospitals not reaching the target should undertake a review of their processes to identify where delays occur and how these can be avoided. If necessary, advice should be sought from centres with evidence of the best performance. A QI action plan should be instigated to reduce delays.
9 National Adult Cardiac Surgery Audit (NACSA) 2020 Summary Report (2016/17-2018/19 data)
2.2 SOME IMPROVEMENT IN PROPORTION OF ELECTIVE CARDIAC OPERATIONS WITH DAY OF SURGERY ADMISSION (DOSA) BUT MORE PATIENTS COULD BE OFFERED THIS
QI Metric Description/Name Day of surgery admission for elective CABG
Why is this important? Admission to hospital 24 hours prior to elective surgery is inefficient and an unnecessary and expensive use of ward beds. Units should have processes and protocols in place to allow thorough preoperative assessment (including for anaesthesia) without the need for admission the day before an operation. These processes may also reduce the need for last minute theatre cancellations (due to more timely pick up of other comorbidities).
QI theme Effectiveness
What is the standard to be met? At least 50% of elective patients should be admitted on the day of surgery
Key references to support the metric Get it Right First Time [GIRFT] report 2018 4
Numerator All patients undergoing elective CABG who were admitted on the same day as the day of surgery
Denominator All patients undergoing elective first time CABG
Trend Gradual improvement over three years but still at a low level: from 9.7% to 12.8%
Variance Only 1 centre has achieved the target and only 3 centres have achieved this for >30% of patients.
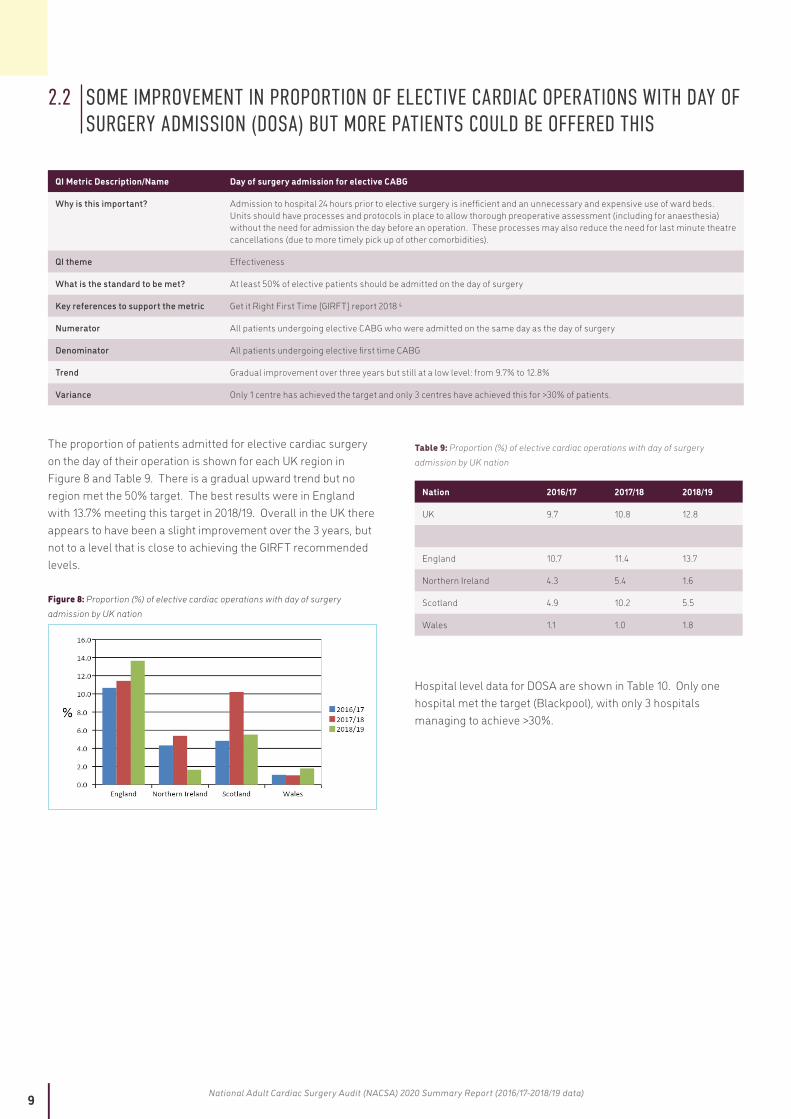
The proportion of patients admitted for elective cardiac surgery on the day of their operation is shown for each UK region in Figure 8 and Table 9. There is a gradual upward trend but no region met the 50% target. The best results were in England with 13.7% meeting this target in 2018/19. Overall in the UK there appears to have been a slight improvement over the 3 years, but not to a level that is close to achieving the GIRFT recommended levels.
Figure 8: Proportion (%) of elective cardiac operations with day of surgery admission by UK nation
Table 9: Proportion (%) of elective cardiac operations with day of surgery admission by UK nation
Nation 2016/17 2017/18 2018/19
UK 9.7 10.8 12.8
England 10.7 11.4 13.7
Northern Ireland 4.3 5.4 1.6
Scotland 4.9 10.2 5.5
Wales 1.1 1.0 1.8
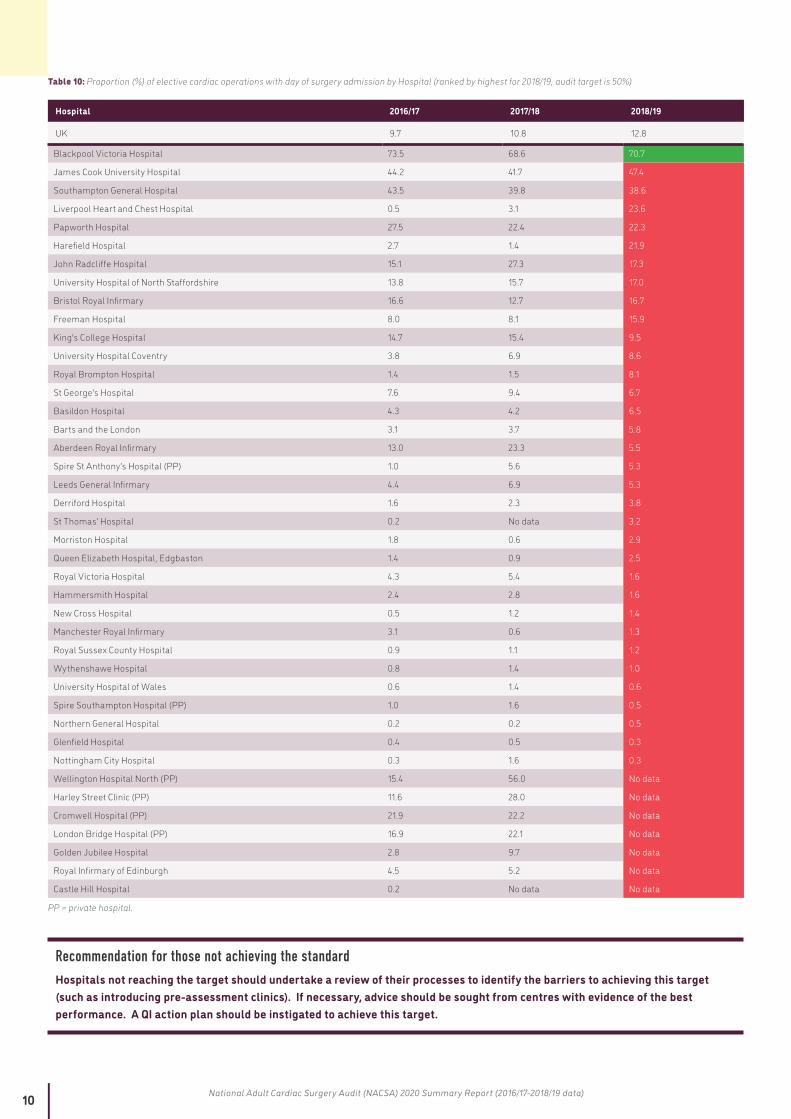
Hospital level data for DOSA are shown in Table 10. Only one hospital met the target (Blackpool), with only 3 hospitals managing to achieve >30%.
10 National Adult Cardiac Surgery Audit (NACSA) 2020 Summary Report (2016/17-2018/19 data)
Table 10: Proportion (%) of elective cardiac operations with day of surgery admission by Hospital (ranked by highest for 2018/19, audit target is 50%)
Hospital 2016/17 2017/18 2018/19
UK 9.7 10.8 12.8
Blackpool Victoria Hospital 73.5 68.6 70.7
James Cook University Hospital 44.2 41.7 47.4
Southampton General Hospital 43.5 39.8 38.6
Liverpool Heart and Chest Hospital 0.5 3.1 23.6
Papworth Hospital 27.5 22.4 22.3
Harefield Hospital 2.7 1.4 21.9
John Radcliffe Hospital 15.1 27.3 17.3
University Hospital of North Staffordshire 13.8 15.7 17.0
Bristol Royal Infirmary 16.6 12.7 16.7
Freeman Hospital 8.0 8.1 15.9
King's College Hospital 14.7 15.4 9.5
University Hospital Coventry 3.8 6.9 8.6
Royal Brompton Hospital 1.4 1.5 8.1
St George's Hospital 7.6 9.4 6.7
Basildon Hospital 4.3 4.2 6.5
Barts and the London 3.1 3.7 5.8
Aberdeen Royal Infirmary 13.0 23.3 5.5
Spire St Anthony’s Hospital (PP) 1.0 5.6 5.3
Leeds General Infirmary 4.4 6.9 5.3
Derriford Hospital 1.6 2.3 3.8
St Thomas’ Hospital 0.2 No data 3.2
Morriston Hospital 1.8 0.6 2.9
Queen Elizabeth Hospital, Edgbaston 1.4 0.9 2.5
Royal Victoria Hospital 4.3 5.4 1.6
Hammersmith Hospital 2.4 2.8 1.6
New Cross Hospital 0.5 1.2 1.4
Manchester Royal Infirmary 3.1 0.6 1.3
Royal Sussex County Hospital 0.9 1.1 1.2
Wythenshawe Hospital 0.8 1.4 1.0
University Hospital of Wales 0.6 1.4 0.6
Spire Southampton Hospital (PP) 1.0 1.6 0.5
Northern General Hospital 0.2 0.2 0.5
Glenfield Hospital 0.4 0.5 0.3
Nottingham City Hospital 0.3 1.6 0.3
Wellington Hospital North (PP) 15.4 56.0 No data
Harley Street Clinic (PP) 11.6 28.0 No data
Cromwell Hospital (PP) 21.9 22.2 No data
London Bridge Hospital (PP) 16.9 22.1 No data
Golden Jubilee Hospital 2.8 9.7 No data
Royal Infirmary of Edinburgh 4.5 5.2 No data
Castle Hill Hospital 0.2 No data No data
PP = private hospital.
Recommendation for those not achieving the standardHospitals not reaching the target should undertake a review of their processes to identify the barriers to achieving this target (such as introducing pre-assessment clinics). If necessary, advice should be sought from centres with evidence of the best performance. A QI action plan should be instigated to achieve this target.
11 National Adult Cardiac Surgery Audit (NACSA) 2020 Summary Report (2016/17-2018/19 data)
2.3 NO IMPROVEMENT IN WAITING TIMES FOR ELECTIVE CABG
QI Metric Description/Name Waiting times for elective CABG
Why is this important? Patients should not wait any longer than necessary for elective coronary artery surgery that is expected to improve both symptoms and/or life expectancy
QI theme Safety
What is the standard to be met? NHS England target of 18 weeks (126 days) from GP referral to treatment (but this includes several other steps in the pathway prior to final referral for surgery), meaning that the portion from the performance of diagnostic investigations to the treatment should be considerably less than 18 weeks. The finding of an abnormality on the coronary angiogram is usually the point that triggers the consideration of a referral for cardiac surgery. This time (from angiogram to operation) is the portion of the patient pathway that surgical teams can influence. A target of 84 days means that the surgical team has taken 67% (12 weeks) of the referral-to-treatment time.
Key references to support the metric NHS England Commissioning target
Numerator All patients undergoing elective first time CABG
Denominator Not applicable
Trend Mean waiting times have increased in the UK from 95 to 107 days over the last three years. They have fallen in Northern Ireland but increased in England and Wales.
Variance Only seven NHS hospitals achieved mean waiting times of less than 12 weeks from angiography to surgery in 2018/19. Seven hospitals had waiting times of >20 weeks, with evidence of worsening performance in 6 out of 7 of them in the last year.
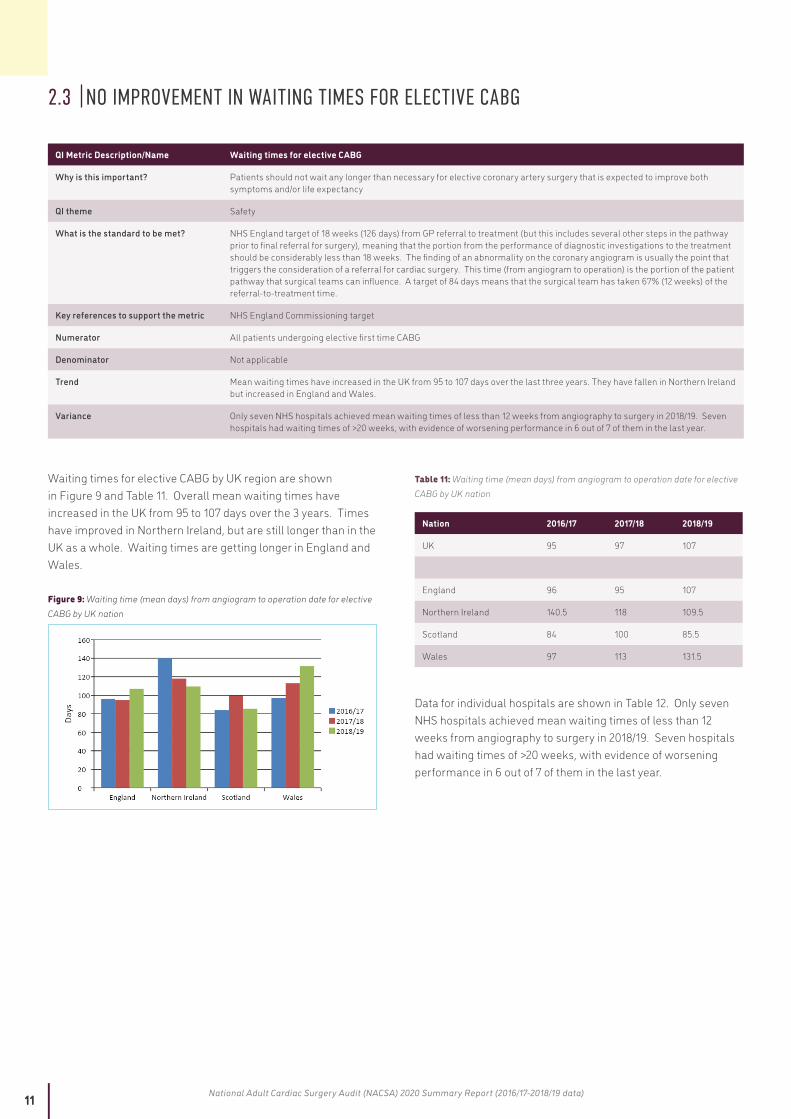
Waiting times for elective CABG by UK region are shown in Figure 9 and Table 11. Overall mean waiting times have increased in the UK from 95 to 107 days over the 3 years. Times have improved in Northern Ireland, but are still longer than in the UK as a whole. Waiting times are getting longer in England and Wales.
Figure 9: Waiting time (mean days) from angiogram to operation date for elective CABG by UK nation
Table 11: Waiting time (mean days) from angiogram to operation date for elective CABG by UK nation
Nation 2016/17 2017/18 2018/19
UK 95 97 107
England 96 95 107
Northern Ireland 140.5 118 109.5
Scotland 84 100 85.5
Wales 97 113 131.5
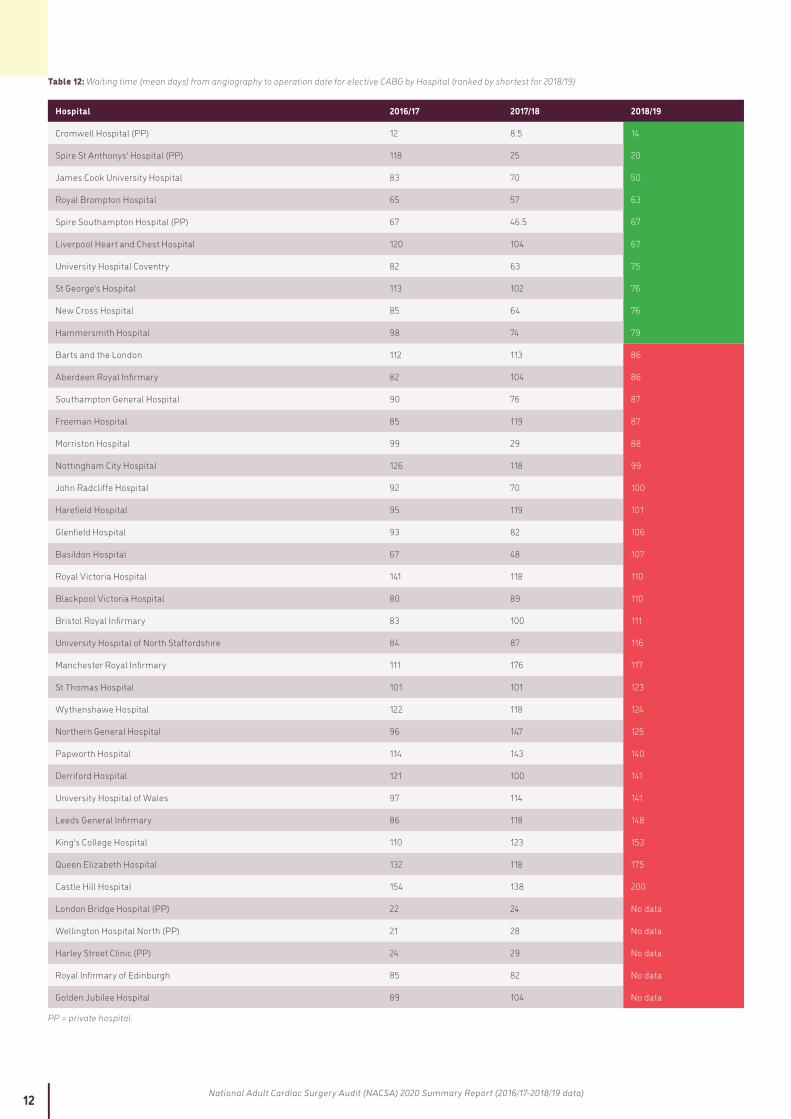
Data for individual hospitals are shown in Table 12. Only seven NHS hospitals achieved mean waiting times of less than 12 weeks from angiography to surgery in 2018/19. Seven hospitals had waiting times of >20 weeks, with evidence of worsening performance in 6 out of 7 of them in the last year.
12 National Adult Cardiac Surgery Audit (NACSA) 2020 Summary Report (2016/17-2018/19 data)
Table 12: Waiting time (mean days) from angiography to operation date for elective CABG by Hospital (ranked by shortest for 2018/19)
Hospital 2016/17 2017/18 2018/19
Cromwell Hospital (PP) 12 8.5 14
Spire St Anthonys' Hospital (PP) 118 25 20
James Cook University Hospital 83 70 50
Royal Brompton Hospital 65 57 63
Spire Southampton Hospital (PP) 67 46.5 67
Liverpool Heart and Chest Hospital 120 104 67
University Hospital Coventry 82 63 75
St George's Hospital 113 102 76
New Cross Hospital 85 64 76
Hammersmith Hospital 98 74 79
Barts and the London 112 113 86
Aberdeen Royal Infirmary 82 104 86
Southampton General Hospital 90 76 87
Freeman Hospital 85 119 87
Morriston Hospital 99 29 88
Nottingham City Hospital 126 118 99
John Radcliffe Hospital 92 70 100
Harefield Hospital 95 119 101
Glenfield Hospital 93 82 106
Basildon Hospital 67 48 107
Royal Victoria Hospital 141 118 110
Blackpool Victoria Hospital 80 89 110
Bristol Royal Infirmary 83 100 111
University Hospital of North Staffordshire 84 87 116
Manchester Royal Infirmary 111 176 117
St Thomas Hospital 101 101 123
Wythenshawe Hospital 122 118 124
Northern General Hospital 96 147 125
Papworth Hospital 114 143 140
Derriford Hospital 121 100 141
University Hospital of Wales 97 114 141
Leeds General Infirmary 86 118 148
King's College Hospital 110 123 153
Queen Elizabeth Hospital 132 118 175
Castle Hill Hospital 154 138 200
London Bridge Hospital (PP) 22 24 No data
Wellington Hospital North (PP) 21 28 No data
Harley Street Clinic (PP) 24 29 No data
Royal Infirmary of Edinburgh 85 82 No data
Golden Jubilee Hospital 89 104 No data
PP = private hospital.
13 National Adult Cardiac Surgery Audit (NACSA) 2020 Summary Report (2016/17-2018/19 data)
Recommendations for those not achieving the standardHospitals with prolonged waiting times for elective CABG surgery should review their processes and referral pathways to identify the causes of any delays. If necessary, advice should be sought from centres with evidence of the best performance. A QI action plan should be instigated to achieve this target.
Patients should be offered surgery in neighbouring hospitals with shorter waiting times if reductions in waiting times cannot be demonstrated.
2.4 HIGHER PROPORTION OF FIRST TIME CABG PATIENTS HAVING URGENT SURGERY
QI Metric Description/Name Proportion of first time CABG performed as an urgent case
Why is this important? Timely CABG surgery during the same hospital admission as a NSTEMI is recommended. Patients should not be routinely sent home without an operation (often called “home and date” for surgery). Patients with NSTEMI requiring revascularisation are the commonest reason for referral for CABG. There should be an emphasis on providing CABG surgery urgently rather than electively, before the patient has further cardiac events (death or another MI).
QI theme Safety and Effectiveness
What is the standard to be met? There are no existing audit standards for this metric. This audit outlines the current UK performance and allows identification of poorer performance by units. Based on current UK data there is an expectation that at least 50% of CABG operations in each hospital should be performed urgently.
Key references to support the metric No reference; NACSA recommendation.
Numerator All patients undergoing first time CABG as an urgent case.
Denominator All patients undergoing first time CABG.
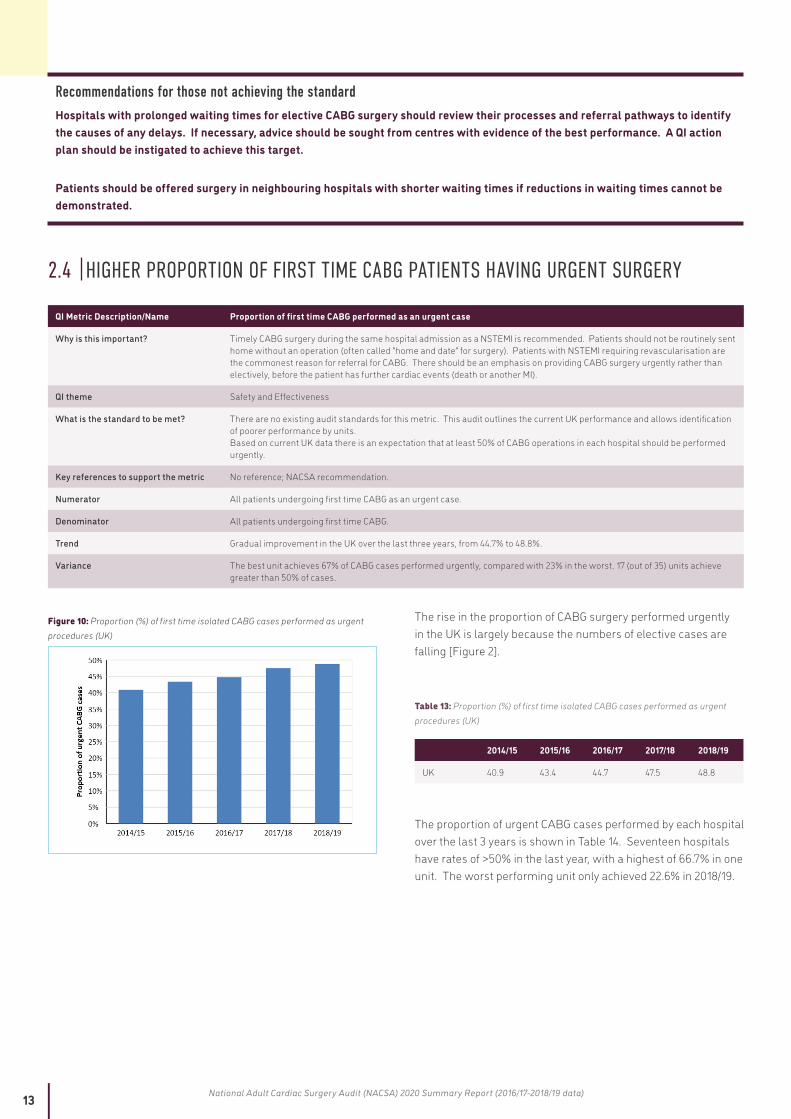
Trend Gradual improvement in the UK over the last three years, from 44.7% to 48.8%.
Variance The best unit achieves 67% of CABG cases performed urgently, compared with 23% in the worst. 17 (out of 35) units achieve greater than 50% of cases.
Figure 10: Proportion (%) of first time isolated CABG cases performed as urgent procedures (UK)
The rise in the proportion of CABG surgery performed urgently in the UK is largely because the numbers of elective cases are falling [Figure 2].
Table 13: Proportion (%) of first time isolated CABG cases performed as urgent procedures (UK)
2014/15 2015/16 2016/17 2017/18 2018/19
UK 40.9 43.4 44.7 47.5 48.8
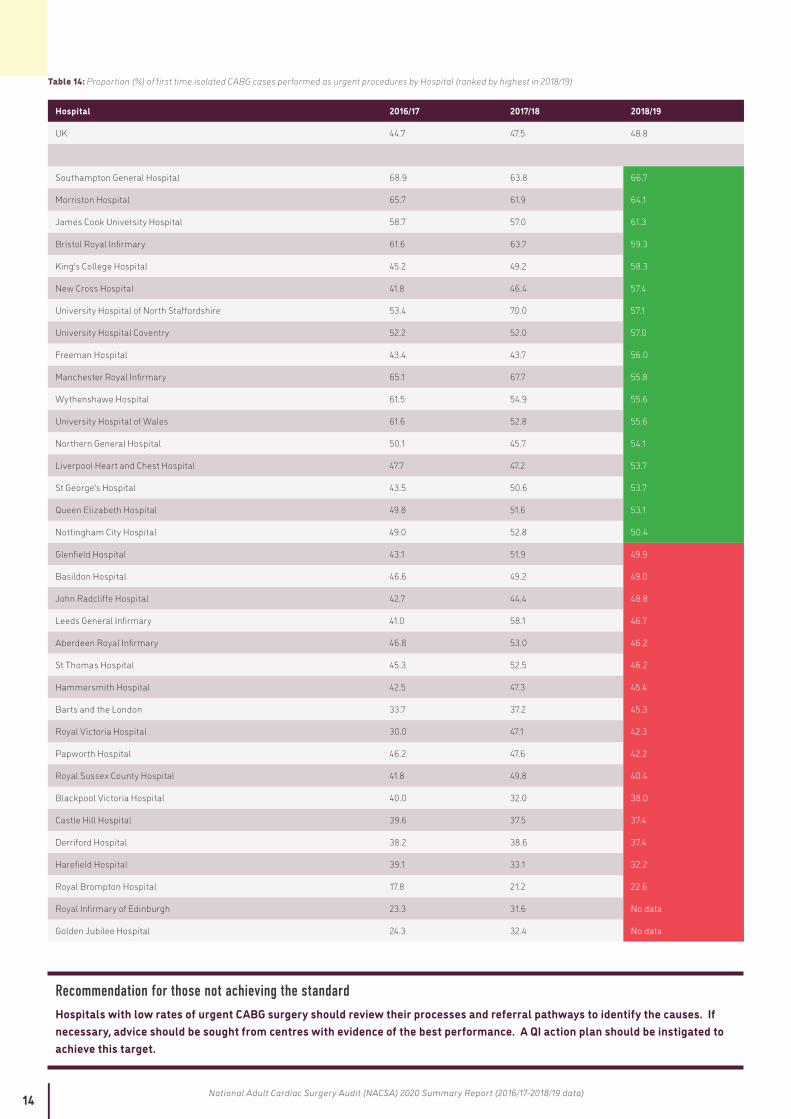
The proportion of urgent CABG cases performed by each hospital over the last 3 years is shown in Table 14. Seventeen hospitals have rates of >50% in the last year, with a highest of 66.7% in one unit. The worst performing unit only achieved 22.6% in 2018/19.
14 National Adult Cardiac Surgery Audit (NACSA) 2020 Summary Report (2016/17-2018/19 data)
Table 14: Proportion (%) of first time isolated CABG cases performed as urgent procedures by Hospital (ranked by highest in 2018/19)
Hospital 2016/17 2017/18 2018/19
UK 44.7 47.5 48.8
Southampton General Hospital 68.9 63.8 66.7
Morriston Hospital 65.7 61.9 64.1
James Cook University Hospital 58.7 57.0 61.3
Bristol Royal Infirmary 61.6 63.7 59.3
King's College Hospital 45.2 49.2 58.3
New Cross Hospital 41.8 46.4 57.4
University Hospital of North Staffordshire 53.4 70.0 57.1
University Hospital Coventry 52.2 52.0 57.0
Freeman Hospital 43.4 43.7 56.0
Manchester Royal Infirmary 65.1 67.7 55.8
Wythenshawe Hospital 61.5 54.9 55.6
University Hospital of Wales 61.6 52.8 55.6
Northern General Hospital 50.1 45.7 54.1
Liverpool Heart and Chest Hospital 47.7 47.2 53.7
St George's Hospital 43.5 50.6 53.7
Queen Elizabeth Hospital 49.8 51.6 53.1
Nottingham City Hospital 49.0 52.8 50.4
Glenfield Hospital 43.1 51.9 49.9
Basildon Hospital 46.6 49.2 49.0
John Radcliffe Hospital 42.7 44.4 48.8
Leeds General Infirmary 41.0 58.1 46.7
Aberdeen Royal Infirmary 46.8 53.0 46.2
St Thomas Hospital 45.3 52.5 46.2
Hammersmith Hospital 42.5 47.3 45.4
Barts and the London 33.7 37.2 45.3
Royal Victoria Hospital 30.0 47.1 42.3
Papworth Hospital 46.2 47.6 42.2
Royal Sussex County Hospital 41.8 49.8 40.4
Blackpool Victoria Hospital 40.0 32.0 38.0
Castle Hill Hospital 39.6 37.5 37.4
Derriford Hospital 38.2 38.6 37.4
Harefield Hospital 39.1 33.1 32.2
Royal Brompton Hospital 17.8 21.2 22.6
Royal Infirmary of Edinburgh 23.3 31.6 No data
Golden Jubilee Hospital 24.3 32.4 No data
Recommendation for those not achieving the standardHospitals with low rates of urgent CABG surgery should review their processes and referral pathways to identify the causes. If necessary, advice should be sought from centres with evidence of the best performance. A QI action plan should be instigated to achieve this target.
15 National Adult Cardiac Surgery Audit (NACSA) 2020 Summary Report (2016/17-2018/19 data)
2.5 PATIENTS ARE EXPERIENCING A SHORTER POST-OP LENGTH OF STAY (PLOS) FOLLOWING FIRST TIME CABG
QI Metric Description/Name Post-op length of stay following first time CABG
Why is this important? Length of stay in hospital is prolonged in patients with complications following surgery. Prolonged PLOS increases costs of care. Evidence from the GIRFT report in 2018 suggested that improvements in 7 day working practices within surgical units may possibly help to reduce PLOS.
QI theme Effectiveness
What is the standard to be met? There are no clear audit standards for PLOS. The audit seeks to show the current practice around the UK, and to give a benchmark for units with below average performance.
Key references to support the metric Not applicable
Numerator All patients requiring first time CABG
Denominator Not applicable
Trend There has been a gradual reduction in PLOS from 8.1 to 7.8 days across the UK over the last 3 years
Variance The mean varies from 5.9 to 11 days between centres
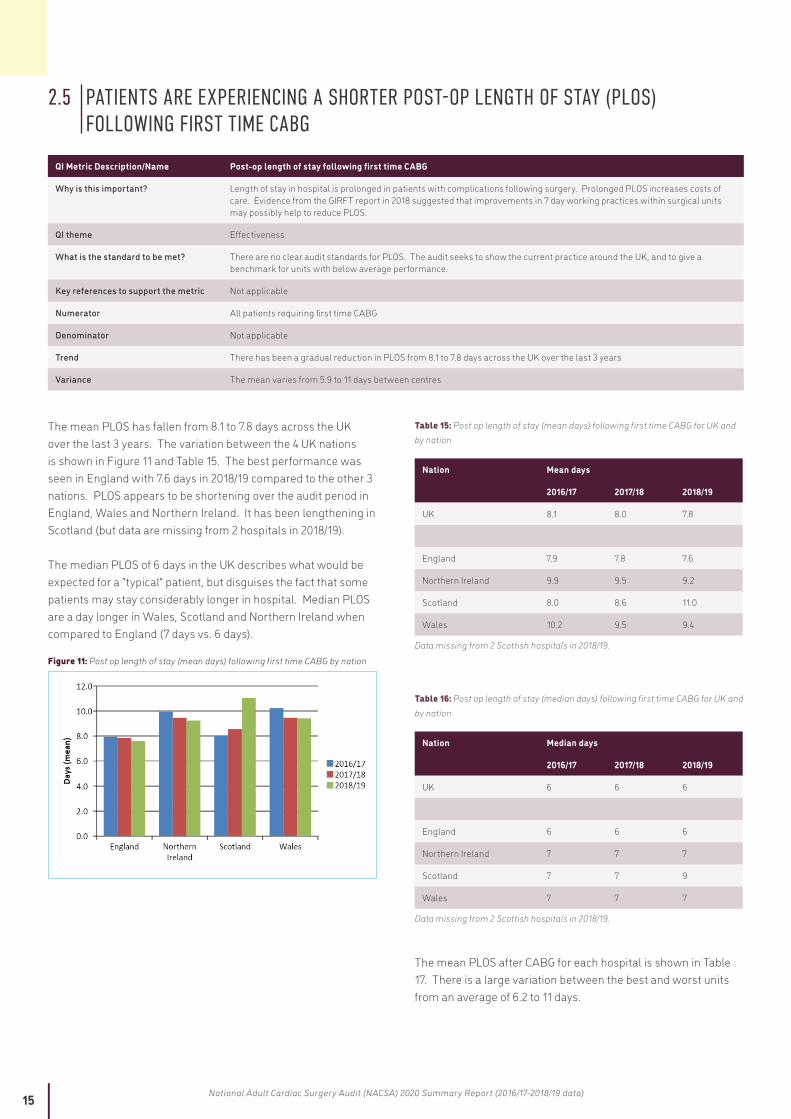
The mean PLOS has fallen from 8.1 to 7.8 days across the UK over the last 3 years. The variation between the 4 UK nations is shown in Figure 11 and Table 15. The best performance was seen in England with 7.6 days in 2018/19 compared to the other 3 nations. PLOS appears to be shortening over the audit period in England, Wales and Northern Ireland. It has been lengthening in Scotland (but data are missing from 2 hospitals in 2018/19).
The median PLOS of 6 days in the UK describes what would be expected for a “typical” patient, but disguises the fact that some patients may stay considerably longer in hospital. Median PLOS are a day longer in Wales, Scotland and Northern Ireland when compared to England (7 days vs. 6 days).
Figure 11: Post op length of stay (mean days) following first time CABG by nation
Table 15: Post op length of stay (mean days) following first time CABG for UK and by nation
Nation Mean days
2016/17 2017/18 2018/19
UK 8.1 8.0 7.8
England 7.9 7.8 7.6
Northern Ireland 9.9 9.5 9.2
Scotland 8.0 8.6 11.0
Wales 10.2 9.5 9.4
Data missing from 2 Scottish hospitals in 2018/19.
Table 16: Post op length of stay (median days) following first time CABG for UK and by nation
Nation Median days
2016/17 2017/18 2018/19
UK 6 6 6
England 6 6 6
Northern Ireland 7 7 7
Scotland 7 7 9
Wales 7 7 7
Data missing from 2 Scottish hospitals in 2018/19.
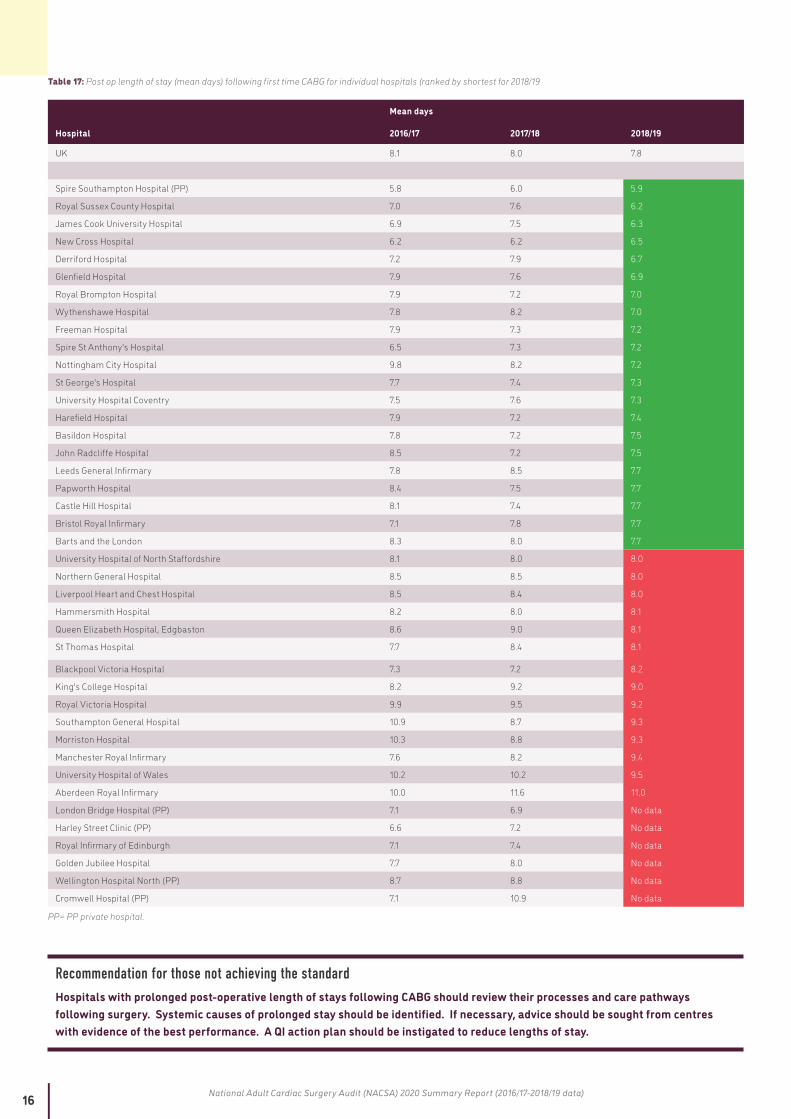
The mean PLOS after CABG for each hospital is shown in Table 17. There is a large variation between the best and worst units from an average of 6.2 to 11 days.
16 National Adult Cardiac Surgery Audit (NACSA) 2020 Summary Report (2016/17-2018/19 data)
Table 17: Post op length of stay (mean days) following first time CABG for individual hospitals (ranked by shortest for 2018/19
Mean days
Hospital 2016/17 2017/18 2018/19
UK 8.1 8.0 7.8
Spire Southampton Hospital (PP) 5.8 6.0 5.9
Royal Sussex County Hospital 7.0 7.6 6.2
James Cook University Hospital 6.9 7.5 6.3
New Cross Hospital 6.2 6.2 6.5
Derriford Hospital 7.2 7.9 6.7
Glenfield Hospital 7.9 7.6 6.9
Royal Brompton Hospital 7.9 7.2 7.0
Wythenshawe Hospital 7.8 8.2 7.0
Freeman Hospital 7.9 7.3 7.2
Spire St Anthony's Hospital 6.5 7.3 7.2
Nottingham City Hospital 9.8 8.2 7.2
St George's Hospital 7.7 7.4 7.3
University Hospital Coventry 7.5 7.6 7.3
Harefield Hospital 7.9 7.2 7.4
Basildon Hospital 7.8 7.2 7.5
John Radcliffe Hospital 8.5 7.2 7.5
Leeds General Infirmary 7.8 8.5 7.7
Papworth Hospital 8.4 7.5 7.7
Castle Hill Hospital 8.1 7.4 7.7
Bristol Royal Infirmary 7.1 7.8 7.7
Barts and the London 8.3 8.0 7.7
University Hospital of North Staffordshire 8.1 8.0 8.0
Northern General Hospital 8.5 8.5 8.0
Liverpool Heart and Chest Hospital 8.5 8.4 8.0
Hammersmith Hospital 8.2 8.0 8.1
Queen Elizabeth Hospital, Edgbaston 8.6 9.0 8.1
St Thomas Hospital 7.7 8.4 8.1
Blackpool Victoria Hospital 7.3 7.2 8.2
King's College Hospital 8.2 9.2 9.0
Royal Victoria Hospital 9.9 9.5 9.2
Southampton General Hospital 10.9 8.7 9.3
Morriston Hospital 10.3 8.8 9.3
Manchester Royal Infirmary 7.6 8.2 9.4
University Hospital of Wales 10.2 10.2 9.5
Aberdeen Royal Infirmary 10.0 11.6 11.0
London Bridge Hospital (PP) 7.1 6.9 No data
Harley Street Clinic (PP) 6.6 7.2 No data
Royal Infirmary of Edinburgh 7.1 7.4 No data
Golden Jubilee Hospital 7.7 8.0 No data
Wellington Hospital North (PP) 8.7 8.8 No data
Cromwell Hospital (PP) 7.1 10.9 No data
PP= PP private hospital.
Recommendation for those not achieving the standardHospitals with prolonged post-operative length of stays following CABG should review their processes and care pathways following surgery. Systemic causes of prolonged stay should be identified. If necessary, advice should be sought from centres with evidence of the best performance. A QI action plan should be instigated to reduce lengths of stay.
17 National Adult Cardiac Surgery Audit (NACSA) 2020 Summary Report (2016/17-2018/19 data)
3. AREAS FOR MOVING TOWARDS QUALITY IMPROVEMENT METRICS
3.1 AORTIC VALVE REPLACEMENT (AVR)Aortic valve replacement (AVR) is the second most commonly performed cardiac operation in the UK. It has been the mainstay of the treatment of aortic valve dysfunction (most commonly aortic stenosis – a narrowing of the valve) for several decades. However, newer developments in the way the surgery can be performed, and in particular the introduction of transcatheter aortic valve implantation (TAVI), have led to changes in clinical practice over the last 10 years.
There are no clear audit standards for AVR against which to design a QI metric. The audit seeks to show changes over time in the practice around the UK, as well as giving a benchmark for surgical outcomes for patients undergoing AVR. In general, younger patients receive mechanical valves and older patients receive tissue valves.
QI Metric Description/Name Type of prosthesis used for patients undergoing surgical aortic valve replacement (SAVR).
Why is this important? Implantation of bioprosthetic, rather than mechanical, valves avoids the need for lifelong anticoagulation and is preferred in elderly patients. However, although increased usage of bioprosthetic valves (including TAVI) in younger patients may improve quality of life in the short term (by avoiding anticoagulation), it is likely to lead to greater need for costly and higher risk re-intervention and repeat surgery (by AVR or TAVI) as the patient gets older.
QI theme Effectiveness and Outcomes
What is the standard to be met? There are no clear audit standards for AVR.
Key references to support the metric Not applicable.
Numerator All patients undergoing SAVR by type of valve by age group.
Denominator All patients undergoing SAVR by age group.
Trend Not applicable: focussed 1 year report.
Variance Overall 1 in 6 receives a mechanical valve but there is significant variability between centres, ranging from 1 in 18 to 1 in 3.
Implantation of bioprosthetic, rather than mechanical, valves avoids the need for lifelong anticoagulation and is preferred in elderly patients. However, although increased usage of bioprosthetic valves (including TAVI) in younger patients may improve quality of life in the short term (by avoiding anticoagulation), it is likely to lead to greater need for costly and higher risk re-intervention and repeat surgery (by AVR or TAVI) as the patient gets older.
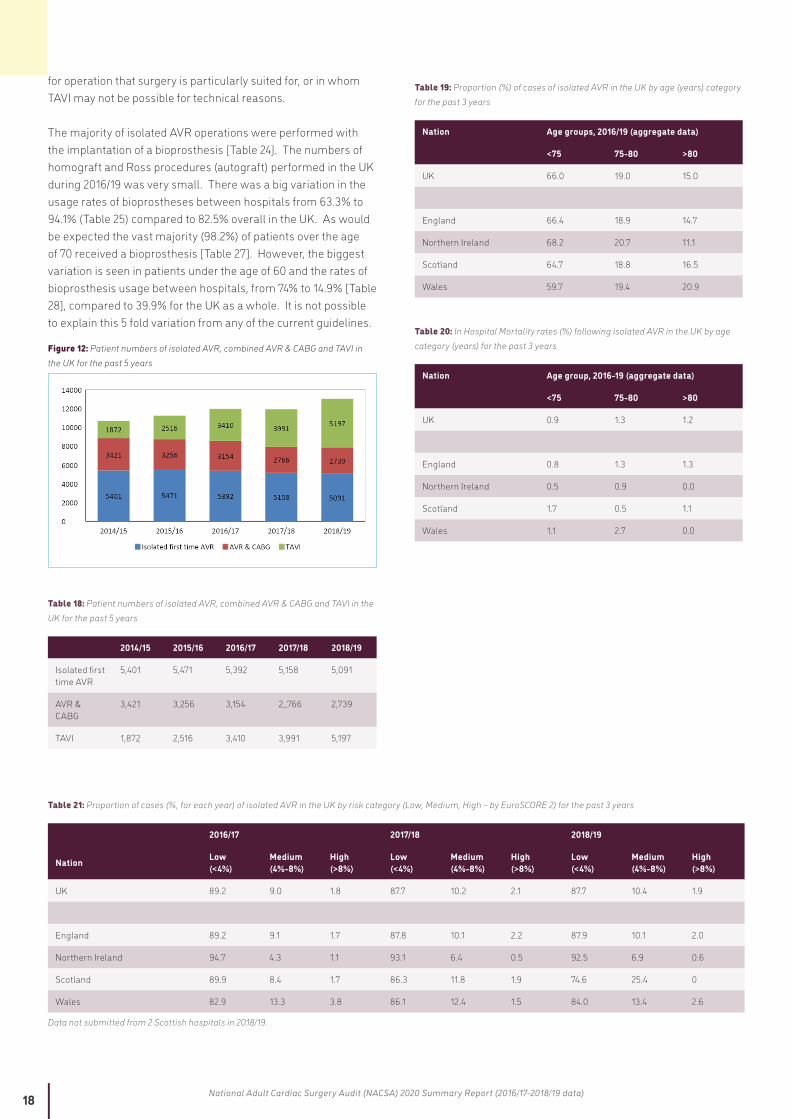
Over the past two years the numbers of isolated AVR and combined AVR & CABG operations have fallen [Figure 12]. This has corresponded to a time when TAVI rates are increasing. Overall the total number of all procedures for aortic valve disease has continued to increase in the UK over the past 5 years.
Aortic stenosis is predominantly seen in the ageing population. Around 34% of surgical isolated AVR operations are performed in patients over 75 years old [Table 2]. Despite the growth of TAVI 15% of surgical AVRs in the UK are performed in patients over 80 and in nearly 21% of cases in Wales [Table 19].
The in hospital mortality rates of surgical isolated AVR overall was 0.9% for patients under 75 years of age and between 1.2 to 1.3% for those over 75 years [Table 20].
The proportion of patients in the low, medium and high risk categories (as defined by a preoperative calculated EuroSCORE 2 risk of in hospital mortality of <4%; 4-8%; >8%) has not altered over the last 3 years [Table 21]. However, the fall in surgical AVR numbers has predominantly been in low risk patients, from 5,102 patients in 2016/17 down to 4,427 in 2018/19 (Table 22) as these are by far the largest group operated on.
The in hospital mortality rates for surgical AVR in the UK have been lower than predicted by EuroSCORE 2 with 0.7%, 2.2% and 6.1% mortality seen in the low, medium and high risk patients respectively [Figure 13, Table 23]. There has been little change in the mortality rates for the low and medium risk patients over the past 3 years. The change seen for the high risk patients is likely to be due to the small numbers of patients. Data for the high risk patients will also be skewed due to the increasing predominance in the use of TAVI for these patients, with patients only selected
18 National Adult Cardiac Surgery Audit (NACSA) 2020 Summary Report (2016/17-2018/19 data)
for operation that surgery is particularly suited for, or in whom TAVI may not be possible for technical reasons.
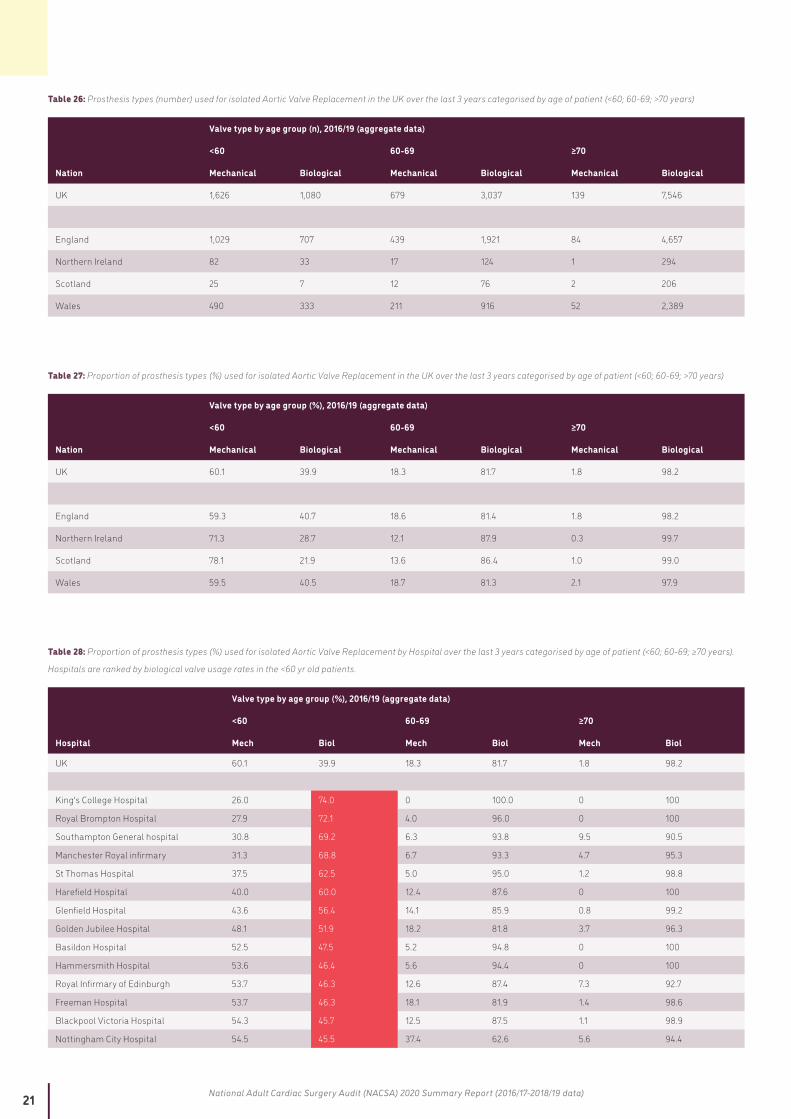
The majority of isolated AVR operations were performed with the implantation of a bioprosthesis [Table 24]. The numbers of homograft and Ross procedures (autograft) performed in the UK during 2016/19 was very small. There was a big variation in the usage rates of bioprostheses between hospitals from 63.3% to 94.1% (Table 25) compared to 82.5% overall in the UK. As would be expected the vast majority (98.2%) of patients over the age of 70 received a bioprosthesis [Table 27]. However, the biggest variation is seen in patients under the age of 60 and the rates of bioprosthesis usage between hospitals, from 74% to 14.9% [Table 28], compared to 39.9% for the UK as a whole. It is not possible to explain this 5 fold variation from any of the current guidelines.
Figure 12: Patient numbers of isolated AVR, combined AVR & CABG and TAVI in the UK for the past 5 years
Table 18: Patient numbers of isolated AVR, combined AVR & CABG and TAVI in the UK for the past 5 years
2014/15 2015/16 2016/17 2017/18 2018/19
Isolated first time AVR
5,401 5,471 5,392 5,158 5,091
AVR & CABG
3,421 3,256 3,154 2,,766 2,739
TAVI 1,872 2,516 3,410 3,991 5,197
Table 19: Proportion (%) of cases of isolated AVR in the UK by age (years) category for the past 3 years
Nation Age groups, 2016/19 (aggregate data)
<75 75-80 >80
UK 66.0 19.0 15.0
England 66.4 18.9 14.7
Northern Ireland 68.2 20.7 11.1
Scotland 64.7 18.8 16.5
Wales 59.7 19.4 20.9
Table 20: In Hospital Mortality rates (%) following isolated AVR in the UK by age category (years) for the past 3 years
Nation Age group, 2016-19 (aggregate data)
<75 75-80 >80
UK 0.9 1.3 1.2
England 0.8 1.3 1.3
Northern Ireland 0.5 0.9 0.0
Scotland 1.7 0.5 1.1
Wales 1.1 2.7 0.0
Table 21: Proportion of cases (%, for each year) of isolated AVR in the UK by risk category (Low, Medium, High – by EuroSCORE 2) for the past 3 years
2016/17 2017/18 2018/19
Nation Low (<4%)
Medium (4%-8%)
High (>8%)
Low (<4%)
Medium (4%-8%)
High (>8%)
Low (<4%)
Medium (4%-8%)
High (>8%)
UK 89.2 9.0 1.8 87.7 10.2 2.1 87.7 10.4 1.9
England 89.2 9.1 1.7 87.8 10.1 2.2 87.9 10.1 2.0
Northern Ireland 94.7 4.3 1.1 93.1 6.4 0.5 92.5 6.9 0.6
Scotland 89.9 8.4 1.7 86.3 11.8 1.9 74.6 25.4 0
Wales 82.9 13.3 3.8 86.1 12.4 1.5 84.0 13.4 2.6
Data not submitted from 2 Scottish hospitals in 2018/19.

19 National Adult Cardiac Surgery Audit (NACSA) 2020 Summary Report (2016/17-2018/19 data)
Table 22: Numbers (n, for each year) of isolated AVR in the UK by risk category (Low, Medium, High – by EuroSCORE 2) for the past 3 years
2016/17 2017/18 2018/19
Nation Low (<4%)
Medium (4%-8%)
High (>8%)
Low (<4%)
Medium (4%-8%)
High (>8%)
Low (<4%)
Medium (4%-8%)
High (>8%)
UK 5102 515 103 4760 554 111 4427 526 98
England 4251 431 83 3931 452 97 4004 462 90
Northern Ireland 178 8 2 189 13 1 148 11 1
Scotland 474 44 9 417 57 9 50 17 0
Wales 199 32 9 223 32 4 225 36 7
Data not submitted from 2 Scottish hospitals in 2018/19.
Figure 13: In Hospital Mortality rates (%) following isolated AVR in the UK by predicted operative risk category (Low, Medium, High – by EuroSCORE 2) for the past 3 years
Table 23: In Hospital Mortality rates (%) following isolated AVR in the UK by predicted operative risk category (Low, Medium, High – by EuroSCORE 2) for the past 3 years
Nation Age group, 2016-19 (aggregate data)
Low risk (<4%)
Medium risk (4% - 8%)
High risk (>8%)
UK 0.7 2.2 6.1
England 0.7 2.3 5.6
Northern Ireland 0.4 0 25
Scotland 1.4 1.7 0
Wales 0.6 2.0 15
Total case numbers are small in the High Risk category outside England. For numbers see Table 22.
Table 24: Prosthesis types (number, %) used for isolated Aortic Valve Replacement in the UK for the past 3 years.
Type of valve, 2016/19 (aggregate data)
Nation Mechanical Biological Homograft Autograft
UK 2,444 (17.3%) 11,663 (82.5%) 20 (0.14%) 11 (0.08%)
England 2,123 (17.5%) 9,950 (82.2%) 20 (0.17%) 11 (0.09%)
Northern Ireland 100 (18.1%) 451 (81.9%) 0 0
Scotland 176 (16.4%) 900 (83.6%) 0 0
Wales 45 (11.1%) 362 (88.9%) 0 0
Autograft = Ross procedure.
Table 25: Proportion of prosthesis types (%) used for isolated Aortic Valve Replacement by Hospital for the past 3 years
Valve type (%), 2016/19 (aggregate data)
Hospital Mechanical Biological
UK 17.3 82.5
King's College Hospital 5.9 94.1
London Bridge Hospital (PP) 7 93

20 National Adult Cardiac Surgery Audit (NACSA) 2020 Summary Report (2016/17-2018/19 data)
Valve type (%), 2016/19 (aggregate data)
Hospital Mechanical Biological
Basildon Hospital 8.9 91.1
Royal Sussex County Hospital 9.8 90.2
Royal Brompton Hospital 9.2 90
Morriston Hospital 11.1 88.9
Glenfield Hospital 11.3 88.7
Papworth Hospital 11.6 88.4
Manchester Royal infirmary 12 88.1
St Thomas Hospital 10.5 88.1
Harefield Hospital 12.8 87.2
Derriford Hospital 12.9 87.2
Blackpool Victoria Hospital 13.1 86.9
Freeman Hospital 14.2 85.6
Aberdeen Royal Infirmary 14.6 85.5
Liverpool Heart and Chest Hospital 14 85.1
Southampton General Hospital 13.7 84.3
Bristol Royal Infirmary 15.5 84.2
Hammersmith Hospital 14.9 83.8
Golden Jubilee Hospital 16.4 83.7
John Radcliffe Hospital 16.4 83.2
University Hospital Coventry 15.6 83
Royal Infirmary of Edinburgh 17.3 82.7
Royal Victoria Hospital 18.2 81.9
Queen Elizabeth Hospital, Edgbaston 19 81
Wythenshawe Hospital 21 79
James Cook University Hospital 21.8 78.2
University Hospital of North Staffordshire 22.3 77.8
Castle Hill Hospital 24 76
St George's Hospital 24.1 75.9
Nottingham City Hospital 25 75
New Cross Hospital 25.2 74.8
Northern General Hospital 29.2 70.8
Barts and the London 32.1 68
Leeds General Infirmary 36.7 63.3
University Hospital of Wales No data No data
Wellington Hospital North (PP) No data No data
Cromwell hospital (PP) No data No data
Harley Street Clinic (PP) No data No data
Spire St Anthony's Hospital (PP) No data No data
Spire Southampton hospital (PP) No data No data
Homograft and Autograft not shown due to very small numbers. Hospitals ranked by biological valve usage. PP private hospital.
21 National Adult Cardiac Surgery Audit (NACSA) 2020 Summary Report (2016/17-2018/19 data)
Table 26: Prosthesis types (number) used for isolated Aortic Valve Replacement in the UK over the last 3 years categorised by age of patient (<60; 60-69; >70 years)
Valve type by age group (n), 2016/19 (aggregate data)
<60 60-69 ≥70
Nation Mechanical Biological Mechanical Biological Mechanical Biological
UK 1,626 1,080 679 3,037 139 7,546
England 1,029 707 439 1,921 84 4,657
Northern Ireland 82 33 17 124 1 294
Scotland 25 7 12 76 2 206
Wales 490 333 211 916 52 2,389
Table 27: Proportion of prosthesis types (%) used for isolated Aortic Valve Replacement in the UK over the last 3 years categorised by age of patient (<60; 60-69; >70 years)
Valve type by age group (%), 2016/19 (aggregate data)
<60 60-69 ≥70
Nation Mechanical Biological Mechanical Biological Mechanical Biological
UK 60.1 39.9 18.3 81.7 1.8 98.2
England 59.3 40.7 18.6 81.4 1.8 98.2
Northern Ireland 71.3 28.7 12.1 87.9 0.3 99.7
Scotland 78.1 21.9 13.6 86.4 1.0 99.0
Wales 59.5 40.5 18.7 81.3 2.1 97.9
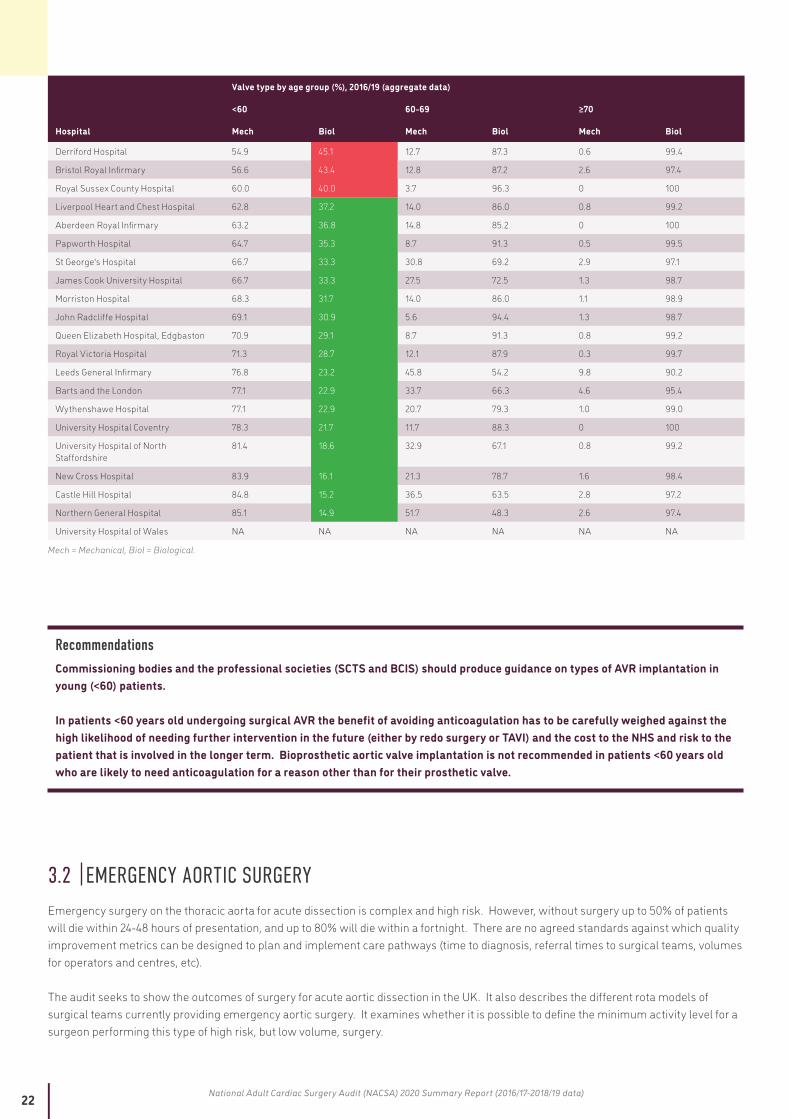
Table 28: Proportion of prosthesis types (%) used for isolated Aortic Valve Replacement by Hospital over the last 3 years categorised by age of patient (<60; 60-69; ≥70 years).
Hospitals are ranked by biological valve usage rates in the <60 yr old patients.
Valve type by age group (%), 2016/19 (aggregate data)
<60 60-69 ≥70
Hospital Mech Biol Mech Biol Mech Biol
UK 60.1 39.9 18.3 81.7 1.8 98.2
King's College Hospital 26.0 74.0 0 100.0 0 100
Royal Brompton Hospital 27.9 72.1 4.0 96.0 0 100
Southampton General hospital 30.8 69.2 6.3 93.8 9.5 90.5
Manchester Royal infirmary 31.3 68.8 6.7 93.3 4.7 95.3
St Thomas Hospital 37.5 62.5 5.0 95.0 1.2 98.8
Harefield Hospital 40.0 60.0 12.4 87.6 0 100
Glenfield Hospital 43.6 56.4 14.1 85.9 0.8 99.2
Golden Jubilee Hospital 48.1 51.9 18.2 81.8 3.7 96.3
Basildon Hospital 52.5 47.5 5.2 94.8 0 100
Hammersmith Hospital 53.6 46.4 5.6 94.4 0 100
Royal Infirmary of Edinburgh 53.7 46.3 12.6 87.4 7.3 92.7
Freeman Hospital 53.7 46.3 18.1 81.9 1.4 98.6
Blackpool Victoria Hospital 54.3 45.7 12.5 87.5 1.1 98.9
Nottingham City Hospital 54.5 45.5 37.4 62.6 5.6 94.4
22 National Adult Cardiac Surgery Audit (NACSA) 2020 Summary Report (2016/17-2018/19 data)
Valve type by age group (%), 2016/19 (aggregate data)
<60 60-69 ≥70
Hospital Mech Biol Mech Biol Mech Biol
Derriford Hospital 54.9 45.1 12.7 87.3 0.6 99.4
Bristol Royal Infirmary 56.6 43.4 12.8 87.2 2.6 97.4
Royal Sussex County Hospital 60.0 40.0 3.7 96.3 0 100
Liverpool Heart and Chest Hospital 62.8 37.2 14.0 86.0 0.8 99.2
Aberdeen Royal Infirmary 63.2 36.8 14.8 85.2 0 100
Papworth Hospital 64.7 35.3 8.7 91.3 0.5 99.5
St George's Hospital 66.7 33.3 30.8 69.2 2.9 97.1
James Cook University Hospital 66.7 33.3 27.5 72.5 1.3 98.7
Morriston Hospital 68.3 31.7 14.0 86.0 1.1 98.9
John Radcliffe Hospital 69.1 30.9 5.6 94.4 1.3 98.7
Queen Elizabeth Hospital, Edgbaston 70.9 29.1 8.7 91.3 0.8 99.2
Royal Victoria Hospital 71.3 28.7 12.1 87.9 0.3 99.7
Leeds General Infirmary 76.8 23.2 45.8 54.2 9.8 90.2
Barts and the London 77.1 22.9 33.7 66.3 4.6 95.4
Wythenshawe Hospital 77.1 22.9 20.7 79.3 1.0 99.0
University Hospital Coventry 78.3 21.7 11.7 88.3 0 100
University Hospital of North Staffordshire
81.4 18.6 32.9 67.1 0.8 99.2
New Cross Hospital 83.9 16.1 21.3 78.7 1.6 98.4
Castle Hill Hospital 84.8 15.2 36.5 63.5 2.8 97.2
Northern General Hospital 85.1 14.9 51.7 48.3 2.6 97.4
University Hospital of Wales NA NA NA NA NA NA
Mech = Mechanical, Biol = Biological.
RecommendationsCommissioning bodies and the professional societies (SCTS and BCIS) should produce guidance on types of AVR implantation in young (<60) patients. In patients <60 years old undergoing surgical AVR the benefit of avoiding anticoagulation has to be carefully weighed against the high likelihood of needing further intervention in the future (either by redo surgery or TAVI) and the cost to the NHS and risk to the patient that is involved in the longer term. Bioprosthetic aortic valve implantation is not recommended in patients <60 years old who are likely to need anticoagulation for a reason other than for their prosthetic valve.
3.2 EMERGENCY AORTIC SURGERYEmergency surgery on the thoracic aorta for acute dissection is complex and high risk. However, without surgery up to 50% of patients will die within 24-48 hours of presentation, and up to 80% will die within a fortnight. There are no agreed standards against which quality improvement metrics can be designed to plan and implement care pathways (time to diagnosis, referral times to surgical teams, volumes for operators and centres, etc).
The audit seeks to show the outcomes of surgery for acute aortic dissection in the UK. It also describes the different rota models of surgical teams currently providing emergency aortic surgery. It examines whether it is possible to define the minimum activity level for a surgeon performing this type of high risk, but low volume, surgery.

23 National Adult Cardiac Surgery Audit (NACSA) 2020 Summary Report (2016/17-2018/19 data)
QI Metric Description/Name Outcomes after surgery for aortic dissection
Why is this important? Emergency surgery on the thoracic aorta for acute dissection is complex and high risk. However, without surgery up to 50% of patients will die within 24-48 hours of presentation, and up to 80% will die within a fortnight.
The GIRFT report into Cardiothoracic Surgery in 2018 recommended patients with acute aortic syndromes (such as aortic dissection) should only be operated on by rotas of surgeons in acute aortic surgery specialist teams.4 In particular it specifies that operations on aortic dissection should only be performed by specialist surgeons and that minimum activity levels for each surgeon should be defined.
QI theme Outcomes.
What is the standard to be met? No agreed standards.
Key references to support the metric International series5-7
Numerator All patients undergoing surgery for aortic dissection.
Denominator Not applicable.
Trend Not applicable: focused 1 year report.
Variance Mean cases per year by unit ranged from 3-32. There were regional variations in crude mortality. Mortality was not related to size of the consultant rota, but there was a trend for a lower mortality if mean unit case volume was >12.
The GIRFT report into Cardiothoracic Surgery in 2018 recommended patients with acute aortic syndromes (such as aortic dissection) should only be operated on by rotas of surgeons in acute aortic surgery specialist teams.4 In particular it specifies that operations on aortic dissection should only be performed by specialist surgeons and that minimum activity levels for each surgeon should be defined.
The audit seeks to show the outcomes of surgery for acute aortic dissection in the UK. It also describes the different rota models of surgical teams currently providing emergency aortic surgery. It examines whether it is possible to define the minimum activity level for a surgeon performing this type of high risk, but low volume, surgery.
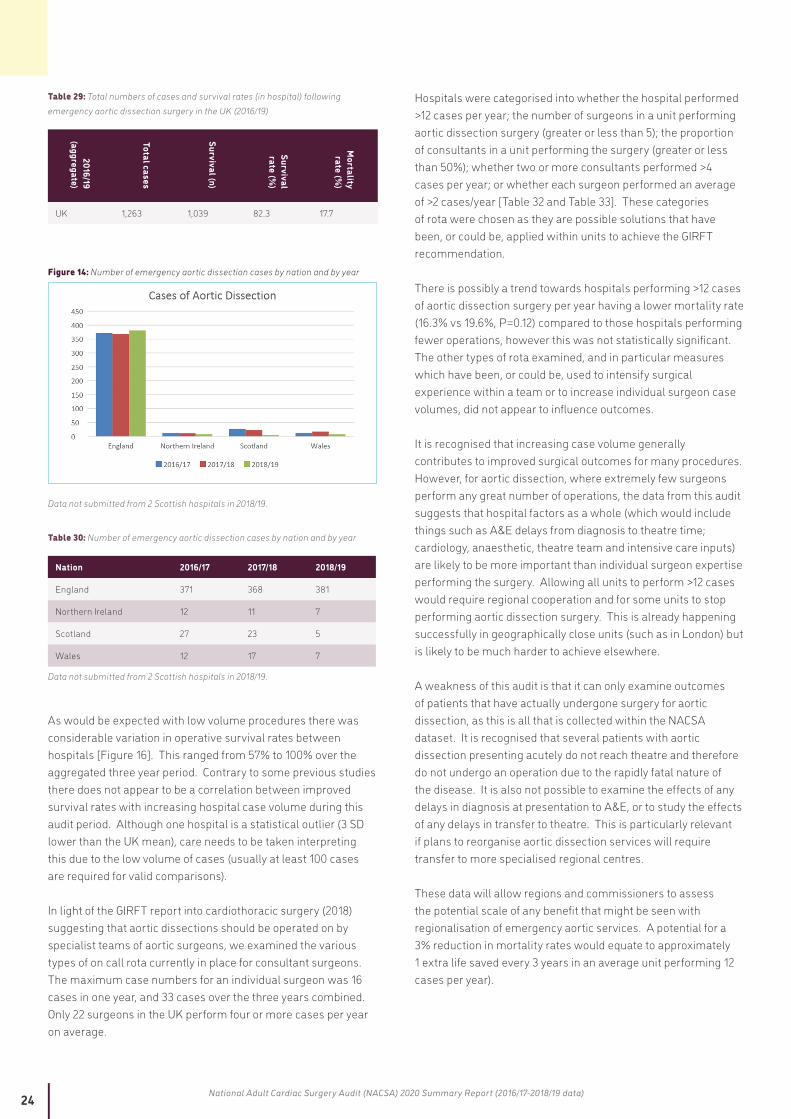
During the three year audit period (2016/19) there were just over 400 cases per year of surgery performed for acute aortic dissection in the UK [Table 29 and Table 30].
The mean number of cases performed by each unit was 11.7 per year. This compares to a median of 9.5 cases per year for each hospital in the USA.5 There is a wide variation in throughput, with the largest UK unit performing 32 cases and the smallest only 2.7 per year on average.
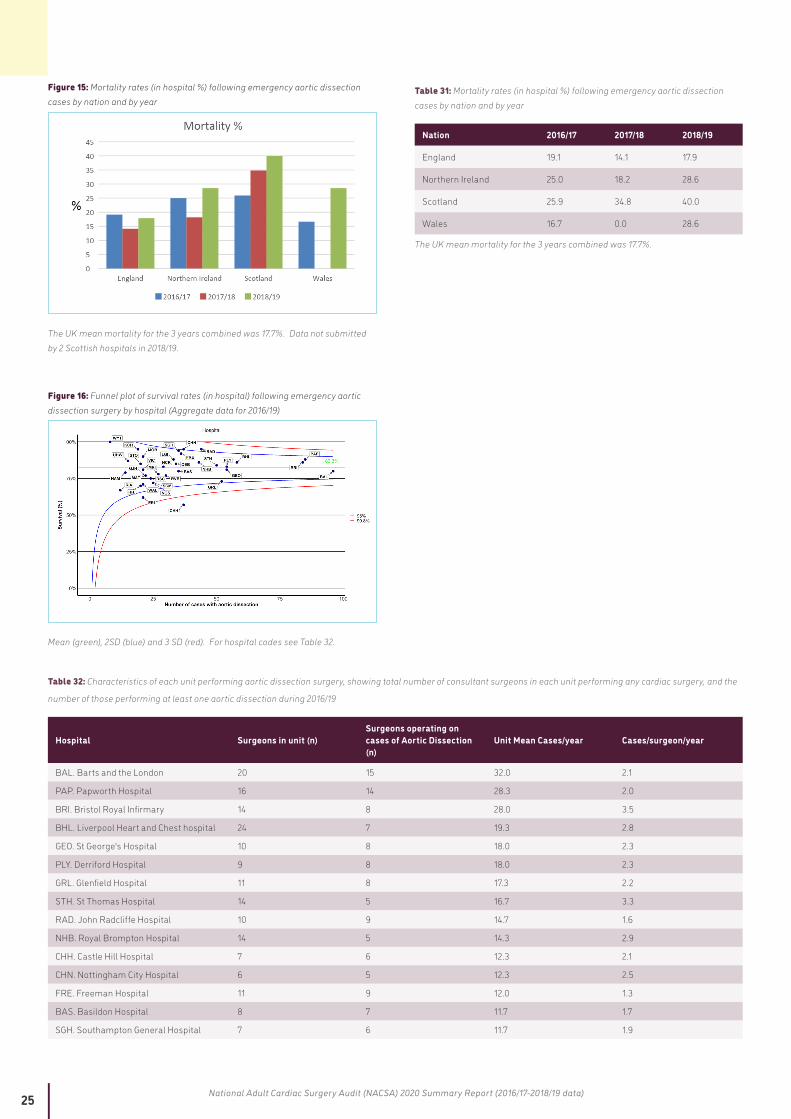
The UK mean mortality rate (in hospital) during this time was 17.7%. This is very similar to the reported rates of 17.2% in the UK (2007/2013), 17% in the USA (2014/17) and 16.9% in the German GERAADA registry of aortic dissection.5-7 The lowest mortality rates were seen in England compared to the other 3 nations [Figure 15], although care is needed with interpreting this due to the relatively low numbers of hospitals and operations performed outside England. There does not appear to have been any improvement in UK mortality rates in the past decade.
The mortality rates seen in this audit are very different to those reported in GIRFT (2018) which quotes a mean UK mortality rate of 12.3% for England. However, GIRFT has used HES data and has included all aortovascular surgery performed on a non-elective basis (and so will include many cases that are not acute aortic syndromes or emergencies).
24 National Adult Cardiac Surgery Audit (NACSA) 2020 Summary Report (2016/17-2018/19 data)
Table 29: Total numbers of cases and survival rates (in hospital) following emergency aortic dissection surgery in the UK (2016/19)
2016/19 (aggregate)
Total cases
Survival (n)
Survival rate (%
)
Mortality rate (%
)
UK 1,263 1,039 82.3 17.7
Figure 14: Number of emergency aortic dissection cases by nation and by year
Data not submitted from 2 Scottish hospitals in 2018/19.
Table 30: Number of emergency aortic dissection cases by nation and by year
Nation 2016/17 2017/18 2018/19
England 371 368 381
Northern Ireland 12 11 7
Scotland 27 23 5
Wales 12 17 7
Data not submitted from 2 Scottish hospitals in 2018/19.
As would be expected with low volume procedures there was considerable variation in operative survival rates between hospitals [Figure 16]. This ranged from 57% to 100% over the aggregated three year period. Contrary to some previous studies there does not appear to be a correlation between improved survival rates with increasing hospital case volume during this audit period. Although one hospital is a statistical outlier (3 SD lower than the UK mean), care needs to be taken interpreting this due to the low volume of cases (usually at least 100 cases are required for valid comparisons).
In light of the GIRFT report into cardiothoracic surgery (2018) suggesting that aortic dissections should be operated on by specialist teams of aortic surgeons, we examined the various types of on call rota currently in place for consultant surgeons. The maximum case numbers for an individual surgeon was 16 cases in one year, and 33 cases over the three years combined. Only 22 surgeons in the UK perform four or more cases per year on average.
Hospitals were categorised into whether the hospital performed >12 cases per year; the number of surgeons in a unit performing aortic dissection surgery (greater or less than 5); the proportion of consultants in a unit performing the surgery (greater or less than 50%); whether two or more consultants performed >4 cases per year; or whether each surgeon performed an average of >2 cases/year [Table 32 and Table 33]. These categories of rota were chosen as they are possible solutions that have been, or could be, applied within units to achieve the GIRFT recommendation.
There is possibly a trend towards hospitals performing >12 cases of aortic dissection surgery per year having a lower mortality rate (16.3% vs 19.6%, P=0.12) compared to those hospitals performing fewer operations, however this was not statistically significant. The other types of rota examined, and in particular measures which have been, or could be, used to intensify surgical experience within a team or to increase individual surgeon case volumes, did not appear to influence outcomes.
It is recognised that increasing case volume generally contributes to improved surgical outcomes for many procedures. However, for aortic dissection, where extremely few surgeons perform any great number of operations, the data from this audit suggests that hospital factors as a whole (which would include things such as A&E delays from diagnosis to theatre time; cardiology, anaesthetic, theatre team and intensive care inputs) are likely to be more important than individual surgeon expertise performing the surgery. Allowing all units to perform >12 cases would require regional cooperation and for some units to stop performing aortic dissection surgery. This is already happening successfully in geographically close units (such as in London) but is likely to be much harder to achieve elsewhere.
A weakness of this audit is that it can only examine outcomes of patients that have actually undergone surgery for aortic dissection, as this is all that is collected within the NACSA dataset. It is recognised that several patients with aortic dissection presenting acutely do not reach theatre and therefore do not undergo an operation due to the rapidly fatal nature of the disease. It is also not possible to examine the effects of any delays in diagnosis at presentation to A&E, or to study the effects of any delays in transfer to theatre. This is particularly relevant if plans to reorganise aortic dissection services will require transfer to more specialised regional centres.
These data will allow regions and commissioners to assess the potential scale of any benefit that might be seen with regionalisation of emergency aortic services. A potential for a 3% reduction in mortality rates would equate to approximately 1 extra life saved every 3 years in an average unit performing 12 cases per year).
25 National Adult Cardiac Surgery Audit (NACSA) 2020 Summary Report (2016/17-2018/19 data)
Figure 15: Mortality rates (in hospital %) following emergency aortic dissection cases by nation and by year
The UK mean mortality for the 3 years combined was 17.7%. Data not submitted by 2 Scottish hospitals in 2018/19.
Table 31: Mortality rates (in hospital %) following emergency aortic dissection cases by nation and by year
Nation 2016/17 2017/18 2018/19
England 19.1 14.1 17.9
Northern Ireland 25.0 18.2 28.6
Scotland 25.9 34.8 40.0
Wales 16.7 0.0 28.6
The UK mean mortality for the 3 years combined was 17.7%.
Figure 16: Funnel plot of survival rates (in hospital) following emergency aortic dissection surgery by hospital (Aggregate data for 2016/19)
Mean (green), 2SD (blue) and 3 SD (red). For hospital codes see Table 32.
Table 32: Characteristics of each unit performing aortic dissection surgery, showing total number of consultant surgeons in each unit performing any cardiac surgery, and the
number of those performing at least one aortic dissection during 2016/19
Hospital Surgeons in unit (n)Surgeons operating on cases of Aortic Dissection (n)
Unit Mean Cases/year Cases/surgeon/year
BAL. Barts and the London 20 15 32.0 2.1
PAP. Papworth Hospital 16 14 28.3 2.0
BRI. Bristol Royal Infirmary 14 8 28.0 3.5
BHL. Liverpool Heart and Chest hospital 24 7 19.3 2.8
GEO. St George's Hospital 10 8 18.0 2.3
PLY. Derriford Hospital 9 8 18.0 2.3
GRL. Glenfield Hospital 11 8 17.3 2.2
STH. St Thomas Hospital 14 5 16.7 3.3
RAD. John Radcliffe Hospital 10 9 14.7 1.6
NHB. Royal Brompton Hospital 14 5 14.3 2.9
CHH. Castle Hill Hospital 7 6 12.3 2.1
CHN. Nottingham City Hospital 6 5 12.3 2.5
FRE. Freeman Hospital 11 9 12.0 1.3
BAS. Basildon Hospital 8 7 11.7 1.7
SGH. Southampton General Hospital 7 6 11.7 1.9
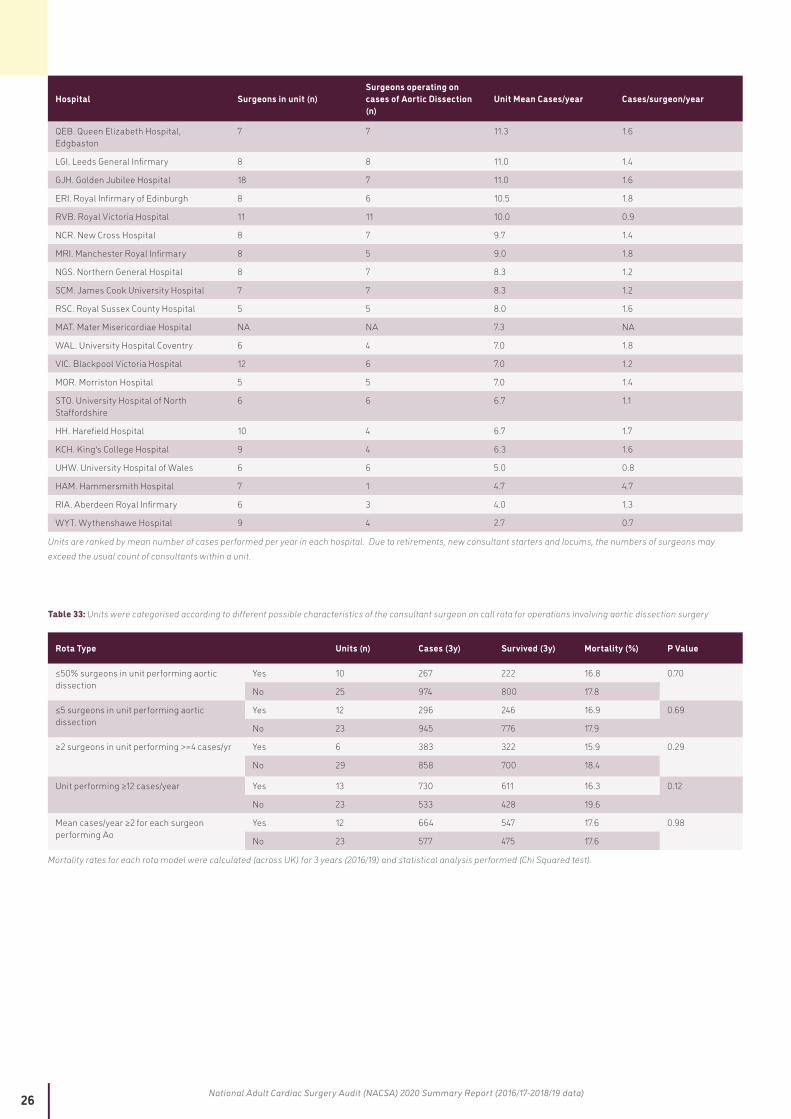
26 National Adult Cardiac Surgery Audit (NACSA) 2020 Summary Report (2016/17-2018/19 data)
Hospital Surgeons in unit (n)Surgeons operating on cases of Aortic Dissection (n)
Unit Mean Cases/year Cases/surgeon/year
QEB. Queen Elizabeth Hospital, Edgbaston
7 7 11.3 1.6
LGI. Leeds General Infirmary 8 8 11.0 1.4
GJH. Golden Jubilee Hospital 18 7 11.0 1.6
ERI. Royal Infirmary of Edinburgh 8 6 10.5 1.8
RVB. Royal Victoria Hospital 11 11 10.0 0.9
NCR. New Cross Hospital 8 7 9.7 1.4
MRI. Manchester Royal Infirmary 8 5 9.0 1.8
NGS. Northern General Hospital 8 7 8.3 1.2
SCM. James Cook University Hospital 7 7 8.3 1.2
RSC. Royal Sussex County Hospital 5 5 8.0 1.6
MAT. Mater Misericordiae Hospital NA NA 7.3 NA
WAL. University Hospital Coventry 6 4 7.0 1.8
VIC. Blackpool Victoria Hospital 12 6 7.0 1.2
MOR. Morriston Hospital 5 5 7.0 1.4
STO. University Hospital of North Staffordshire
6 6 6.7 1.1
HH. Harefield Hospital 10 4 6.7 1.7
KCH. King's College Hospital 9 4 6.3 1.6
UHW. University Hospital of Wales 6 6 5.0 0.8
HAM. Hammersmith Hospital 7 1 4.7 4.7
RIA. Aberdeen Royal Infirmary 6 3 4.0 1.3
WYT. Wythenshawe Hospital 9 4 2.7 0.7
Units are ranked by mean number of cases performed per year in each hospital. Due to retirements, new consultant starters and locums, the numbers of surgeons may exceed the usual count of consultants within a unit.
Table 33: Units were categorised according to different possible characteristics of the consultant surgeon on call rota for operations involving aortic dissection surgery
Rota Type Units (n) Cases (3y) Survived (3y) Mortality (%) P Value
≤50% surgeons in unit performing aortic dissection
Yes 10 267 222 16.8 0.70
No 25 974 800 17.8
≤5 surgeons in unit performing aortic dissection
Yes 12 296 246 16.9 0.69
No 23 945 776 17.9
≥2 surgeons in unit performing >=4 cases/yr Yes 6 383 322 15.9 0.29
No 29 858 700 18.4
Unit performing ≥12 cases/year Yes 13 730 611 16.3 0.12
No 23 533 428 19.6
Mean cases/year ≥2 for each surgeon performing Ao
Yes 12 664 547 17.6 0.98
No 23 577 475 17.6
Mortality rates for each rota model were calculated (across UK) for 3 years (2016/19) and statistical analysis performed (Chi Squared test).
27 National Adult Cardiac Surgery Audit (NACSA) 2020 Summary Report (2016/17-2018/19 data)
RecommendationsRegions and units need to collect and audit data on all patients presenting with aortic dissection, not just those undergoing emergency surgery.
In regions or units where there are concerns about outcomes or case numbers, a system-level review should be undertaken for patients requiring surgery for aortic dissection, taking into account the need to optimise the entire pathway of care.
Regions seeking to redesign pathways for aortic dissection surgery should concentrate on unit case volumes and measures to increase hospital level expertise, rather than increasing surgical consultant sub-specialism. Although the evidence is weak, it is suggested that minimum levels of 12 cases per year (1 per month) within a unit may be required to see improvements in outcomes (mortality rates).
Units should seek to optimise pathways of care and team working (including A&E, cardiology, anaesthesia, theatre and perfusion staff, intensive care and nursing teams) to achieve the best outcomes for aortic dissection.
Reducing the numbers of surgeons within on call rotas, or aiming to have specialist rotas of aortic surgeons, is unlikely on its own to significantly improve outcomes without first increasing unit case volumes.
Units and regions should collect and audit data on all patients with aortic dissection that do not undergo surgery within their catchment areas. This should include deaths prior to operation and any delays to treatment (in particular time from acute presentation to A&E to time of operation).
28 National Adult Cardiac Surgery Audit (NACSA) 2020 Summary Report (2016/17-2018/19 data)
REFERENCES
1. National Adult Cardiac Surgical Database (NACSD) Report 2000/2001. (Published by Dendrite Clinical Systems Ltd).2. Neumann F J, Sousa-Uva M, Ahlsson A, et al. 2018 ESC/EACTS Guidelines on myocardial revascularization, European Heart Journal, Volume 40,
Issue 2, 07 January 2019, Pages 87–165, https://doi.org/10.1093/eurheartj/ehy3943. CQUIN IM1 Reducing cardiac surgery non-elective inpatient waiting. https://www.england.nhs.uk/wp-content/uploads/2016/03/im1-reduc-cardiac-
surgry-non.pdf4. GIRFT Programme National Specialty Report - Cardiothoracic Surgery (March 2018) https://gettingitrightfirsttime.co.uk/wp-content/
uploads/2018/04/GIRFT-Cardiothoracic-Report-1.pdf5. Ghoreishi M, Sundt TM, Cameron DE, et al. Factors associated with acute stroke after type A aortic dissection repair: An analysis of the Society of
Thoracic Surgeons National Adult Cardiac Surgery Database. J Thorac Cardiovasc Surg. 2020;159(6):2143-2154.e3. doi:10.1016/j.jtcvs.2019.06.0166. Bottle A, Mariscalco G, Shaw MA, et al. Unwarranted Variation in the Quality of Care for Patients With Diseases of the Thoracic Aorta. J Am Heart
Assoc. 2017;6(3):e004913. Published 2017 Mar 14. doi:10.1161/JAHA.116.0049137. Conzelmann LO, Weigang E, Mehlhorn U, et al. Mortality in patients with acute aortic dissection type A: analysis of pre- and intraoperative risk
factors from the German Registry for Acute Aortic Dissection Type A (GERAADA). Eur J Cardiothorac Surg. 2016 Feb;49(2):e44-52. doi: 10.1093/ejcts/ezv356.
29 National Adult Cardiac Surgery Audit (NACSA) 2020 Summary Report (2016/17-2018/19 data)
THANKS AND ACKNOWLEDGEMENTS
We would like to thank the contribution of the following individuals and organisations:
• All hospitals and individual cardiac surgeons, nurses, data managers and clinical audit teams who contribute to this audit. Without their engagement, patients would not have benefited from improved care over the last ten years. We would like to thank the clinical teams who have contributed a case study. By sharing best practice, they illustrate the role of good quality data in improving patient care.
• Our patient representatives on the NCAP Operational and Methodology Group and the NICOR Patient Advisory Group and Panel for their contribution to the programme and their help in determining the content of this report.
This report was prepared by Andrew Goodwin (Clinical Lead for NACSA), Samuel Perwaiz (Project Manager), Jiaqiu Wang (NICOR Analyst) and Ebere Okafor (Project Coordinator) with support from colleagues within the NCAP team and the NACSA Domain Expert Group (in particular Uday Trivedi, SCTS Cardiac Audit Lead, and Simon Kendall President of SCTS who have contributed to the draft versions).
We also appreciate the continuing support of colleagues within the National Institute for Cardiovascular Outcomes Research (NICOR), the clinical leads of the other domains within the National Cardiac Audit Programme (NCAP), members of the NCAP Operational & Methodology Group, chaired by Prof Mark de Belder, the NCAP Delivery Group, chaired by Mr James Chal, and colleagues from UCL Partners. We also acknowledge the encouragement of Ross Pow, of Power of Numbers Ltd, who facilitated workshops to guide the interpretation and presentation of various aspects of NCAP.
The NCAP is commissioned by the Healthcare Quality Improvement Partnership (HQIP) as part of the National Clinical Audit and Patient Outcomes Programme (NCAPOP). Please go to www.hqip.org.uk for more information. Email: [email protected]
This report is available online at: https://www.nicor.org.uk/national-cardiac-audit-programme/adult-cardiac-surgery-surgery-audit/
© 2020 Healthcare Quality Improvement Partnership (HQIP)
This report was published on 10 December 2020
30 National Adult Cardiac Surgery Audit (NACSA) 2020 Summary Report (2016/17-2018/19 data)
NATIONAL INSTITUTE FOR CARDIOVASCULAR OUTCOMES RESEARCH (NICOR)
NICOR is a partnership of clinicians, IT experts, statisticians, academics and managers who, together, are responsible for six cardiovascular clinical audits (the National Cardiac Audit Programme – NCAP) and a number of new health technology registries, including the UK TAVI registry. Hosted by Barts Health NHS Trust, NICOR collects, analyses and interprets vital cardiovascular data into relevant and meaningful information to promote sustainable improvements in patient well-being, safety and outcomes. It is commissioned by the Healthcare Quality Improvement Partnership (HQIP) with funding from NHS England and the Welsh Government and, for four of the domains, from the Scottish Government. Funding has been sought to aid the participation of hospitals in Northern Ireland, the Republic of Ireland and the private sector. Email: [email protected]
SOCIETY OF CARDIOTHORACIC SURGEONS IN GREAT BRITAIN & IRELAND
The SCTS is an affiliated group of the Royal College of Surgeons of England and has charitable status. The Charity’s objects are to enable surgeons to achieve and maintain the highest standards of surgical practice and patient care. www.scts.org
BARTS HEALTH NHS TRUST
With a turnover of £1.5 billion and a workforce of around 17,000 people, Barts Health is a leading healthcare provider in Britain and one of the largest NHS Trusts in the country. The Trust’s five hospitals – St Bartholomew’s Hospital in the City, The Royal London Hospital in Whitechapel, Newham Hospital in Plaistow, Whipps Cross Hospital in Leytonstone and Mile End Hospital – deliver high quality compassionate care to the 2.5 million people of east London and beyond.
THE HEALTHCARE QUALITY IMPROVEMENT PARTNERSHIP (HQIP)
HQIP is led by a consortium of the Academy of Medical Royal Colleges, the Royal College of Nursing and National Voices. Its aim is to promote quality improvement in patient outcomes, and in particular, to increase the impact that clinical audit, outcome review programmes and registries have on healthcare quality in England and Wales. HQIP holds the contract to commission, manage and develop the National Clinical Audit and Patient Outcomes Programme (NCAPOP), comprising around 40 projects covering care provided to people with a wide range of medical, surgical and mental health conditions. The programme is commissioned by NHS England, the Welsh Government and, with some individual projects, other devolved administrations and crown dependencies. www.hqip.org.uk/national-programmes