national aeronautics and space administration orbital debris · national aeronautics and space...
TRANSCRIPT

Orbital DebrisQuarterly News
A publication ofthe NASA Orbital
Debris Program Office
Inside...
National Aeronautics and Space Administration
Volume 14, Issue 3July 2010
Disposal of TDRS-1 2
Top Ten Satellite Breakups 2
Drifting in GEO 3
Measurements of the Orbital Debris Environment by the Haystack & HAX Radars During FY2007 3
Overview of Orbital Debris Optical Measurements via Laboratory Techniques 5
Abstracts from the NASA Orbital Debris Program Office 7
Meeting Reports 11
Space Missions and Orbital Box Score 12
New U.S. National Space Policy Cites Orbital Debris
President Barack Obama issued his first National Space Policy for the United States of America on 28 June, including specific references to orbital debris mitigation and long-term sustainability of the space environment. Since 1988 each U.S. President has set forth clear objectives for limiting the growth of the orbital debris population in their national space policies. For the first time, the national space policy noted the need to pursue research and development of technologies and techniques to remove orbital debris.
Under the heading Preserving the Space Environment and the Responsible Use of Space, the new national space policy reads as follows:
“Preserve the Space Environment. For the purposes of minimizing debris and preserving the space environment for the responsible, peaceful, and safe use of all users, the United States shall:
Lead the continued development and adoption of international and industry standards and policies to minimize debris, such as the United Nations Space Debris Mitigation Guidelines;
Develop, maintain, and use space situational awareness (SSA) information from commercial, civil, and national security sources to detect, identify, and attribute actions in space that are contrary to responsible use and the long-term sustainability of the space environment:
Continue to follow the United States Government Orbital Debris Mitigation Standard Practices, consistent with mission requirements and cost effectiveness, in the procurement and operation of spacecraft, launch services, and the conduct of tests and experiments in space;
Pursue research and development of technologies and techniques, through the Administrator of the National Aeronautics and Space Administration (NASA) and the Secretary of Defense, to mitigate and remove on-orbit debris, reduce hazards, and increase understanding of the current and future debris environment; and
Require the head of the sponsoring department or agency to approve exceptions to the United States Government Orbital Debris Mitigation Standard Practices and notify the Secretary of State.” ♦
•
•
•
•
•
J UNE 28 , 2 010
NATIONAL SPACE POLICYof the
UNITED STATES of AMERICA

Orbital Debris Quarterly News
�
Top Ten Satellite BreakupsAlthough more than 4700 space
missions have been conducted worldwide since the beginning of the Space Age, only 10 missions account for one-third of all cataloged objects currently in Earth orbit. Perhaps surprisingly, 6 of these 10 debris-producing events occurred within the past 10 years, despite the decades-long efforts of the international aerospace community to eliminate the creation of long-lived debris. Notably, only one of these satellite breakups, albeit the most severe, was the result of an intentional act (Table 1).
By far the source of the greatest amount of orbital debris is the Fengyun-1C spacecraft, which was the subject of a Chinese anti-satellite test in 2007 (ODQN: April and July 2007; January, April, and July 2008; January and July 2009; and April 2010).
Table 1. Top 10 Breakups, May 2010
Common Name Year of Breakup
Altitude of Breakup
Cataloged Debris*
Debris in Orbit* Cause of Breakup
Fengyun-1C 2007 850 km 2841 2756 Intentional Collision
Cosmos 2251 2009 790 km 1267 1215 Accidental Collision
STEP 2 Rocket Body 1996 625 km 713 63 Accidental Explosion
Iridium 33 2009 790 km 521 498 Accidental Collision
Cosmos 2421 2008 410 km 509 18 Unknown
SPOT 1 Rocket Body 1986 805 km 492 33 Accidental Explosion
OV 2-1 / LCS 2 Rocket Body 1965 740 km 473 36 Accidental Explosion
Nimbus 4 Rocket Body 1970 1075 km 374 248 Accidental Explosion
TES Rocket Body 2001 670 km 370 116 Accidental Explosion
CBERS 1 Rocket Body 2000 740 km 343 189 Accidental Explosion
Total: 7903 Total: 5172* As of May 2010
Disposal of TDRS-1The venerable TDRS 1 spacecraft
(1983-026B, U.S. Satellite Number 13969), the inaugural member of NASA’s essential Tracking and Data Relay System, performed a complex series of maneuvers during June to boost the vehicle more than 350 km above the geosynchronous orbit (GEO) into a long-term disposal orbit.
Carried into orbit during the maiden voyage of the Space Shuttle Challenger (STS-6) in April 1983, TDRS 1 survived a malfunction of the Inertial Upper Stage which was to carry the spacecraft from low Earth orbit into GEO. Left in an orbit far below GEO, TDRS 1 was able to use its own ample propulsion system to reach GEO and to begin its communications
relay mission later that year. However, in the orbit-raising p r o c e s s , t h e primary reaction control system was disabled with an apparent leak, and future operations with the secondary reaction control s y s t e m w e r e impaired.
After more than 14 years of service supporting a variety of NASA missions, including
flights of the Space Shuttle fleet, TDRS 1 became a vital communications link in 1998 for the Nat iona l Sc ience Foundation’s Antarctic research stat ions. Following a mission-ending payload failure, TDRS 1 was finally decommissioned on 28 October 2009, after more than 26 years of operation. The spacecraft was transferred from its last service location of 49 W to a temporary storage location at 56.5 W to await preparations for its final disposal.
On 5 June 2010 TDRS 1 began an 8-day series of maneuvers to lift the spacecraft well away from the congested GEO regime. At that point, TDRS 1, which had been designed and built in the 1970s, still had more than 120 kg of residual propellant on board without a means for venting it. To passivate the spacecraft, the vehicle was placed in a spin-stable solar-oriented attitude. Then, increasingly longer burns of two thrusters were initiated for a total burn time of 24 hours. Fuel depletion was finally achieved on 26 June, at which time the rest of 1.6 metric ton TDRS 1 was passivated and turned-off. ♦
Figure 1. TDRS-1 spacecraft.
continued on page 3

www.orbitaldebris.jsc.nasa.gov
�
This satellite alone now accounts for more than 2750 cataloged fragments or about 18% of the entire population of cataloged man-made objects in orbit about the planet. Hundreds more debris from this test are currently being tracked by the U.S. Space Surveillance Network (SSN) and will be officially cataloged in due course.
The second and fourth most significant satellite breakups are the Cosmos 2251 and Iridium 33 spacecraft, which were involved in
the first ever accidental hypervelocity impact of intact objects in February 2009. Due to the altitude of this collision and low solar activity levels, only 4% of each debris cloud have thus far fallen out of orbit.
Fortunately, less than 10% of the cataloged fragments from the third most prolific source of orbital debris, the STEP 2 rocket body, still remain in orbit. Likewise, the debris of three other major debris generators have fallen below 10% of their original numbers.
Not listed in the table is the breakup of the Briz-M orbital stage that broke-up into an estimated 1000 plus fragments in February 2007 (ODQN, April 2007). However, the highly elliptical nature of the stage’s orbit (~500 km by nearly 15,000 km) has impeded the SSN’s ability to detect, to identify, and to catalog the associated debris. By May 2010, only 85 debris from the Briz-M stage had been officially cataloged. ♦
M. HORSTMAN, Q. JUAREZ, V. PAPANYAN, E. STANSBERY AND C. STOKELY
NASA has been utilizing radar observations of the debris environment from the MIT Lincoln Laboratory Long Range Imaging Radar (known
as the Haystack radar) and the smaller nearby Haystack Auxiliary Radar (HAX) for nearly two decades.1 Both of these systems are highly sensitive radars that operate in a fixed staring mode to statistically sample orbital debris in the
low Earth orbit (LEO) environment. Using such highly sensitive, short wavelength radars is currently the best practical way to sample the
continued on page 4
Drifting in GEOA major malfunction on 5 April resulted in
a sudden and complete loss of control of the Galaxy 15 spacecraft (2005-041A, U.S. Satellite Number 28884). Originally stationed over the equator at 133 W, the approximately one-ton
spacecraft began a very slow drift eastward and, if control over the vehicle cannot be restored, will likely enter a long-period oscillation orbit around the geopotential stable point at 105 W, moving from 133 W to 77 W and back again.
Although Galaxy 15 will pass close to other operational spacecraft in the Western Hemisphere, the U.S. Space Surveillance Network is closely watching its movement and will advise operators of other spacecraft should a potentially hazardous conjunction, i.e., a pass of less than 5 km between two spacecraft, be forecast. In such an event the operator of the other spacecraft will
have sufficient warning to perform a collision avoidance maneuver, if warranted.
Galaxy 15 joins a large number (>150) of other derelict spacecraft and launch vehicle orbital stages that are drifting back and forth in the geosynchronous (GEO) region. Last year three Russian spacecraft failed to perform any disposal maneuvers, which are designed to keep the vehicles at least 200 km above the GEO altitude of 35,786 km. In 2008, two other spacecraft, one U.S. and one Russian, also failed to maneuver out of GEO at their end of mission.
Of more immediate concern to other GEO spacecraft operators was the threat of radio interference from the still functioning Galaxy 15 payload. Several attempts to turn-off Galaxy 15’s transmitters failed. However, a loss of attitude control is expected to lead to a shut-down of the transmitters later this year. ♦
Figure 1. Galaxy 15 spacecraft (credit: Orbital Sciences Corporation).
Measurements of the Orbital Debris Environment by the Haystack and HAX Radars During Fiscal Year 2007
PROJECT REVIEWS
Top Tencontinued from page 2

Orbital Debris Quarterly News
�
Measurements of the OD Environmentcontinued from page 3
population between 5 mm and 10 cm. This is a size regime that eludes the Space Surveillance Network (SSN), yet poses a significant risk to all orbiting assets. Dynamics in orbit cause all orbital objects to have varying decay rates, which in turn affect how much of the debris reenters; whereas, new launches and breakups in space add to the debris environment in ways that are very hard to predict.
Data sampled via radar is used to develop, update, and validate existing orbital debris models.2 These models can be used for risk analysis of space operations, shielding design of spacecraft for protection from impacts with orbital debris, as well as general studies of the debris environment. They can also be quite useful in attempting to understand the nature of debris-generating events.
The 2007 fiscal year (FY) saw the largest breakup in history occur with the intentional destruction of the Fengyun-1C weather satellite by an anti-satellite test conducted by China (see also the breakup article on pg. 2). The resulting cloud of debris has affected the entire LEO region and has generated concern for the safe operations of spacecraft in the future.
Immediately after the collision, the Haystack/HAX facility was tasked to sample the orbital region where this breakup occurred and to monitor the progress of the debris cloud (ODQN, July 2008). In comparison with previous datasets, the impact of the
Fengyun-1C test is starkly apparent and will continue to be included in debris data analysis for some time.3
During FY2007, the Haystack radar gathered 391.1 hours of data and HAX gathered 686.8 hours of data in the 75° east staring mode. This staring angle represents a compromise between the Doppler inclination resolution and slant range to an altitude. Due to the sensor geography and pointing of this mode, it is limited to sampling the debris environment above 42° inclination (the latitude of the radar). For lower inclination orbits, it is necessary to point farther south; therefore, the Haystack radar was also pointed in two other configurations: 10° and 20° elevation at 180° azimuth (due south) staring in order to obtain inclinations down to about 20°. Shown in Table 1 is the summary of data collected for FY2007.
Over the course of data gathering in FY2007, it became evident that the data included many Fengyun-1C debris detections. Figure 1 shows altitude versus flux for the Haystack radar pointed in the 75° east staring mode. In comparison to years past, altitudes below 900 km show a definite increase, as
shown by the contrasted FY2003 flux.The altitude of the Fengyun-1C satellite at
the time of impact was approximately 850 km with an inclination of 98.8°. The resulting breakup fragment orbits centered around 850 km, with extensions through 2000 km. As the debris orbits decay, these objects effectively “rain down” upon the lower altitudes. The estimated effects of the breakup on debris flux indicate an increase across all LEO regimes, though most critically in those below 1000 km. These data illustrate the impact of the ASAT test to the LEO environment. As data continues to be collected and analyzed, a complete picture of the long-term effects of the event will soon emerge. Additional details for the 2007 Haystack and HAX radar measurements may be found in the upcoming NASA publication, “Haystack and HAX Radar Measurements of the Orbital Debris Environment; 2007.”
Stansbery, E. G., et al., Characterization of the Orbital Debris Environment using the Haystack Radar, NASA/JSC Publication JSC-32213 Appendix A, Houston, TX, (1993).
Liou, J.-C. et al., The New NASA Orbital Debris Engineering Model ORDEM 2000, NASA/TP - 2000 – 210780, (2000).
Johnson N.L., et al., The characteristics and consequences of the break-up of the Fengyun-1C spacecraft, Acta Astronautica, 63, p. 128–135, (2007). ♦
1.
2.
3.
Figure 1. Altitude distributions of flux from Haystack 75°east staring data for FY2007 and FY2003.
Table 1. FY2007 Radar Measurement Summary
Radar Hours
Observed # Detection Signals
> 5.521 dB* # Valid Detections
within Range**
HAX 75⁰E 686.8 1253 509
Haystack 75⁰E 391.1 4875 3503
Haystack 20⁰S 142.6 1316 996
Haystack 10⁰S 118.3 558 343 * 16 pulse non-coherent average ** sidelobe, noise and arcing removed
Haystack 75˚ East Altitude Distribution100 km bins, Diameter > 1 cm

www.orbitaldebris.jsc.nasa.gov
�
H. COWARDINIn an attempt to more accurately
characterize the orbital debris environment, especially in the under-sampled geosynchronous (GEO) regime, a laboratory was established to mimic optical telescope measurements at the NASA Orbital Debris Program Office. A collection of targets was selected as a subset representing orbital debris and categorized based on their shape, size, and material type. In order to best simulate the orbital debris population, three main sources were used: flight-ready materials, destructive hypervelocity testing (simulating on-orbit collisions) and destructive pressure testing (simulating on-orbit explosions). Laboratory optical characteristics of fragments were measured, including lightcurve shape, phase angle dependence, and photometric and spectroscopic color indices. These characteristics were then compared with similar optical measurements acquired from telescopic observations in order to correlate remote and laboratory properties with the intent of ascertaining the intrinsic properties of the observed objects. The results of this effort were published recently and a brief overview is described below.1
The design of the laboratory is analogous to telescope observations with three main parameters: light source, target, and detector/observer, shown in Figures 1 and 2. The laboratory phase angle (shown in Figure 1) as defined by the angle between light source, object, and detector, has a range between 6° and 68° using the maximum space in the facility. A 75-watt Xenon arc lamp is used to simulate the solar illumination through the spectral range of 200 to 2500 nm. The data are acquired through a CCD camera, with an attached 5-position filter wheel that uses the standard astronomical suite: Johnson Blue, Johnson Visible, Bessell Red, Bessell Infrared, and Clear. An Analytical Spectral Device field spectrometer (not shown) with a range from 300 to 2500 nm is also employed to baseline various material types. (Previous ODQN articles on the laboratory appeared in April 2006 and July 2007).
Fourteen fragments were chosen to best simulate different sources of orbital debris. These materials were collected from multiple ground-test impact tests, as well as samples from colleagues and manufacturers considered to be in “flight-ready” condition.2,3,4,5 A collection of objects with a variety of area-to-mass ratio
(A/m) values were investigated for correlations to telescope photometric data. The majority of ≥10 cm orbital debris is believed to have A/m values <1.0 m2/kg, such as aluminum which has an A/m <0.5 m2/kg. In 2005 a new population
of debris was detected in GEO that exhibited characteristics of objects with higher A/m (see ODQN, July 2004, p. 6-7).6 High A/m objects
Overview of Orbital Debris Optical Measurements via Laboratory Techniques
Figure 1. Diagram illustrating phase angle in laboratory between source, object, and detector.
Light source
CCD
Robotic arm holding target
6°
Light source CCD Robotic armholding target
Figure 2. Laboratory layout seen from robot’s position.
Figure 3. CTIO 0.9-m filter photometry of a GEO object during four filter sequences, labeled ‘1’, ‘2’, ‘3’, and ‘4’.
continued on page 6
Orbital Debris Quarterly News
�
Optical Measurementscontinued from page 5
possess unusual eccentricity and inclination variations – a characteristic generally resulting from the pronounced effect of solar radiation pressure. Multi-layer insulation (MLI) materials are a common spacecraft material known to have high A/m values (A/m >2 m2/kg). For comparison, a standard piece of notebook paper (8.5″ x 11″) has an A/m of approximately 6 m2/kg.
These fragments were investigated for shape characteristics relative to seven simple shapes and their respective lightcurves. The lightcurves were categorized into four groups: quatrimodal (four peaks), bimodal, multi-modal, and unimodal. The targets were measured at three different phase angles: 6°, 36°, and 68°, to investigate any variances in the light curve characteristics. It was found that phase angle does affect the number of peaks each target presents. All 14 fragments were found to have characteristics of a simple plate-like shape (two peaks) or irregular shape (more than two peaks) when rotated about the longest axis. The lightcurve characteristics were investigated to determine dependency on phase angle; 64% of the objects had consistent lightcurve characteristics, whereas 79% maintained consistency for two of the three phase angles. Material was also found to be an important factor in phase angle lightcurve characteristics. The glass-fiber reinforced plastic is plate-like by physical inspection, but due to the nature of the translucent material, it gave rise to two extra peaks at the highest phase angle.
For the laboratory analysis, both photometric and spectroscopic techniques were used to define color indices (filter ratios, such as blue-red ‘B-R’). The majority of the fragments were found to be within one sigma of the solar values based on the photometric measurements over all orientations, when solar corrections were applied.7 However, the copper-colored Kapton material found in MLI layers and a specific solar panel sample were found to be much redder than solar colors. Initial investigations of B-R values for GEO objects, acquired using the Cerro Tololo Inter-American Observatory (CTIO) 0.9 m, were also found to be redder than solar values.8 This may suggest we are seeing a specific group of materials in GEO or there is a space reddening factor that cannot be recreated in the laboratory environment at the present time.
The fragments were also investigated for material characteristics in relation to telescope filter photometry measurements taken from the CTIO 0.9 m as well as the European Space Agency (ESA) 1-m telescope. The ESA data provided lightcurves for various objects measured at different times, as well as estimated A/m values for observed objects. The comparisons between laboratory and ESA telescope data were based on A/m values, magnitude variations, and lightcurve characteristic structure. One specific set of data provided by the ESA 1-m telescope showed lightcurves of the same object with an A/m = 1.9 m2/kg at two different time
periods with remarkably different lightcurve structures. Based on the calculated A/m for the laboratory MLI-intact sample and solar cell fragment, the ESA telescopic data would likely best match one of these samples. Additional multiple filter observations will be needed to further discriminate between the two possible laboratory materials.
The filter photometry data shown in Figure 3 were taken using the CTIO 0.9-m telescope. The object was an uncorrelated target not catalogued by the U.S. Space Surveillance Network. The filter photometry is taken in the following sequence: R:B:I:V:R, always starting and finishing the sequence with the red filter to investigate any systematic change over the entire observation set (~20 minutes). The initial R measurement is shown in red and the last R measurement is shown in magenta. Some data points are missing due to contamination by star streaks. This object shows very small brightness and color variations in all filters for all short time scales (5 – 20 minutes), suggesting we are seeing just one aspect of this piece of debris. However, on longer timescales, both brightness and colors change significantly [note the behavior near 3 hours universal time (UT)], where the object brightens in B and V by approximately two magnitudes, yet becomes fainter in I by about the same amount. Also, the object becomes fainter in R by 1½ magnitudes shortly after 3 UT. The average B-R for each observation sequence began at 1.90 and ended with 1.63 nearly 3 hours later, but at 3 UT the
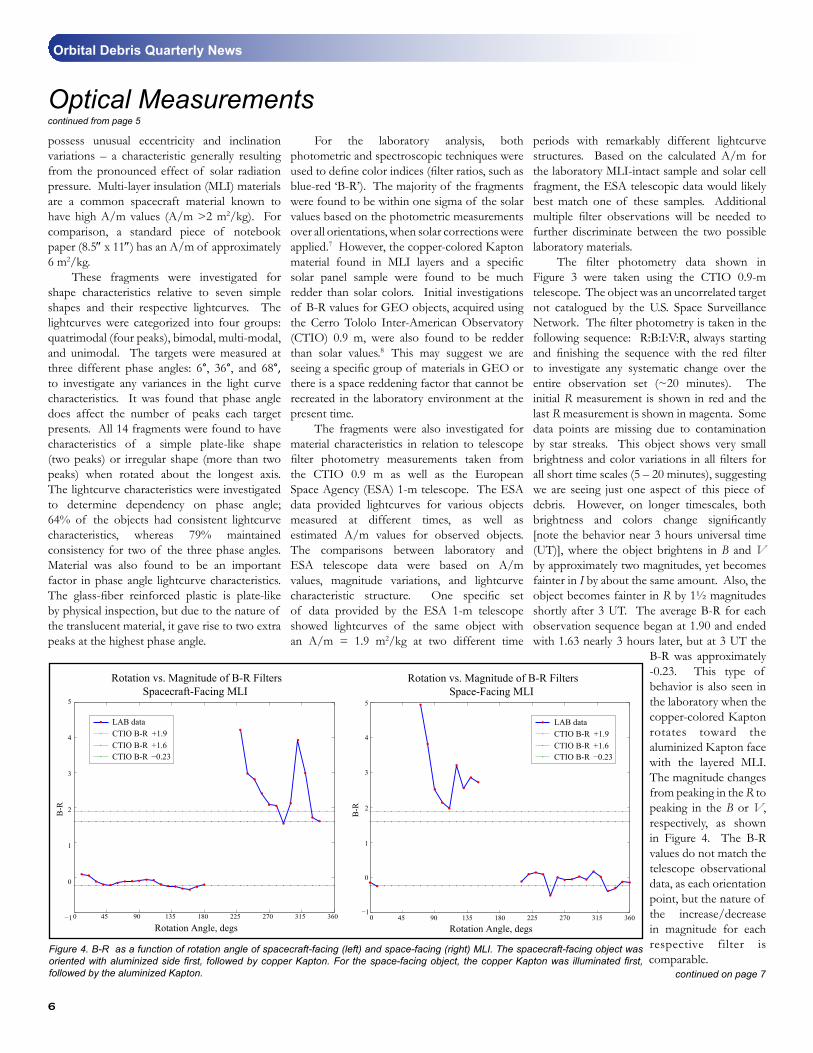
B-R was approximately -0.23. This type of behavior is also seen in the laboratory when the copper-colored Kapton rotates toward the aluminized Kapton face with the layered MLI. The magnitude changes from peaking in the R to peaking in the B or V, respectively, as shown in Figure 4. The B-R values do not match the telescope observational data, as each orientation point, but the nature of the increase/decrease in magnitude for each respective filter is comparable.
Figure 4. B-R as a function of rotation angle of spacecraft-facing (left) and space-facing (right) MLI. The spacecraft-facing object was oriented with aluminized side first, followed by copper Kapton. For the space-facing object, the copper Kapton was illuminated first, followed by the aluminized Kapton.
0 45 90 135 180 225 270 315 360−1
0
1
2
3
4
5
Rotation Angle, degs
B-R
Rotation vs. Magnitude of B-R FiltersSpacecraft-Facing MLI
LAB dataCTIO B-R +1.9CTIO B-R +1.6CTIO B-R −0.23
Rotation vs. Magnitude of B-R FiltersSpace-Facing MLI
Rotation Angle, degs
B-R
45 90 135 180 225 270 315 360−1
0
1
2
3
4
5
0
LAB dataCTIO B-R +1.9CTIO B-R +1.6CTIO B-R −0.23
continued on page 7

www.orbitaldebris.jsc.nasa.gov
�
Optical Measurementscontinued from page 6
Efforts continue to correct the light source problem mentioned previously. Future work includes increasing the number of fragments, material type, and shapes investigated, as well as extending the size ranges to much smaller values to better bridge the current size-estimation models in use by NASA. To continue with size estimation, future research will acquire an albedo distribution for multiple objects at different phase angles. The current global albedo for all altitude ranges may not be sufficient for all materials and will be investigated in future work. An improved albedo will lead to better definitions of debris sizes for optical measurements in the GEO regime.
1. Cowardin, H., Characterization of Orbital Debris Objects over Optical Wavelengths via Laboratory
Measurements, Ph.D. Dissertation, University of Houston, May 2010.
2. Hanada, T., and Liou, J.-C., Comparison of Fragments Created by Low- and Hyper- velocity Impacts, Advances in Space Research 41, Issue 7, (2008).
3. Hanada, T., and Liou, J.-C., Shape Distribution of Fragments from Microsatellite Impact Tests, 5th European Conference on Space Debris, Darmstadt, Germany, 30 March- 02 April, (2009).
4. Krisko, P., SOCIT4 Collisional-breakup Test Data Analysis: With Shape and Materials Characterization, Advances in Space Research 41, Issue 7, (2008).
5. Fucke, W., and Sdunnus, H., Population Model of Small Size Space Debris, Final Report,
ESOC # 9266/90/D/MD, Battelle-Institut, Frankfurt, Germany, (1993).
6. Schildknecht, T., et. al., Properties of the High Area-to Mass Ratio Space Debris Population in GEO, 2005 AMOS Technical Conference Proceedings, Kihei, Maui, HI, (2005).
7. Allen, C., Astrophysical Quantities, Third Edition, Athlone Press, University of London, p. 392, (1976).
8. Seitzer, P., et al, Photometric Studies of GEO Debris, Proceedings of the Advanced Maui Optical and Space Surveillance Technologies Conference, Wailea, Maui, Hawaii, September 1-4, (2009). ♦
38th Scientific Assembly of COSPAR, 18-25 July 2010, Bremen, GermanyAnalysis and Consequences of the Iridium 33-Cosmos 2251 CollisionP. ANZ-MEADOR AND J.-C. LIOU
The collision of Iridium 33 and Cosmos 2251, on 10 February 2009, was the first known unintentional hypervelocity collision in space of intact satellites. Iridium 33 was an active commercial telecommunications satellite, while Cosmos 2251 was a derelict communication satellite of the Strela-2M class. The collision occurred at a relative velocity of 11.6 km/s at an altitude of approximately 790 km over the Great Siberian Plain and near
the northern apex of Cosmos 2251’s orbit.This paper describes the physical and
orbital characteristics of the relevant spacecraft classes and reports upon our analysis of the resulting debris clouds’ size, mass, area-to-mass ratio, and relative velocity/directionality distributions. We compare these distributions to those predicted by the NASA breakup model and notable recent fragmentation events; in particular, we compare the area-to-mass ratio distribution for each spacecraft
to that exhibited by the FY-1C debris cloud for the purpose of assessing the relative contribution of modern aerospace materials to debris clouds resulting from energetic collisions. In addition, we examine the long-term consequences of this event for the low Earth orbit (LEO) environment. Finally, we discuss “lessons learned,” which may be incorporated into NASA’s environmental models. ♦
4th IAASS Conference, 19-21 May 2010, Huntsville, AlabamaNASA’s New Orbital Debris Engineering Model, ORDEM2010P. KRISKO
This paper describes the functionality and use of ORDEM2010, which replaces ORDEM2000, as the NASA Orbital Debris Program Office (ODPO) debris engineering model. Like its predecessor, ORDEM2010 serves the ODPO mission of providing spacecraft designers/operators and debris observers with a publicly available model to calculate orbital debris flux by current-state-of-knowledge methods. The key advance in ORDEM2010 is the input file structure of the yearly debris populations from 1995-2035 of sizes 10 µm-1 m. These files include
debris from low-Earth orbits (LEO) through geosynchronous orbits (GEO). Stable orbital elements (i.e., those that do not randomize on a sub-year timescale) are included in the files as are debris size, debris number, material density, random error and population error. Material density is implemented from ground-test data into the NASA breakup model and assigned to debris fragments accordingly. The random and population errors are due to machine error and uncertainties in debris sizes.
These high-fidelity population files call for a much higher-level model analysis than what was possible with the populations of ORDEM2000.
Population analysis in the ORDEM2010 model consists of mapping matrices that convert the debris population elements to debris fluxes. One output mode results in a spacecraft encompassing 3-D igloo of debris flux, compartmentalized by debris size, velocity, pitch, and yaw with respect to spacecraft ram direction. The second output mode provides debris flux through an Earth-based telescope/radar beam from LEO through GEO. This paper compares the new ORDEM2010 with ORDEM2000 in terms of processes and results with examples of specific orbits. ♦
ABSTRACTS FROM THE NASA ORBITAL DEBRIS PROGRAM OFFICE

Orbital Debris Quarterly News
�
R. KELLEY, N. HILL, W. ROCHELLE, N. JOHNSON, AND T. LIPS
Reentry analysis is essential to under-
standing the consequences of the full life cycle of a spacecraft. Since reentry is a key factor in spacecraft development, NASA and ESA
have separately developed tools to assess the survivability of objects during reentry. Criteria
N. JOHNSONSince 1964 at least 56 spacecraft and
2 launch vehicle upper stages have been deliberately fragmented while in Earth orbit. Many of these events have had no long-lasting effects on the near-Earth space environment, but one represents the most devastating satellite breakup in history that will pose hazards to operational spacecraft in low Earth orbit for decades to come. International space debris
mitigation guidelines now call for avoiding the creation of long-lived debris from intentional satellite fragmentations.
This paper summarizes the reasons for and environmental consequences of deliberate satellite fragmentations. Contrary to popular belief, only one in five deliberate fragmentations have been related to the testing of anti-satellite weapon systems, for which only one such test has occurred during the past 25 years. Other
reasons for deliberate satellite fragmentations range from engineering tests to protecting national security information. Whereas the majority of deliberate satellite fragmentations have occurred in low Earth orbits, some have involved spacecraft in highly elliptical orbits. The former Soviet Union and the current Russian Federation have been responsible for 90% of all identified deliberate on-orbit satellite fragmentations. ♦
S. FLEGEL, P. KRISKO, J. GELHAUS, C. WIEDEMANN, M. MÖCKEL, P. VÖRSMANN, H. KRAG, H. KLINKRAD, M. MATNEY, Y.-L. XU, M. HORSTMAN, AND J. OPIELA
The two software tools MASTER-2009 and ORDEM2010 are the ESA and NASA reference software tools respectively, which describe the earth’s debris environment. The primary goal of both programs is to allow users to estimate the object flux onto a target object for mission planning. The current paper describes the basic distinctions in the model philosophies.
At the core of each model lies the method by which the object environment is established and what role the results from radar/telescope observations or impact fluxes on surfaces returned from earth orbit play in this process. The ESA Meteoroid and Space Debris Terrestrial Environment Reference Model (MASTER)
is engineered to give a realistic description of the natural and the man-made particulate environment of the earth. Debris sources are simulated based on detailed lists of known historical events, such as fragmentations or solid rocket motor firings or through simulation of secondary debris, such as impact ejecta or the release of paint flakes from degrading spacecraft surfaces. The resulting population is then validated against historical telescope/radar campaigns using the ESA Program for Radar and Optical Observation Forecasting (PROOF) and against object impact fluxes on surfaces returned from space. The NASA Orbital Debris Engineering Model (ORDEM) series is designed to provide reliable estimates of orbital debris flux on spacecraft and through telescope or radar fields-of-view. Central to the model series is the empirical nature of the input populations. These are derived from
NASA orbital debris models but verified, where possible, with measurement data from various sources. The top-level structure of each version includes some format of debris populations as inputs. The model debris flux analysis code is designed to be compatible with the population structure and shares its limitations. The latest version of the series, ORDEM2010, compiles over two decades of data from NASA radar systems, telescopes, in-situ sources, and ground tests that are analyzed by sophisticated statistical methods.
For increased understanding of the application ranges of the two programs, the current paper provides an overview of the two model’s main program features and the methods by which simulation results are presented. This paper is written in a combined effort by ESA and NASA. ♦
continued on page 9
Basic Philosophy and Feature Comparison of the Debris Environment Models MASTER-2009 and ORDEM2010
Theoretical and Empirical Analysis of the Average Cross-Sectional Areas of Breakup Fragments
Deliberate Satellite Fragmentations and Their Effect on the Long-Term Space Environment
Comparison of ORSAT and SCARAB Reentry Analysis Tools for a Generic Satellite Test Case
T. HANADA AND J.-C. LIOUThis paper compares two different approaches to calculate the average cross-sectional areas of breakup fragments. The first one is described in the NASA standard breakup model 1998 revision. This approach visually classifies fragments into several shapes, and then applies formulae developed for each shape to calculate the average cross-sectional area. The second approach was developed jointly by the Kyushu University and the NASA Orbital Debris Program Office. This new approach automatically classifies fragments into plate- or irregular-shaped objects based on their aspect ratio and thickness, and then applies formulae
for each shape to calculate the average cross-sectional area.
The comparison between the two approaches will be demonstrated in the area-to-mass ratio (A/m) distribution of fragments from two microsatellite impact tests completed in early 2008. In order to determine which one of the two approaches provides a better description of the actual A/m distribution of breakup fragments, a theoretical analysis of two objects in ideal shape was conducted. The first one is an ideal plate. It is used to investigate the uncertainty of the formula described in the NASA standard breakup model. The second shape is an ideal cylinder. It is used to investigate
the uncertainty in the calculation of the average cross-sectional area of needle-like fragments generated from the CFRP layers and side panels of the microsatellite tests.
This paper will also investigate the average cross-sectional areas of multi-layer insulation (MLI) fragments. The average cross-sectional areas of 214 MLI fragments were measured by a planimeter, and then the data were used to benchmark the average cross-sectional areas estimated by the two approaches. The uncertainty in the calculation of the average cross-sectional area with the two approaches is also discussed in terms of size and thickness. ♦

www.orbitaldebris.jsc.nasa.gov
�
Comparison of ORSAT and SCARABcontinued from page 8
J.-C. LIOU AND THE HST WFPC2 MMOD INSPECTION TEAM
The STS-125 Atlantis astronauts retrieved the Hubble Space Telescope (HST) Wide Field Planetary Camera 2 (WFPC2) during a very successful servicing mission to the HST in May 2009. The radiator attached to WFPC2 has dimensions of 2.2 m by 0.8 m. Its outermost layer is a 4-mm thick aluminum plate covered with a white thermal control coating. This radiator had been exposed to space since the deployment of WFPC2 in 1993. Due to its
large surface area and long exposure time, the radiator serves as a unique witness plate for the micrometeoroid and orbital debris (MMOD) environment between 560 and 620 km altitude.
The NASA Orbital Debris Program Office is leading an effort to inspect the exposed radiator surface, with full support from the HST Program at GSFC, the NASA Curation Office at JSC, the NASA Hypervelocity Impact Technology Facility at JSC, and the NASA Meteoroid Environment Office at MSFC. The objective is to measure and analyze the MMOD
impact damage on the radiator, and then apply the data to validate or improve the near-Earth MMOD environment definition. The initial inspection was completed in September 2009. A total of 685 MMOD impact features (larger than about 0.3 mm) were identified and documented. This paper will provide an overview of the inspection, the analysis of the data, and the initial effort to use the data to model the MMOD environment. ♦
Micrometeoroid and Orbital Debris Impact Inspection of the Hubble Space Telescope Wide Field Planetary Camera 2 Radiator and the Implications for the Near-Earth Small Particle Environment
Characterizing the Space Debris Environment with a Variety of SSA SensorsE. STANSBERY
Damaging space debris spans a wide range of sizes and altitudes. Therefore no single method or sensor can fully characterize the space debris environment. Space debris researchers use a variety of radars and optical telescopes to characterize the space debris environment in terms of number, altitude, and inclination distributions. Some sensors, such as phased array radars, are designed to search a large volume of the sky and can be instrumental in detecting new breakups and cataloging and
precise tracking of relatively large debris. For smaller debris sizes more sensitivity is needed, which can be provided, in part, by large antenna gains. Larger antenna gains, however, produce smaller fields of view. Statistical measurements of the debris environment with less precise orbital parameters result. At higher altitudes, optical telescopes become the more sensitive instrument and present their own measurement difficulties.
Space Situational Awareness, or SSA, is concerned with more than the number and
orbits of satellites. SSA also seeks to understand such parameters as the function, shape, and composition of operational satellites. Similarly, debris researchers are seeking to characterize similar parameters for space debris to improve our knowledge of the risks debris poses to operational satellites, as well as determine sources of debris for future mitigation. This paper will discuss different sensor and sensor types and the role that each plays in fully characterizing the space debris environment. ♦
such as debris casualty area and impact energy are particularly important to understanding the risks posed to people on Earth. Therefore, NASA and ESA have undertaken a series of comparison studies of their respective reentry codes for verification and improvements in accuracy.
The NASA Object Reentry Survival Analysis Tool (ORSAT) and the ESA Spacecraft Atmospheric Reentry and Aerothermal Breakup (SCARAB) reentry analysis tools serve as standard codes for reentry survivability assessment of satellites. These programs predict whether an object will demise during
reentry and calculate the debris casualty area of objects determined to survive, establishing the reentry risk posed to the Earth’s population by surviving debris.
A series of test cases have been studied for comparison and the most recent uses “Testsat,” a conceptual satellite composed of generic parts, defined to use numerous simple shapes and various materials for a better comparison of the predictions of these two codes. This study is an improvement on the others in this series because of increased consistency in modeling techniques and variables.
The overall comparison demonstrated
that the two codes arrive at similar results. Either most objects modeled resulted in close agreement between the two codes, or if the difference was significant, the variance could be explained as a case of semantics in the model definitions.
This paper presents the main results of ORSAT and SCARAB for the Testsat case and discusses the sources of any discovered differences. Discussion of the results of previous comparisons is made for a summary of differences between the codes and lessons learned from this series of tests. ♦
Modeling of the Orbital Debris Population of RORSAT Sodium-Potassium DropletsY.-L. XU, P. KRISKO, M. MATNEY, AND E. STANSBERY
A large population resident in the orbital debris environment is composed of eutectic sodium-potassium (NaK) droplets, released during the reactor core ejection of 16 nuclear-powered Radar Ocean Reconnaissance Satellites (RORSATs) launched in the 1980s by the former Soviet Union. These electrically conducting
RORSAT debris objects are spherical in shape, generating highly polarized radar returns. Their diameters are mostly in the centimeter and millimeter size regimes. Since the Space Surveillance Network catalog is limited to objects greater than 5 cm in low Earth orbit, our current knowledge about this special class of orbital debris relies largely on the analysis of Haystack radar data. This paper elaborates the simulation
of the RORSAT debris populations in the new NASA Orbital Debris Engineering Model ORDEM2010, which replaces ORDEM2000. The estimation of the NaK populations uses the NASA NaK-module as a benchmark. It follows the general statistical approach to developing all other ORDEM2010-required LEO populations (for various types of debris and across a wide
continued on page 10

Orbital Debris Quarterly News
10
Simulation of Micron-Sized Debris Populations in Low Earth OrbitY.-L. XU, M. MATNEY, J. HYDE, AND T. PRIOR
The update of ORDEM2000, the NASA Orbital Debris Engineering Model, to its new version – ORDEM2010, is nearly complete. As a part of the ORDEM upgrade, this paper addresses the simulation of micro-debris (greater than 10 µm and smaller than 1 mm in size) populations in low Earth orbit. The principal data used in the modeling of the micron-sized debris populations are in-situ hypervelocity impact records, accumulated in post-flight damage surveys on the space-exposed surfaces of returned spacecrafts. The development
of the micro-debris model populations follows the general approach to deriving other ORDEM2010-required input populations for various components and types of debris. This paper describes the key elements and major steps in the statistical inference of the ORDEM2010 micro-debris populations. A crucial step is the construction of a degradation/ejecta source model to provide prior information on the micron-sized objects (such as orbital and object-size distributions). Another critical step is to link model populations with data, which is rather involved. It demands detailed information on area-time/directionality for all the space-exposed
elements of a shuttle orbiter and damage laws, which relate impact damage with the physical properties of a projectile and impact conditions such as impact angle and velocity. Also needed are model-predicted debris fluxes as a function of object size and impact velocity from all possible directions. In spite of the very limited quantity of the available shuttle impact data, the population-derivation process is satisfactorily stable. Final modeling results obtained from shuttle window and radiator impact data are reasonably convergent and consistent, especially for the debris populations with object-size thresholds at 10 and 100 µm. ♦
ABSTRACTS FROM THE NASA HYPERVELOCITY IMPACT TECHNOLOGY FACILITY GROUP11th Hypervelocity Impact Symposium, 11-15 April 2010, Freiburg, Germany
Hypervelocity Impact Performance of Open Cell Foam Core Sandwich Panel StructuresS. RYAN, E. ORDONEZ, E. CHRISTIANSEN, AND D. LEAR
Open cell metallic foam core sandwich panel structures are of interest for application in spacecraft micrometeoroid and orbital debris shields due to their novel form and advantageous structural and thermal performance. Repeated shocking as a result of secondary impacts upon individual foam ligaments during the penetration process acts to raise the thermal
state of impacting projectiles, resulting in fragmentation, melting, and vaporization at lower velocities than with traditional shielding configurations (e.g., Whipple shield). In order to characterize the protective capability of these structures, an extensive experimental campaign was performed by the Johnson Space Center Hypervelocity Impact Technology Facility, the results of which are reported in this paper. Although not capable of competing against the
protection levels achievable with leading heavy shields in use on modern high-risk vehicles (i.e., International Space Station modules), metallic foam core sandwich panels are shown to provide a substantial improvement over comparable structural panels and traditional low weight shielding. A ballistic limit equation, generalized in terms of panel geometry, is derived and presented in a form suitable for application in risk assessment codes. ♦
Whipple Shield Performance in the Shatter RegimeS. RYAN, M. BJORKMAN, AND E. CHRISTIANSEN
A series of hypervelocity impact tests have been performed on aluminum alloy Whipple shields to investigate failure mechanisms and performance limits in the shatter regime. Test results demonstrated a more rapid increase in performance than predicted by the latest iteration of the JSC Whipple shield ballistic limit equation (BLE) following the onset of projectile fragmentation. This increase in performance was found to level out between
4.0-5.0 km/s, with a subsequent decrease in performance for velocities up to 5.6 km/s. For a detached spall failure criterion, the failure limit was found to continually decrease up to a velocity of 7.0 km/s, substantially varying from the BLE, while for perforation-based failure an increase in performance was observed. An existing phenomenological ballistic limit curve was found to provide a more accurate reproduction of shield behavior than the BLE, prompting an investigation of appropriate models to replace linear interpolation in shatter
regime. A largest-fragment relationship was shown to provide accurate predictions up to 4.3 km/s, which was extended to the incipient melt limit (5.6 km/s) based on an assumption of no additional fragmentation. Alternate models, including a shock enhancement approach and debris cloud cratering model, are discussed as feasible alternatives to the proposed curve in the shatter regime, due to conflicting assumptions and difficulties in extrapolating the current approach to oblique impact. These alternate models require further investigation. ♦
Modeling of the Orbital Debris Populationcontinued from page 9
range of object sizes). This paper describes, in detail, each major step in the NaK-population derivation, including a specific discussion on the conversion between Haystack-measured radar-
cross-sections and object-size distribution for the NaK droplets. Modeling results show that the RORSAT debris population is stable for the time period under study and that Haystack data
sets are fairly consistent over the observations of multiple years. ♦

www.orbitaldebris.jsc.nasa.gov
11
MEETING REPORTS
4th International Association for the Advancement of Space Safety (IAASS) Conference 19-21 May 2010, Huntsville, Alabama
ISTC Workshop on Space Debris Mitigation, 26-27 April 2010, Moscow, Russia
26th National Space Symposium, 12-15 April 2010, Colorado Springs, Colorado
The 3-day IAASS conference included over 200 participants from government and industry. There were forty 2-hour sessions that included discussions of safety topics covering all periods of robotic spacecraft flight (e.g., launch range safety, space traffic, orbital debris environment, collision detection and avoidance, and reentry).
Spacecraft structural safety due to component design and manufacture encompassed a number of sessions (e.g., designing s/c and software, materials, critical systems, nuclear reactor, battery and power). The wide topic of the ‘human factor’ was analyzed (e.g., regulations and standards, organizational culture, management,
risk assessment and management, operations, human factors and performance). Several interesting talks on EVA safety focused on ISS charging and mitigation. On-Earth disaster planning was also discussed with respect to the near-Earth object (NEO) threat. ♦
A special Space Debris Mitigation Workshop was organized and hosted by the International Science and Technology Center (ISTC) at the ISTC headquarters in Moscow, Russia, on 26-27 April. About 50 scientists and engineers from 10 countries participated in the event. The workshop included a keynote
speech by cosmonaut S.V. Avdeev (who holds a record of 747 days on MIR) and 24 technical presentations on various debris-related issues, including overviews of the near-Earth orbital debris problems, modeling and measurements of the environment, options to improve debris mitigation, and potential techniques for active
debris removal. A roundtable discussion was held near the end of the workshop to identify ways for ISTC to support and participate in future debris research and international collaboration activities. ♦
The 26th National Space Symposium was held in Colorado Springs, Colorado, during 12-15 April 2010. This year a special panel session on space situational awareness and space debris was part of the proceedings. The panelists included Lt. Gen. Brian Arnold (retired) of Raytheon Company, Mr. Roger Hall of the Defense Advanced Research Projects
Agency, Mr. Houston Hawkins of Los Alamos National Laboratory, Maj. Gen. Susan Helms of U.S. Strategic Command, Mr. Nicholas Johnson of the NASA Orbital Debris Program Office, and Mr. Joseph Sheehan of Analytical Graphics, Inc. Among the topics discussed were the improvements in data sharing by the U.S. Space Surveillance Network to the
international operational space community; the large amounts of orbital debris created by the Chinese anti-satellite test in January 2007 and by the accidental collision of two intact spacecraft in February 2009; the application of orbital debris mitigation guidelines to satellites of all sizes; and the prospects for removing debris from Earth orbit. ♦
1st European Workshop on Active Debris Removal, 22 June 2010, Paris, France The national space agency of France,
CNES, organized and hosted the first ever European Workshop on Active Debris Removal at the CNES headquarters in Paris on 22 June. This one-day meeting attracted more than 120 participants from 10 European countries and
representatives from Canada, Japan, and the United States. The objective of the meeting was to promote the European awareness of the orbital debris problem and the potential need to use active debris removal for environment remediation. A total of 18 presentations
were given and the majority of them focused on technical issues related to the removal technologies. Due to the positive response and feedback from the community, it was decided that the second workshop will be held in the summer of 2012. ♦
14-17 September 2010: Advanced Maui Optical and Space Surveillance Technology (AMOS) Conference, Maui, Hawaii, USA
The 11th annual AMOS Conference will continue to focus on space surveillance. Topics to be discussed include: adaptive optics, astrodynamics, astronomy, atmospherics/space weather, imaging, instrumentation, sensors and systems, non-resolved object characterization, orbital debris, space-based assets, and space situational awareness. Additional information on the conference is available at <http://www.amostech.com/>.
27 September - 1 October 2010: The 61st International Astronautical Congress (IAC), Prague, Czech Republic
The theme for the 2010 IAC is “Space for Human Benefit and Exploration.” A Space Debris Symposium with 50 technical oral presentations is planned during the Congress. It will include five sessions on (1) measurements, (2) modeling and risk analysis, (3) hypervelocity impacts and protection, (4) mitigations, standards, and legal issues, and (5) space surveillance and space situation awareness. Additional information for the Congress is available at <http://www.iac2010.cz>.
UPCOMING MEETINGS

National Aeronautics and Space AdministrationLyndon B. Johnson Space Center2101 NASA ParkwayHouston, TX 77058
www.nasa.gov
1�
International Designator Payloads Country/
Organization
Perigee Altitude(KM)
Apogee Altitude(KM)
Inclination (DEG)
Earth Orbital Rocket Bodies
Other Cataloged
Debris
2010-011A SOYUZ-TMA 18 RUSSIA 346 359 51.6 1 0
2010-012A STS 131 USA 322 346 51.6 0 0
2010-013A CRYOSAT 2 ESA 711 726 92.0 1 1
2010-014A COSMOS 2462 RUSSIA 179 331 67.2 1 1
2010-015A OTV 1 (USA 212) USA NO ELEMS. AVAILABLE 1 0
2010-016A SES 1 USA 35779 35794 0.0 1 1
2010-017A COSMOS 2463 RUSSIA 967 1023 83.0 1 0
2010-018A PROGRESS M-05M RUSSIA 346 359 51.6 1 0
2010-019A STS 132 USA 336 359 51.6 0 0
2010-020A HAYATO (K-SAT) JAPAN 181 212 30.0 1 1
2010-020B WASEDA-SAT2 JAPAN 231 242 30.0
2010-020C NEGAI JAPAN 176 190 30.0
2010-020D AKATSUKI (PLANET-C) JAPAN HELIOCENTRIC
2010-020E IKAROS JAPAN HELIOCENTRIC
2010-020F UNITEC-1 JAPAN HELIOCENTRIC
2010-021A ASTRA 3B LUXEMBOURG 35764 35808 0.1 1 1
2010-021B COMSATBW-2 GERMANY 35778 35794 0.0
2010-022A NAVSTAR 65 (USA 213) USA 20188 20224 55.0 1 0
2010-023A SERVIS 2 JAPAN 1185 1212 100.4 1 0
2010-024A BEIDOU G3 CHINA 35776 35799 1.8 1 0
2010-025A ARABSAT 5B ARABSAT 35776 35797 0.1 1 1
2010-026A DRAGON/FALCON 9 R/B USA 138 140 34.5 0 0
2010-027A SJ-12 CHINA 578 602 97.7 1 0
2010-028A PICARD FRANCE 726 729 98.3 0 2
2010-028B PRISMA SWEDEN 724 787 98.3
2010-028C BPA 1/SL-24 R/B UK 714 1268 98.2
2010-029A SOYUZ-TMA 19 RUSSIA 346 359 51.6 1 0
2010-030A TANDEM X GERMANY 498 510 97.5 1 1
2010-031A OFEQ 9 ISRAEL 344 586 141.8 1 0
2010-032A COMS 1 SOUTH KOREA EN ROUTE TO GEO 1 1
2010-032B ARABSAT 5A ASCO EN ROUTE TO GEO
2010-033A PROGRESS-M 06M RUSSIA 345 367 51.6 1 0
INTERNATIONAL SPACE MISSIONS01 April 2010 – 30 June 2010
Country/Organization Payloads
Rocket Bodies
& DebrisTotal
CHINA 88 3300 3388
CIS 1402 4431 5833
ESA 39 44 83
FRANCE 49 423 472
INDIA 39 131 170
JAPAN 115 75 190
USA 1125 3699 4824
OTHER 476 114 590
TOTAL 3333 12217 15550
SATELLITE BOX SCORE(as of 30 June 2010, cataloged by the
U.S. SPACE SURVEILLANCE NETWORK)
Visit the NASA Orbital Debris Program
Office Website
www.orbitaldebris.jsc.nasa.gov
Technical EditorJ.-C. Liou
Managing EditorDebi Shoots
Correspondence concerning the ODQN can be sent to:
Debi ShootsNASA Johnson Space CenterOrbital Debris Program OfficeMail Code JE104Houston, TX 77058