national bank qc june 2016 lr
TRANSCRIPT
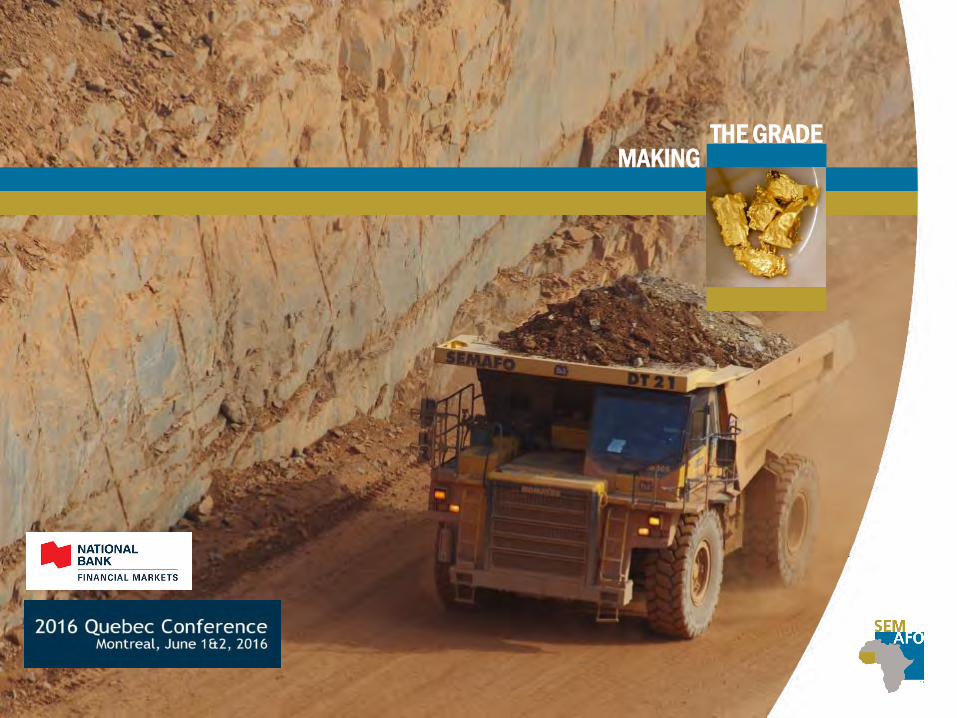
THE GRADEMAKING
2
FORWARD-LOOKING STATEMENTS
This presentation contains forward-looking statements. Forward-looking statements involve known and unknown risks, uncertainties and
assumptions and accordingly, actual results and future events could differ materially from those expressed or implied in such statements. You
are hence cautioned not to place undue reliance on forward-looking statements. Forward-looking statements include words or expressions
such as “target”, “guidance”, “feasibility”, “initial”, “timetable”, “will”, “objective”, “promising”, “potential”, “priorities” and other similar words
or expressions. Factors that could cause future results or events to differ materially from current expectations expressed or implied by the
forward-looking statements include the ability to achieve a first gold pour at Natougou in H2 2018, the ability to meet our 2016 production
guidance of between 225,000 and 245,000 ounces, the ability to achieve our 2016 total cash cost guidance of between $535 and $565 per
ounce and our all-in sustaining cost guidance of between $720 and $760 per ounce, the ability to meet the annual average production
targets at Natougou within the anticipated total cash costs and all-in sustaining costs, the ability to achieve the projected LOM, the ability to
meet the targeted permitting process, initial capital expenditures, construction start-up, the ability to expand Natougou reserves and
resources, the ability to bring Yama into reserves by year-end 2016, the ability to meet the various objectives in terms of tonnes of ore to the
milling facility, head-grade and gold recovery at the Natougou plant, the ability to generate an after-tax internal rate of return (IRR) of 48% with
a payback period of 1.5 years and to generate an after-tax NPV of $262 million, the accuracy of our assumptions, the ability to execute on our
strategic focus, fluctuation in the price of currencies, gold or operating costs, mining industry risks, uncertainty as to calculation of mineral
reserves and resources, delays, political and social stability in Africa (including our ability to maintain or renew licenses and permits) and other
risks described in SEMAFO’s documents filed with Canadian securities regulatory authorities. You can find further information with respect to
these and other risks in SEMAFO’s 2015 Annual MD&A, as updated in SEMAFO’s 2016 First Quarter MD&A, and other filings made with
Canadian securities regulatory authorities and available at www.sedar.com. These documents are also available on our website at
www.semafo.com. SEMAFO disclaims any obligation to update or revise these forward-looking statements, except as required by applicable
law.
All mineral resources are exclusive of mineral reserves.
In this presentation, all amounts are in US dollars unless otherwise indicated.
3
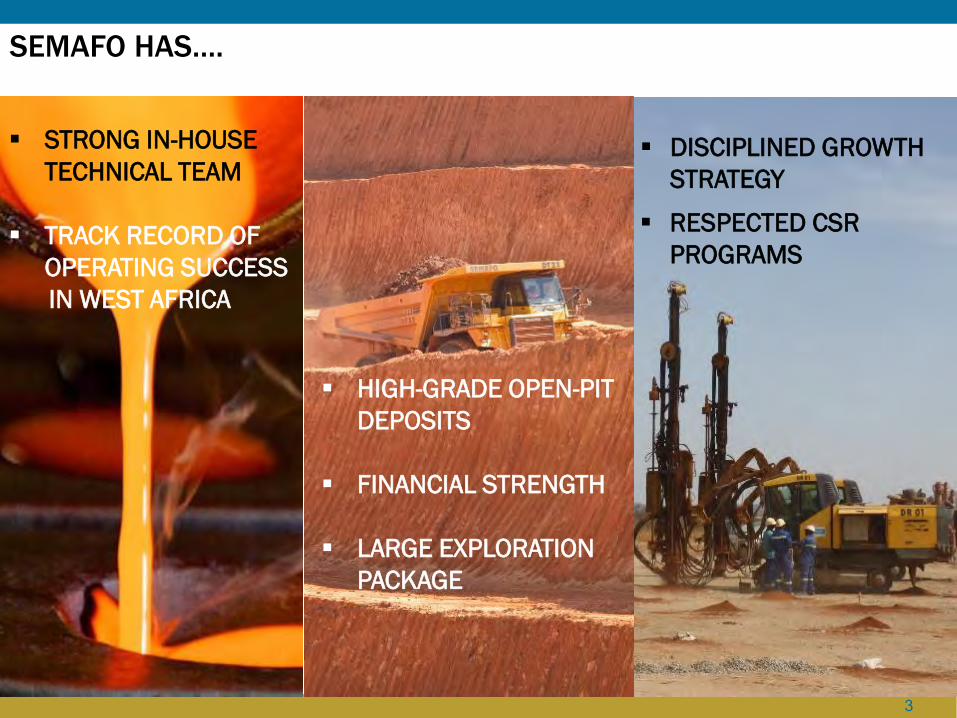
SEMAFO HAS….
STRONG IN-HOUSE
TECHNICAL TEAM
TRACK RECORD OF
OPERATING SUCCESS
IN WEST AFRICA
HIGH-GRADE OPEN-PIT
DEPOSITS
FINANCIAL STRENGTH
LARGE EXPLORATION
PACKAGE
RESPECTED CSR
PROGRAMS
DISCIPLINED GROWTH
STRATEGY
4
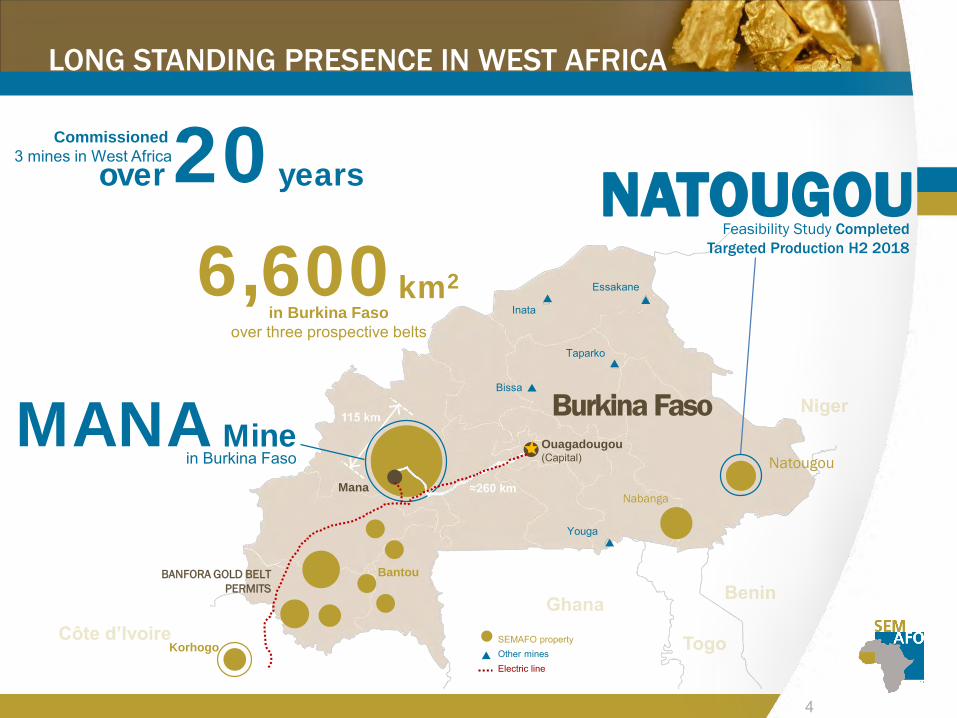
6,600km2
in Burkina Faso
over three prospective belts
MANAMinein Burkina Faso
20years
Commissioned
3 mines in West Africaover
LONG STANDING PRESENCE IN WEST AFRICA
NATOUGOUFeasibility Study Completed
Targeted Production H2 2018
Burkina Faso
Mana
BANFORA GOLD BELT
PERMITS
Ouagadougou(Capital)
Inata
Essakane
Bissa
Taparko
Youga
SEMAFO propertyOther minesElectric line
Korhogo
Natougou
Nabanga
Bantou
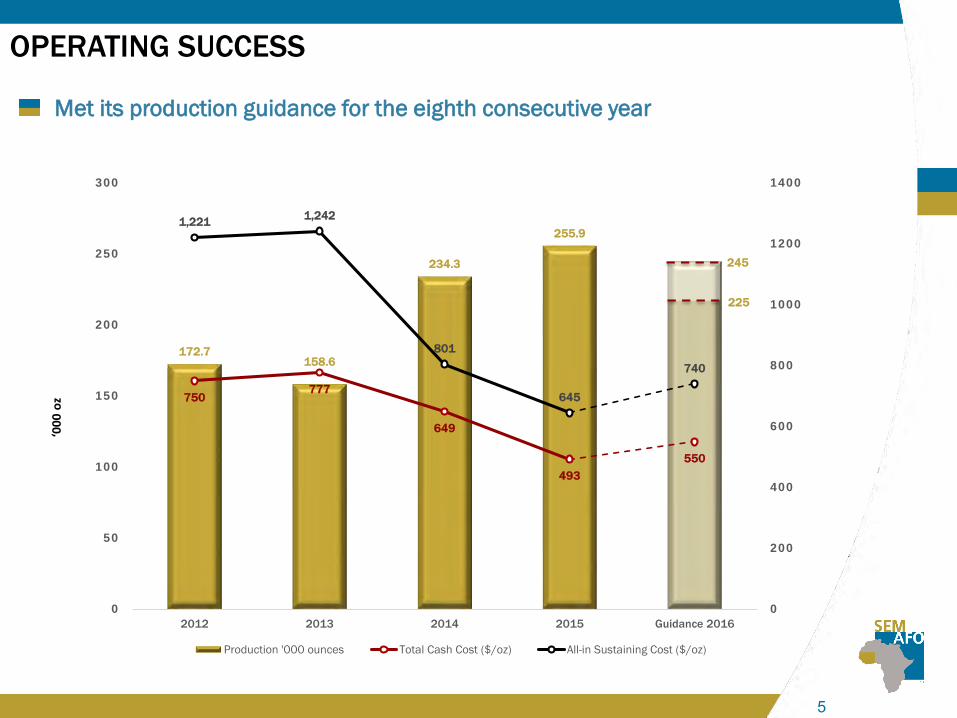
55
172.7158.6
234.3
255.9
750777
649
493
550
1,2211,242
801
645
740
0
200
400
600
800
1000
1200
1400
0
50
100
150
200
250
300
2012 2013 2014 2015 Guidance 2016
Production '000 ounces Total Cash Cost ($/oz) All-in Sustaining Cost ($/oz)
OPERATING SUCCESS
Met its production guidance for the eighth consecutive year
245
225
‘00
0 o
z

6
2008 2009 2010 2011 2012 2013 2014 2015
0.9 0.8
2.22.0 1.9
2.3 2.2
3.3
1.0
1.6
1.1
2.8 3.02.4
2.8
2.9
0.5
0.9
2.7
2.1 1.9
1.4
1.2
2.1
Discoveries
- Reserves estimate using a gold price of $1,100/oz - Resources estimate using a gold price of $1,400/oz
EXPLORATION AND ACQUISITION SUCCESS
Fofina
1.2 Mt @ 2.72 g/t Au
104,000 oz
Siou
6.5 Mt @ 4.16 g/t Au
874,000 oz
Wona
12.6 Mt @ 2.30 g/t Au
935,000 oz
2010 2011 2012 2015
FOFINA FOBIRI YAHO SIOU
ACQUISITION ORBIS GOLD
Natougou
9.6 Mt @ 4.15 g/t Au
1,300,000 oz
40%
30%
27%
3%
Reserves 50 % YoY
Inferred ResourcesMeasured and Indicated ResourcesProven and Probable Reserves
* All mineral resources are exclusive of mineral reserves.
77
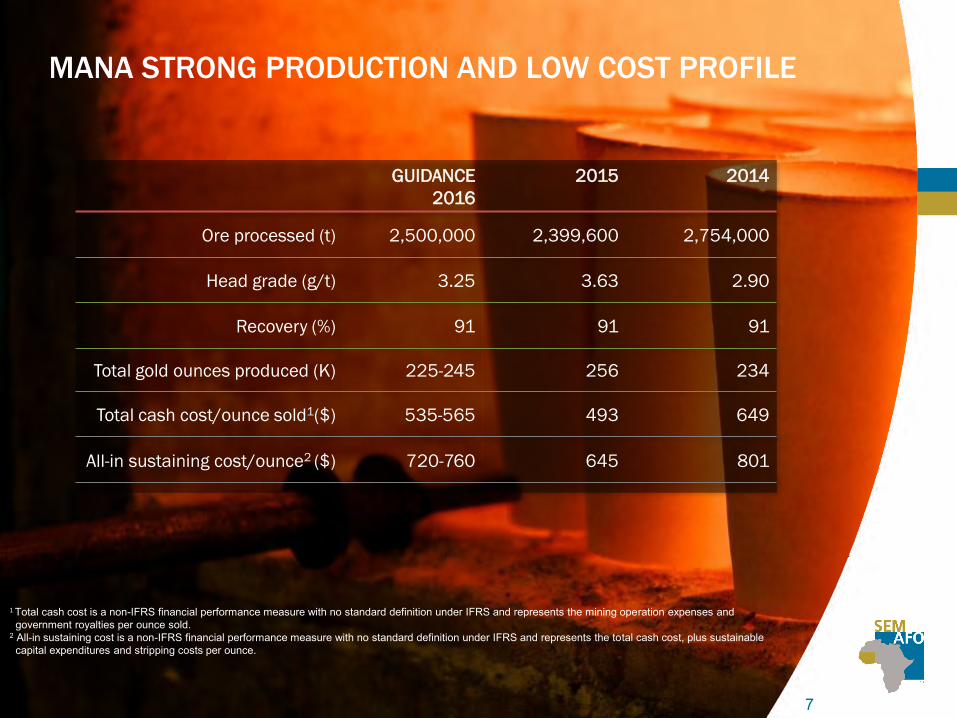
MANA STRONG PRODUCTION AND LOW COST PROFILE
6
GUIDANCE
2016
2015 2014
Ore processed (t) 2,500,000 2,399,600 2,754,000
Head grade (g/t) 3.25 3.63 2.90
Recovery (%) 91 91 91
Total gold ounces produced (K) 225-245 256 234
Total cash cost/ounce sold1($) 535-565 493 649
All-in sustaining cost/ounce2 ($) 720-760 645 801
1 Total cash cost is a non-IFRS financial performance measure with no standard definition under IFRS and represents the mining operation expenses andgovernment royalties per ounce sold.
2 All-in sustaining cost is a non-IFRS financial performance measure with no standard definition under IFRS and represents the total cash cost, plus sustainablecapital expenditures and stripping costs per ounce.
88
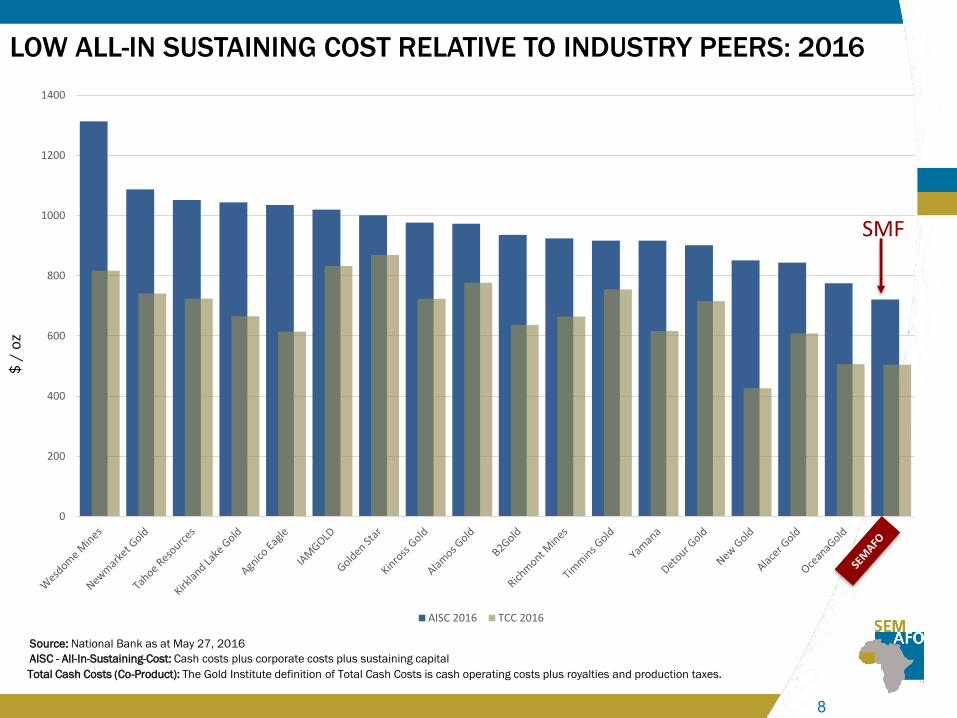
0
200
400
600
800
1000
1200
1400
AISC 2016 TCC 2016
LOW ALL-IN SUSTAINING COST RELATIVE TO INDUSTRY PEERS: 2016
Source: National Bank as at May 27, 2016
$ /
oz
AISC - All-In-Sustaining-Cost: Cash costs plus corporate costs plus sustaining capital
Total Cash Costs (Co-Product): The Gold Institute definition of Total Cash Costs is cash operating costs plus royalties and production taxes.
SMF
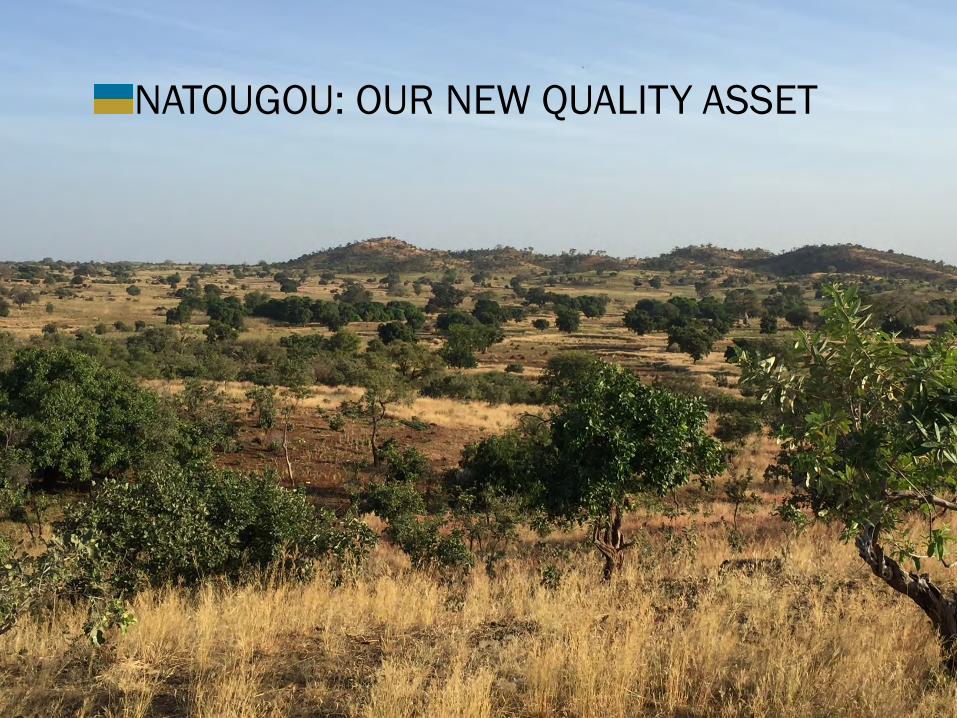
NATOUGOU: OUR NEW QUALITY ASSET

10
POSITIVE FEASIBILITY STUDY HIGHLIGHTS
During the first three years,
• Average annual production of more than 226,000 ounces
• Average total cash cost of $283/oz and AISC of $374/oz
• Average head grade 5.72 g/t at a gold recovery rate of 93.8%
Projected LOM total cash cost of $408/oz and all-in sustaining
cost of $518/oz
Maiden open pit mineral reserves of 9.6 million tonnes at a
grade of 4.15 g/t Au for 1,276,000 ounces of gold
Initial CAPEX: $219 million, project fully financed
First gold pour
H2 2018
Project economics at $1,100/oz:
• After-tax NPV 5%: $262 million
• After-tax IRR: 48%
• Payback period: 1.5 years
11
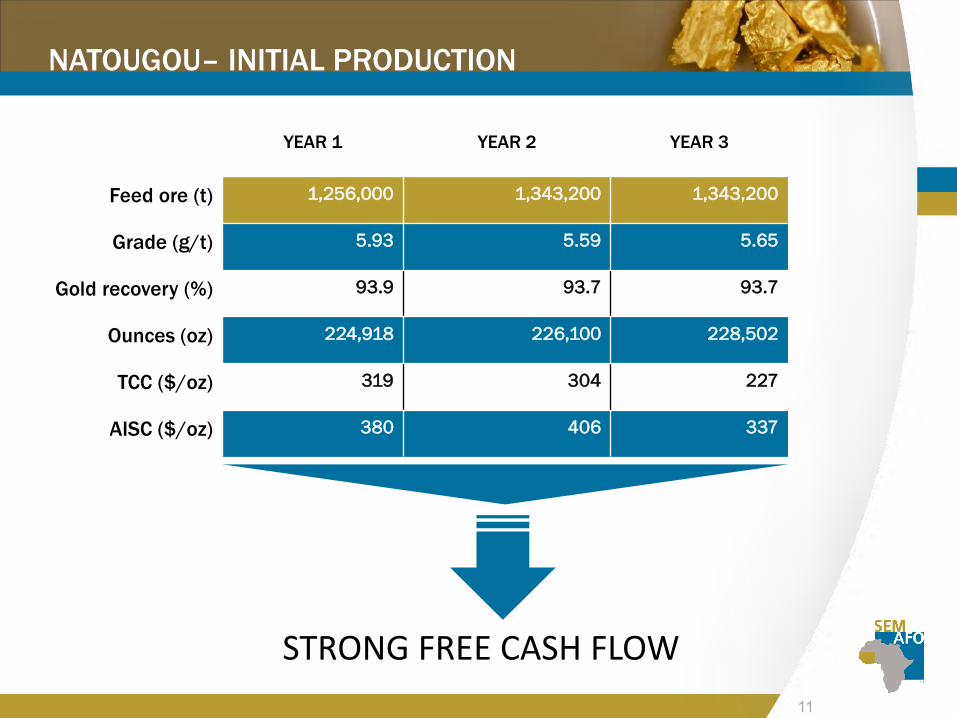
NATOUGOU– INITIAL PRODUCTION
YEAR 1 YEAR 2 YEAR 3
Feed ore (t) 1,256,000 1,343,200 1,343,200
Grade (g/t) 5.93 5.59 5.65
Gold recovery (%) 93.9 93.7 93.7
Ounces (oz) 224,918 226,100 228,502
TCC ($/oz) 319 304 227
AISC ($/oz) 380 406 337
STRONG FREE CASH FLOW
12
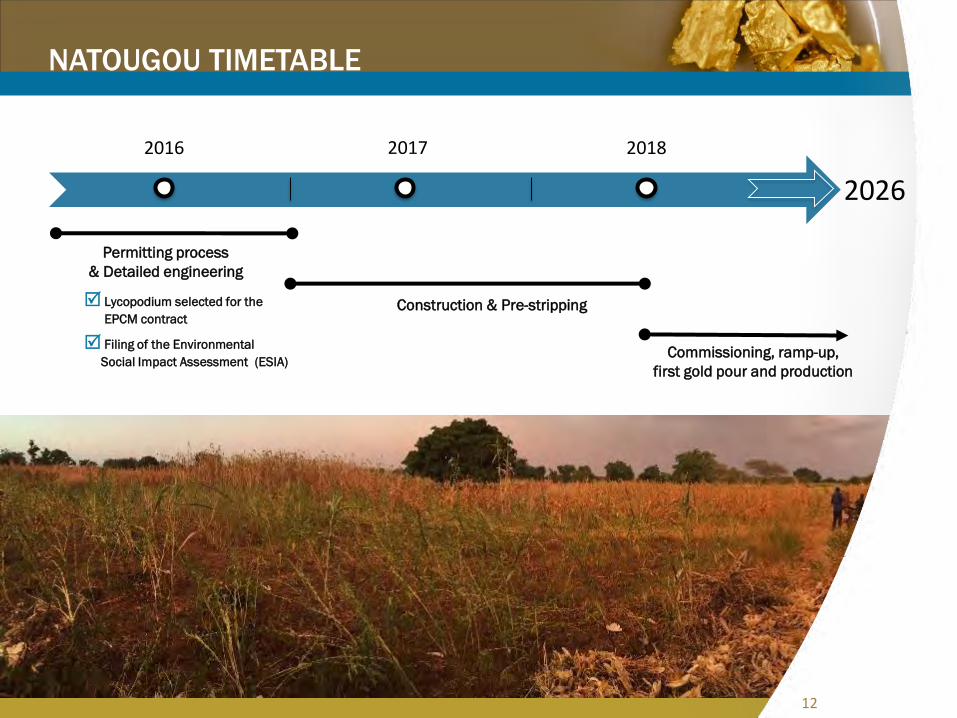
2016 2017 2018
NATOUGOU TIMETABLE
2026
Construction & Pre-stripping
1712
Lycopodium selected for the
EPCM contract
Filing of the Environmental
Social Impact Assessment (ESIA)
Permitting process
& Detailed engineering
Commissioning, ramp-up,
first gold pour and production
13
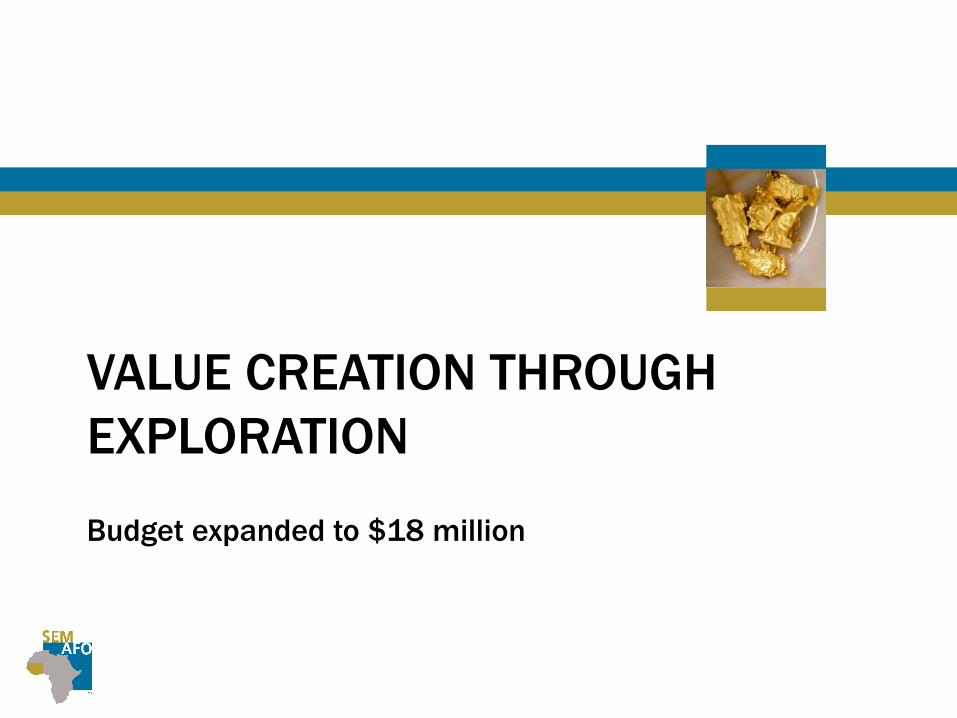
VALUE CREATION THROUGH
EXPLORATION
Budget expanded to $18 million
14
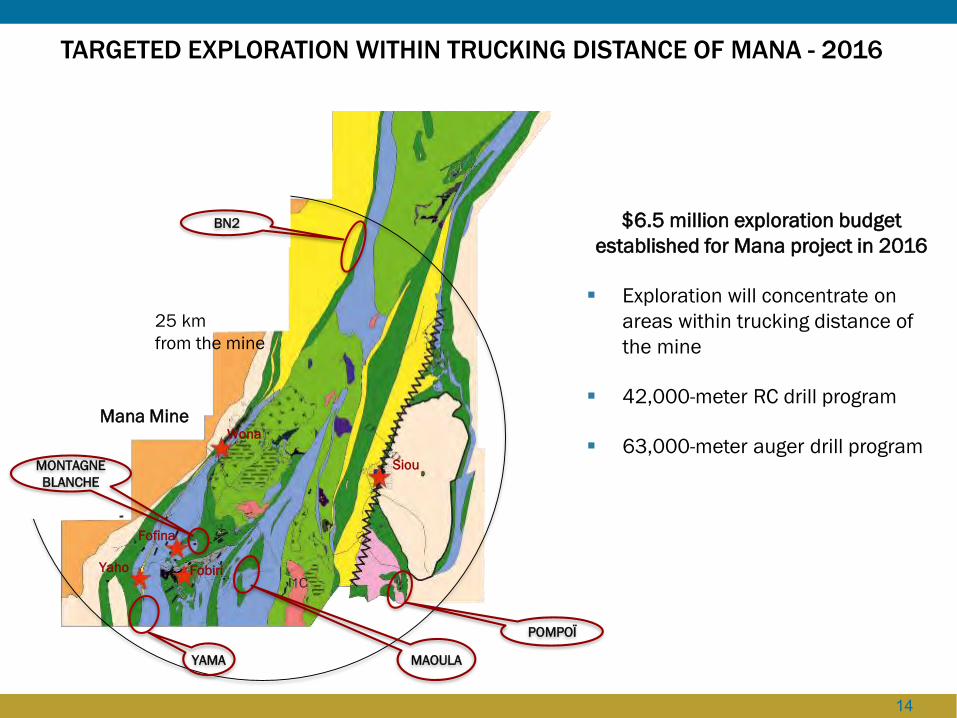
TARGETED EXPLORATION WITHIN TRUCKING DISTANCE OF MANA - 2016
25 km
from the mine
$6.5 million exploration budget
established for Mana project in 2016
Exploration will concentrate on
areas within trucking distance of
the mine
42,000-meter RC drill program
63,000-meter auger drill program
Mana MineWona
Siou
Fofina
FobiriYaho
BN2
POMPOÏ
MAOULAYAMA
MONTAGNE
BLANCHE
15
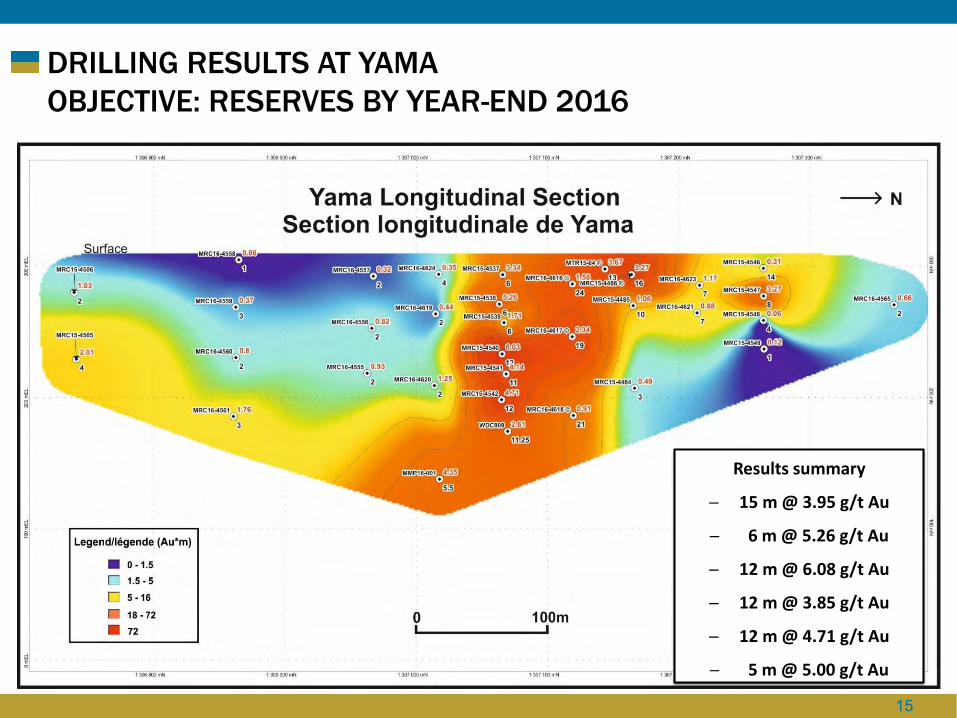
DRILLING RESULTS AT YAMA
OBJECTIVE: RESERVES BY YEAR-END 2016
Results summary
─ 15 m @ 3.95 g/t Au
─ 6 m @ 5.26 g/t Au
─ 12 m @ 6.08 g/t Au
─ 12 m @ 3.85 g/t Au
─ 12 m @ 4.71 g/t Au
─ 5 m @ 5.00 g/t Au
16
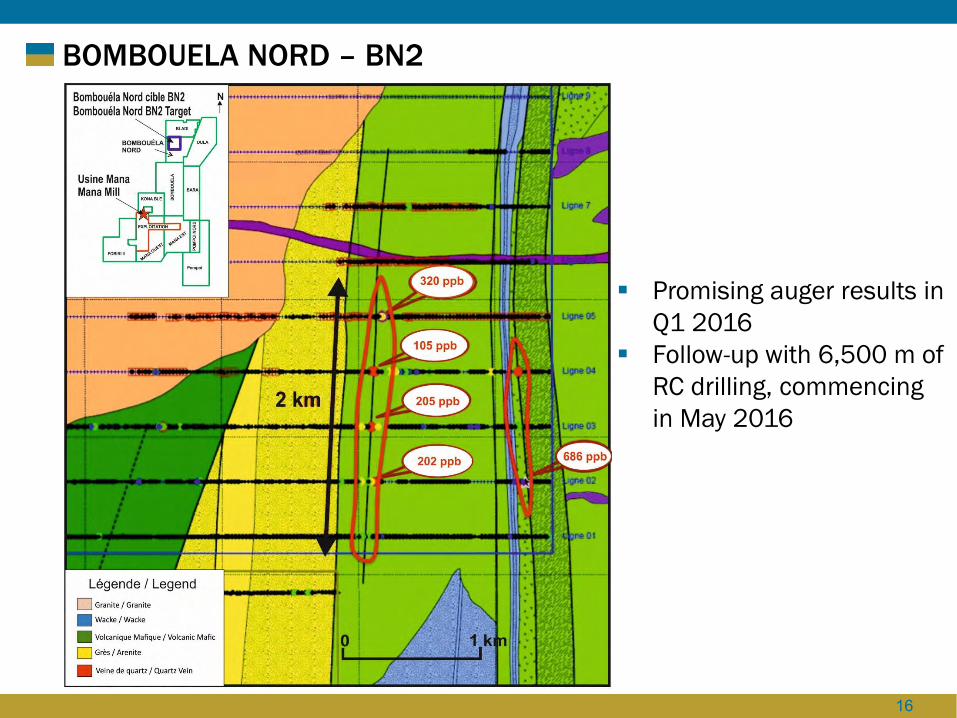
BOMBOUELA NORD – BN2
Promising auger results in
Q1 2016
Follow-up with 6,500 m of
RC drilling, commencing
in May 2016

17
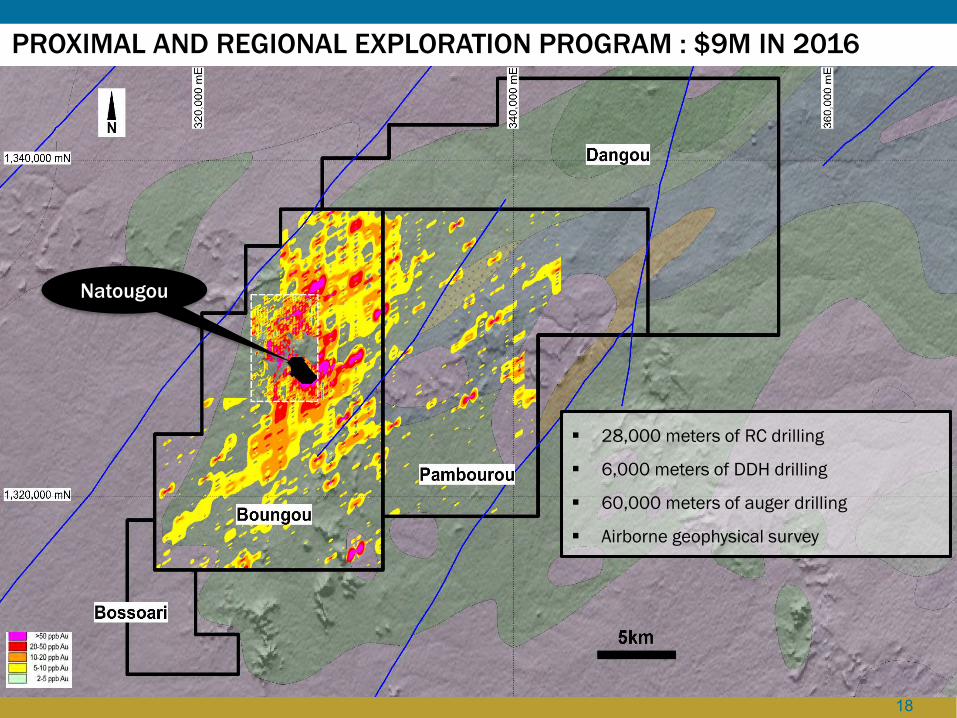
NATOUGOU: AN UNDEREXPLORED PROPERTY
Prior to the acquisition, Natougou had seen little near-pit or regional
exploration
Focus on in-fill drilling for the feasibility study in 2015
Regional and proximal exploration only commenced a few months ago
773 km2 of exploration ground
Objective is to expand
reserves and resources
to continue creating value
18
28,000 meters of RC drilling
6,000 meters of DDH drilling
60,000 meters of auger drilling
Airborne geophysical survey
Natougou
PROXIMAL AND REGIONAL EXPLORATION PROGRAM : $9M IN 2016
19
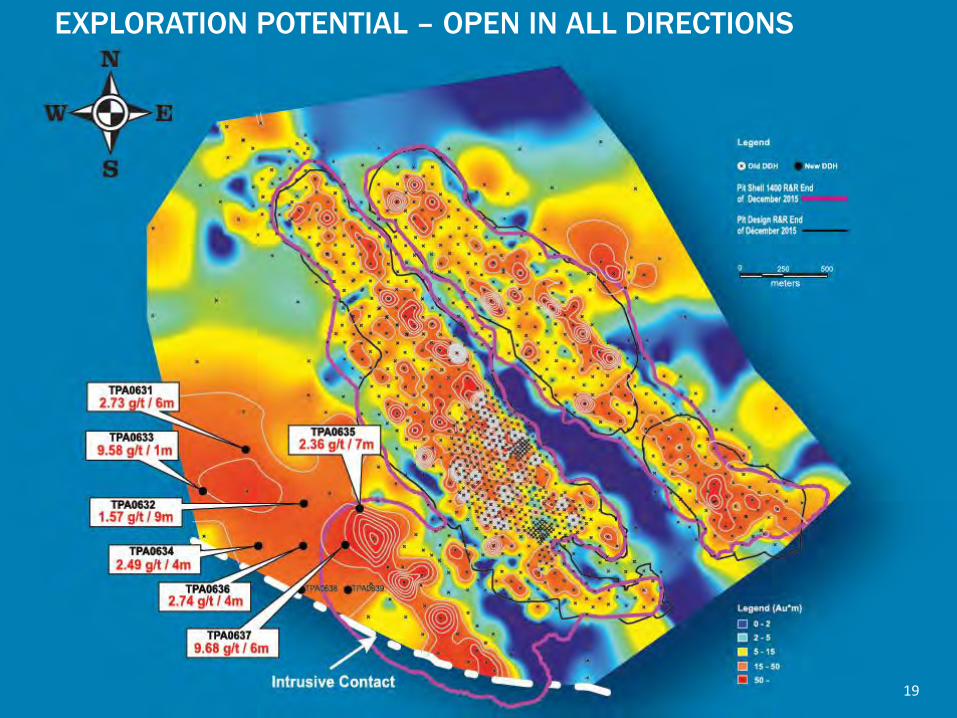
EXPLORATION POTENTIAL – OPEN IN ALL DIRECTIONS
19
20
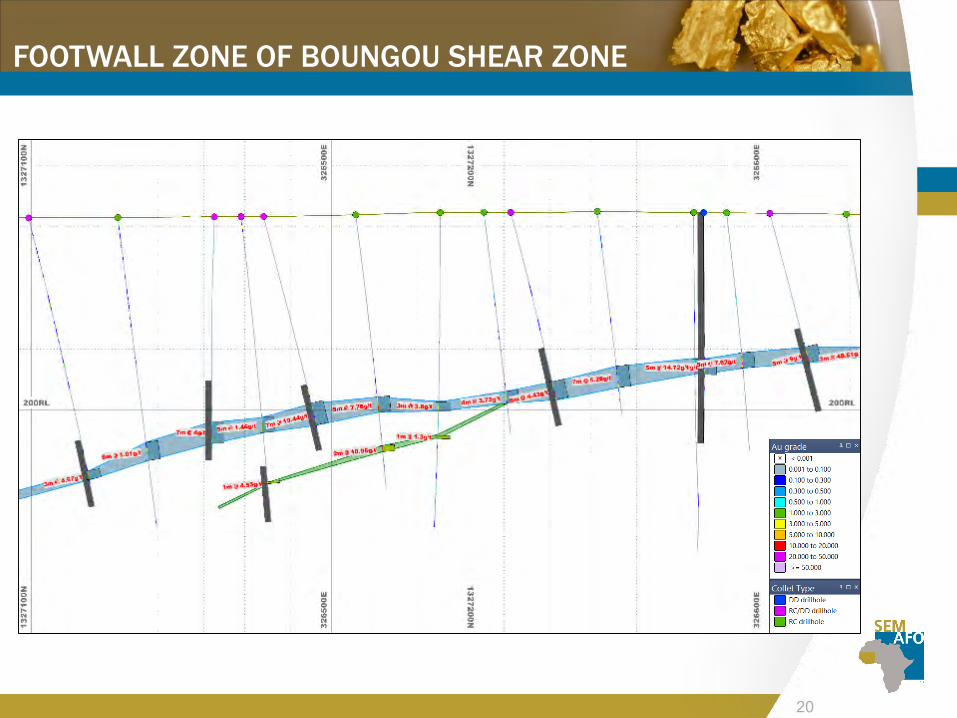
FOOTWALL ZONE OF BOUNGOU SHEAR ZONE
21
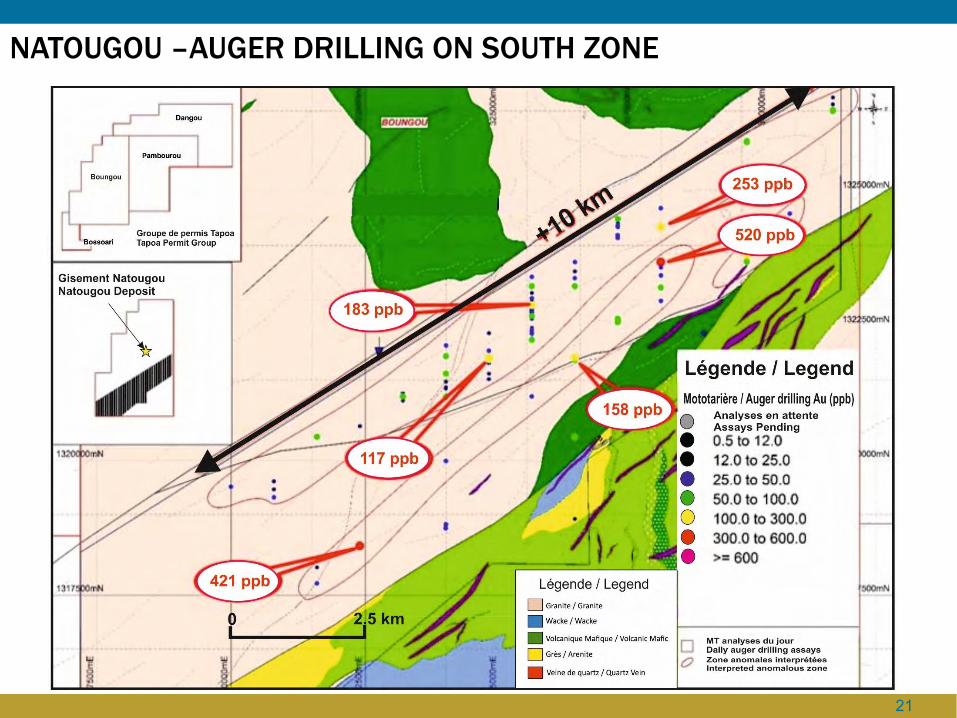
NATOUGOU –AUGER DRILLING ON SOUTH ZONE
22
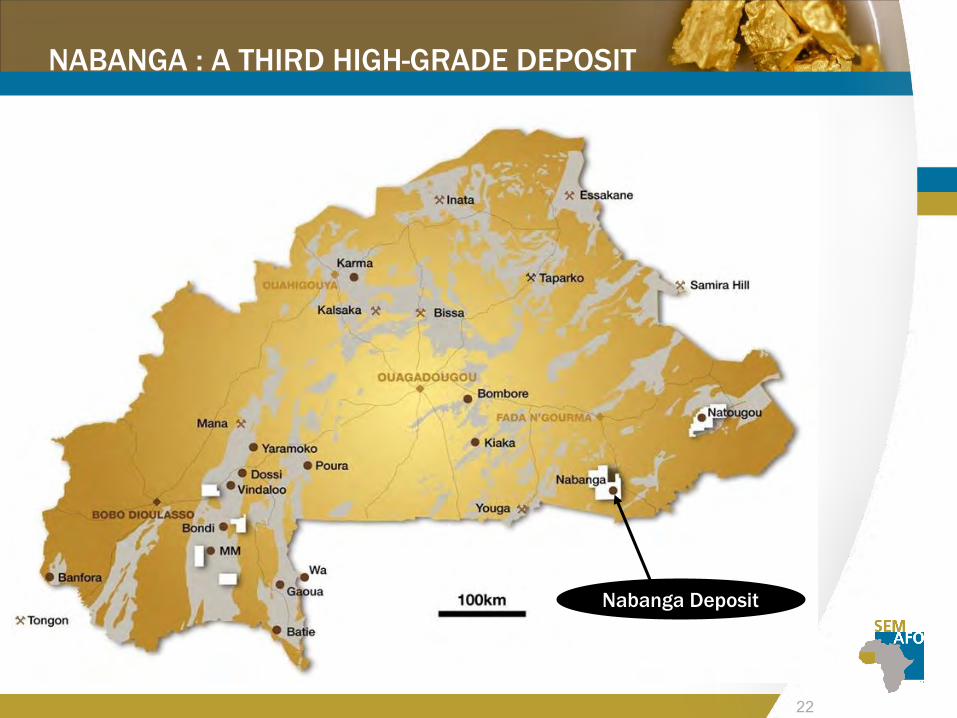
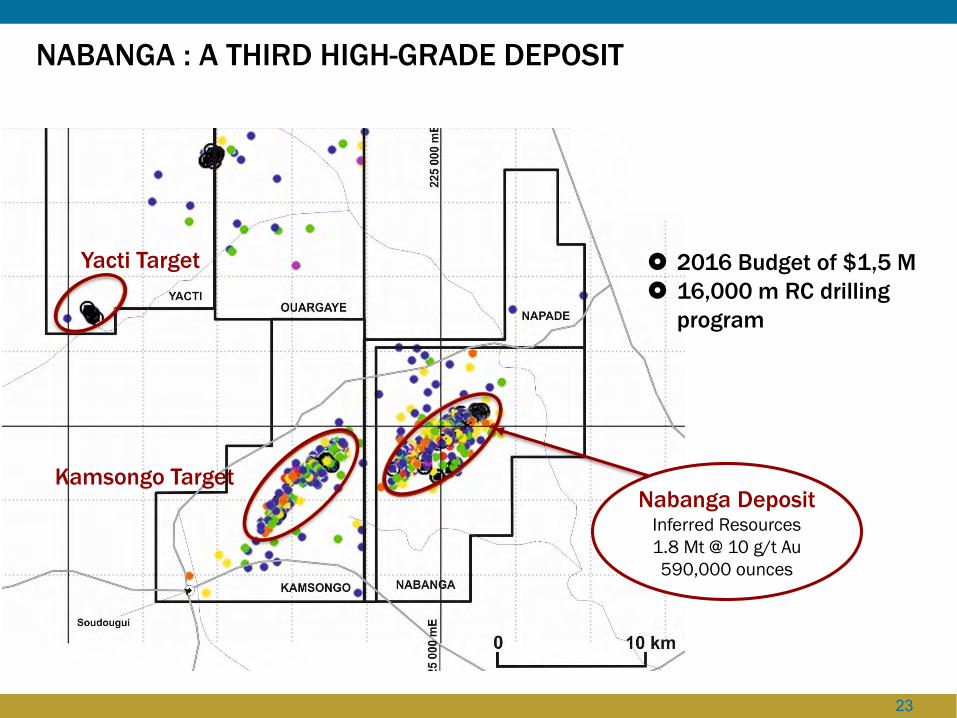
NABANGA : A THIRD HIGH-GRADE DEPOSIT
Nabanga Deposit
23
Nabanga DepositInferred Resources
1.8 Mt @ 10 g/t Au
590,000 ounces
2016 Budget of $1,5 M
16,000 m RC drilling
program
Yacti Target
Kamsongo Target
NABANGA : A THIRD HIGH-GRADE DEPOSIT
2424
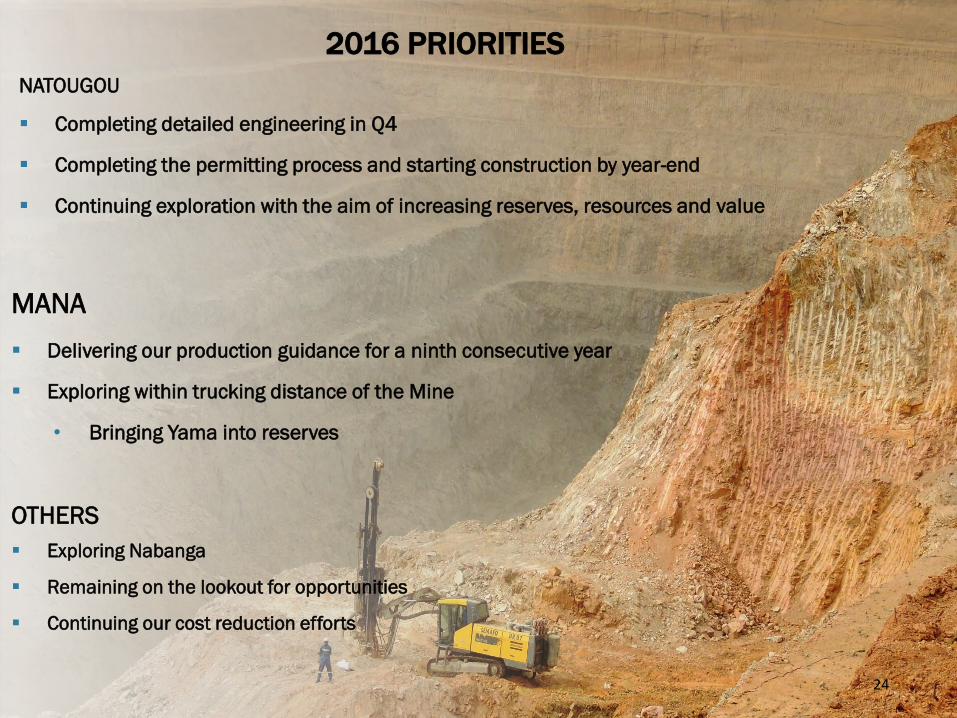
2016 PRIORITIES
NATOUGOU
Completing detailed engineering in Q4
Completing the permitting process and starting construction by year-end
Continuing exploration with the aim of increasing reserves, resources and value
MANA
Delivering our production guidance for a ninth consecutive year
Exploring within trucking distance of the Mine
• Bringing Yama into reserves
OTHERS
Exploring Nabanga
Remaining on the lookout for opportunities
Continuing our cost reduction efforts

25
National Workforce Development Program -
Training of promising national employees for
management or trainer posts
SEMAFO Foundation -
Six years of activities which generated revenues of
C$4.2M to the benefit of communitiesTraining – 6,200 hours of training
were dispensed in 2015, of which 64%
benefited our Burkinabe employees
Strong Safety Record -
Accident frequency rate of 1.86 per 200,000
hours worked as of December 31, 2015
26
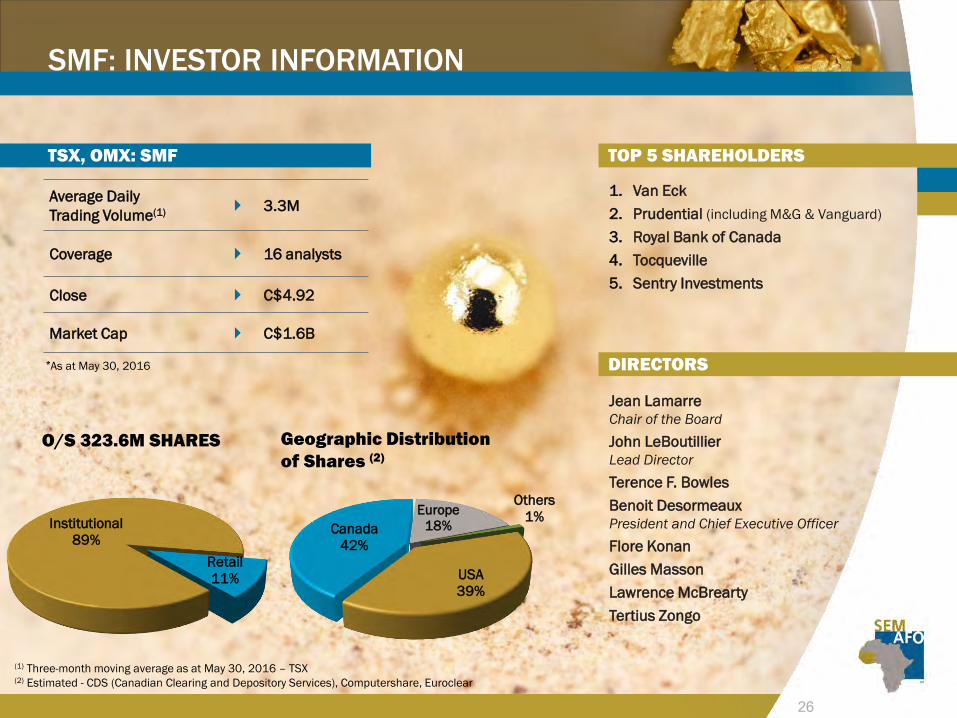
SMF: INVESTOR INFORMATION
TSX, OMX: SMF
Average Daily
Trading Volume(1) 3.3M
Coverage 16 analysts
Close C$4.92
Market Cap C$1.6B
*As at May 30, 2016
USA
39%
Canada
42%
Europe
18%
Others
1%
26
O/S 323.6M SHARES Geographic Distribution
of Shares (2)
TOP 5 SHAREHOLDERS
DIRECTORS
Jean Lamarre
Chair of the Board
John LeBoutillier
Lead Director
Terence F. Bowles
Benoit Desormeaux
President and Chief Executive Officer
Flore Konan
Gilles Masson
Lawrence McBrearty
Tertius Zongo
1. Van Eck
2. Prudential (including M&G & Vanguard)
3. Royal Bank of Canada
4. Tocqueville
5. Sentry Investments
Institutional
89%
Retail
11%
(1) Three-month moving average as at May 30, 2016 – TSX(2) Estimated - CDS (Canadian Clearing and Depository Services), Computershare, Euroclear
27
MANA’S RESERVES (AS AT DECEMBER 31, 2015)
Wona:
12,665,000 t @ 2.30 g/t Au
935,100 oz
Fofina:
1,185,000 t @ 2.72 g/t Au
103,700 oz
Siou:
6,524,000 t @ 4.16 g/t Au
873,600 oz
Mana
Processing Plant
28
SEMAFO Inc.
100 Alexis-Nihon blvd. 7thfloor, St-Laurent (Quebec)Canada H4M 2P3 www.semafo.com