national grid gas (nts) system operator incentive performance incentive... · national grid gas...
TRANSCRIPT

1
National Grid Gas (NTS) System Operator Incentive Performance Summary 2017/18 – Supporting Information Version 9.0 September 2017 UK Gas Transmission

2
Contents 2
1 Introduction 4
1.1 Introduction to Gas System Operator Incentives 4
1.2 Background to this Document 4 1.3 Summary of Incentive Development for RIIO-T1 4 1.4 Summary of Incentive Reviews 5 1.5 Feedback and Contact Details 6
2 Incentive Schemes from 1 April 2013 7
2.1 Summary of Current Financial Incentives 7 2.2 Demand Forecasting 8 2.3 Greenhouse Gas (GHG) Emissions from Compressors 11 2.4 Residual Balancing 13
2.5 NTS Shrinkage 15 2.6 Maintenance 17 2.7 Entry Capacity and Exit Capacity Constraint Management 20 2.8 Transportation Support Services 23
2.9 Customer and Stakeholder Satisfaction 24
3 Incentive Performance 25
3.1 Summary of Past Performance 25
Contents

3
Version Control Version Number Date of Publication Changes Made
1.0 October 2009 First issue
2.0 May 2010 Update for incentive schemes in place from April 2010
2.1 August 2010 Update of 2009/10 incentive scheme performance
3.0 June 2011 Update for incentive schemes in place from April 2011
4.0 April 2012 Update for incentive schemes in place from April 2012
5.0 April 2013 Update for incentive schemes in place from April 2013
5.1 May 2013 Update to include Entry Capacity and Exit Capacity Constraint
Management, Transportation Support Services and Customer and Stakeholder Satisfaction schemes in place from April 2013
6.0 October 2014 Update to all sections to include
2013/14 data and graphs 7.0 August 2015 Update to include scheme
changes from renegotiation of Incentives from 2015/16 and with performance for 2014/15.
8.0 August 2016 Update with performance from 2015/16 and relevant updates for
2016/17 targets. 9.0 September 2017 Update with performance from
2016/17 (section 3) and relevant updates for 2017/18 incentive schemes.

4
Section 1 Introduction
1 Introduction
1.1 Introduction to Gas System Operator Incentives
1. National Grid Gas (hereafter abbreviated to National Grid) operates the high pressure Gas National Transmission System (NTS) in Great Britain. This System Operator (SO) function is subject to Licence1 obligations and a
number of financial incentive arrangements. These incentive arrangements encourage National Grid to minimise the overall cost of system operation to consumers, to consider environmental impacts and to support the efficient operation of the wholesale gas market.
2. These arrangements are designed to encourage National Grid to deliver outputs which provide benefits to the industry and consumers. These benefits include a direct financial benefit from reductions in the costs associated with operating the gas transmission network and other benefits from meeting key
performance targets.
3. The various incentive schemes provide a focus on key areas where National Grid is able to create value for the industry and consumers, allowing National Grid to retain a share of any value created or conversely being subject to
additional costs should targets not be met.
1.2 Background to this Document
4. This document was produced following feedback received through responses to consultation papers and industry events. This document summarises the Gas SO Incentive Schemes applicable from April 2013 and those reviewed and updated, which commenced April 2015.
1.3 Summary of Incentive Development for RIIO-T1
5. The current incentive arrangements are part of the RIIO-T1 Framework,
introduced in 2013, which sets outs National Grid’s funding arrangements for
the RIIO-T1 period from April 2013 to March 2021.
6. For the RIIO-T1 incentive period, four of the seven financial incentives were retained (NTS Shrinkage, Residual Balancing, Day Ahead Demand Forecasting and Greenhouse Gas Emissions) and supplemented with two
new financial schemes covering Maintenance activities and Demand Forecasting in respect of the D-2 to D-5 forecast range.
7. However, the existing financial schemes for Operating Margins (OM) and Data Publication were replaced with new licence obligations:
Operating Margins2 – requirement for National Grid to procure OM in an economic and efficient manner, to report on its annual procurement and to promote competition in its provision.
1 The National Grid Gas plc Gas Transporter Licence in respect of the NTS 2 Special Condition 8C: Procurement of Operating Margins

Gas System Operator Incentive Initial Proposals
5
Data Publication3 – requirement for National Grid to publish key assumptions in development of future energy scenarios, winter & summer outlooks and operational data.
8. The UAG (Unaccounted for Gas) licence obligation, to continue witnessing meter validations and carry out data centred investigations into the causes of
UAG, has been retained for the duration of the RIIO-T1 period 2013 to 2021.
9. In addition to the shallow incentive schemes, there were a further three financial incentive schemes added which cover further aspects of our activities. These schemes are:
Entry Capacity and Exit Capacity Constraint Management;
Transportation Support Services; and
Customer and Stakeholder Satisfaction.
1.4 Summary of Incentive Reviews
10. For the two new financial incentive schemes agreed as part of RIIO-T1 (Maintenance and Demand Forecasting D-2 to D-5), initial schemes were set for a two year period to assess their effectiveness before committing to longer timescales.
11. A scheme review was undertaken during 2014/15, which also included the Greenhouse Gas Emissions scheme, which had been set for an initial three year period.
12. As a result of the review by the Authority, the two new schemes were set
against amended scheme parameters for an additional three year duration.
13. The Greenhouse Gas Emissions scheme was set for an additional two year period, which commenced in the 2016/17 incentive year.
14. These schemes are currently under review for extension to the full RIIO-T1
period 2013 to 2021, with the exception of Transportation Support Services which will not be extended beyond incentive year 2018/19.
Figure 1: RIIO-T1 summary of incentive schemes under review
Incentiv e year
Incentiv e 13/14 14/15 15/16 16/17 17/18 18/19 19/20 20/21
GHG Schemes under rev iew
D-2 and D-5 Demand Forecast
Schemes under rev iew
Maintenance – Change and Used
Schemes under rev iew
TSS No scheme
3 Special Condition 8F: Provision of information

6
1.5 Feedback and Contact Details
15. We welcome any feedback on this document, including suggestions for
additional information to incorporate.
16. Contact details and further information on the Gas SO Incentives can be found on the National Grid website via the below link:
http://www.nationalgrid.com/uk/Gas/soincentives/

7
2 Incentive Schemes from 1 April 2013
2.1 Summary of Current Financial Incentives
17. The following pages provide a summary of the current financial SO incentive schemes, which are listed in the table below:
Document Section
Financial Incentives
2.2 Demand Forecasting
2.3 Greenhouse Gas (GHG) Emissions from Compressors
2.4 Residual Balancing
2.5 NTS Shrinkage 2.6 Maintenance
2.7 Entry Capacity and Exit Capacity Constraint Management
2.8 Transportation Support Services
2.9 Customer and Stakeholder Satisfaction
Section 2 Financial Incentive Schemes

8
2.2 Demand Forecasting
Purpose: To incentivise improvements in the accuracy of the Demand
Forecasts issued by National Grid Gas. These forecasts assist the industry in making efficient physical and commercial decisions in order to balance supply to, and demand from, the NTS.
18. National Grid publishes national gas demand forecasts over a range of
timescales. We forecast demand on a day ahead basis and have been subject to an incentive based upon the accuracy of this forecast since 2006. In addition to this, we publish demand forecasts each day from two to five days ahead of the Gas Day.
19. In respect of the Day Ahead scheme, National Grid has an incentive target of
an annual weighted average absolute forecast error of 8.5mcm with an adjustment for the level of short-cycle storage injection capability (to take into account the unpredictability of demand from short-cycle storage4 sites). The
storage adjustment is capped at an additional 1 mcm and therefore has the potential to revise the ‘day ahead demand forecasting’ target to 9.5 mcm. This incentive was set for eight years commencing 1 April 2013.
20. The daily forecast error is calculated as the difference (in mcm) between the
day ahead forecast NTS throughput value and the actual throughput value on the appropriate day of the year. The annual average absolute forecast error is the sum of the daily forecast errors which themselves are weighted according to the relevant day’s demand as a proportion of annual demand in the
relevant incentive year. Therefore forecasting accuracy on high demand days has a greater impact on performance than accuracy on lower demand days.
21. The incentive scheme parameters are summarised in Figure 2.
4 Details of the storage sites that are utilised in the calculation are published on National Grid’s website at: www2.nationalgrid.com/uk/industry-information/gas-system-operator-incentives/demand-forecasting/

9
Figure 2: Day Ahead Demand Forecasting Incentive
22. If National Grid has a demand forecast error below the target, an incentive payment will be received, however if the forecast error is greater than the target then an incentive penalty will be applied.
23. An average annual forecast error of 0.85 mcm below the base target
(7.65mcm) would mean National Grid earning £1.5m, and an error of 0.85mcm above the base target (9.35 mcm) would result in National Grid being penalised by the same amount. The latter represents the highest loss that National Grid is exposed to under this incentive. The maximum payment
that National Grid can receive is £10m5.
24. In respect of the D-2 to D-5 scheme, from 2015/16 through to 2017/18
National Grid has an incentive target of an annual average absolute forecast error of 13.7mcm. There is no adjustment for the level of short-cycle storage
injection capability. This incentive was set for three years commencing 1 April 2015.
25. The overall forecast error is equal to the average annual forecast error of the four timed forecasts for the incentive year. The annual error for each timed
forecast is derived as the sum of daily forecast errors weighted according to the relevant day’s demand as a proportion of annual demand in the relevant incentive year. From this perspective, accuracy on high demand days has a greater impact on performance than accuracy on lower demand days
26. The scheme parameters are summarised in the Figure 3.
5 A payment of this scale would require forecast error to be between zero and 1mcm (dependant on the target adjustment). A zero forecast error would mean a zero error on every daily forecast in the year.

10
Figure 3: D-2 to D-5 Demand Forecasting Incentive
27. Similar to the Day Ahead incentive scheme, if National Grid’s forecast error is below the target, an incentive payment will be received, however if the forecast error is greater than the target then an incentive penalty will be applied.
28. An average annual forecast error of 1.37 mcm below the target (12.33 mcm) would mean National Grid earning £1m, and an error of 1.37 mcm in excess of the target (15.07 mcm) would result in National Grid being penalised by the same amount. The latter represents the highest loss that National Grid is
exposed to under this incentive. The maximum payment that National Grid can receive is £10m at zero forecast error.
29. For 2017/18, the base target for both schemes remains the same, except that an efficiency factor applies to the D-1 Demand Forecasting Storage Adjuster.
The 2017/18 storage adjuster is calculated as 50% of the 2016/17 storage adjuster (which was 0.89 mcm) plus/minus 3.8% of the change in injection capability of short cycle storage sites between 2016/17 and 2017/18.

11
2.3 Greenhouse Gas (GHG) Emissions from Compressors
Purpose: To incentivise the consideration of the environment when venting
gas from NTS compressors.
30. Compressors are utilised to increase pressures in parts of the NTS and to move gas from the sources of supply to areas of demand. The need to
operate an individual compressor on any given day depends on a number of factors, including the sources of supply and demand, the prevailing network conditions and the need to accommodate essential maintenance, emission testing and construction plans.
31. The scheme incentivises National Grid to make the trade-off between choosing to depressurise compressor units (venting the gas within them) or to keep units on standby, which incurs costs associated with ancillary electrical equipment (vent fans, oil pumps etc.) and a level of emissions through the
shaft seal. The incentive applies to both gas and electrically driven compressors.
32. The amount of natural gas vented from NTS compressors (in tonnes) results from a number of areas; namely starting, purging or depressurising a
compressor or through emissions of gas through compressor shaft seals.
33. The Greenhouse Gas incentive was set for an initial three years commencing 1 April 2013 and was then set for a further two year period as part of the Incentive Review covering 2016/17 and 2017/18 against amended scheme
parameters.
34. The incentive compares actual venting quantities against a target level. For every tonne vented above this target, National Grid is subject to a penalty.
35. For 2017/18, the target level is 2,897 tonnes, with a penalty of £1,5106 per
tonne vented above the target. As a ‘downside only’ scheme, National Grid does not receive any payment for target outperformance. The incentive scheme parameters are summarised in Figure 4.
36. The GHG calculation methodology has been externally audited; however,
investigations are ongoing into the reportable and incentivised emissions in prior years that may change the incentivised venting quantities.
6 Based upon the Non Traded Central Carbon Price as published the relevant Government Department and the venting equivalent factor that represents the number of tonnes of CO2 equivalent.

12
Figure 4: Greenhouse Gas Emission scheme 2017/18

13
2.4 Residual Balancing
Purpose: To incentivise the daily balancing of supply and demand whilst minimising the impact of any actions on market prices.
37. The incentive contains two elements; the Price Performance Measure (PPM) and the Linepack Performance Measure (LPM) and was set for eight years commencing 1 April 2013.
38. The PPM incentivises National Grid to execute any residual balancing trades
at prices that are in a small range. The PPM is defined as the difference between the highest and lowest prices at which National Grid trades, divided by SAP. The target is a price spread of 1.5% of SAP.
39. The LPM incentivises National Grid to minimise any changes between starting
and closing NTS linepack over a Gas Day (i.e. to achieve a balance between the supply and demand on the Gas Day). This is intended to ensure that any system imbalances are resolved on the relevant day, so that the costs of resolving any imbalances are targeted to those responsible for the imbalance.
The target is a linepack change of 2.8 mcm.
40. The PPM and LPM each have their own incentive structures, which apply to each Gas Day in the incentive year. The structure for the PPM is shown in Figure 5.
Figure 5: Residual Balancing scheme – Price Performance Measure (PPM)
41. If the PPM is below 1.5% on a given Gas Day then National Grid receives an incentive payment up to a maximum of £1,500. Conversely, if the PPM is
above 1.5%, then National Grid incurs a penalty up to a maximum of £30,000.

14
42. The incentive structure for the LPM is similar to that for the PPM and is shown in Figure 6.
Figure 6: Residual Balancing scheme – Linepack Performance Measure
(LPM)
43. If the LPM is below 2.8mcm on a given Gas Day, then National Grid receives an incentive payment up to a maximum of £4,000. This maximum applies at 1.5 mcm. Conversely, if the LPM is above 2.8 mcm, then National Grid incurs
a penalty up to a maximum of £30,000.
44. The sum of all of the daily payments for the price and linepack performance under the Residual Balancing incentive are annually capped at £2m and collared at £3.5m.
45. For 2017/18 the target for both schemes remains the same.

15
2.5 NTS Shrinkage
Purpose: To incentivise an efficient overall cost of shrinkage through efficient
system operation and energy procurement.
46. NTS Shrinkage covers the gas and electrical energy which is used in operating NTS compressors, and the gas that cannot be accounted for and billed in the measurement and allocation process. The components that
comprise NTS Shrinkage are summarised as:
Compressor Fuel Use (CFU): The energy used to run compressors to transport gas through the NTS. For gas driven compressors, this is Own Use Gas (OUG), for electric driven compressors, this is Electric
Compressor Energy;
Calorific Value Shrinkage (CVS): The energy which cannot be billed due to the provisions of the Gas (Calculation of Thermal Energy) Regulations
1996 (amended in 1997); and
Unaccounted for Gas (UAG): The quantity of gas which remains after taking into account all measured inputs and outputs from the system,
OUG consumption, CVS and the daily change in NTS linepack.
47. The form of the NTS Shrinkage incentive is a bundled cost minimisation incentive across all components of shrinkage, with a target principally derived
from an energy procurement cost benchmark.
48. This ‘Energy Procurement Target’ is derived from a volume forecast and variance (the difference between the forecast and actual volume outturn). This is multiplied by gas and electricity reference prices for forwards procurement
(of the forecast volume) and prompt procurement (of the variance volume) to derive a cost target. The volume forecast consists of CFU, CVS and UAG volumes determined in accordance with an NTS Shrinkage Methodology Statement published by National Grid.
49. The overall cost target is also subject to:
An adjustment for comparison of outturn CFU and CVS volumes compared to ‘efficient’ levels;
An allowance for the Transmission Network Use of System (TNUOS)
charges incurred in respect of electrically driven compressors; and
An adjustment for other shrinkage costs, including environmental scheme compliance, electricity supply charges and other energy trading costs.
50. This incentive was set for eight years commencing 1 April 2013. The incentive
scheme parameters are summarised in Figure 7.
16
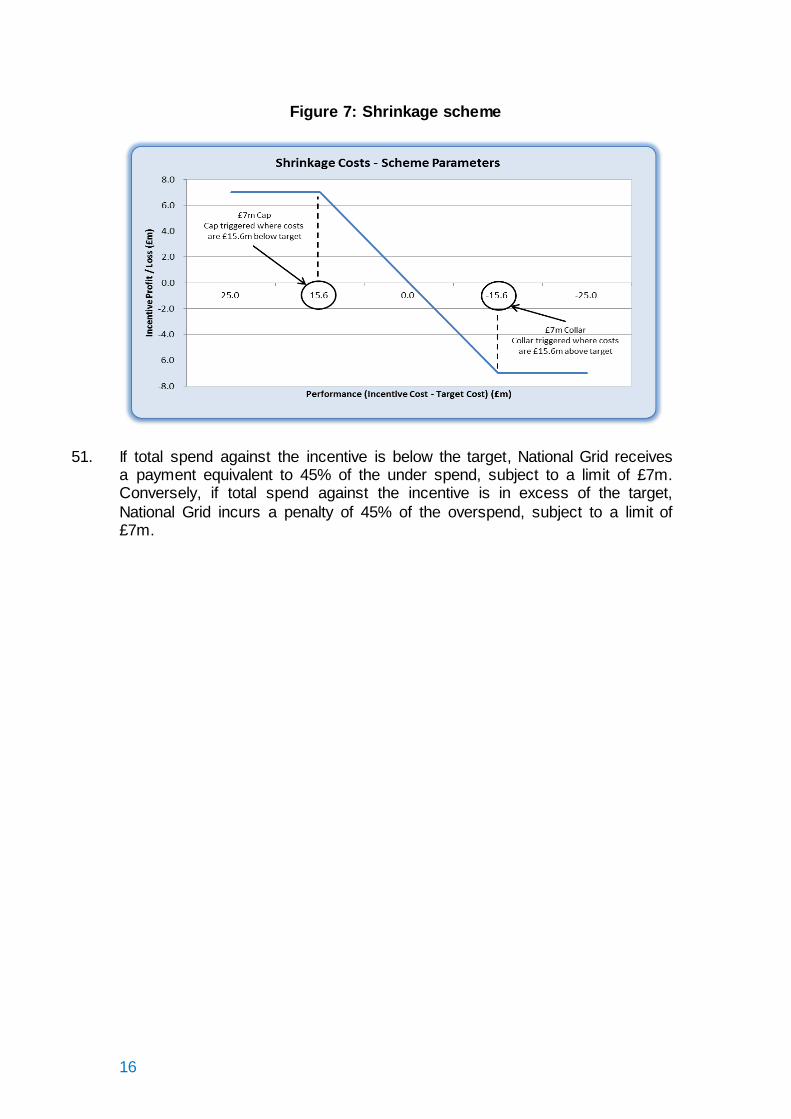
Figure 7: Shrinkage scheme
51. If total spend against the incentive is below the target, National Grid receives a payment equivalent to 45% of the under spend, subject to a limit of £7m. Conversely, if total spend against the incentive is in excess of the target,
National Grid incurs a penalty of 45% of the overspend, subject to a limit of £7m.

17
2.6 Maintenance
Purpose: To incentivise the efficient planning and execution of network
maintenance impacting customers at direct exit connections7 from the NTS.
52. In order to ensure the ongoing reliability and integrity of the NTS in line with
regulatory and safety requirements, National Grid is required to periodically undertake maintenance of the pipeline system. Where this work requires an outage, or to reduce the flexibility available (e.g. where steady gas flows may be required) at one or more direct exit connections, National Grid may ‘call’
one or more ‘Maintenance Days’ in accordance with the Uniform Network Code (subject to any site specific limitations).
53. To minimise the impact of maintenance work on customers, National Grid plan maintenance activities to align with periods which minimise disruption to
customer operations. Where National Grid is able to align maintenance to periods which have no impact on customer contractual rights, National Grid will communicate the maintenance period as ‘Advice Notice Days’. Where this is not possible and an outage or restriction on customer operations is
required, a ‘Maintenance Day’ will be called. The maintenance incentive is therefore split in to two scheme components:
Changes Scheme - minimisation of changes initiated by National Grid to the agreed maintenance plan; and
Use of Days Scheme - minimisation of the use of Maintenance Days to perform Remote Valve Operations maintenance.
54. In respect of the Changes Scheme the target number of Maintenance Days
or Advice Notice Days8 subject to change initiated by National Grid (excluding
changes made at a customer’s request) is equal to 7.25% of the total number of maintenance plan days within the year. Changes within scope include changes to dates (including reduction or increases to the number of days for a specific job) or cancellation of days.
55. If the actual number of days changed is equal to target, then incentive revenue is zero. If the actual number of days changed is less than the target, then a payment of £50,000 per change below target is accrued up to a scheme cap of £0.5m (for ten changes or more below target). If the actual
number of days changed exceeds the target, then a penalty of £50,000 per change in excess of the target is accrued to a scheme collar of -£0.5m (for ten changes or more above target). The incentive scheme parameters are summarised in Figure 8.
7 Direct exit connections to the NTS include individual NTS Supply Points and NTS Connected System Exit Points, but exclude offtakes to Distribution Networks. 8 Where a single maintenance activity affects multiple NTS Exit Points on a day, this is construed as a single day for the purposes of the Maintenance Incentives.

18
Figure 8: Maintenance scheme - Changes
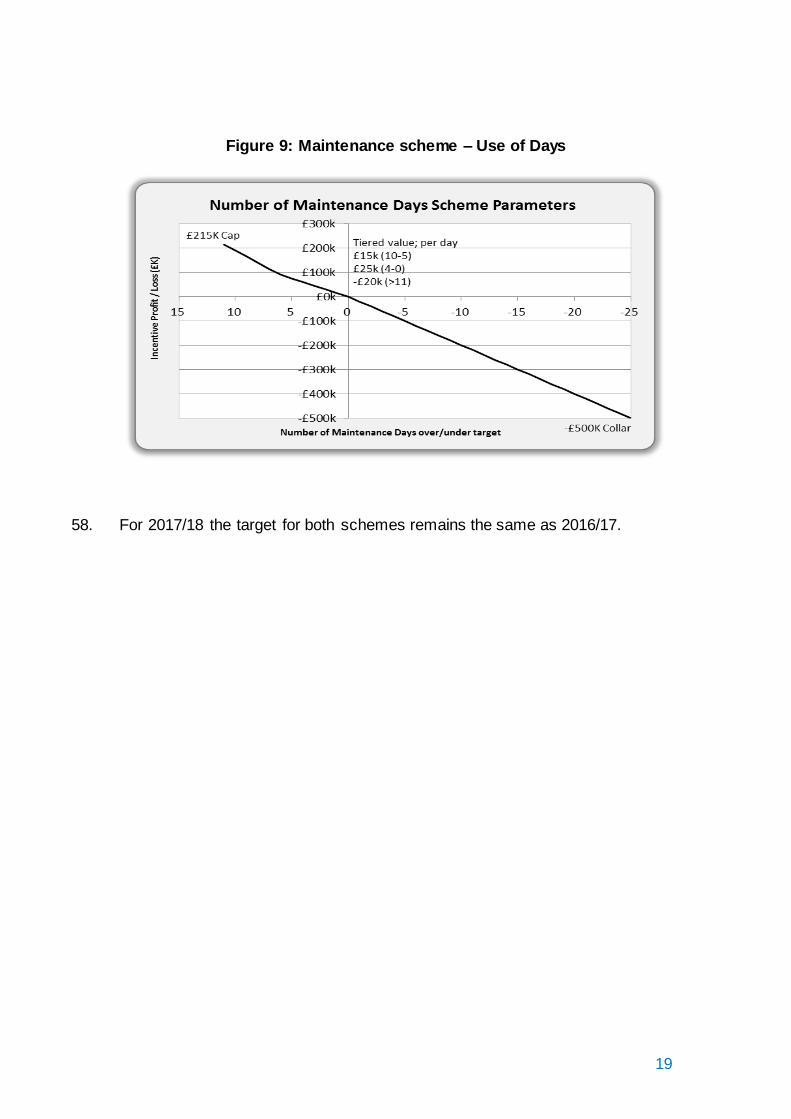
56. The Use of Days Scheme incentivises National Grid to minimise the number
of Maintenance Days it uses to undertake Remote Valve Operations9. National Grid has an annual incentive target (in days) of eleven.
57. If the actual number of Maintenance Days used for these activities is equal to the target, then incentive revenue is zero. If the actual number of Maintenance Days used is less than target, National Grid receives a tiered payment between £15,000 and £25,000 each day below the target, up to a scheme cap
of £0.215m. The first five days used at £25,000, followed by £15,000. If the actual number of Maintenance Days used exceeds the target, National Grid receives a penalty of £20,000 per day up to £0.5m (for twenty-five days or more above target). The incentive scheme parameters are summarised in
Figure 9.
9 Valves are used to control the flow of gas and isolate pipelines in an emergency. To ensure
the safe operation of the system, National Grid maintain key valves on an annual basis where they will need to be opened and closed to ensure operation, requiring a system bypass to maintain supply.
19
Figure 9: Maintenance scheme – Use of Days
58. For 2017/18 the target for both schemes remains the same as 2016/17.
20
2.7 Entry Capacity and Exit Capacity Constraint Management
Purpose: To incentivise an efficient overall cost of System Operator constraint
management actions through efficient system operation and optimisation of strategies, and encourage balanced risk versus reward decisions in the release of additional capacity.
59. The current regulatory and commercial frameworks oblige National Grid to
release obligated levels of capacity significantly in excess of peak demand at both entry and exit points on the network. Flows of gas at these levels of capacity cannot occur concurrently, so National Grid takes a view of the likely combinations of supply and demand patterns likely to occur and makes an
assessment of the most efficient solution to meet customer capacity requirements. We consider the rules, tools and asset options available to us.
60. In the instance where we believe we cannot accommodate Shippers’ flow requirements associated with booked capacity, we undertake constraint
management actions in accordance with the Uniform Network Code and System Management Principles Statement10. These actions fall into two categories:
Operational constraint management – actions taken by National Grid to
manage day to day issues on the network, such as unavailability of compression or maintenance outages; and
Investment constraint management – actions taken by National Grid to
manage longer term issues associated with provision of additional
capacity on the network, such as where physical reinforcement is not delivered within the contracted timescale.
61. There are numerous commercial tools available to manage Operational and investment constraints, these include:
Capacity Buybacks – buying back Firm Entry or Exit Capacity previously
sold to system users;
Locational Energy Trades – buying gas into NTS linepack or selling gas
out of NTS linepack at specific locations on the network; and
Turn Up/Turn Down Contracts – contracts entered into to manage
specific planned outages or where specific flow requirements need to be confirmed in advance.
10 For details of the System Management Principles statement (SMPS),see http://www.nationalgrid.com/uk/Gas/OperationalInfo/operationaldocuments/ProcurementSystemManagementServicesStatementsReports/doc_req_by_SCC8D/Stmt_Ent_Cap_Const_MGMT
21
62. From 1 April 2013, National Grid was subject to a new Constraint Management incentive which was set for eight years and encompasses both Entry Capacity and Exit Capacity Constraint Management actions. Incentive
performance is driven by the difference between the net constraint management costs over a year (i.e. constraint management costs less revenues from the sale of certain capacity products) and a target value for such costs.
63. The revenues that feed into this incentive are:
Locational sell actions and physical re-nomination incentive charges (having the meaning given to these terms in the Network Code
Non-obligated capacity (capacity released over and above the obligated level);
Interruptible Entry Capacity and Off Peak Exit Capacity;
Within day Firm Entry and Exit Capacity; and
Entry overrun charges (the charges incurred when Users’ flows exceed
their capacity entitlements).
64. All costs and revenues associated with the scheme are passed through to Shippers through Capacity Neutrality and other charges. National Grid
receives an incentive revenue or penalty according to whether actual net costs are higher or lower than the incentive target. This revenue or penalty feeds through charges two years after the financial year to which the incentive performance relates.
65. For 2017/18 the target is comprised of:
a net target cost of £28m for entry and exit operational constraint
management with National Grid’s incentive revenue or penalty being 44.36% of the over or under spend respectively; and
a £0m target for entry and exit investment constraint management with
National Grid’s incentive revenue or penalty being 100% of the under or overspend.
66. The incentive scheme parameters for the operational part of the scheme are summarised in Figure 10.

22
Figure 10: Entry Capacity and Exit Capacity Constraint Management scheme
67. The incentivised range for 2017/18 is between a net cost of £198.3m and net revenue of £29.11m. The target, cap and collar are subject to the final RPI numbers.

23
2.8 Transportation Support Services
Purpose: To incentivise the minimisation of the overall cost of Transportation
Support Services (TSS).
68. Transportation Support Services (TSS) are additional tools available to National Grid to support provision of a network to meet a 1-in-20 peak day
demand11. These tools are substitutes for physical pipeline capacity and there are currently two forms:
Long Run Contracting – this comprises commercial arrangements at five specifically named direct offtakes in the South West of the network.
These ensure that National Grid retains the ability to manage the network following the introduction of the universal firm exit regime through Exit reform.
Constrained LNG – National Grid can procure services at the Avonmouth
LNG Storage Facility as a substitute for network investment during periods of high demand in the South West12.
69. The TSS incentive scheme runs from 1 April 2013 until 30 September 2018 and takes the form of an overall cost minimisation incentive with incentive
performance driven by the difference between the TSS costs over a year and a target value for such costs. For 2017/18, this cost target is £9.2m (subject to RPI). The incentive scheme parameters are summarised in Figure 11.
Figure 11: Transportation Support Services scheme
11 1 in 20 peak day demand is the level of daily demand that, in a long series of winters, with connected load held at the levels appropriate to the winter in question, would be exceeded in one out of 20 winters, with each winter counted only once. 12 Avonmouth LNG Storage Facility closed 30 April 2016.

24
70. If the TSS cost is below the target, National Grid receives an incentive revenue equivalent to 44.36% of the under spend, up to a maximum of £4.04m when TSS costs are zero. Conversely, if the TSS cost is in excess of
the target, National Grid incurs an incentive penalty of 44.36% of the overspend. There is no limitation on this penalty.
2.9 Customer and Stakeholder Satisfaction
Purpose: To incentivise delivery of customer and stakeholder satisfaction with outputs delivered by National Grid.
71. Customer and Stakeholder Satisfaction is an indicator of how satisfied customers and stakeholders are with National Grid. To reflect the importance
of customer and stakeholder satisfaction in today’s society, National Grid is incentivised to survey its customers and stakeholders to measure their overall satisfaction.
72. National Grid carries out surveys on a trigger based process in order to
capture customer and stakeholder feedback in a timely and relevant manner. The survey asks customers to rate their overall satisfaction with National Grid Transmission on a scale of one to ten, where one is very dissatisfied and ten is very satisfied for a range of services and engagement.
73. Our surveys cover both the ‘System Operator’ and ‘Transmission Owner’ aspects of our role to align with customers’ and stakeholders’ experience of how we operate as an integrated provider of transmission services.
74. The incentive scheme provides an incentive reward or penalty to National Grid
of up to +/- 1% of National Grid’s annual allowed revenue.
25
3 Incentive Performance
3.1 Summary of Past Performance
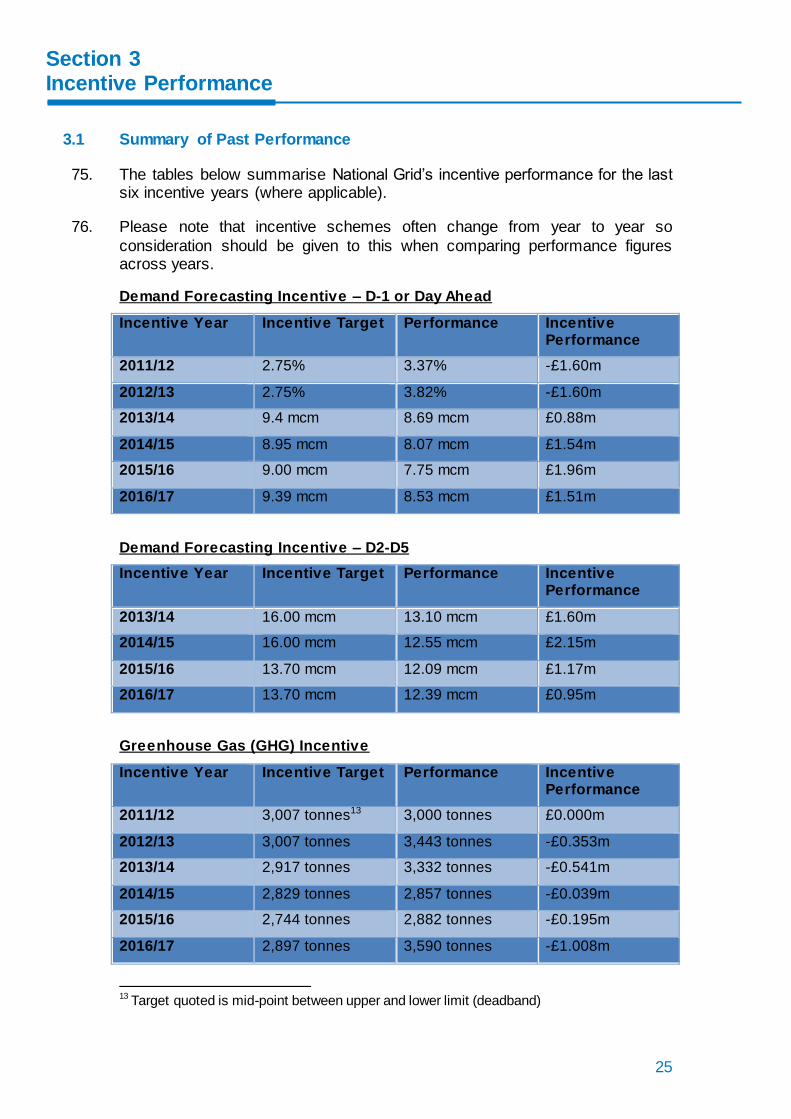
75. The tables below summarise National Grid’s incentive performance for the last six incentive years (where applicable).
76. Please note that incentive schemes often change from year to year so
consideration should be given to this when comparing performance figures across years.
Demand Forecasting Incentive – D-1 or Day Ahead
Incentive Year Incentive Target Performance Incentive Performance
2011/12 2.75% 3.37% -£1.60m
2012/13 2.75% 3.82% -£1.60m
2013/14 9.4 mcm 8.69 mcm £0.88m
2014/15 8.95 mcm 8.07 mcm £1.54m
2015/16 9.00 mcm 7.75 mcm £1.96m
2016/17 9.39 mcm 8.53 mcm £1.51m
Demand Forecasting Incentive – D2-D5
Incentive Year Incentive Target Performance Incentive Performance
2013/14 16.00 mcm 13.10 mcm £1.60m
2014/15 16.00 mcm 12.55 mcm £2.15m
2015/16 13.70 mcm 12.09 mcm £1.17m
2016/17 13.70 mcm 12.39 mcm £0.95m
Greenhouse Gas (GHG) Incentive
Incentive Year Incentive Target Performance Incentive Performance
2011/12 3,007 tonnes13 3,000 tonnes £0.000m
2012/13 3,007 tonnes 3,443 tonnes -£0.353m
2013/14 2,917 tonnes 3,332 tonnes -£0.541m
2014/15 2,829 tonnes 2,857 tonnes -£0.039m
2015/16 2,744 tonnes 2,882 tonnes -£0.195m
2016/17 2,897 tonnes 3,590 tonnes -£1.008m
13
Target quoted is mid-point between upper and lower limit (deadband)
Section 3 Incentive Performance
26
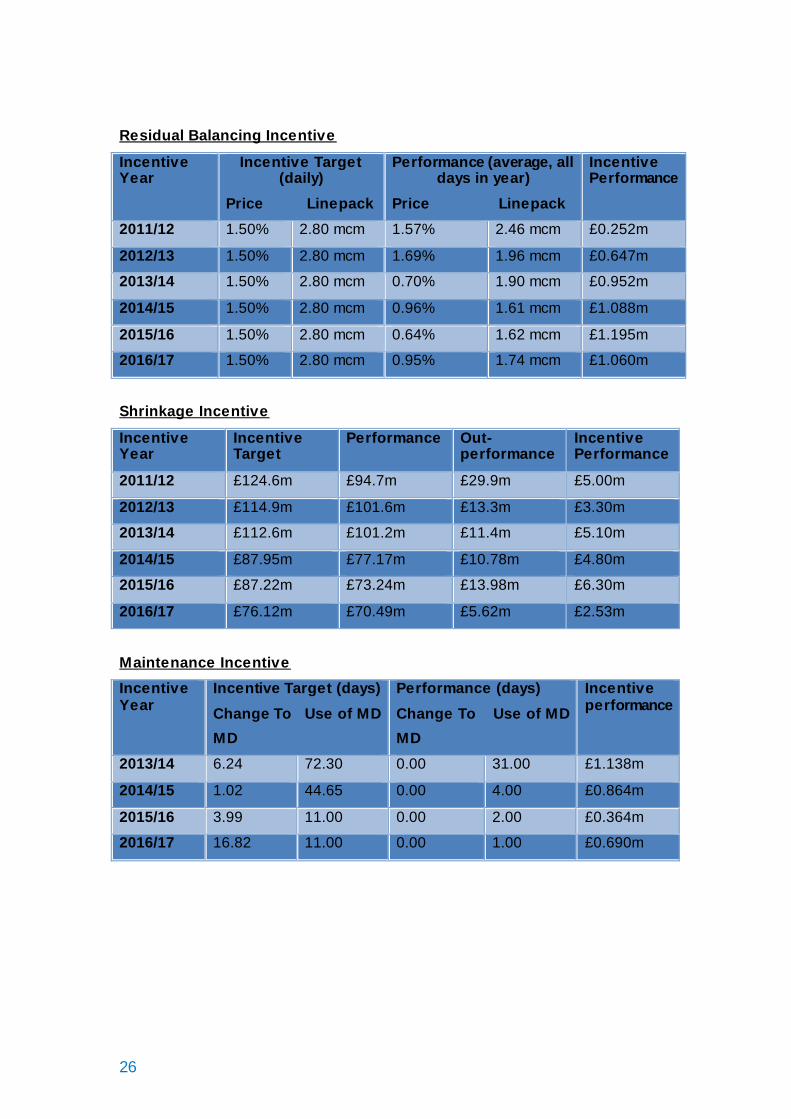
Residual Balancing Incentive
Incentive Year
Incentive Target (daily)
Price Linepack
Performance (average, all days in year)
Price Linepack
Incentive Performance
2011/12 1.50% 2.80 mcm 1.57% 2.46 mcm £0.252m
2012/13 1.50% 2.80 mcm 1.69% 1.96 mcm £0.647m
2013/14 1.50% 2.80 mcm 0.70% 1.90 mcm £0.952m
2014/15 1.50% 2.80 mcm 0.96% 1.61 mcm £1.088m
2015/16 1.50% 2.80 mcm 0.64% 1.62 mcm £1.195m
2016/17 1.50% 2.80 mcm 0.95% 1.74 mcm £1.060m
Shrinkage Incentive
Incentive Year
Incentive Target
Performance Out-performance
Incentive Performance
2011/12 £124.6m £94.7m £29.9m £5.00m
2012/13 £114.9m £101.6m £13.3m £3.30m
2013/14 £112.6m £101.2m £11.4m £5.10m
2014/15 £87.95m £77.17m £10.78m £4.80m
2015/16 £87.22m £73.24m £13.98m £6.30m
2016/17 £76.12m £70.49m £5.62m £2.53m
Maintenance Incentive
Incentive Year
Incentive Target (days)
Change To Use of MD
MD
Performance (days)
Change To Use of MD
MD
Incentive performance
2013/14 6.24 72.30 0.00 31.00 £1.138m
2014/15 1.02 44.65 0.00 4.00 £0.864m
2015/16 3.99 11.00 0.00 2.00 £0.364m
2016/17 16.82 11.00 0.00 1.00 £0.690m
27
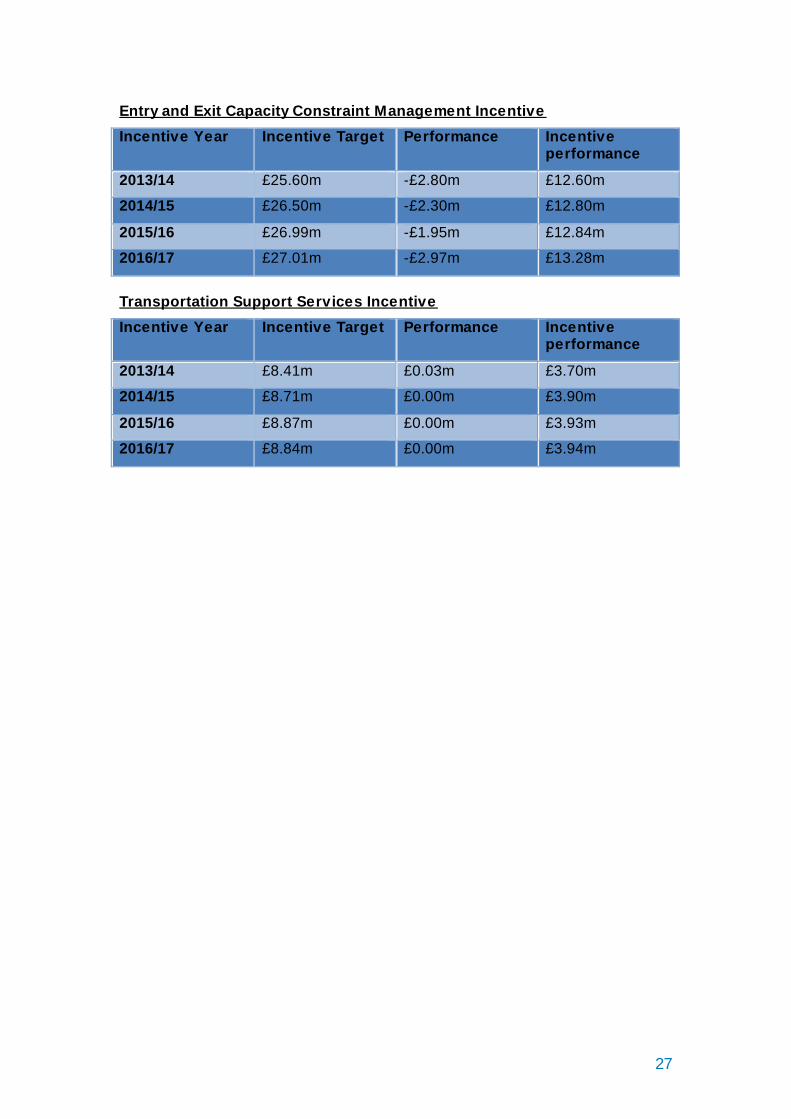
Entry and Exit Capacity Constraint Management Incentive
Incentive Year Incentive Target Performance Incentive performance
2013/14 £25.60m -£2.80m £12.60m
2014/15 £26.50m -£2.30m £12.80m
2015/16 £26.99m -£1.95m £12.84m
2016/17 £27.01m -£2.97m £13.28m
Transportation Support Services Incentive
Incentive Year Incentive Target Performance Incentive performance
2013/14 £8.41m £0.03m £3.70m
2014/15 £8.71m £0.00m £3.90m
2015/16 £8.87m £0.00m £3.93m
2016/17 £8.84m £0.00m £3.94m
28
Impact of Incentive Payments on Charges
This section shows the link between incentive revenues and charges faced by
Users.
77. National Grid’s incentive payments are recovered from Shippers through the SO Commodity Charge (apart from the Customer and Stakeholder Incentive
which is subject to the TO revenue recovery process), which National Grid has a reasonable endeavours obligation to only set twice a year on the 1 April and the 1 October.
78. For the financial year 2016/17 the incentive revenue from all of the incentive
schemes amounted to approximately 2.3% of the total SO Commodity Charge.
79. National Grid publishes a quarterly update on the charges report, which contains either the actual SO Commodity Charge, or the latest forecast of the
charge. This report also includes supporting data on how these charges have been calculated and can be found (with previous versions) on the National Grid website. http://www2.nationalgrid.com/uk/industry-information/gas-system-operator-incentives/
80. As a rule of thumb, an increase of £2m in the costs recovered through the SO commodity charge would correspond with an increase in the SO Commodity Charge of approximately 0.0001p/kWh applied to both entry and exit flows.
81. Since 2013/14, revenues and costs in respect of the Entry Capacity and Exit
Capacity Constraint Management and Transportation Support Services incentive schemes are reflected in the SO Commodity Charge within the second Formula Year following the Formula Year in which those revenues and costs were accrued.
Section 4 Impact of Incentive Payments on Charges