national petrochemical & refiners association 1899 l ...€¦ · steam-methane reformer...
TRANSCRIPT

NATIONAL PETROCHEMICAL & REFINERS ASSOCIATION1899 L STREET, NW, SUITE 1000
WASHINGTON, DC 20036
ENV-02-178
SELECTIVE CATALYTIC REDUCTION (SCR) PERFORMANCE INSTEAM-METHANE REFORMER SERVICE:
THE CHROMIUM PROBLEM
By
J.R. O’Leary
Air Products and Chemicals, Inc.Allentown, Pennsylvania
R.G. Kunzand
T.R. von Alten
Cormetech, Inc.Environmental Technologies
Durham, North Carolina
Presented at the
NPRA2002 Environmental Conference
September 9-10, 2001Sheraton New Orleans
New Orleans, Louisiana

This paper has been reproduced for the author or authors as a courtesy by the National Petrochemical &Refiners Association. Publication of this paper does not signify that the contents necessarily reflect theopinions of the NPRA, its officers, directors, members, or staff. NPRA claims no copyright in this work.Requests for authorization to quote or use the contents should be addressed directly to the author(s)

ENV-02-178Page 1
Selective Catalytic Reduction (SCR) Performance inSteam-Methane Reformer Service:
The Chromium Problem
J.R. O’Leary
Air Products and Chemicals, Inc.Allentown, Pennsylvania
R.G. Kunzand
T.R. von Alten
Cormetech, Inc.Environmental Technologies
Durham, North Carolina
ABSTRACT
SCR performance has been seen to deteriorate with catalyst age at a greater than expected rate insteam-methane reformers (SMRs) and ethylene plants. Loss of catalyst activity has beenattributed to deposition of chromium-oxide species from alloy furnace tubes and coils on thecatalyst surface, thereby masking active catalyst sites. This deposit is visible to the naked eye asa brown or iridescent black discoloration along the passages of a flow-through honeycombcatalyst, darkest at the entrance face and gradually becoming lighter as one proceeds downstream.The color becomes more intense with increased exposure to flue gas.
It is important for proper design and catalyst-replacement strategy to understand the governingphenomena at a fundamental level, especially at a time when SCR is increasingly being turned toas BACT to comply with the more stringent nitrogen oxides (NOx) regulations. This paperdescribes a correlation of previously unpublished experimental data from catalyst test-sections(logs) exposed in the field over a period of several years at multiple SMR plant locations.
Consistent with the observed color change, chromium pickup increases with time and varies withoperating conditions from plant to plant. Any given log, at any given time, shows an exponential,or semi-logarithmic, decrease in chromium concentration over its length. Activity decay of thecatalyst has been correlated with the chromium concentration. This single correlation holds truefor all of the different plants investigated and can be used to predict remaining catalyst life andoptimize future catalyst designs. Scanning electron microscope (SEM) results and surfaceanalyses from the SCR catalyst and SMR reformer tubes are also discussed, along with suggestedcountermeasures to mitigate the effects of chromium oxide deposition.

ENV-02-178Page 2
INTRODUCTION
SCR catalyst performance has been observed first-hand to deteriorate in SMR hydrogen plants ata faster than expected rate,1,2 and such accelerated deterioration has been reported for ethyleneplants as well.3,4 It is important, therefore, to account for this loss of activity when sizing theinitial charge of catalyst and to make an accurate prediction of the useful life of that catalystbefore replacement is necessary. To do so, one really must understand the governing phenomenaon a fundamental level.
A basic understanding will include:• Where the chromium comes from.• How it reaches the SCR catalyst.• What it does to the catalyst.• How NOx removal is affected.• How the effect can be mitigated.• When the catalyst must ultimately be replaced.
This paper presents the results of a systematic experimental investigation as outlined in Table 1.It is designed to extend the knowledge gained from our own observations and experience and thatof others, as reported in the literature. Those results are discussed following some necessarybackground information.
H2 PROCESS DESCRIPTION
The steam-methane reforming (SMR) process reacts a hydrocarbon with steam (H2O) to producea mixture of hydrogen (H2) and carbon monoxide (CO), generically known assynthesis gas(syngas). Major process steps consist of sulfur removal, reforming, water-gas shift in hightemperature shift (HTS) and low temperature shift (LTS) converters, and H2 product purification.A typical process flow sheet is available elsewhere.5
The hydrogen is separated from the syngas in a pressure-swing-adsorption (PSA) unit capable ofproducing a hydrogen purity of 99.9 % to 99.999 %.6,7 The other components in the PSA feedplus some hydrogen end up in the so-calledPSA purge gas, a low-Btu gas which is recycled asthe bulk of the fuel to the reformer-furnace burners. Combustible components in the PSA purgegas include hydrogen, carbon monoxide, and methane. This is supplemented typically by naturalgas or refinery fuel gas as auxiliary, or trim, fuel. Oxides of nitrogen (NOx) are generated in thecombustion process.
NOx from a hydrogen plant reformer furnace burning PSA purge gas with natural gas as trim fueland without air preheat can be as low as 0.03 lb NOx/MM Btu, based on the higher heating value(HHV) of the fuel.8,9 This is equivalent to about 25 ppmv (dry) at 3 % O2 (dry). However, insome regulatory jurisdictions, such as California and the Gulf Coast area of Texas, selectivecatalytic reduction (SCR) must be applied to reduce NOx emissions still further.

ENV-02-178Page 3
Performance of SCR has been demonstrated on SMR hydrogen plants. A sampling of AirProducts hydrogen plant projects using SCR for NOx control is shown in Table 2; one of theseinstallations, the Martinez I plant, is pictured in Figure 1. Air Products is the No. 1 Supplier inhydrogen sales to third parties.
Locations in the table represent a joint accumulated operating experience for Air Products andCormetech of over 30 years. Cormetech has supplied SCR catalyst for other hydrogen-plantclients as well. As explained below, direct experience with hydrogen-plant flue gas is importantfor initial catalyst sizing and prediction of run length.
THE SCR PROCESS
In this process (Figure 2), the oxides of nitrogen NO and NO2, commonly known asNOx, arereacted with ammonia (NH3) in the presence of a flow-through honeycomb catalyst to givenitrogen (N2) and water vapor (H2O).1,2 Reaction stoichiometry with ammonia, injected upstream,depends on the relative amount of each oxide and whether or not oxygen (O2) is present. Forcombustion applications containing excess oxygen and parts-per-million (ppm) concentrations ofNOx with the typical 95 % NO and 5 % NO2 split, the equations given in Figure 2 apply. In theabsence of competing side reactions, the theoretical molar ratio of NH3 reacted to NOx destroyedis 1.0.
Not all of the ammonia added, however, will have enough time to react with the NOx, and thisunreacted NH3 at the SCR outlet is termed theammonia slip. Ammonia slip normally starts out ata very low level for new catalyst. It gradually increases at a given outlet NOx when moreammonia must be fed to compensate for the loss of catalyst activity as time goes by.
The activity of SCR catalyst is often expressed by the value of a factor known asK in an equationrelating inlet and outlet NOx, ammonia, and residence time within the catalyst as expressed byarea or space velocity. One such simple model has been discussed previously.1,2 The K sodetermined is a lumped parameter that includes the effects of catalyst composition, temperature,the combination of kinetic reaction-rate and mass transfer at that temperature, and the loss ofcatalyst activity with age/exposure to flue gas. A typical temperature range for base-metalcatalysts composed of TiO2, V2O5, and other ingredients is 600-750 °F (316-399 °C).1,2
In turn, the kinetic reaction-rate depends on flue-gas oxygen and moisture, and the mass transferon catalyst geometry, surface properties, and flue-gas velocity. A decline in catalyst activity isreflected by a decrease in the ratio K/Ko, where Ko is determined for fresh catalyst of the samegeometry and composition under the same operating conditions. For brand-new catalyst, K/Ko isidentically equal to 1.0.
THE PROBLEM
Some small loss of catalyst activity over time is to be expected, even when firing a clean gaseousfuel. However, we have found that the presence of chromium-oxide species in the flue gas of ahydrogen reformer furnace causes loss of SCR catalyst activity over time at a rate greater than

ENV-02-178Page 4
normally expected for a clean-gas application. The loss of catalyst activity has been attributed to amasking of active catalyst surface by an ongoing deposition of some form of chromium,2 with thepotential for evaporation at parts-per-billion (ppb) to parts-per million (ppm) concentrations fromthe alloy metals in contact with hot flue gas.10 This same loss of activity and chromiumdeposition have also been reported for ethylene plants,3,4 where pyrolysis-coil temperatures in thecracking furnace are similar and the same family of chromium/nickel alloys are used.10
This masking layer manifests itself as a discoloration of the SCR catalyst surface, heavy at theinlet and becoming gradually lighter approaching the outlet. The color deepens and spreadsfarther downstream with greater exposure time. The color varies from brownish to an iridescentblack, possibly depending on the temperature of chromium oxide condensation on the catalyst.
A photograph of an exposed SCR catalyst sample removed from an Air Products hydrogen plantis shown in Figure 3, along with a fresh, unexposed sample for comparison. The discoloration ofthe exposed sample (on the left) is dark brown at the inlet face and somewhat lighter brown at theoutlet (not pictured). The fresh catalyst sample shown on the right in Figure 3 is a light tan, witha nominal pitch in the range of 2-4 mm, typical of clean-gas service.11
Published plots of catalyst activity (K/Ko) vs. time for hydrogen and ethylene plants are depictedin Figure 4.10 As the SCR catalyst continues to age from chromium deposition during operation,K/Ko will eventually reach a point at which environmental permit requirements for outlet NOxand ammonia slip cannot be met simultaneously, and the plant must be shut down to replace thecatalyst.
To conduct this process in an orderly manner during a planned shutdown with replacementcatalyst on hand, one must be able to predict catalyst life accurately, a consideration leading tothe present investigation.
INVESTIGATION OF THE CHROMIUM PHENOMENON
OVERVIEW
Various theories have been advanced concerning the origin of the chromium. Suggested sourcesinclude the trim fuel, the chromium content of the HTS catalyst, the alloys in contact with the fluegas (i.e., reformer tubes in the radiant section of the furnace and cooling fins/coils in theconvection section), and even the combustion air.
It is possible to reject some of these almost immediately. With respect to the trim fuel, thechromium phenomenon occurs in SMR-furnace flue gas equally with natural gas or refinery fuelgas. Cormetech has supplied SCR catalyst in numerous other natural-gas-fired applications forwhich chromium poisoning is not an issue. Likewise, regarding combustion air.
The contention that chromium contained in HTS catalyst is somehow working its way from theprocess side through the PSA to the flue gas can also be ruled out; chromium deposition isobserved on SCR catalyst in ethylene-plant pyrolysis furnaces,3,4 where no process catalyst of anykind is employed.

ENV-02-178Page 5
That leaves the furnace metallurgy, which is a focal point of this investigation. This assumesvaporization and vapor deposition to be the underlying mechanism, as opposed to particulatetransport and capture. Experimental data, applicable thermodynamics, and a proposedmechanism are explored in greater detail in the Results and Discussion Section.
TEST PROCEDURES AND EQUIPMENT
A series of separate, though related, experimental procedures outlined in Table 1 was conducted.Metallurgical samples were analyzed using energy dispersive X-ray spectrometry (EDS). Freshand exposed catalyst samples were examined using a scanning electron microscope (SEM).Details are provided in the Results and Discussion Section.
Periodically over many years, catalyst test-sections (commonly known aslogs or test logs) wereremoved from the Air Products H2 plants and were analyzed for chromium by Air Products usinginductively coupled plasma-optical emissions spectroscopy (ICP-OES) and for catalytic activityby Cormetech. Test details are given below; data are considered in the Results and DiscussionSection.
Chromium Analyses. These were obtained by first sectioning the test log into four equalsegments, whose length depends on the overall length of the original sample (Figure 5).One-inch (2.54-cm) cubes were removed from the inlet face of each segment as well as from theoutlet face of the last segment. The 1-inch cubes were then ground up and placed in a mixed acidsolution, sealed, and heated in a microwave oven to dissolve the catalyst sample. ICP-OES wasemployed, as indicated, to measure the bulk percent chromium in each sample. This techniquecan be used to obtain a more complete elemental analysis as well.
Activity Testing. Catalyst activity was evaluated in apilot reactor in Cormetech’s laboratory.The quarter-segments cut from some of the original sample logs were tested in amicro reactorfollowing the pilot test on the entire log.
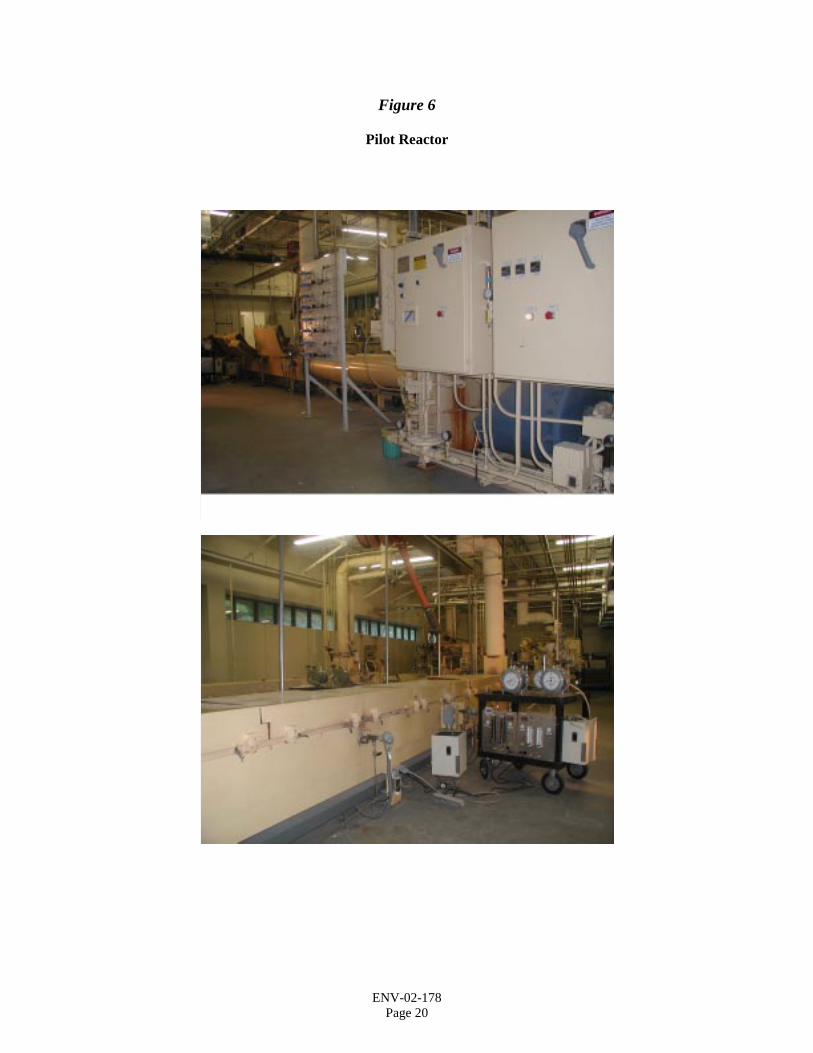
The pilot reactor is a large-scale test apparatus used to evaluate the performance of SCR catalystat actual operating conditions (Figure 6). It consists of a water-cooled combustion chamber andelectric heater to achieve the desired test velocity and temperature. Excess air is introduced toobtain the desired flue-gas O2 concentration, and levels of NOx and SO2 (if necessary) can alsobe adjusted to simulate field conditions. Ammonia is injected to produce the desired NH3/NOxratio. Gases are blended by means of a static mixer, and a honeycomb flow straightener producesa uniform flow distribution. As many as four full-size logs, each measuring up to 1.1 meters, canbe accommodated in a series arrangement. Sampling ports are located at the inlet and outlet ofthe reactor and between each sample layer. Additional information is provided elsewhere.12
The micro reactor is a small-scale glass tubular vessel that fulfills the same function as the pilotreactor, but for smaller samples of SCR catalyst.
SOURCE OF THE CHROMIUM
From the very beginning, it was believed that the chromium seen to be poisoning the SCRcatalyst is coming from either the reformer tubes or the fins on the coils in the convection section.Literature searches were completed to understand the volatility characteristics of variouschromium species. Initial work focused on chromium trioxide, CrO3, a chromium oxide species

ENV-02-178Page 6
thought to have a sufficiently high vapor pressure to allow vaporization to occur at operatingtemperatures. However, this work suggested that the reformer-tube temperature had to be above1900 °F (1038 °C) to volatilize the amount of chromium observed on the SCR catalyst.Generally, the tubes operate between 1600 and 1700 °F (871 and 927 °C), and the convectioncoils at a lower temperature. And so, this did not seem consistent.
A literature search then uncovered a 1996 paper13 that calculated the different vapor-phasechromium species in equilibrium with solid Cr2O3 as a function of temperature, O2 concentration,and moisture. The authors found that the predominant species in the presenceof water vapor andat the temperatures in question is a chromium oxyhydroxide species, CrO2(OH)2. The volatilityof this species is several orders of magnitude higher than that of CrO3 and easily within the rangeof our operation, both for the reformer tubes as well as for the fins on the convection coils. CrO3
is the predominant species under oxidizing conditions when water vapor is absentfrom theequilibrium mixture, a situation not representative of flue-gas conditions. Other papers in theliterature provide additional information on the vaporization behavior of Cr2O3.14-21
These calculations13 supported the possibility for chromium to be volatile at process conditions.However, we still wanted to know whether the reformer tubes or fins were truly losing chromiumor whether the chromium were bound so tightly that it would not be released. To help answer thisquestion, samples from an HP-50 reformer tube that had been in service for three years weresectioned and analyzed for chromium concentration. A section of stainless steel convection-coilfin was also removed and analyzed. The samples were analyzed using EDS, as indicated.
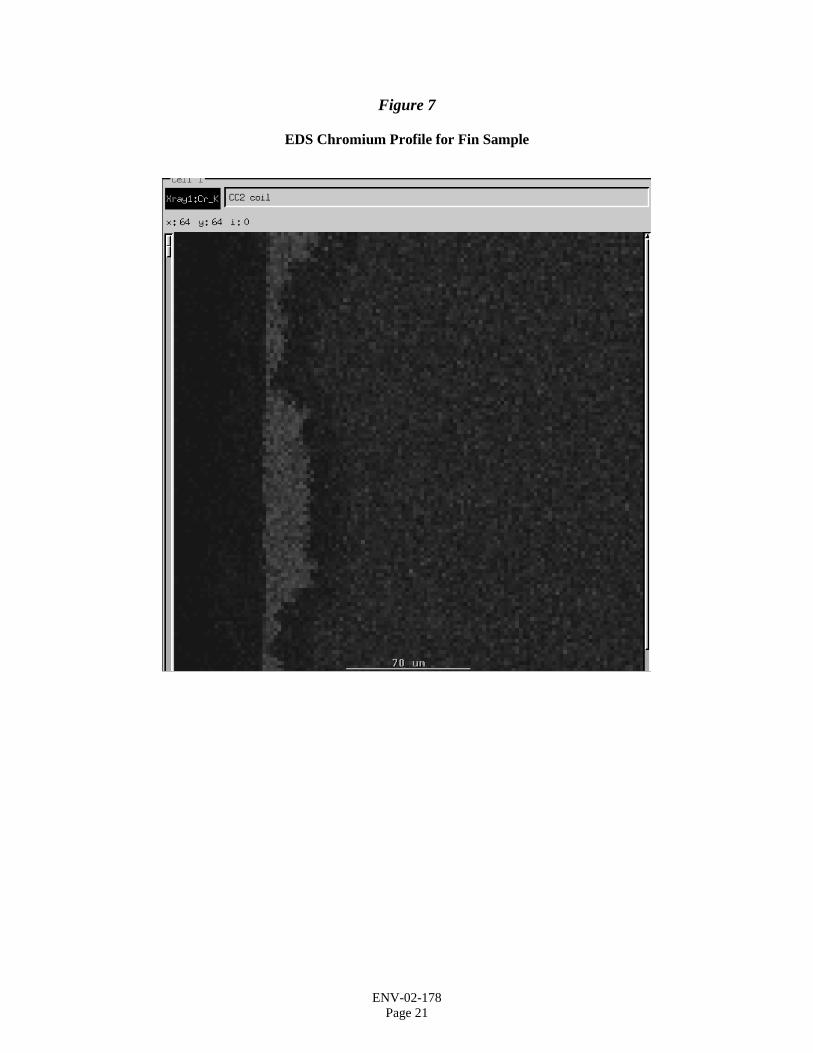
The EDS analysis produces impressive colored pictures based on the individual elements thatmake up the metals. These photographs show the relative concentration of those elements for thefirst several hundred micrometers (microns, µ) of the surface. The chromium pictures clearlydepict the layer of chromium oxide that builds up on all surfaces. There is also a significantchromium-depletion zone. Figure 7 shows the chromium profile for the fin sample; Figure 8 theprofile for the outside of the reformer tube at a point ~ 15 ft (4.6 meters) down the reformer tubein the “hot” part of the furnace.
EDS is able to measure the chromium concentration at various depths. For the fin sample(Figure 7), the chromium-depletion zone is relatively small: The chromium oxide film contains47 % chromium, the chromium-depletion zone 12 % chromium, and the bulk chromium level19 % chromium. A chromium balance was attempted in order to determine whether there is a netloss of chromium, based on the concentrations and depths. It appears that the surface layercontains more chromium than was depleted, suggesting minimal loss to the flue gas, at leastwithin the accuracy of the pictures and measurements.
For the reformer tube (Figure 8), it is clear that there is a substantial chromium-depletion zone(~160-180 µ), as one might expect, based on previous work.23 The measured chromiumconcentration in the chromium-depletion zone was found to be 18 %; the bulk chrome is 26 %.Unfortunately, a chromium concentration was not obtained for the chromium-rich surface layer.Assuming, however, the same chromium concentration as measured for the surface of the fin, thechromium balance indicates a significant loss of chromium to the flue gas. This loss is on theorder of 100 lbs (45.4 kg) total over three years when all the tubes in the reformer furnace areconsidered. This is not a concern for the integrity of the tubes,22 but the loss is consistent with the15-20 lbs/yr ( 6.8-9.1 kg/yr) of chromium buildup seen on the SCR catalyst.

ENV-02-178Page 7
All these numbers are rough, but they do suggest that the chromium which ends up on the SCRcatalyst is coming predominantly from the reformer tubes and, at least for stainless steel fins, thatthe fins are not the major source of chromium on catalyst.
CHROMIUM ON THE SCR CATALYST
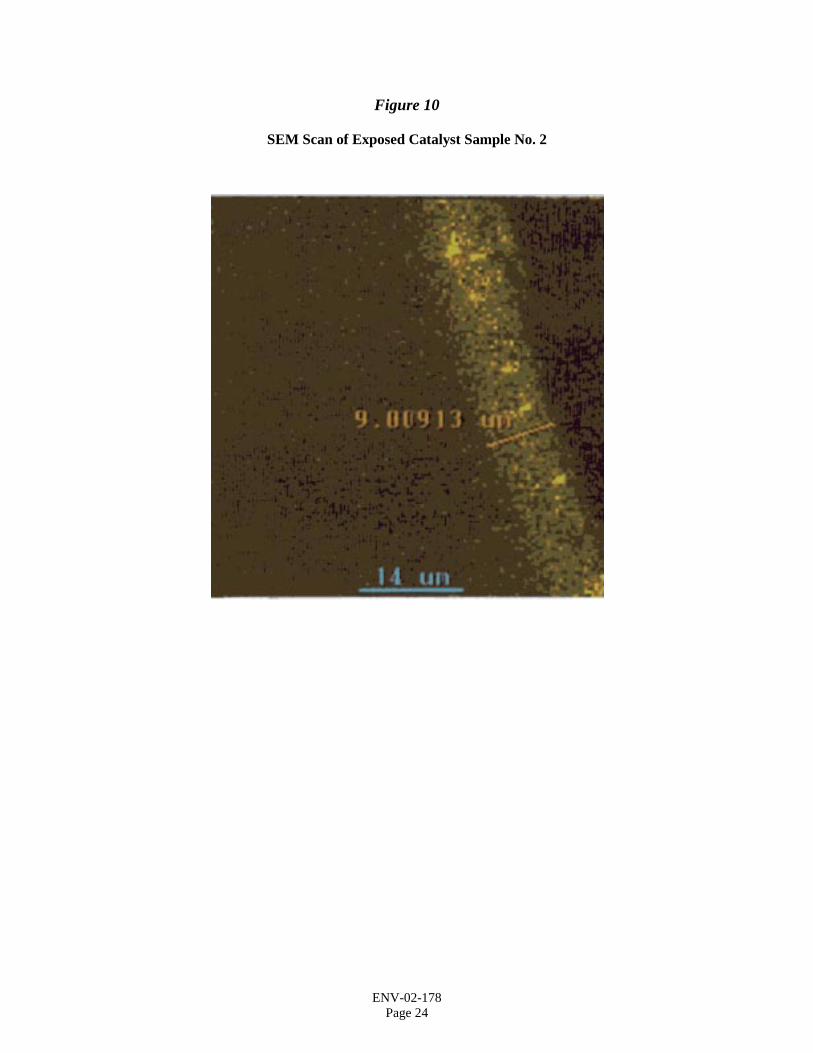
To understand better the mechanism of catalyst deactivation, samples of exposed catalyst wereexamined using the scanning electron microscope (SEM), with a fresh catalyst sample forcomparison. Several samples were prepared from the inlets and outlets of catalyst logs obtainedfrom two different plants. Both plants had been on line for a good number of years, one twice aslong as the other.
It was found that the chromium deposits in the pores on the first 25 microns of the catalystsurface. There was no chromium peak observed beyond this point. The thickness of thechromium layer appears to be dependent on the exposure time to the flue gas and to the totalamount of chromium amount that has been laid down. The chromium layer is thicker for theplant that was on line for the longer period, and the thickness of the chromium layer decreasesfrom the inlet to the outlet of the log consistent with the drop off of chromium concentration thattherefore occurs in the flue gas.
Based on these results, the chromium fills less than 15 % of the pore volume, even for the worstcase to date. This reduces the number of active sites and the diffusion through the catalyststructure, resulting in a significant decrease in catalyst activity compared to that of fresh catalyst.Nevertheless, it is theorized that the flue gas can still migrate through the porous catalyst structureand find active catalyst sites even amidst substantial concentrations of chromium. It continues toappear that the catalyst surface is partially “masked” rather than completely “blinded”. Blindingwould result in verylow activity.
Catalyst scans are shown in Figures 9 and 10. The chromium deposit in the first 10 microns of thecatalyst layer can be observed in both of these pictures. These observations are consistent withthe 20-30 microns for the chromium compound reported on SCR catalyst in ethylene-plantservice.3
HOW IT GETS THERE
Oxidationresistance of stainless steels and many high-temperature nickel-based alloys containingchromium is provided by a protective Cr2O3 surface layer; the Cr2O3 normally formsspontaneously upon exposure to oxidizing conditions at high temperatures.24 For an HP Cr/Nialloy, this oxide is not pure Cr2O3 but consists of a relatively thick layer of Cr2O3 closest to themetal, topped by a thin external layer consisting of a mixed manganese-iron chromate(Mn,Fe)Cr2O4 spinel.23
An oxide such as Cr2O3 undergoes what is termed anoxidative vaporization15,16 at hightemperature and reverts to its original form upon condensation,18,21 a behavior apparently quitecommon.21 The Cr2O3 disproportionates into products like Cr, CrO, CrO2, and molecular andatomic oxygen in the vapor phase in the absence of oxygen from an outside source.19 Whenexternal oxygen is present, as in a flue gas containing excess air, CrO3 is also produced,18,19 andthe equilibrium is shifted among the various oxide species.13-15 With accompanying flue-gas

ENV-02-178Page 8
water vapor in addition to the oxygen, gaseous hydroxides and oxyhydroxides such asCrO2(OH)2, CrO2OH, and CrO(OH)2 are formed as well.13,14,16
Each of the resultant species exerts its own partial pressure, the sum of which might be looselytermed thevapor pressureof Cr2O3. This so-called vapor pressure depends on gas compositionas well as on temperature, and the temperature dependence of the partial pressure for each of theconstituent species in the vapor phase is different. “Vapor pressure” increases by several ordersof magnitude with increasing gas-phase O2 and H2O but shows a much more moderate increasewith temperature.13-16,24
Identification of these intermediate chromium species by direct measurement has provendifficult.24 Instead, calculations requiring thermochemical data for all participating species aretypically performed to predict the distribution of products at such low partial pressures.25 Forexample, thermodynamic calculations at 1200°K (927 °C, 1700°F) for a combustion effluentcontaining 0 % excess O2 and 20 % moisture lead to a “vapor pressure” for Cr2O3 of about 10-9
atmospheres and therefore a concentration of about 1 part per billion (ppb) by volume in a fluegas at atmospheric pressure.14 For flue gas containing 10 % each of O2 and H2O at thistemperature, the resulting effective vapor pressure for Cr2O3 is several orders of magnitudehigher, 2 x 10⁻⁶, or a concentration of 2 parts per million (ppm).14
Therefore, the chromic oxide (Cr2O3) film that forms on the outside surface of thechromium/nickel alloy tubes in the reformer furnace most likely undergoes this oxidativedisproportionation into various chromium hydroxides, oxyhydroxides, and other oxides uponevaporation, the predominant species being the chromium oxyhydroxide, CrO2(OH)2. Theseresulting compounds, it is theorized, then reassemble downstream into Cr2O3 when they condenseon (and mask) the SCR catalyst at its relatively cooler temperature. Additional information iscontained in a previous presention.10
CHROMIUM ON CATALYST AND ACTIVITY LOSS
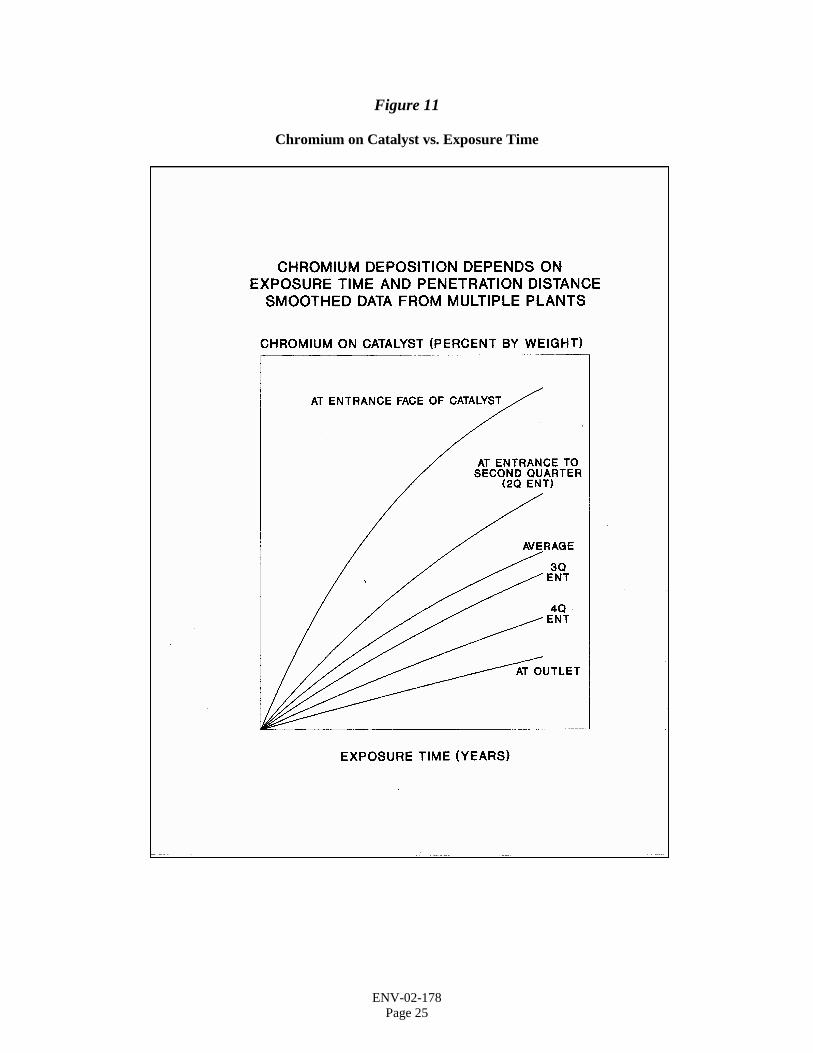
Chromium Concentration vs. Exposure Time. The results from the ICP-OES data obtained forbulk chromium concentration are plotted in Figure 11 versus exposure time, with the axialdistance of the sampling position downstream as parameter. Several curves are shown, one foreach measurement location in the sample log, plus a curve reflecting the average computed forthe entire log. (Refer again to Figure 5 for sample locations and the calculation of the average.)Typically the calculated average falls within the second quarter.
Measured chromium increases proportionally with exposure time until the catalyst surface andpores begin to show some degree of saturation, first at the entrance face and then to a lesserextent at the second measurement position. This causes the curvature observed with increasingexposure time. Over the range of exposure times encountered, the downstream data are stillapproximately linear.
The data for all the curves in Figure 11 have been fitted by a least-squares technique using asingle, well-behaved mathematical function and a factor varying regularly with the distancedownstream from the entrance face. In addition, the asymptote representing saturation wasdetermined statistically by allowing the asymptote to vary in a systematic manner and minimizingthe sum of the squares of the deviations between calculated and measured values for the inletdata. This asymptote was then assumed to be a fundamental property of the catalyst andapplicable to all the curves.
ENV-02-178Page 9
The correlation coefficient (R2) for the curve fits ranges from 90 % to 95 % or more, stronglysuggesting applicability of the model to the chromium adsorption phenomenon that it describes.The mathematical function also behaves correctly at limiting conditions; for example, thechromium concentration at any time approaches zero (the x-axis) with increasing catalyst length.
Chromium vs. Distance from Entrance Face. The curves from Figure 11 are cross-plotted inFigure 12 to show the chromium profile along the length of the catalyst sample, parametric inexposure time. These curves approximate an exponential decay function, whose initial valueincreases with increasing exposure to flue gas. Longer exposure times are characterized by theupper curves in the figure; in the extreme, the model predicts a horizontal line parallel to thex-axis and coincident with the same asymptotic value obtained from the data set in Figure 11.
Catalyst Activity (K/Ko) vs. Chromium. Figure 13 relates catalyst activity (K/Ko) tochromium pickup, regardless of how long it took to attain the observed chromium level. K/Kodata determined for whole catalyst logs in the pilot-test reactor and for cut-up segments run in themicro reactor are plotted in the figure against their average chromium content, along with a singlecorrelating curve. Despite the scatter in the data, this curve of best fit has a correlation coefficient(R2) of 83 %. It starts out at K/Ko = 1.0 for fresh catalyst and traces the activity loss as morechromium is deposited. The x-axis in the figure does not necessarily correspond to K/Ko = 0..Chromium content for the individual segments is calculated as the arithmetic average from thesegment’s inlet and outlet values; average chromium content for the whole logs is calculatedaccording to the trapezoidal rule for areas, as outlined in Figure 5. This method gives an averagethat compares within measurement error to the average computed from a semi-logarithmic fit ofthe data for a given log and is much simpler to calculate. Use of the results from the microreactor allows more data to be considered and also extends the range to higher chromium values.
K/Ko vs. Time. The average chromium determined from Figure 11 as a function of timecombined with the relationship plotted in Figure 13 gives the curve shown in Figure 14. Datapoints from pilot testing are shown in the figure for comparison. Because of the inherent scatterof such data, the composite curve fits as well as a direct empirical fit for data from each plant.Once again, the curve starts out from K/Ko = 1.0 at zero chromium, but the x-axis in the figuredoes not necessarily correspond to K/Ko = 0.
Additional Conclusions to Be Drawn from the Chromium Data. The chromium levelsdepicted in Figures 11 and 12 are common to the many plants studied. They represent worst-caseobservations for the range of tube temperatures noted above and at typical concentrations of O2
and H2O in the flue gas. The flue-gas chromium concentration estimated from pickup by thecatalyst is consistent from plant to plant and in approximate agreement with the evaporation lossof chromium estimated from the examination of the reformer-tube section. This concentration isin the ppb range and apparently less than the equilibrium value.
As indicated by the thermodynamic calculations,13,14 chromium concentration in the flue gas isnot too sensitive to temperature but is more affected by flue-gas oxygen and water vapor. Wehave also found a strong effect of flow on measured chromium. This is consistent with anevaporation model in which the actual chromium being lost from the tubes is less than themaximum possible equilibrium concentration. Other investigators have seen metal loss to varydirectly with gas flow below some critical velocity.26

ENV-02-178Page 10
Chromium species entering the gas phase must also diffuse through a fluid-flow boundary layersurrounding the external surface of the tubes15 and may cause the rate of chromium generation todecrease. Although the curves of Figure 11 predict a gradual lessening in the rate (slope) ofchromium deposition on the catalyst with exposure time, there is no evidence so far to concludethat the rate of chromium being emitted from the tube metal is affected by the service-age of themetal. Such a decrease in chromium production could be caused by a larger chromium-depletionzone. In that case, there would be less chromium to react and a longer path through which thebulk chromium must diffuse to reach and react with flue-gas oxygen. These effects would not befelt if the rate-limiting step were the mass transfer from the reformer tubes to the flue gas at lessthan equilibrium conditions.
COUNTERMEASURES
Short of an unlikely change in tube-metal alloys, countermeasures at the present time all involvesome way to design around the chromium problem by increasing catalyst volume. Optionsinclude installation of a single larger catalyst bed, two (or more) independent stages of catalyst inseries, or a short sacrificial guard-bed. A larger catalyst volume allows operation for a longertime before having to shut down for catalyst replacement.
Multiple stages allow the lead bed to become more completely exhausted before replacementwhile still remaining in compliance with one’s air quality permit. As many as five stages of SCRcatalyst have been reported in ethylene plant service.3 For a two-stage system, the initial firststage (lead bed) is discarded when spent; the second (lag bed) is promoted to the lead position,and fresh catalyst is installed in the lag position.
Experience has shown SCR catalyst itself to be a good guard-bed material, and some work hasbeen done to optimize the properties of the guard-bed catalyst to enhance chromium removal.We have found a catalyst guard-bed to remove over half the reformer flue-gas chromium before itreaches the main bed downstream. This approach works best when the plant is willing/able totake somewhat more frequent shutdowns to allow the necessary replacement of spent guard-bedcatalyst. Every so often, the main bed must also be replaced.
SUMMARY AND CONCLUSIONS
• SCR performance has been observed to deteriorate with catalyst age at a greater thanexpected rate in steam-methane reformers and ethylene plants.
• Loss of catalyst activity has been attributed to deposition of chromium oxide species onthe SCR catalyst surface and in the pores of the catalyst.
• Based on the evidence gathered here, the chromium species appear to originate from thealloy tubes in contact with the hot flue gas in the reformer furnace.

ENV-02-178Page 11
• Suggested mechanism is spontaneous formation of Cr2O3 on the tubes at hightemperature followed by oxidative vaporization into a host of decomposition products.
• The vaporization equilibrium is more affected by O2 and water vapor in the flue gas thanby the reformer-tube temperature.
• Actual mass transfer from the furnace tubes to the flue gas is sensitive to other factors aswell, including flue gas velocity/flow rate and results in less than calculated equilibriumconcentrations.
• According to this theory, the constituent chromium species reassemble into Cr2O3 uponcondensation on the “cooler” surface of the SCR catalyst downstream.
• Adsorption of chromium on the catalyst is proportional to exposure time and is heaviestat the catalyst inlet; the chromium profile at a fixed point in time approximates anexponential decay function.
• Chromium adsorption partially masks rather than completely blinds active catalyst sites,resulting in a gradual (and predictable) decrease in catalyst activity.
• With an understanding of the chromium issue on a fundamental level, it is possible todesign around the problem, institute catalyst management procedures, and achieve longruns before replacement is necessary.
ACKNOWLEDGEMENT
The authors are especially grateful to Mr. George Wensell of Cormetech, Inc. and to Ms. JustineMcFarland of Air Products and Chemicals, Inc. for their assistance in preparing the manuscriptfor presentation.
ENV-02-178Page 12
ABOUT THE AUTHORS
James R. O’Leary is a Senior Engineering Associate for Air Products and Chemicals, Inc. He isresponsible for supporting the hydrogen production facilities, including problem solving andtechnology evaluation and optimization. Areas of special emphasis are the various catalystsystems found in the hydrogen plants.
Jim has worked for Air Products since 1974 in several different technology and R&D functions.He has been supporting the worldwide Hydrogen and Carbon Monoxide (HYCO) plants since1997.
Mr. O’Leary has a BS and MS in Chemical Engineering from Manhattan College.
Robert G. Kunz joined Cormetech, Inc. in April 2001 as Technical Project Manager. Hesupports sales and marketing efforts in the petroleum refining and petrochemical industries byadvising on business development strategy, development of training materials, technical reportwriting, and evaluation of laboratory and field data.
Dr. Kunz has had extensive experience in the petroleum and chemical industries, much of whichhas been focused on environmental control and testing of operating plants for a wide variety ofatmospheric emissions and aqueous discharges. Prior to joining Cormetech, Inc., he was anenvironmental engineering manager at Air Products and Chemicals, Inc., Allentown, PA, andpreviously held engineering positions at Esso Research and Engineering Company, Florham Park,NJ and The M.W. Kellogg Company, New York, NY.
“Dr. Bob” has earned a BChE degree in Chemical Engineering from Manhattan College, a PhD inChemical Engineering from Rensselaer Polytechnic Institute, an MS in EnvironmentalEngineering from Newark College of Engineering, and an MBA from Temple University. He hascontributed numerous publications to the technical literature and is a recipient of the WaterPollution Control Federation’s Harrison Prescott Eddy Medal in recognition of noteworthyresearch in wastewater treatment.
He is a member of the American Institute of Chemical Engineers (AIChE), the AmericanChemical Society (ACS), and the Air & Waste Management Association (A&WMA) and is alicensed professional engineer in Alabama, Louisiana, New Jersey, Pennsylvania, and Texas.
T. Robert von Alten is Manager of Projects at Cormetech, Inc. in Durham, North Carolina.Cormetech engineers and manufactures SCR catalyst for fossil fuel plants and stationarycombustion systems. Mr. von Alten’s SCR project experience ranges from large utility boilerretrofits to small demonstration units.
Before joining Cormetech, Mr. von Alten was a Research Engineer with Energy andEnvironmental Research Corporation, where his work focused on air pollution projects,supporting the USEPA in developing Clean Air Act regulations. Previously, he served as aProcess Engineer with Exxon Chemical Corporation.
Mr. von Alten received his BS degree in Mechanical Engineering from the University of Texas.

ENV-02-178Page 13
Table 1
Summary of Investigation
Literature Searches
Examination of Metallurgical Samples (EDS)• Reformer Tube• Convection Coil Fin
Examination of SCR Catalyst Surface (SEM)• Exposed Samples• Fresh Sample
Analysis of Chromium on SCR Catalyst (ICP-OES)
Catalyst Activity Testing• Pilot Reactor• Micro Reactor
Correlation of Results

ENV-02-178Page 14
Table 2
Air Products and ChemicalsHydrogen Plant Locations
Employing Cormetech SCR Catalyst
PlantLocation
H2 Production(MMSCFD)
CommissioningDate
Source of FurtherInformation
Martinez, CA (I)1
Martinez, CA (II)2
Wilmington, CA
Pasadena, TX
Carson, CA
Port Arthur, TX
25,expanded to
35
90
83
90
96
100
1993
1995
1996
1996
1999
2000
Refs.1, 2, 26, 28, 29
Refs.28-30
Refs.29, 31, 32
Refs.29, 33
Refs.28, 29, 31, 32
Ref.34
Notes:
1. Located at the Ultramar Diamond Shamrock refinery (formerly the Tosco Refining Co.Avon refinery).
2. Located at the Equilon (formerly Shell) refinery in Martinez, CA.

ENV-02-178Page 15
Figure 1
Photograph of Air Products Martinez I Hydrogen Plant

ENV-02-178Page 16
Figure 2

ENV-02-178Page 17
Figure 3
Photograph of SCR Catalyst Samples
Left: Exposed Sample from SMR Service
Right: Fresh Sample

ENV-02-178Page 18
Figure 4
Decline in SCR Catalyst Activity

ENV-02-178Page 19
Figure 5
ENV-02-178Page 20
Figure 6
Pilot Reactor
ENV-02-178Page 21
Figure 7
EDS Chromium Profile for Fin Sample

ENV-02-178Page 22
Figure 8
EDS Chromium Profile for Reformer-Tube Sample

ENV-02-178Page 23
Figure 9
SEM Scan of Exposed Catalyst Sample No. 1
ENV-02-178Page 24
Figure 10
SEM Scan of Exposed Catalyst Sample No. 2
ENV-02-178Page 25
Figure 11
Chromium on Catalyst vs. Exposure Time

ENV-02-178Page 26
Figure 12
Chromium vs. Distance from Entrance Face

ENV-02-178Page 27
Figure 13
Relative Catalyst Activity (K/Ko) vs. Average Chromium

ENV-02-178Page 28
Figure 14
Relative Catalyst Activity (K/Ko) vs. Exposure Time

ENV-02-178Page 29
REFERENCES
1. Kunz, R.G., “SCR Performance on a Hydrogen Reformer Furnace – A Comparison ofInitial and First- and Second-Year Anniversary Emissions Data, Paper No. 96-RA 120.01presented at the 89th Annual Meeting Air & Waste Management Association, Nashville,TN (June 23-28, 1996).
2. Kunz, R.G., “SCR Performance on a Hydrogen Reformer Furnace,Journal of the Air &Waste Management Association, 48, 26-34 (1998).
3. Suwa, A. “Operating Experiences of SCR DeNOx Unit in Idemitsu Ethylene Plant,”Proceedings of the 13th Ethylene Producers’ Conference, Vol. 10, pp.766-773, AmericanInstitute of Chemical Engineers, New York, NY (2001).
4. Funahashi, K., T. Kobayakawa, K. Ishii, and H. Hata, “SCR DeNOx in New MaruzenEthylene Plant,”Proceedings of the 13th Ethylene Producers’ Conference, Vol. 10,pp.741-755, American Institute of Chemical Engineers, New York, NY (2001).
5. Anon., “Special Report: Petrochemical Processes 2001,”Hydrocarbon Processing, 80(3),98-102 (Mar. 2001).
6. Kunz, R. G., D. D. Smith, N. M. Patel, G. P. Thompson, and G. S. Patrick, "Control NOxfrom Gas-Fired Hydrogen Reformer Furnaces," Paper AM-92-56 presented at the 1992NPRA Annual Meeting, New Orleans, LA (March 22-24, 1992).
7. Shahani, G.H., L.J. Garodz, K.J. Murphy, and W.F. Baade, “Hydrogen and Utility SupplyOptimization,” Paper AM-98-60 presented at the 1998 NPRA Annual Meeting, SanFrancisco, CA (March 15-17, 1998).
8. Kunz, R.G., D.D. Smith, N.M. Patel, G.P. Thompson, and G.S. Patrick, “Control NOxfrom Furnaces,”Hydrocarbon Processing, 71(8), 57-62 (Aug. 1992).
9. Kunz, R.G., D.D. Smith, and E.M. Adamo, “Predict NOx from Gas-Fired Furnaces,”Hydrocarbon Processing, 75(11), 65-79 (Nov. 1996).
10. Kunz, R.G. and T.R. von Alten,” SCR Treatment of Ethylene Furnace Flue Gas(A Steam-Methane Reformer in Disguise),” Paper presented at Institute of Clean AirCompanies (ICAC) Forum ’02, Houston, TX (Feb. 2002).
11. Cormetech, Inc. Environmental Technologies, Product Brochures: “Cormetech SCRCatalysts for Gas-Fired Generators” and “Cormetech SCR Catalysts for Coal-FiredGenerators,” Durham, NC (2002).
12. DiFrancesco, C.E., “Quality Assurance of Catalysts During the Life of SCR SystemsThrough Periodic Laboratory Performance Testing,” Paper presented at ACS Conference,Denver, CO (Apr. 1, 1993).
ENV-02-178Page 30
13. Hilpert, H., D. Das, M. Miller, D.H. Peck, and R. Weiß, “Chromium Vapor Species overSolid Oxide Fuel Cell Interconnect Materials and Their Potential for DegradationProcesses,”Journal of the Electrochemical Society, 143(7), 3642-3647 (1996).
14. Ebbinghaus, B.B., “Thermodynamics of Gas Phase Chromium Species: The ChromiumOxides, the Chromium Oxyhydroxides, and Volatility Calculations in Waste IncinerationProcesses,”Combustion and Flame, (93), 119-137 (1993).
15. Stearns, C.A., F.J. Kohl, and G.C. Fryburg, “Oxidative Vaporization Kinetics of Cr2O3 inOxygen from 1000° to 1300 °C,” Journal of the Electrochemical Society, 121(7),945-951 (1974).
16. Fryburg, G.C., F.J. Kohl, and C.A. Stearns, “Enhanced Oxidative Vaporization of Cr2O3
and Chromium by Oxygen Atoms,”Journal of the Electrochemical Society, 121(7), 952-959 (1974).
17. Caplan, D. and M. Cohen, “High Temperature Oxidation of Some Iron-ChromiumAlloys,” Journal of Metals, 4(10), 1057-1065 (1952).
18. Caplan, D. and M. Cohen, “The Volatilization of Chromium Oxide,”Journal of theElectrochemical Society, 108(5), 438-442 (1961).
19. Grimley, R.T., R.P. Burns, and M.G. Inghram, “Thermodynamics of the Vaporization ofCr2O3: Dissociation Energies of CrO, CrO2, and CrO3,” Journal of Chemical Physics,34(2), 664-667 (1961).
20. Chizhikov, D.M., Yu.V. Tsvetkov, E.K. Kazenas, and V.K. Tagirov, “VapourComposition and Pressure of Chromic Oxide by Mass Spectrometry,”Russian Journal ofPhysical Chemistry,” 46(3), 468 (1972).
21. Porter, R.F., “High Temperature Vapor Species,” Chapter 3 in “High-TemperatureMaterials and Technology,” edited by I.E. Campbell and E.M. Sherwood, pp.56-77,Wiley, New York (1967).
22. Patel, N.M., Response to Question 2 (regarding longevity of steam-methane reformertubes, preferred metallurgy, and maximum design pressure recommended for the neweralloys like HP-50 modified) in Section III A Hydrogen Production/HydrogenManufacturing in 1993 NPRA Question & Answer Session on Refining andPetrochemical Technology, p. 86, transcript published by Gerald L. Farrar & Associates,Inc. (Gerald L. Farrar, editor), Tulsa, OK.
23. Steurbratt, C., H.J. Grabke, D. Stobbe, F.R. van Buren, S.J. Korf, and J. Defrancq,“Kinetic Studies of Coke Formation and Removal on HP40 in Cycled Atmospheres atHigh Temperatures,”Materials and Corrosion, 49, 352-359 (1998).
24. Bailey, J., “Volatile Cr Contamination Reduction in Atmospheric Pressure ChemicalVapor Deposition Systems by Selective Alloy Oxidation,”Journal of theElectrochemical Society, 144(10), 3568-3571 (1997).
25. Zaplatynsky, I., “Volatilization of Oxides During Oxidation of Some Superalloys at1200°C,” Oxidation of Metals, 11(6) 289-305 (1977).
ENV-02-178Page 31
26. Wilms, G.R. and T.W. Rea, “Loss of Metal from Chromium at Elevated Temperatures inAir,” Journal of the Less-Common Metals, 1(5), 411-412 (1959).
27. Patel, N.M., R.A. Davis, N. Eaton, D.L. Carlson, F. Kessler, and V. Khurana, “‘Across-the-Fence’ Hydrogen Plant Starts up at California Refinery,”Oil & Gas Journal, 92(40),54-61 (Oct. 3, 1994).
28. Air Products and Chemicals, Inc. -- Press Room, “Plant Photo Library” (undated),available at http://www.airproducts.com/restricted/photo-plant.asp on the Air Productsweb site.
29. Air Products and Chemicals, Inc. – Chemicals and Processing Industry, “Hydrogen andHYCO Plant Experience” (1998), available at the following address on the Air Productsweb site, http://www.airproducts.com/cpi/hyco.htm.
30. Kramer, K.A., N. M. Patel, S. Sekhri, and M.G. Brown, "Flexible Hydrogen PlantUtilizing Multiple Refinery Hydrocarbon Streams," Paper AM-96-59 presented at the1996 NPRA Annual Meeting, San Antonio, TX (March 17-19, 1996).
31. Air Products and Chemicals, Inc. – News Release, “Air Products and Ultramar SignHydrogen Agreement: Additional Hydrogen Supply for Ultramar’s Wilmington, Calif.Refinery” (Jan. 16, 2002), available at the following address on the Air Products web site,http://www.airproducts.com/corp/rel/02023.asp.
32. Anon., “Air Products and Ultramar Sign Hydrogen Agreement; Additional HydrogenSupply for Ultramar’s Wilmington, Calif. Refinery,”Morningstar – PR Newswire(Jan. 16, 2002). This news item is available on the Internet at the following address,http://www.news.morningstar.com/news/PR/M01/D16/1011195074954.html.
33. Anon.,Hydrocarbon Processing, 79(12), cover and p.3 (Dec. 2000).
34. Air Products and Chemicals, Inc. – News Release, “Air Products’ New Port Arthur,Texas Hydrogen Plant Is Onstream: Facility to Supply Premcor Oil Refinery”(June 26, 2001), available on the Air Products web site, http://www.airproducts.com.