natural durability of timber exposed above ground – a survey
TRANSCRIPT

.... Brischke, Meyer, Alfredsen, Humar, Francis, Flæte, Larsson-Brelid: Natural Durability...
DRVNA INDUSTRIJA 64 (2) 113-129 (2013) 113
Christian Brischke1, Linda Meyer1, Gry Alfredsen2, Miha Humar3, Lesley Francis4, Per-Otto Flæte5, Pia Larsson-Brelid 6
Natural Durability of Timber Exposed Above Ground – a SurveyPrirodna trajnost drva izloženoga iznad zemlje – pregled istraživanja
Review paper • Pregledni radReceived – prispjelo: 16. 5. 2012.Accepted – prihvaćeno: 15. 2. 2013.UDK: 630*841.526doi:10.5552/drind.2013.1221
ABSTRACT • Besides its inherent resistance against degrading organisms, the durability of timber is infl uenced by design details and climatic conditions, making it diffi cult to treat wood durability as an absolute value. Dura-bility classifi cation is, therefore, based on comparing performance indicators between the timber in question and a reference timber. These relative values are grouped and related to durability classes, which can refer to a high range of service-lives. The insuffi cient comparability of such durability records has turned out to be a key chal-lenge for service-life prediction.This paper reviewed literature data, based on service-life measures, not masked by a durability classifi cation. It focused on natural durability of timber tested in the fi eld above-ground. Additionally, results from ongoing above-ground durability studies in Europe and Australia are presented and have been used for further analysis. In total, 163 durability recordings from 31 different test sites worldwide based on ten different test methods have been con-sidered for calculation of resistance factors. The datasets were heterogeneous in quality and quantity; the resulting resistance factors suffered from high variation. In conclusion, an open platform for scientifi c exchange is needed to increase the amount of available service-life related data.
Keywords: durability classes, fi eld tests, resistance factor, service life prediction, test methodology, use class 3
SAŽETAK • Osim otpornosti drva prema štetnim organizmima, na prirodnu trajnost drva utječe i dizajn detalja na proizvodima od drva te klimatski uvjeti, pa je teško razmatrati svojstvo trajnosti drva kao apsolutnu vrijednost. Stoga je klasifi kacija trajnosti drva utemeljena na usporedbi pokazatelja izgleda drva, čija se trajnost određuje prema izgledu referentne drvne građe. Te su relativne vrijednosti grupirane i povezane s klasama trajnosti, što se može odnositi na veliki raspon životnog vijeka drvnih proizvoda. Nedovoljna usporedivost takvih zapisa trajnosti pokazala se kao ključni izazov za predviđanje životnog vijeka drvnih proizvoda.U radu se daje pregled literaturnih podataka utemeljenih na životnom vijeku drvnih proizvoda koji nisu maskirani klasifi kacijom trajnosti. Naglasak je na prirodnoj trajnosti drva ispitanoj pri izloženosti drva iznad zemlje. Osim toga, prezentirani su rezultati aktualnih istraživanja prirodne trajnosti drva iznad zemlje u Europi i Australiji te su
1 Author is professor at Leibniz University Hannover, Faculty of Architecture and Landscape Science, Institute of Vocational Sciences in the Building Trade (IBW), Hannover, Germany. 2Author is researcher at Norwegian Forest and Landscape Institute, Ås, Norway. 3Author is professor at University of Ljubljana, Biotechnical Faculty, Department of Wood Science and Technology, Ljubljana, Slovenia. 4Author is professor at Faculty of Horticulture and Forestry Science, Department of Employment Economic Development and Innovation, Ecosciences Precinct, Brisbane, Australia. 5Author is researcher at Norwegian Institute of Wood Technology, Oslo, Norway. 6Author is researcher at SP Technical Research Institute of Sweden, Department of Wood Technology, Borås, Sweden.
1 Autor je profesor aSveučilištu Leibniz u Hannoveru, Fakulteta arhitekture i krajobraznih znanosti, Institut za strukovne znanosti u građevinarstvu (IBW), Hannover, Njemačka. 2Autor je istraživač u Norveškome šumarskom i krajobraznom institutu, Norveška. 3Autor je profesor Sveučilišta u Ljubljani, Biotehnički fakultet, Odjel za znanost i tehnologiju drva, Ljubljana, Slovenija. 4Autor je profesor Fakulteta hortikulture i šumarstva, Zavod za zapošljavanje, ekonomski razvoj i inovacije, Brisbane, Australija. 5Autor je istraživač na Norveškom in-stitutu drvne tehnologije, Oslo, Norveška. 6Autor je istraživač u Tehničkom institutu Švedske, Odjel za drvnu tehnologiju, Borås, Švedska.

Brischke, Meyer, Alfredsen, Humar, Francis, Flæte, Larsson-Brelid: Natural Durability... ....
114 DRVNA INDUSTRIJA 64 (2) 113-129 (2013)
iskorišteni za daljnju analizu. U obzir za izračun faktora otpornosti uzeta su ukupno 163 podatka o trajnosti drva dobivena s 31 različitoga ispitnog mjesta u svijetu na temelju deset različitih metoda ispitivanja uzeti . Skupovi podataka su heterogeni s obzirom na kvalitetu i količinu, što je rezultiralo velikom varijacijom čimbenika otpor-nosti. Zaključno, potrebna je otvorena platforma za znanstvene razmjene kako bi se povećala količina dostupnih podataka o životnom vijeku proizvoda.
Ključne riječi: klase trajnosti, terenska ispitivanja, faktor otpornosti, predviđanje životnog vijeka, metodologija ispitivanja, uporabna klasa 3
1 INTRODUCTION1. UVOD
The natural durability of timber products is infl u-enced by the interaction of wood properties, environmen-tal conditions and structural design. Wood anatomy and the presence of natural protective chemicals (extractives) provide resistance against biodeterioration by microor-ganisms and insects. Communities of wood-destroying organisms vary between different locations, and their ac-tivity is infl uenced by climatic factors. Fungal decay and termite attack, for example, are generally more severe in warm and humid environs (Scheffer, 1971; Brischke, 2007; MacKenzie et al., 2007; Thelandersson et al., 2011). The extent to which timber components are af-fected by biodeterioration and weathering is also medi-ated by the design and maintenance of timber structures; for instance, the position of different structural elements and use of surface coatings alter their rates of wetting and drying, while untreated joinery and cracks in poorly maintained timber coatings may trap water and thus sup-port decay (Norton and Francis, 2008).
Worldwide building codes and standards have traditionally provided natural durability information in a prescriptive context. Timber species are generally categorized into heartwood durability classes and the allowable uses of timbers belonging to those durability classes are prescribed (Stirling, 2009). Criteria for nat-ural durability classifi cation differ between countries and include combinations of fi eld test data, laboratory test data, history of performance and expert experience (CEN, 1994; CEN, 2006; Standards Australia, 2008).
Many different fi eld and laboratory tests are used to measure natural durability. These include standard-ized and non-standardized methods, among which test environments, confi gurations and evaluation methods vary widely (Gobakken and Viitanen, 2004; Råberg et al.; 2005; Stirling, 2009; Fredriksson, 2010). Tests that present a high biodeterioration hazard often involve soil contact or inoculation with microorganisms or insects. Above ground fi eld tests generally pose a lower biodete-rioration hazard, but most test confi gurations are de-signed to accelerate decay by various moisture trapping elements. Durability evaluation procedures for fi eld tests commonly involve objective or subjective measures of strength loss, while mass loss is commonly measured for laboratory tests. Traditionally, fi eld test results are re-ported in a variety of ways, including mean or median measures of specimen service life or arbitrary scores that represent levels of biodeterioration. The performance of test species is commonly compared with the ones of non-durable reference species such as the sapwood of Scots pine (Pinus sylvestris L.) or southern yellow pine (Pinus spp.) for softwoods and common beech (Fagus
sylvatica L.) wood for hardwoods. Beyond the relative performance of specimens in the circumstances of each test, however, the practical implications of durability test data are only beginning to be explored. Willeitner and Peek (1997) highlighted that comparing different dura-bility tests is diffi cult, as in addition to the heterogeneity of test methodology, one may face results that are mostly codifi ed - sometimes in a cryptic way - or even incom-pletely published.
A major challenge remains to extract information from durability tests to help quantify the key factors that affect natural durability and integrate this informa-tion so that it is useful for predicting the service life of timber building products. Modern performance-based construction criteria require building products to be characterized in terms of the reliability that they will perform as expected over time. For timber, the current level of understanding of durability is far less devel-oped than for other properties such as structural and fi re safety performance, and continued research is re-quired to develop robust service life models (Foliente, 2000). Reliable service life data are also of crucial im-portance for Life Cycle Assessment (LCA) studies that are used to compare the environmental impacts of wood competing building materials.
Timber performance models have been devel-oped that incorporate climate, durability classifi cation and design factors (Wang et al., 2008b; Viitanen et al., 2010; Brischke and Frühwald Hansson, 2011; Theland-ersson et al., 2011), however more data are sought for calibration and fi ne tuning. As an alternative to using durability class categories to represent wood properties in design guides (MacKenzie et al., 2007), the use of a resistance index and resistance classes has been pro-posed (Thelandersson et al., 2011). Incorporation of ‘durability factors’ into a factor method has also been suggested (Dickinson, 2005; ISO 15 686-1, 2000).
Despite the importance of above ground struc-tures in timber engineering, reports of natural durabil-ity studies involving above-ground exposures are rela-tively rare. Numerous laboratory decay tests have been reported, but their relationship with timber perform-ance in service appears limited (Da Costa, 1979; Van Acker et al., 1999). Publications containing in ground ‘graveyard’ test data are more readily available, but their usefulness for service life modeling of above ground structures is unclear. The need for above ground durability to support performance modeling was more recently recognized, but due to their long duration, many above ground tests are incomplete and yet to be published. Above ground test results are likely to be most heterogeneous as they take a long time to com-plete and a wider range of standardized and non stand-ardized methods may be used.

.... Brischke, Meyer, Alfredsen, Humar, Francis, Flæte, Larsson-Brelid: Natural Durability...
DRVNA INDUSTRIJA 64 (2) 113-129 (2013) 115
The aims of this review paper were to: (1) survey above-ground natural durability test data from pub-lished and ongoing fi eld studies; (2) examine the use-fulness of data obtained for service life prediction; and (3) compute resistance factors and consider their impli-cations for understanding the effects of differences be-tween fi eld test sites and methods.
2 MATERIALS AND METHODS2. MATERIJAL I METODE
2.1 Literature survey on above ground durability test data
2.1. Pregled literature o ispitivanjima trajnosti drva iznad zemlje
Relevant literature was reviewed concerning the natural durability of timber species determined in fi eld tests above ground. Modifi ed and preservative treated timber was not considered as this would be unmanage-able, due to increased amount of data and different test-ing approaches compared to non-treated timbers. Two a priori criteria for articles or data inclusion were set: (1) published in a peer reviewed journal, printed con-ference proceedings, international standard, project re-
port or PhD thesis; (2) a focus on natural durability, fi eld testing or service life.
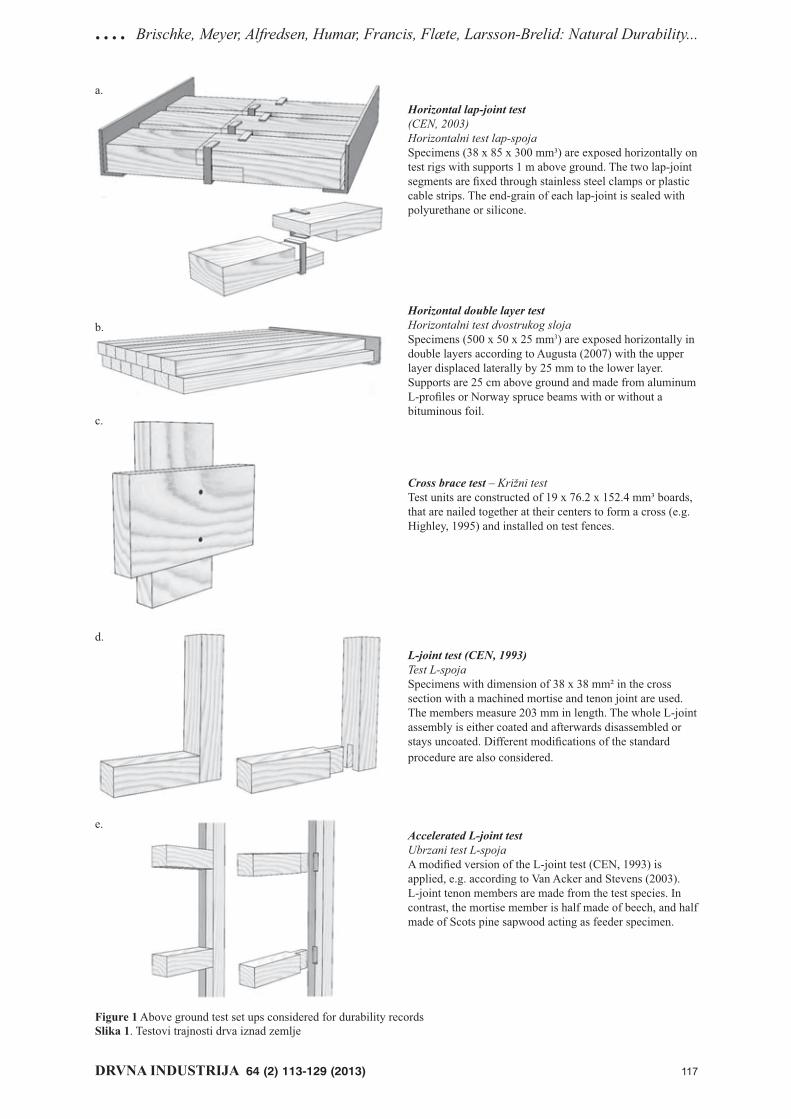
The reference lists in the articles found and pub-lication lists from durability researchers worldwide were checked for additional articles. The studies which met the a priori criteria used only four different test methods: the horizontal lap-joint test (CEN, 2003; Pal-anti et al., 2011); the horizontal double layer test (Au-gusta, 2007; Brischke et al., 2009); the cross brace test (Eslyn et al., 1985; Highley, 1995); and the accelerated L-joint test (Van Acker and Stevens, 2003). The princi-pal confi gurations of these methods are illustrated in Figure 1. In most cases, there were minor variations in the basic set up for each test method between different studies, for instance in terms of shading, distance to ground, test rig size and material. Untreated control specimens included in tests of treated timber were in-cluded if necessary and appropriate. 2.2 Above ground fi eld tests2.2. Testovi trajnosti drva iznad zemlje
In addition to published information, data from ongoing tests, which had not been published to date but were accessible to the authors, were included (Tab. 1).
Table 1 Above ground fi eld trials and corresponding literature sources considered for service life related data (Test ID and abbreviations refer to data in Tab. 7 and 8)Tablica 1. Ispitivanja trajnosti drva iznad zemlje i odgovarajući literaturni izvor za podatke o njegovu životnom vijeku (ID testa i kratice odnose se na podatke u tablicama 7 i 8)
ID Test methodMetoda ispitivanja
Abbr.Kratica
Durability measureMjera trajnosti
Reference speciesReferentna vrsta
ReferenceReferenca
1 Lap-joint test LpJ SLmean Scots pine sapwood Original data2 Lap-joint test LpJ v5years Scots pine sapwood Palanti et al. 20113 L-joint coated LJc v21years Radiata pine sapwood Original data4 L-joint uncoated LJu v21years Radiata pine sapwood Original data5 Accelerated L-joint test ALJ vML, 4 years Scots pine sapwood Van Acker & Stevens 20036 Cross brace test CB SLmedian SYP sapwood1 Highley 19957 Cross brace test CB SLmedian SYP sapwood1 Highley 1995, Eslyn et al. 19858 Double layer DL v6years Scots pine sapwood Original data9 Double layer DL v8years Scots pine sapwood Original data10 Double layer DL v9years Scots pine sapwood Original data11 Double layer DL v7years Scots pine sapwood Brischke et al. 200912 Double layer DL SLmean Scots pine sapwood Original data13 Double layer DL SLmedian Scots pine sapwood Original data14 Double layer DL v6years Scots pine sapwood Original data15 Double layer DL v7years Scots pine sapwood Original data16 Double layer DL v8years Scots pine sapwood Original data17 Double layer DL SL5th percentile Scots pine sapwood Rapp et al. 201018 Double layer DL SL25th percentile Scots pine sapwood Rapp et al. 201019 Double layer DL v7years Scots pine sapwood Rapp et al. 201020 Multi layer, bottom MLb v10years Scots pine sapwood Original data21 Multi layer, upper MLu v10years Scots pine sapwood Original data22 Bundle test A BuA v4years Scots pine sapwood Original data23 Bundle test B BuB v4years Scots pine sapwood Original data24 Bundle test C BuC v4years Scots pine sapwood Original data25 Bundle test D BuD v4years Scots pine sapwood Original data
1SYP = Southern Yellow Pine

Brischke, Meyer, Alfredsen, Humar, Francis, Flæte, Larsson-Brelid: Natural Durability... ....
116 DRVNA INDUSTRIJA 64 (2) 113-129 (2013)
L-joint tests in AustraliaTestovi L-spoja u Australiji
Above-ground durability L-joint tests were es-tablished in 1987 at different exposure sites in Austral-ia (Francis and Norton 2005, Francis et al. 2007, Wang et al. 2008a). Eight untreated wood species were ex-posed at 10 fi eld test sites throughout eastern Australia, while an additional 19 untreated wood species were set out at the Beerburrum test site, 65 km north of Bris-bane (Tab. 2 and 3).
L-joint test units were constructed according to Fig. 1d using timber 35 x 35 mm² in cross section. Half of the specimens for each species were painted. Each joint was pulled apart after painting to completely break the paint fi lm along the frame of the joint and therefore create a uniformly high decay hazard by al-lowing moisture to enter and remain in the joint and under the broken paint. The 35 x 35 mm² faces at the distal ends of the joint components were sealed with bituminous tape.
At each site L-joints were placed on exposure racks that were constructed using CCA treated ply-wood and durable framing timbers that are resistant to insect attack. Plastic strips and brackets were fi xed to the racks to support L-joints and prevent them from coming into direct contact with each other or the ply-wood. At all locations the racks were faced north, and they were constructed the way that L-joints placed on them were oriented 10° backward from vertical to channel moisture toward the joint.
Assessment of the specimens was undertaken af-ter 3, 5, 7, 9, 11, 16, 19 and 21 years of exposure. Only the 35 x 35 x 11 mm3 face of the tenon part of each joint - the component most susceptible to decay - was as-sessed. The depth and distribution of decay was de-tected using the pick test, which involves fi rm probing using a small knife. Decay scores were assigned be-tween 0 (sound, resistant to probing and no apparent loss of structural integrity) and 4 (failure, severe decay through the 11 x 35 mm2 tenon part of an L-joint) ac-cording to Carey et al. (1981).
Table 2 Mean decay rating according to EN 252 (CEN 1989) of specimens exposed in horizontal L-joint tests after 21 years of exposure in Beerburrum, Australia.Tablica 2. Prosječna ocjena trulosti uzoraka izloženih testu horizontalnog L-spoja prema EN 252 (CEN 1989) nakon 21 godine izlaganja u Beerburrumu, Australija
Wood speciesVrsta drva
Botanical nameBotanički naziv
Mean decay rating [0-4]Prosječna ocjena trulosti [0-4]
unpainted / neobojen painted / obojenJohnstone River hardwood Backhousia bancroftii 1.2 3.7Rose alder Caldcluvia australiensis 3.7 4.0Northern silky oak Cardwellia sublimis 4.0 3.8Spotted gum Corymbia citriodora1 2.5 3.5Kapur Dryobalanops spp. 1.6 3.1Kamamere Eucalyptus deglupta 3.3 3.7Alpine ash Eucalyptus delegatensis 3.8 3.8Grey ironbark Eucalyptus drepanophylla 0.8 2.9Rose gum Eucalyptus grandis 2.2 3.0Messmate Eucalyptus obliqua 3.7 3.6Black butt Eucalyptus pilularis 2.3 2.9Mountain ash Eucalyptus regnans 4.0 3.8Red mahogany Eucalyptus resinifera 1.1 2.7Sydney blue gum Eucalyptus saligna 2.3 2.8Forest red gum Eucalyptus teretticorni 1.2 2.6Queensland maple Flindersia brayleyana 3.7 4.0Brush box Lophostemon confertus 2.3 3.0Fishtail silky oak Neorites kevedianus 1.5 3.3Light red meranti Shorea spp. 3.9 4.0Red balau Shorea spp. 0.7 2.9White Eungella satinash Syzygium wesas 1.9 3.1Hoop pine Araucaria cunninghammii 4.0 3.4Black cypress Callitris endlichrei 4.0 4.0White cypress Callitris glaucophylla 1.8 2.2White cypress sapwood Callitris glaucophylla 4.0 4.0Carribean pine Pinus caribaea 3.6 3.8Slash pine Pinus elliottii 3.9 3.9Radiata pine Pinus radiata 4.0 3.9Douglas fi r Pseudotsuga menziesii 3.9 3.9Western Red Cedar Thuja plicata 4.0 3.3
1 Corymbia citriodora subsp. variegata
.... Brischke, Meyer, Alfredsen, Humar, Francis, Flæte, Larsson-Brelid: Natural Durability...
DRVNA INDUSTRIJA 64 (2) 113-129 (2013) 117
Horizontal lap-joint test(CEN, 2003)Horizontalni test lap-spojaSpecimens (38 x 85 x 300 mm³) are exposed horizontally on test rigs with supports 1 m above ground. The two lap-joint segments are fi xed through stainless steel clamps or plastic cable strips. The end-grain of each lap-joint is sealed with polyurethane or silicone.
Horizontal double layer testHorizontalni test dvostrukog slojaSpecimens (500 x 50 x 25 mm3) are exposed horizontally in double layers according to Augusta (2007) with the upper layer displaced laterally by 25 mm to the lower layer. Supports are 25 cm above ground and made from aluminum L-profi les or Norway spruce beams with or without a bituminous foil.
Cross brace test – Križni testTest units are constructed of 19 x 76.2 x 152.4 mm³ boards, that are nailed together at their centers to form a cross (e.g. Highley, 1995) and installed on test fences.
L-joint test (CEN, 1993)Test L-spojaSpecimens with dimension of 38 x 38 mm² in the cross section with a machined mortise and tenon joint are used. The members measure 203 mm in length. The whole L-joint assembly is either coated and afterwards disassembled or stays uncoated. Different modifi cations of the standard procedure are also considered.
Accelerated L-joint testUbrzani test L-spojaA modifi ed version of the L-joint test (CEN, 1993) is applied, e.g. according to Van Acker and Stevens (2003). L-joint tenon members are made from the test species. In contrast, the mortise member is half made of beech, and half made of Scots pine sapwood acting as feeder specimen.
Figure 1 Above ground test set ups considered for durability recordsSlika 1. Testovi trajnosti drva iznad zemlje
a.
b.
c.
d.
e.

Brischke, Meyer, Alfredsen, Humar, Francis, Flæte, Larsson-Brelid: Natural Durability... ....
118 DRVNA INDUSTRIJA 64 (2) 113-129 (2013)
Bundle test Type ATest svežnja tipa AEach specimen consists of three segments, which are stakes of 25 x 50 x 500 mm³ and are ex-posed as a bundle.
Bundle test Type BTest svežnja tipa BEach specimen consists of two segments, which are stakes of 25 x 50 x 500 mm³ and are exposed as a bundle.
Bundle test Type CTest svežnja tipa CEach specimen consists of three segments, one bottom stake of 25 x 50 x 500 mm³ and two top stakes of 25 x 50 x 250 mm³, which are exposed as a bundle.
Bundle test Type DTest svežnja tipa DEach specimen consists of two segments, which are stakes of 25 x 50 x 500 mm³ and are exposed as a bundle. The upper specimen has four circular drill holes with a diameter of 20 mm to allow water trapping.
Ground-proximity multiple layer testVišeslojni test u blizini zemljeEach test unit consists of ten specimens of 22 x 95 x 250 mm³, stacked two by two in fi ve crossed layers, bottom layer on the ground, e.g. according to Edlund (2004). To avoid weed growth the ground is covered with a geotextile. Either the two upper boards or the two bottom boards are assessed (indicated as ‘upper’ and ‘bottom’).
Figure 1. cont’d: Above ground test set ups considered for durability records.Slika 1. (nastavak). Testovi trajnosti drva iznad zemlje
f.
g.
h.
i.
j.
Horizontal double layer tests in EuropeHorizontalni dvoslojni testovi u Europi
Double layer tests have been performed at 23 dif-ferent European test sites to establish dose-response functions for above ground wood decay with wood moisture content (MC) and temperature. A detailed de-scription of the study and a corresponding dose-re-sponse performance model is given by Brischke and Rapp (2008a, 2008b, 2010).
Specimens made from Scots pine sapwood (Pinus sylvestris L.) and Douglas fi r heartwood (Pseudotsuga menziesii (Mirb.) Franco) were monitored in terms of MC, wood temperature and the progress of fungal decay up to a period of eight years. The specimens (500 x 50 x 25 mm3), according to EN 252 (CEN 1989), were ex-posed horizontally in double layer test rigs (see Fig. 1b) producing a decay risk corresponding to European Use Class 3 (CEN 2006). The upper layer was displaced lat-
erally by 25 mm with respect to the lower layer. The lower layer consisted of seven pine sapwood specimens and six Douglas fi r specimens; the upper layer consisted of six pine sapwood specimens and fi ve Douglas fi r specimens. The whole test set-up formed a closed deck (73 x 65 x 21 cm3). The specimens were evaluated year-ly through a pick-test using a small knife and rating the extent and distribution of decay according to EN 252 (CEN 1989) as: 0 (sound), 1 (slight attack), 2 (moderate attack), 3 (severe attack) or 4 (failure).
Horizontal double layer tests in NorwayHorizontalni dvoslojni testovi u Norveškoj
Horizontal double layer tests (Fig. 1b) were con-ducted with 29 different wood species (Tab. 6) as de-scribed by Evans et al. (2011) and Flæte et al. (2008, 2011). Specimens were exposed at three different loca-tions in Norway: Oslo (exposed in 2002), Bergen and

.... Brischke, Meyer, Alfredsen, Humar, Francis, Flæte, Larsson-Brelid: Natural Durability...
DRVNA INDUSTRIJA 64 (2) 113-129 (2013) 119
Ås (exposed in 2004). In Oslo the test site is on the roof of the Norwegian Institute of Wood Technology, an 8 fl oor building, while the two test sites in Bergen and Ås are on ground level. Test set up and assessment of the specimens were identical with the above described procedure apart from the test rack size, which was larg-er due to a higher number of tested wood species. Sam-ples were evaluated every year.
Lap-joint and ground-proximity multi layer tests in SwedenLap-spoj i prizemni višeslojni testovi u Švedskoj
Horizontal lap-joint tests (Fig. 1a) according to CEN TS 12 037 (CEN 2003) and ground-proximity multi layer tests (Fig. 1j) according to Edlund and Jer-mer (2007) were conducted in Borås, Sweden. Besides different treated timbers, the following untreated con-trol wood species were tested: European larch (Larix decidua Mill.), Siberian larch (Larix sibirica Ledeb.), Norway spruce (Picea abies (L.) H. Karst.), Scots pine (Pinus sylvestris L.), European beech (Fagus sylvatica L.), Aspen (Populus tremula L.), and English oak (Quercus robur L.).
The lap-joint tests were started in 1996 and the specimens were assessed after 5, 8, 10, 12, 13, and 15 years of exposure. The ground-proximity trials were started in 2001 and assessed after 1, 2, 3, 5, and 10 years. Each ground-proximity multi layer test unit consisted of ten specimens, 22 x 95 x 250 mm³, that were stacked two by two in fi ve crossed layers, with the bottom layer on the ground. The assessment of the specimens in the stacks was carried out separately for the bottom and the
Table 3 Mean decay rating according to EN 252 (CEN 1989) of specimens exposed in horizontal painted and unpainted L-joint tests after 21 years of exposure at ten different test sites in Australia.Tablica 3. Prosječna ocjena trulosti obojenih i neobojenih uzoraka izloženih testu horizontalnog L-spoja prema EN 252 (CEN 1989) nakon 21 godine izlaganja na deset različitih mjesta u Australiji
Mean decay rating [0-4] / Prosječna ocjena trulosti [0-4]Beer-
burrumDalby Frank-
stonPennant
HillsRock-
hamptonSouth
JohnstoneToow-oomba
Yarra-lumba
Mount Isa
Towns-ville
Painted / ObojenoNorthern silky oak 3.8 3.7 3.8 3.7 3.7 3.9 3.9 3.6 2.2 3.5Spotted gum 3.5 3.1 2.9 3.8 3.1 3.4 3.1 3.0 0.1 2.7Grey ironbark 2.9 3.1 2.6 3.8 2.9 3.5 2.7 2.6 0.6 2.8Brush box 3.0 3.0 3.2 3.8 3.4 4.0 2.9 3.1 1.6 2.9White cypress 2.2 3.2 3.4 3.7 3.2 4.0 3.1 3.0 2.0 3.3White cypress sapwood 4.0 4.0 4.0 4.0 4.0 4.0 4.0 4.0 2.4 4.0Radiata pine 3.9 4.0 4.0 4.0 4.0 4.0 4.0 3.8 2.9 4.0Douglas fi r 3.9 3.9 4.0 3.9 4.0 4.0 3.9 3.7 2.7 3.9Western red cedar 3.3 2.7 3.8 3.9 3.6 4.0 2.2 2.4 1.4 2.4Unpainted / NeobojenoNorthern silky oak 4.0 3.8 3.9 3.8 3.6 4.0 4.0 3.5 2.7 2.1Spotted gum 2.5 1.5 1.7 2.4 0.8 3.7 0.7 0.3 0.0 0.6Grey ironbark 0.8 1.5 1.2 2.2 1.0 3.5 0.4 1.0 0.6 1.3Brush box 2.3 2.0 1.8 2.6 1.7 3.8 1.6 2.0 1.8 2.2White cypress 1.8 2.9 2.4 3.3 3.6 4.0 3.3 3.0 1.8 3.7White cypress sapwood 4.0 4.0 4.0 4.0 4.0 4.0 4.0 4.0 2.8 4.0Radiata pine 4.0 4.0 4.0 4.0 4.0 4.0 4.0 4.0 2.6 3.9Douglas fi r 3.9 3.9 3.9 4.0 3.9 4.0 4.0 3.8 2.9 3.6Western red cedar 4.0 2.9 3.4 3.8 3.8 4.0 3.9 3.6 1.7 3.4
upper part (Tab. 1) using the pick-test. To avoid weed growth around the stacks, the ground had been covered with a geotextile, permeable for micro-organisms.
Bundle tests in Germany Testovi svežnja u Njemačkoj
Bundle tests of four different types (A-D) after Brischke et al. (2011) were conducted in Northern Ger-many. The specimens were made from Norway spruce as illustrated in Fig. 1f-i and exposed in 2007. After-wards they were evaluated annually by using the pick-test and rating the extent and distribution of decay ac-cording to EN 252 (CEN 1989).
2.3 Durability measures2.3. Mjere trajnosti
Numerous evaluation and assessment procedures were analyzed with respect to their signifi cance and in-formative value for the prediction of service life. The following ranking of preference was applied to the dif-ferent durability assessment measures:1. Mean service life of specimens SLmean (1)2. Median service life of specimens SLmedian (50th
percentile, 2)3. 25th percentile of service life of specimens
SL25th percentile (3)4. Decay rate (after x years) vmean (4)5. 5th percentile of service life of specimens
SL5th percentile (5).
n
SLSL
n
ii
mean
∑= (1)

Brischke, Meyer, Alfredsen, Humar, Francis, Flæte, Larsson-Brelid: Natural Durability... ....
120 DRVNA INDUSTRIJA 64 (2) 113-129 (2013)
12
12 2
12
n
median
n n
SL
SLSL SL
+
+
+
; if n is uneven
(2)
; if n is even
14
14 4
12
n
median
n n
SL
SLSL SL
+
+
+
; if n is uneven
(3)
; if n is even
ntR
n
vv
n
i
n
ii
mean
∑∑== (4)
120
120 20
12
n
median
n n
SL
SLSL SL
+
+
+
; if n is uneven
(5)
; if n is even
Where SLi is the service life of a single specimen (the year when a specimen was recorded to have failed) [y], vi is the decay rate of single specimen [y-1], R is the decay rating (score), t is the exposure time [y], and n is the number of replicate specimens.
Decay rate, as represented by the rate of change in decay rating over time, was considered as less desirable quantity with which to determine resistance factors. Whilst decay does not necessarily proceed at a linear rate, it was necessary to consider it as such for the pur-poses of this study. Different decay rating schemes had been applied, e.g. the fi ve step scales according to EN 252 (CEN, 1989) and EN 330 (CEN, 1993). Alterna-tively, the decay rate was expressed as ‘mass loss rate vML’, when only mass loss, but not decay ratings were available (e.g. Van Acker and Stevens, 2003).
2.4 Resistance factors2.4. Čimbenici otpornosti
To make the different durability measures com-parable, they were related to the respective reference species and resistance factors f were calculated accord-ing to 6 and 7.
speciesreference
speciestestedSL SL
SLf = (6)
speciestested
speciesreferencev v
vf = (7)
Where fSL and fv are resistance factors based on service life and decay rate (after x years), respectively, SL is the service life [y], and v is the decay rate [y-1]. The equation used depended on the durability measure ap-plied for each test: Equation 6 if service life measures were reported or equation 7 if decay ratings were re-corded. Resistance factors were calculated for the six species with most available data: spotted gum (Corym-bia spp.), oak (Quercus robur/petraea), Norway spruce (Picea abies (L.) H. Karst.), Scots pine (Pinus sylvestris L.), Douglas fi r (Pseudotsuga menziesii (Mirb.) Franco), and western red cedar (Thuja plicata Donn ex D. Don).
3 RESULTS AND DISCUSSION3. REZULTATI I RASPRAVA3.1 Ongoing durability studies3.1. Aktualna istraživanja trajnosti
In total, results from six published and fi ve differ-ent ongoing durability studies were considered for this survey. To illustrate the latest state of the ongoing stud-ies, which took place at different locations around the world and made use of seven different tests methods, the mean decay ratings are presented for all timber spe-cies tested (Fig. 2 and Tab. 2 to 6).
0 1 2 3 4
Hinterzarten
Portsmouth
Bühlertal
Reulbach shade
Hamburg shade
Zagreb
Ljubljana
Garston
Hamburg
Freiburg shade
Stuttgart shade
Mean decay rating / srednja ocjena trulosti [0-4]
Scots pine sapwood Douglas fir
Figure 2 Mean decay rating according to EN 252 (CEN, 1989) of Douglas fi r and Scots pine sapwood specimens after 6.5 years exposure in horizontal double layer tests at different locations in Europe.Slika 2. Prosječna ocjena trulosti uzoraka od bjeljike duglazije i bora izloženih horizontalnome dvoslojnom testu prema EN 252 (CEN 1989) nakon 6,5 godina izlaganja na različitim lokacijama u Europi

.... Brischke, Meyer, Alfredsen, Humar, Francis, Flæte, Larsson-Brelid: Natural Durability...
DRVNA INDUSTRIJA 64 (2) 113-129 (2013) 121
Table 4 Mean decay rating according to EN 252 (CEN 1989) of specimens exposed in horizontal lap-joint tests after 12 years of exposure in Borås, Sweden. Tablica 4. Prosječna ocjena trulosti uzoraka izloženih testu horizontalnog lap-spoja prema EN 252 (CEN 1989) nakon 21 godine izlaganja u Boråsu, Švedska
Mean decay rating [0-4] / Prosječna ocjena trulosti [0-4]Scots pine sapwood
(Pinus sylvestris)Scots pine heartwood
(Pinus sylvestris)Norway spruce(Picea abies)
European larch(Larix decidua)
after 5 years 0.4 0.1 0.8 0.3after 8 years 2.7 0.5 3.4 1.5after 10 years 3.7 2.1 3.9 2.3after 12 years 4.0 2.2 4.0 2.5after 13 years - 2.6 - 2.8after 15 years - 2.9 - 3.0
Table 5 Mean decay rating according to EN 252 (CEN 1989) of specimens exposed in ground-proximity multi layer tests after 10 years of exposure in Borås, Sweden.Tablica 5. Prosječna ocjena trulosti uzoraka izloženih prizemnom višeslojnom testu prema EN 252 (CEN 1989) nakon deset godina izlaganja u Boråsu, Švedska
Wood speciesVrsta drva
Botanical nameBotanički naziv
Mean decay rating [0-4] / Prosječna ocjena trulosti [0-4]Bottom part / Donji dio Upper part / Gornji dio
Scots pine sapwood Pinus sylvestris 4.0 4.0Scots pine heartwood Pinus sylvestris 4.0 1.0European larch Larix decidua 3.0 0.5Norway spruce Picea abies 4.0 4.0Beech Fagus sylvatica 2.8 4.0English oak Quercus robur 2.5 0.5Aspen Populus tremula 4.0 3.3
Table 6 Mean decay rating according to EN 252 (CEN 1989) of specimens exposed in horizontal double layer tests after 6 years of exposure at three test locations in Norway.Tablica 6. Prosječna ocjena trulosti uzoraka izloženih horizontalnome dvoslojnom testu prema EN 252 (CEN 1989) nakon šest godina izlaganja na tri različite lokacije u Norveškoj
Wood speciesVrsta drva
Botanical name Botanički naziv
Mean decay rating [0-4] / Prosječna ocjena trulosti [0-4]Oslo Ås Bergen
Norway maple Acer platanoides - 1.5 3.0Lime Tilia cordata - 1.5 3.2Aspen Populus tremula 2.1 1.1 2.2Silver birch / Downy birch Betula pendula / B. pubescens 2.1 1.5 2.0Alder / Grey alder Alnus glutinosa 2.4 1.5 3.5Rowan Sorbus aucuparia - 1.2 2.0Goat willow Salix caprea - 0.5 2.1European oak Quercus spp. 0.5 0.5 1.4Ash Fraxinus excelsior - 0.9 1.7Wych elm Ulmus glabra - 0.5 2.0Beech Fagus sylvatica - 2.0 3.1Cedrela Cedrela spp. 0.0 - -Sitka spruce Picea sitchensis 0.4 1.7 3.0Norway spruce 6 mm rings Picea abies - 2.4 2.1Norway spruce 3 mm rings 2.2 2.1 1.9Norway spruce 1 mm rings - 0.9 1.9Norway spruce standing rings - 1.9 2.4Silver fi r Abies alba - 2.9 2.9Scots pine 3 mm rings Pinus sylvestris 0.2 1.2 1.5Scots pine 1 mm rings 0.0 1.0 1.9Scots pine sapwood 2.4 1.2 2.3Scots pine sapwood + heartwood - 0.6 2.1Western red cedar (N-America) Thuja plicata - 0.2 1.2Western red cedar (Norway) - 1.3 1.4Juniper Juniperus communis - 0.3 0.9Larch (Russia) Larix sibirica 0.4 0.9 1.4Larch (Norway) Larix decidua - 0.3 1.2Douglas fi r (N-America) Pseudotsuga menziesii - 0.2 1.2

Brischke, Meyer, Alfredsen, Humar, Francis, Flæte, Larsson-Brelid: Natural Durability... ....
122 DRVNA INDUSTRIJA 64 (2) 113-129 (2013)
Site characteristics were found to affect the per-formance of particular wood species differently. The mean decay ratings for Douglas fi r heartwood after 6.5 years of exposure in horizontal double layer tests at 11 different locations in Europe is shown in Fig. 2 in order descending severity of decay. The respective ‘non-dura-ble’ reference Scots pine sapwood did not show the same trend for decay severity amongst the 11 test sites. The differing ratio between mean decay rating for Douglas fi r and the reference species was presumably caused by a combination of their respective wood properties and climatic differences between sites. The particular prop-erties of each species, such as moisture permeability and potential for leaching of protective extractives, may cause differences in the effects of climatic conditions, such as rainfall and temperature. Similar observations were made for the horizontal double layer samples ex-posed at three Norwegian test sites (Tab. 6). For instance, the mean decay ratings of grey alder (Alnus glutinosa L.) and Scots pine sapwood were almost the same after 6 years of exposure in Oslo and Ås, whilst the mean decay rating was signifi cantly higher for grey alder in Bergen compared to the Scots pine sapwood reference (Tab. 6). For other species, such as aspen (P. tremula), the ratios between tested timber and reference were nearly the same at all three test locations.
In addition to differences in decay progress be-tween species at climatically different locations, the impact of test methods and test design became appar-ent. As shown in Tab. 5, the ratio of the mean decay ratings for seven wood species differed signifi cantly between the upper and bottom parts of ground-proxim-ity multi layer tests in Borås, Sweden. The higher moisture load and limited potential for re-drying in the bottom parts of the stack diminished the differences between different timbers, which coincides with the reports by Augusta (2007) and Rapp et al. (2010), who compared the decay development of different Europe-an wood species under different exposure conditions above ground. For instance, the good moisture per-formance of the heartwood of European larch (L. de-cidua), Douglas fi r (P. menziesii) or Scots pine (P. syl-vestris) is abolished when permanent wetting is provoked. For further comparative analyses of the dif-ferent above ground trials considered for this survey, resistance factors were considered.
3.2 Resistance factors3.2. Čimbenici otpornosti
The computation of resistance factors allowed the wide range of previous and ongoing tests to be compared, irrespective of test confi gurations and as-sessment methods. We found, however, that the number of durability recordings that were freely accessible from publications and relevant for service life predic-tion was generally sparse. Apart from the fact that above ground durability studies are rare, many of the reported studies contained insuffi ciently detailed re-sults. The condensed format of presenting test results that is often used for publication inhibited the calcula-tion of resistance factors with suffi ciently high statisti-
cal reliability. The signifi cance of this problem can be illustrated by considering the Australian L-joint test, which includes 29 different wood species represented by painted and unpainted specimens installed at vari-ous locations, and the test has been assessed eight times to date. If the results were reported together, there would be 1808 mean scores alone. It is obviously be-yond the scope of one publication to deal with this vol-ume of data, so selected results have been published over time. If only mean scores at a particular time are reported in a single publication, they are not very use-ful to timber engineers researching service life predic-tion, as they attempt to fi nd and compile a complete set of data for analysis (Tab. 2 and 3). Furthermore, repre-sentative measures of durability may need to be trans-formed for analysis, for example from ratings (scores) to service life values, so raw data are required. While it is possible to seek data directly from researchers man-aging durability tests, they may be diffi cult to fi nd. In-dividual publications may not reveal the full extent of an entire durability test when only specifi c elements of data are reported.
Tab. 1 gives an overview of the data regarded for this survey. In total, 163 durability measures from 31 different test sites have been considered for the calcu-lation of resistance factors: 37 for hardwoods and 126 for softwoods. Only three reference species were used to compare the different durability tests: Scots pine sapwood (P. sylvestris), Radiata pine sapwood (Pinus radiata D.Don) and southern yellow pine sapwood (Pi-nus spp.). The resistance factors for six selected wood species, for which most durability records were found, are presented in Tab. 7 and 8. Several of these timbers are commonly used untreated for above ground struc-tures that are exposed to the weather, including oak (Quercus spp.), spotted gum (Corymbia spp.) and west-ern red cedar (T. plicata).
Most of the durability recordings were based on preliminary test results, and consequently, decay rat-ings after 4 to 21 years were used for calculating resist-ance factors. For most species the range of resistance factors was quite high, for example between 0.90 and 4.54 for Douglas fi r (P. menziesii), and in extreme - be-tween 15.88 and 43.03 - for spotted gum (Corymbia spp.). In the case of Douglas fi r this can be translated to durability classes (DC, according to EN 350-1, CEN 1994) between DC 5 (non durable) and DC 2 (durable). This variation and how it can be related to at least three, in some cases even to four or fi ve durability classes, is shown for six selected wood species in Fig. 3. The im-portance of this variation becomes even more obvious when calculating the expected service life: Based on a mean service life of 6.5 years of the Scots pine sap-wood reference (Tab. 8), the service life to be expected for Douglas fi r ranges from 7.4 to 29.5 years. Even more drastic is the range for spotted gum (Corymbia spp.), which is from 18.7 years and 473.3 years. These fi ndings highlight the potential value of service life modeling to greatly increase the accuracy and rele-vance of information available regarding the expected durability of timber used at different locations.

.... Brischke, Meyer, Alfredsen, Humar, Francis, Flæte, Larsson-Brelid: Natural Durability...
DRVNA INDUSTRIJA 64 (2) 113-129 (2013) 123
Table 7 Service life related data from above-ground fi eld tests according to Tab. 1 Hardwoods.Tablica 7. Podaci o životnom vijeku povezani s testovima izloženosti drva iznad zemlje prema tablici 1. za tvrde vrste drva
Wood speciesVrsta drva
Botanical nameBotanički naziv Site / Mjesto Country code
Kod zemljeTest method
MetodaTest ID
Resistance factor
Faktor otporaSLReference
1
Spotted gum Corymbia citriodora
Beerburrum AUS
LJu 4 12.40 5.14 4.62 8.5
LJc 3 7.23 3.73 3.68 5.0
Dalby AUSLJu 4 9.02 6.8LJc 3 7.00 4.1
Frankston AUSLJu 4 7.39 7.4LJc 3 4.24 7.0
Pennant Hills AUSLJu 4 4.87 7.9LJc 3 2.56 7.3
Rockhampton AUSLJu 4 16.34 7.7LJc 3 4.98 5.2
South Johnstone AUSLJu 4 3.49 5.7LJc 3 5.23 5.1
Toowoomba AUSLJu 4 20.69 6.8LJc 3 8.51 3.4
Yarralumla AUSLJu 4 31.61 8.7LJc 3 3.48 7.0
Mount Isa AUSLJu 4 43.03 11.0LJc 3 15.88 11.0
Townsville AUSLJu 4 6.43 5.3LJc 3 2.06 5.0
English oak Quercus robur Hamburg D DL 11 1.56 6.5Hamburg shade D DL 11 1.35 6.1Reulbach D DL 11 1.83 n.a.Stuttgart D DL 11 1.66 n.a.Freiburg D DL 11 1.52 n.a.4 German sites D DL 17 1.70 6.6Ghent B ALJ 5 5.67 n.a.
Borås SMLu 21 4.00 10.0MLb 20 1.33 10.0
European oak Q. robur/ Q. petraea Ås N DL 8 2.50 n.a.Oslo N DL 9 3.00 8.0Bergen N DL 8 1.67 n.a.
1mean value or median (in italics) / srednja vrijednost ili medijan (u kurzivu); n.a. = not available / nije dostupno
Figure 3 Variation of resistance factors of six selected wood species and corresponding durability classes (DC) according to EN 350-1 (CEN, 1994).Slika 3. Varijacija čimbenika otpornosti za šest različitih vrsta drva i odgovarajuće klase trajnosti prema EN 350-1 (CEN, 1994).
0
1
2
3
4
5
6
7
8
9
10
WesternRed Cedar
Douglas fir White cypress European oak Brush box Northernsilky oak
Wood species / vrsta drva
- minimum/maximum x mean value ± s ± 95% confidence interval
x
x
x
x
x
x
5
4
3
2
DC 1
Res
istan
ce fa
ctor
/ fa
ktor
otp
orno
sti

Brischke, Meyer, Alfredsen, Humar, Francis, Flæte, Larsson-Brelid: Natural Durability... ....
124 DRVNA INDUSTRIJA 64 (2) 113-129 (2013)
Table 8 Service life related data from above-ground fi eld tests according to Tab. 1 Softwoods.Tablica 8. Podaci o životnom vijeku povezani s testovima izloženosti drva iznad zemlje prema tablici 1. za meke vrste drva
Wood speciesVrsta drva
Botanical nameBotanički naziv Site / Mjesto
Country code
Kod zemlje
Test methodMetoda
Test ID
Resistance factor
Faktor otporaSLReference
1
Norway spruce heart Picea abies Hamburg D DL 19 0.96 6.5Hamburg shade D DL 19 0.78 6.1Stuttgart D DL 19 0.89 n.a.Freiburg D DL 19 0.75 n.a.
Norway spruce Picea abies Oslo N DL 9 1.19 8.0Hannover D BuA 22 0.82 4.0
BuB 23 0.92 n.aBuC 24 0.96 n.a.BuD 25 1.00 4.0
Borås S LpJ 1 1.00 8.0MLu 21 1.00 10.0MLb 20 1.00 10.0
Ghent B ALJ 5 2.16 n.a.Norway spruce, 6 mm rings
Picea abies Ås N DL 8 0.48 n.a.Bergen N DL 8 1.11 n.a.
Norway spruce, 3 mm rings
Picea abies Ås N DL 8 0.56 n.a.Bergen N DL 8 1.20 n.a.
Norway spruce, 1 mm rings
Picea abies Ås N DL 8 1.36 n.a.Bergen N DL 8 1.25 n.a.
Norway spruce, standing rings
Picea abies Ås N DL 8 1.00 n.a.Bergen N DL 8 0.94 n.a.
Norway spruce sap Picea abies Hamburg D DL 19 0.79 6.5Hamburg shade D DL 19 0.98 6.1Stuttgart D DL 19 0.67 n.a.Freiburg D DL 19 0.45 n.a.
Scots pine Pinus sylvestris 4 German sites D DL 18 1.34 6.6Ghent B ALJ 5 9.31 n.a.Hamburg D DL 10 1.37 6.4Hamburg shade D DL 10 1.18 7.8Borås S LpJ 1 1.25 8.0
MLu 21 4.00 10.0MLb 20 1.00 10.0
Scots pine resinous Pinus sylvestris Borås S MLu 21 4.00 10.0MLb 20 1.14 10.0
Scots pine, slow grown Pinus sylvestris Oslo N DL 9 3.79 8.0Scots pine, normal Pinus sylvestris Oslo N DL 9 3.27 8.0Scots pine, 3 mm rings Pinus sylvestris Ås N DL 8 1.00 n.a.
Bergen N DL 8 1.50 n.a.Scots pine, 1 mm rings Pinus sylvestris Ås N DL 8 1.15 n.a.
Bergen N DL 8 1.25 n.a.Scots pine heart + sap Pinus sylvestris Ås N DL 8 1.07 n.a.
Bergen N DL 8 1.11 n.a.Douglas fi r Pseudotsuga
menziesii4 German sites D DL 18 1.45 6.6Hamburg D DL 12 1.25 6.5Hamburg shade D DL 16 2.14 7.1Hamburg D DL 10 4.17 6.4Hamburg shade D DL 10 2.12 7.8Stuttgart shade D DL 13 1.22 6.0Freiburg shade D DL 13 1.08 7.3Reulbach shade D DL 13 2.50 8.1Hinterzarten D DL 16 3.18 n.a.Bühlertal D DL 16 3.98 7.7Garston GB DL 14 1.63 6.1
1mean value or median (in italics) / srednja vrijednost ili medijan (u kurzivu)2based on estimated median service life / utemeljeno na procjeni medijana životnog vijekan.a. = not available / nije dostupno

.... Brischke, Meyer, Alfredsen, Humar, Francis, Flæte, Larsson-Brelid: Natural Durability...
DRVNA INDUSTRIJA 64 (2) 113-129 (2013) 125
Wood speciesVrsta drva
Botanical nameBotanički naziv Site / Mjesto
Country code
Kod zemlje
Test methodMetoda
Test ID
Resistance factor
Faktor otporaSLReference
1
Portsmouth GB DL 15 4.54 6.0Ljubljana SI DL 16 3.31 3.2Zagreb HR DL 14 3.38 4.3Madison, WI USA CB 6 > 2.312 13.0Starkville, MI USA CB 7 > 2.002 10.0Beerburrum AUS LJu 4 1.74 5.1
LJc 3 1.12 3.7Dalby AUS LJu 4 1.29 6.8
LJc 3 1.28 4.1Frankston AUS LJu 4 1.40 7.4
LJc 3 1.39 7.0Pennant Hills AUS LJu 4 1.34 7.9
LJc 3 1.36 7.3Rockhampton AUS LJu 4 1.20 7.7
LJc 3 1.16 5.2South Johnstone AUS LJu 4 0.96 5.7
LJc 3 1.17 5.1Toowoomba AUS LJu 4 1.14 6.8
LJc 3 1.43 3.4Yarralumla AUS LJu 4 1.33 8.7
LJc 3 1.58 7.0Mount Isa AUS LJu 4 0.90 n.a.
LJc 3 1.79 11.0Townsville AUS LJu 4 1.28 11.0
LJc 3 1.95 5.3Douglas fi r (Norway) Pseudotsuga
menziesiiBergen N DL 8 1.88 n.a.
Douglas fi r (N-America) Pseudotsuga menziesii
Bergen N DL 8 2.31 n.a.
Western Red Cedar Thuja plicata Madison, WI USA CB 6 > 2.302 13.0Beerburrum AUS LJu 4 3.03 5.1
LJc 3 4.53 3.7Dalby AUS LJu 4 3.54 6.8
LJc 3 7.97 4.1Frankston AUS LJu 4 3.04 7.4
LJc 3 2.22 7.0Pennant Hills AUS LJu 4 1.98 7.9
LJc 3 2.06 7.3Rockhampton AUS LJu 4 2.93 7.7
LJc 3 3.59 5.2South Johnstone AUS LJu 4 2.19 5.7
LJc 3 1.97 5.1Toowoomba AUS LJu 4 2.14 6.8
LJc 3 9.48 3.4Yarralumla AUS LJu 4 2.00 8.7
LJc 3 3.68 7.0Mount Isa AUS LJu 4 1.52 n.a.
LJc 3 3.44 11.0Western Red Cedar Thuja plicata Townsville AUS LJu 4 2.23 11.0
LJc 3 6.69 5.3WRC (Norway) Thuja plicata Ås N DL 8 0.88 n.a.
Bergen N DL 8 1.67 n.a.WRC (N-America) Thuja plicata Bergen N DL 8 2.00 n.a.
Table 8 cont’d: Service life related data from above-ground fi eld tests according to Tab. 1 Softwoods.Tablica 8. (nastavak) Podaci o životnom vijeku povezani s testovima izloženosti drva iznad zemlje prema tablici 1. za meke vrste drva
1mean value or median (in italics) / srednja vrijednost ili medijan (u kurzivu)2based on estimated median service life / utemeljeno na procjeni medijana životnog vijekan.a. = not available / nije dostupno

Brischke, Meyer, Alfredsen, Humar, Francis, Flæte, Larsson-Brelid: Natural Durability... ....
126 DRVNA INDUSTRIJA 64 (2) 113-129 (2013)
Although most of the results are still preliminary, they indicate that the resistance factor, and hence the relative durability of different species, is not necessar-ily the same at climatically different places. This is confi rmed by the results for European oak (Quercus robur / Quercus petraea): While the resistance factors for eight German test sites differed only between 1.35 and 1.83, a variation between 1.67 and 3.00 was found for three Norwegian sites. As there were only a few species for which multiple recordings were available, no clear relationship between the test site and resulting relative durability was discernible. Signifi cantly more durability recordings from different sites are needed. As previously discussed, chemical and anatomical properties of different species may infl uence the extent to which they are affected by climate variables, and this topic requires further investigation.
Another example is illustrated in Fig. 4, where the resistance factors of eight wood species determined in L-joint tests have been compared between ten test sites in Australia. Many additional wood species were in-stalled at the Beerburrum site, while only nine wood species were installed at all ten sites. It would be ideal if resistance factors for the nine species tested at all sites could be used to gauge the performance of the addi-tional species at Beerburrum, if they were used at the other locations. No simple relationship between relative resistance factors and test location was observed that represented all species. The higher the resistance factor - and thus the expected service life - the higher was the site-specifi c variation. In extreme, the factors differed between 4 and 32. For those wood species, showing re-sistance factors below 5, which is equivalent to durabil-ity class 2 = ‘durable’ according to EN 350-1 (CEN, 1994), the variation between most of the sites dimin-ished, while differences between sites for the species
with higher resistance factors showed the opposite. The test sites represent a wide range of climatic conditions, and preliminary analysis revealed that there is a strong relationship between climate variables and relative du-rability of each wood species exposed at different loca-tions (Francis and Norton, 2006). The infl uence of the analyzed climate variables differed amongst the eight species. Further research is required to explore the pos-sibility of using resistance factors to predict durability between different locations based on indicating wood species that are selected to represent groups of wood species with similar properties. For example, the resist-ance factors for spotted gum may more accurately pre-dict the service life of dense hardwoods that contain extractives that are highly toxic to decay fungi, while resistance factors for brush box may be used to predict the service life of dense hardwoods that contain moder-ately toxic extractives.
To further examine the potential relationship be-tween the severity of a test site and respective durabil-ity of timber species, resistance factors were correlated with the service life (mean or median) of the reference wood species for all sites at which these data were available. As shown exemplarily for three softwoods and three hardwoods in Fig. 5, no clear relationship was obtained. It leads to the conclusion that other fac-tors than the site-specifi c decay intensity determine the relative resistance, such as climatic peculiarities, dif-ferent decay types, or detoxifying agents.
In addition to potential site-specifi c effects, the test method and especially the durability measure seem to infl uence the resistance factors. While no clear dif-ferences between the use of mean or median service lives on the one hand and decay rates after certain ex-posure times on the other hand were observed, the use of mass loss differences led to signifi cant outliers for
0
5
10
15
20
25
30
35
0 2 4 6 8 10 12 14 16 18 20 22 24
Resistance factor Beerburrum / čimbenik otpornosti Beerburrum
Res
istan
ce fa
ctor
/ fa
ktor
otp
orno
sti
Townsville, R² = 0.374Mount Isa, R² = 0.308Toowoomba, R² = 0.952Dalby, R² = 0.603Frankston, R² = 0.844Pennant Hills, R² = 0.638Rockhampton, R² = 0.712South Johnstone, R² = 0.501Yarralumla, R² = 0.324
Figure 4 Relationship between resistance factors of eight wood species determined in L-joint trials for ten Australian test sites. Dashed line refers to resistance factors determined for Beerburrum (ideal line).Slika 4. Odnos između čimbenika otpornosti za osam vrsta drva određenih testom L-spoja za deset lokacija u Australiji. Isprekidana se linija odnosi na čimbenike otpornosti određene za Beerburrum (idealna linija).

.... Brischke, Meyer, Alfredsen, Humar, Francis, Flæte, Larsson-Brelid: Natural Durability...
DRVNA INDUSTRIJA 64 (2) 113-129 (2013) 127
English oak (Quercus robur), Scots pine and Norway spruce (Picea abies) and the relative effects of durabil-ity measures, therefore, need to be verifi ed.
The infl uence of the test methods on the resulting resistance factors of a certain wood species is super-posed by the effect of climatic conditions. Basically it is the microclimate within a wood specimen that deter-mines the conditions for fungal growth and decay. Con-sequently, the combination of mesoclimate (environ-mental conditions at the test site) and the design of the respective test set up affect the microclimate. This is demonstrated by considering resistance factors calcu-lated for Douglas fi r, which varied as follows: in double layer tests between 1.08 and 4.54, in uncoated L-joint tests between 0.90 and 1.74, in coated L-joint tests be-tween 1.12 and 1.95, and in cross brace tests between 2.00 and 2.13 (Tab. 8). Obviously the variation within one test method was higher compared to the variation between the different test methods, which coincides with the fi ndings of De Groot (1992), who exposed Southern yellow pine sapwood in Mississippi, USA, and in a rain-forest in Panama using 18 different test designs. While he found a signifi cant impact of the test design in the temperate location, differences diminished in the tropi-cal rainforest. Within this study, test data from different test methods at the same test location were available only for a few wood species, so the potential effect of the test confi gurations was not quantifi able.
4 CONCLUSIONS4. ZAKLJUČCI
We do not claim that this literature and data sur-vey on above ground durability tests is complete. This is mainly due to the fact that many studies around the world are known to exist, but respective data are not freely available. The lack of freely available data is
strongly indicated through the fact that 80 % of dura-bility records used for this study was unpublished. Fur-thermore, in many cases information was too con-densed and incomplete, which is inescapable for journal articles, but prevented the data transformation neces-sary to calculate specimen service life measures.
The range of test results observed for each wood species further highlighted that the current timber du-rability classifi cation systems, which assign a species to a durability class irrespective of site and design, are not precise enough for many scientifi c and engineering purposes. Data need to meet a number of requirements in terms of specifi city, background information and formatting.
We conclude that further research into the rela-tive effects of climate on decay progress amongst dif-ferent species is required, and future comparative stud-ies should focus not only on differences between test sites, but also on different test confi gurations at the same location to determine the effects of structural de-sign on timber durability. To facilitate this goal, a suit-able platform is needed to increase the quantity and availability of useful data. Service life related durabil-ity recordings should be shared amongst the scientifi c community to allow the exchange and advancement of knowledge in this fi eld. The value of these durability data is expected to rise through collaborative compara-tive studies and meta analyses.
Similar or even more complex challenges are faced for predicting the service life of modifi ed and preservative treated wooden material because addition-al information of treatment agents and processes are needed. Wood used outdoors is commonly treated with different wood preserving agents and formulations, and fi eld studies on the durability of preservative treat-ed and modifi ed timber include additional parameters, including preservative type, penetration and retention.
0
1
2
3
4
5
6
7
8
9
10
0 2 4 6 8 10 12 14
SL reference / SL referenca, a
Res
istan
ce fa
ctor
/ fa
ktor
otp
orno
sti
Western Red Cedar, R² = 0.405Douglas fir, R² = 0.010White cypress, R² = 0.235European oak, R² = 0.275Brush box, R² = 0.235Northern silky oak, R² = 0.024
Figure 5 Resistance factors of six selected wood species related to the mean or median service life in years of the reference speciesSlika 5. Čimbenici otpornosti za šest vrsta drva u odnosu prema srednjoj vrijednosti ili medijanu životnoga vijeka referentne vrste drva

Brischke, Meyer, Alfredsen, Humar, Francis, Flæte, Larsson-Brelid: Natural Durability... ....
128 DRVNA INDUSTRIJA 64 (2) 113-129 (2013)
For these reasons, a proposal for a ‘Durability Data Base’ has been made to the ‘International Re-search Group on Wood Protection, IRG-WP’ (Brischke et al. 2012). Requirements and feasible formats for du-rability recordings have been suggested for all types of wood products: naturally durable timber, thermally and chemically modifi ed timber, water repellent and pre-servative treated timber as well as for composite prod-ucts. The database shall allow availability of test results from fi eld and laboratory studies dealing with wood-degrading fungi, insects, and marine borers.
Acknowledgements - ZahvaleThe authors would like to express their special
thanks to all colleagues, who have contributed to this study with test data, long-term experience in the fi eld and good advice.
5 REFERENCES5. LITERATURA
1. Augusta, U., 2007: Untersuchung der natürlichen Dauer-haftigkeit wirtschaftlich bedeutender Holzartenbei ver-schiedener Beanspruchung im Außenbereich. Disserta-tion, University of Hamburg.
2. Brischke, C., 2007: Investigation of decay infl uencing factors for service life prediction of exposed wooden components. Dissertation, University of Hamburg.
3. Brischke, C.; Rapp A. O., 2008a: Infl uence of wood moisture content and wood temperature on fungal decay in the fi eld: observations in different micro-climates. Wood Sci. Tech. 42: 663-677.
http://dx.doi.org/10.1007/s00226-008-0190-94. Brischke, C.; Rapp, A. O., 2008b: Dose–response rela-
tionships between wood moisture content, wood tem-perature and fungal decay determined for 23 European fi eld test sites. Wood Sci. Tech. 42: 507-518.
http://dx.doi.org/10.1007/s00226-008-0191-85. Brischke, C.; Welzbacher, C. R.; Rapp, A. O.; Augusta,
U.; Brandt, K., 2009: Comparative studies on the in-ground and above-ground durability of European oak heartwood (Quercus petraea Liebl. and Quercus robur L.). Eur. J. Wood Prod. 67:329-338.
http://dx.doi.org/10.1007/s00107-009-0329-x6. Brischke, C.; Rapp, A. O., 2010: Service life prediction
of wooden components – Part 1: Determination of dose-response functions for above ground decay. Document IRG/WP 10-20439. International Research Group on Wood Protection, Stockholm
7. Brischke, C.; Frühwald Hansson, E., 2011: Modeling bi-odegradation of timber - Dose-response models for above-ground decay and its climate-dependent variabili-ty. International Conference on Structural Health As-sessment of Timber Structures, SHATIS ’11, June 16-17, 2011, Lisbon, Portugal.
8. Brischke, C.; Welzbacher, C. R.; Meyer, L.; Bornemann, T.; Larsson-Brelid, P.; Pilgård, A.; Frühwald Hansson, E.; Westin, M.; Rapp, A. O.; Thelandersson, S.; Jermer, J., 2011: Service life prediction of wooden components – Part 3: Approaching a comprehensive test methodolo-gy. Document IRG/WP/11-20464. International Research Group on Wood Protection, Stockholm.
9. Brischke, C.; Meyer, L.; Alfredsen, G.; Humar, M.; Fran-cis, L. P., 2012: Durability of timber products – Part 2: Proposal for an IRGWP - durability data base. Document
IRG/WP/12-20497. International Research Group on Wood Protection, Stockholm.
10. Carey, J. K.; Purslow, D. F.; Savory, J. G., 1981: Proposed method for out-of-ground contact trials of exterior joinery protection systems. Document IRG/WP 2157. Internation-al Research Group on Wood Protection, Stockholm.
11. CEN European Committee for Standardization 1989: EN 252. Wood preservatives. Field test methods for deter-mining the relative protective effectiveness in ground contact.
12. CEN European Committee for Standardization, 1993: EN 330 Wood preservatives - Field test method for deter-mining the relative protective effectiveness of a wood preservative for use under a coating and exposed out of ground contact – L-joint method.
13. CEN European Committee for Standardization, 1994: EN 350-1 Durability of wood and wood-based products – Natural durability of solid wood – Part 1: Guide to the principles of testing and classifi cation of the natural dura-bility of wood.
14. CEN European Committee for Standardization, 2003: CEN TS 12 037 Wood preservatives. Field test method for determining the relative protective effectiveness of a wood preservative exposed out of ground contact. Hori-zontal lap-joint method.
15. CEN European Committee for Standardization, 2006: EN 335 Durability of wood and wood-based products – Defi nition of use classes.
16. Da Costa, E. W. B., 1979: Comparative decay resistance of Australian timbers in accelerated laboratory tests.” Aus. For. Res. 9:119-135.
17. De Groot, R. C., 1992: Test assemblies for monitoring decay in wood exposed above ground. Inter. Bio. Bio. 29: 151-175.
http://dx.doi.org/10.1016/0964-8305(92)90014-F18. Dickinson, D, 2005: The factor method in wood preserva-
tion – A proposal for future progress from the COST E37 Task Force. COST E37 5th meeting of Task force “Per-formance Classifi cation”, Oslo, Norway, 18th June 2005.
19. Edlund, M.-L., 2004: Durability of some alternatives to preservative treated wood. Document IRG/WP 04-30353. International Research Group on Wood Protection, Stockholm.
20. Edlund, M.-L.; Jermer, J., 2007: Durability of some alter-natives to preservative-treated wood. Progress report 2: Results from fi eld tests after 5 years’exposure. Document IRG/WP 07-30442. International Research Group on Wood Protection, Stockholm.
21. Eslyn, W. E.; Highley, T. L.; Lombard F. F., 1985: Lon-gevity of untreated wood in use above ground. For. Prod. J. 35: 28-35.
22. Evans, F.; Alfredsen, G.; Flæte, P. O., 2011: Natural du-rability of wood in Norway – Results after eight years above ground exposure. The Nordic-Baltic Network in Wood Material Science and Engineering (WSE): Pro-ceedings of the 7th meeting, 2011, 1-6.
23. Flæte, P. O.; Alfredsen, G.; Evans, F. G., 2008: Compari-son of four methods for natural durability classifi cation after 2.5 years exposure. ProLigno 4: 15-24.
24. Flæte, P. O.; Alfredsen, G.; Evans, F. G., 2011: Natural durability of wood tested in different environments in Northern Europe. Document IRG/WP 11-10747. Interna-tional Research Group on Wood Protection, Stockholm.
25. Foliente, G. C., 2000: Developments in Performance-Based Building Codes and Standards. For. Prod. J. 50: 12-20.
26. Francis, L. P.; Norton, J., 2005: Above-ground durability estimation in Australia. Results after 16 years exposure.

.... Brischke, Meyer, Alfredsen, Humar, Francis, Flæte, Larsson-Brelid: Natural Durability...
DRVNA INDUSTRIJA 64 (2) 113-129 (2013) 129
Document IRG/WP 05-20314. International Research Group on Wood Protection, Stockholm.
27. Francis, L. P.; Norton, J., 2006: Predicting the decay re-sistance of timber above-ground: 1. Climate effects. Doc-ument IRG/WP 06-20330. International Research Group on Wood Protection, Stockholm.
28. Francis, L. P.; Swain, A. J., Morrell, J. J., 2007: Predict-ing the decay resistance of timber above-ground: 2. When can reliable fi eld data be obtained? Document IRG/WP 07-20368. International Research Group on Wood Pro-tection, Stockholm.
29. Fredriksson, M., 2010: A critical literature review of moisture and temperature conditions in wood exposed outdoors above ground. Report TVBM-3152. Lund Insti-tute of Technology, Lund University, Division of Build-ing Materials.
30. Gobakken, L. R.; Viitanen, H., 2004: Inventory for exist-ing test methods for fungi. Working Document of TF Per-formance Classifi cation of COST Action E 37.
31. Highley, T. L., 1995: Comparative durability of untreated wood in use above ground. Inter. Bio. Bio. 35: 409-419. http://dx.doi.org/10.1016/0964-8305(95)00063-1
32. ISO International Standardisation Organisation, 2000: ISO 15686-1. Building and constructed assets – Service life planning – Part 1: General principles.
33. MacKenzie, C. E.; Wang, C-H.; Leicester, R. H.; Foli-ente, G. C.; Nguyen, M. N., 2007: Timber service life design guide. Project number PN07.1052. Forest and Wood Products Australia Limited. www.fwpa.com.au
34. Norton, J.; Francis, L. P., 2008: Effect of surface-applied treatments on the above-ground performance of simulat-ed timber joinery. Aus. For. J. 71: 100-106.
http://dx.doi.org/10.1080/00049158.2008.1067627635. Palanti, S.; Feci, E.; Torniai, A. M., 2011: Comparison
based on fi eld tests of three low-environmental-impact wood treatments. Inter. Bio. Bio. 65: 547-552.
http://dx.doi.org/10.1016/j.ibiod.2010.12.01236. Råberg, U.; Edlund, M.-L.; Terziev, N.; Land, C. J., 2005:
Testing and evaluation of natural durability of wood in above ground conditions in Europe – an overview. J. Wood Sci 51: 429-440.
http://dx.doi.org/10.1007/s10086-005-0717-837. Rapp, A. O.; Augusta, U.; Brandt, K.; Melcher, E., 2010:
Natürliche Dauerhaftigkeit verschiedener Holzarten – Ergebnisse aus acht Jahren Feldversuch. In: Holzforsc-hung Austria (Ed.) Wiener Holzschutztage 2010, 25-26.11.2010 Wien.
38. Standards Australia, 2008: AS 5604 Timber - Natural du-rability ratings, Australian Standard distributed by SAI Global Limited. www.saiglobal.com.
39. Stirling, R., 2009: Natural durability classifi cation sys-tems used around the world. Document IRG/WP 09-10694. International Research Group on Wood Protec-tion, Stockholm.
40. Thelandersson, S.; Isaksson, T.; Suttie, E.; Frühwald Hansson, E.; Toratti, T.; Grüll, G.; Viitanen, H.; Jermer, J., 2011: Quantitative design guideline for wood in out-door above ground applications. Document IRG/WP 11-20465. International Research Group on Wood Protec-tion, Stockholm.
41. Van Acker, J.; Militz, H.; Stevens, M., 1999: The signifi -cance of accelerated laboratory testing methods deter-mining the natural durability of wood. Holzforschung 53: 449-458.
42. Van Acker, J.; Stevens, M., 2003: Biological durability of wood in relation to end-use - Part 2: The use of an ac-celerated outdoor L-joint performance test. Holz Roh- Werkst. 61: 125-132.
43. Viitanen, H.; Vinha, J.; Salminen, K.; Ojanen, T., Peuhku-ri, R.; Paajanen, L.; Lähdesmäki, K., 2010: Moisture and bio-deterioration risk of building materials and struc-tures. J. Build. Phys. 33: 201-224.
http://dx.doi.org/10.1177/174425910934351144. Wang, C.-H.; Leicester, R. H.; Nguyen, M. N., 2008a:
Decay above ground. Manual No. 4. CSIRO Sustainable Ecosystems, Urban Systems Program, Highett, Victoria.
45. Wang, C.-H.; Leicester, R. H.; Nguyen, M. N., 2008b. Equations for use in a service life design guide. Manual No. 11. CSIRO Sustainable Ecosystems, Urban Systems Program, Highett, Victoria.
46. Willeitner, H.; Peek, R.-D., 1997: The natural durability story. Document IRG/WP 97-2011. International Re-search Group on Wood Protection, Stockholm.
Corresponding address:
Professor CHRISTIAN BRISCHKE, Ph.D.
Leibniz University HannoverFaculty of Architecture and Landscape ScienceHerrenhäuser Str. 8D-30419 Hannover, GERMANYe-mail: [email protected]