natural enemy evaluation · biological control in crop ipm ... slides of david biddinger, ... cage...
TRANSCRIPT

NATURAL ENEMY
EVALUATION
Read ch 20

INCORPORATION
NATURAL ENEMIES INTO
IPM DECSION MAKING
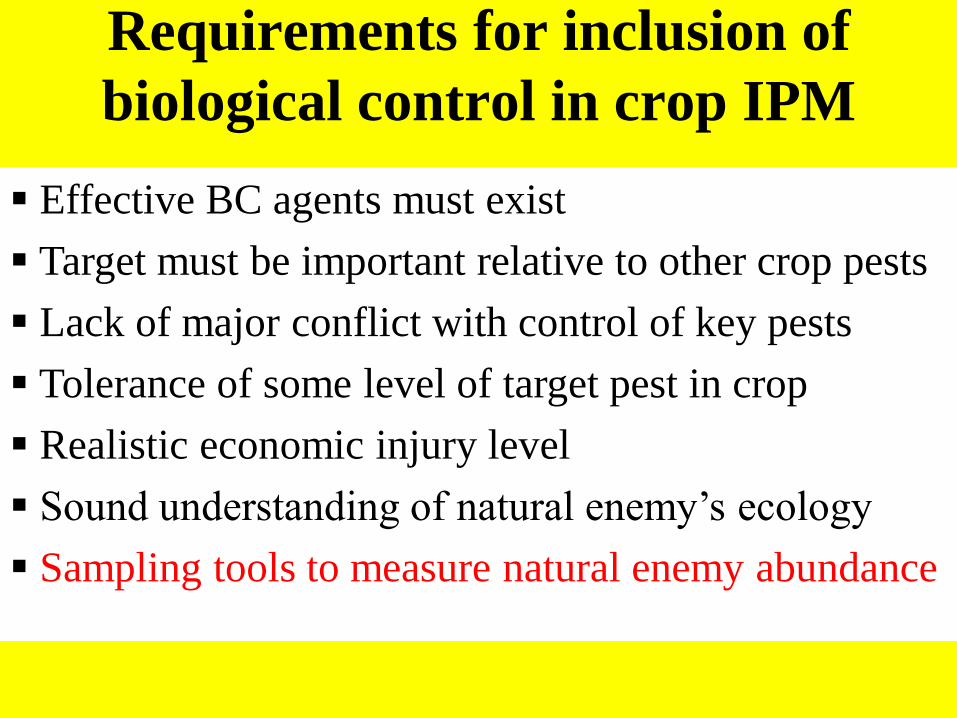
Requirements for inclusion of
biological control in crop IPM
Effective BC agents must exist
Target must be important relative to other crop pests
Lack of major conflict with control of key pests
Tolerance of some level of target pest in crop
Realistic economic injury level
Sound understanding of natural enemy’s ecology
Sampling tools to measure natural enemy abundance

Modification of IPM thresholds to reflect information
about current natural enemy densities or ratios in the crop
Monitoring tomato fruitworm (Helicoverpa zea) in processing
tomatoes in CA. Ratios of black (parasitized)/white (healthy) eggs
are used in a sequential sampling plan to assess need for pesticides
Modification of IPM thresholds to reflect information
about current natural enemy densities or ratios in the crop

Modification of IPM thresholds-second example
The pest threshold of apple blotch leafminer (13 mines/100
leaves of 1st gen.) can be relaxed in view of 1st gen larval
parasitism, which can be determined by timely sampling

Monitoring Southern Pine Beetle and its Key
Predator to Decide if “Spots” Must be Controlled

SOUTHERN PINE BEETLE PREDICTION CHART
(Modified January 2002)
Average Number
of SPB/Trap/Day
Severe Outbreak
Increasing or High
Static or Moderate
Declining or Low
Average Percent SPB = #SPB x 100/ (#SPB + # Clerids)
55%
20%
6%
## 10% 20% 30% 80% 90% 100%40% 50% 60% 70%
0
10
20
30
80
40
50
60
70

Control of mites in PA apple orchards
Integration of predator counts with mite counts
Two historical eras:
a) When Stethorus punctum was the key predator
b) When it was replaced by Typhlodromus pyri, a
predatory mite
Slides of David Biddinger, Pennsylvania State University, with modification
European Red Mite Two-Spotted Spider Mite

Stethorus punctum Reduced miticide use by
50% in PA from late 1970s to mid 90s.
Saved growers $20 million over 15 year period.
Reduced miticide use by over 2.2 million pounds.
Required at least 5 mites/leaf to stay in orchard and
8-10 mites/leaf to begin laying eggs.

Stethorus punctum
– Some leaf injury (bronzing)
often occurred.
– Important when:
• methomyl was necessary to
control TABM - predator mites
were not a factor.
• Few miticides available & not
very effective due to resistance.
• Tree were large, industry was
predominantly processing.
Adult & larva
DJB-2005

When Stethorus punctum made sense
– Impact of new insecticides that were very toxic:
• Neo-nicitinoids (imidacloprid)
• Chitin inhibitor IGRs (novaluron, diflubenzuron, buprofezin)
• Abamectin miticide
– More effective miticides registered.
– Mite thresholds/tolerance for injury declined.
• Move to smaller trees.
• More suceptible varieties.
• Shift from processing to fresh market where color was important.
ERM & Stethorus Eggs
DJB-2005

Mite Predators Changed
Typhlodromus pyri
Stethorus punctum
Disappeared due
to new pesticides
New predator invaded region and was both
able to withstand the new pesticides and
provided better mite control

Monitoring Predator Mite and Pest Mite
Numbers Guides Spray Decisions
Pest mite to T. pyri ratios of 10 to 1 or lower are sufficient for biological control
ASSESSING IMPACT OF
CLASSICAL BIOLOGICAL
CONTROL AGENTS

ASSESSING IMPACT OF CLASSICAL BIOLOGICAL
CONTROL AGENTS
Experimental methods based on “with
and without” treatment plots
1. Before and after plot
2. Geographic release and control plots
3. Cage exclusion
4. Chemical exclusion

ASSESSING IMPACT OF
CLASSICAL BIOLOGICAL CONTROL AGENTS
METHOD #1.
“BEFORE AND AFTER”
ASSESSMENT OF PEST DENSITY
OR CROP LOSS

Example #1
Invasion of
citrus blackfly
into Florida
and its control
via parasitoid
introduction
Black= nymphs

Citrus blackfly (nymphs are black normally), with exit
holes of introduced parasitoids

Citrus blackfly parasitoid: Amitus hesperidum, one of two
species introduced for pest control in Florida

Sampling to measure density and parasitism
before and after introduction
Yard citrus is main pest reservoir

Citrus blackfly nymphal density “before and
after” parasitioid introduction
Post-project pest density
Citrus blackfly nymphal density
“before and after” parasitioid introduction
Pre-project pest density
Transition phase
as parasitism
rises
CMF
A. hesperidus
P. opulenta

Example #2
Olive scale,
Parlatoria
oleae in CA,
before
parasitoid
introduction
“Before BC” = 43% culls

“After BC” = 0.3% culls, 99% reduction
Olive scale,
Parlatoria oleae,
in CA, after
parasitoid
introduction

1.You need to start observations in control plots
up to several years before natural enemy
releases begin
2. Since there may be strong climatic differences
between the “before” and the “after” years, it
is best to continue some “before” sites without
releases (partial geographic design)
Potential problems or limitations with
the “before and after” design

ASSESSING IMPACT OF
CLASSICAL BIOLOGICAL CONTROL AGENTS
METHOD #2. Geographically
separated release and control plots
Assessment of pest density at sites with
releases vs ones with no releases of the
agent to be evaluated

Insert picture of ck lifestages
from C drive
Effect of Chilocorus kuwanae on euonymus scale,
Control Site (one of 15)- no predator release
Plant died in fall

Insert picture of ck lifestages
from C drive
Predator build up
Scale decline
Effect of Chilocorus kuwanae on euonymus scale.
Release site– one of 15
Predator build up
Scale decline

Insert picture of ck lifestages
from C drive
Predator build up
Effect of Chilocorus kuwanae on euonymus scale
(Unaspis euonymi), averaged over all research sites,
1991-1993 in New England
Predator present
Predator absent
Conclusion: sites with increasing scale typically
lacked the predator, while sites with the predator
typically decreased in scale density
Summary

Geographical plots to measure effect of phorid fly on fire
ants and effect of rapid range expansion on exp. design
Range expansion
post release of P.
tricuspis in two
years (black 1999,
dark grey 2000, and
light grey, 2001)
As a consequence of rapid expansion of fly after
release, control plots had to be relocated to somewhat
distant country (Madison, upper left

1. You need to define a pool of plots and assign
control or release treatments to them AT
RANDOM (this is often overlooked)
2. Control plots are sometimes invaded by the
natural enemy as it disperses. To avoid this,
greater separation must be used. This may
cause control plots to enter new ecological
zones or if control plots are grouped to
enhance separation from release plots, this
conflicts with random assignment.
Potential problems or limitations with the
“geographically separated plots” design

ASSESSING IMPACT OF
CLASSICAL BIOLOGICAL CONTROL AGENTS
METHOD #3. Cage Exclusion
Assessment of pest density inside and
outside cages excluding natural enemy

3 treatments-open cage, closed cage, no cage
Cage exclusion to measure pest density with
and without the key natural enemy
Closed cage
initially
impregnated
with DDT to
kill off any
pre-existing
parasitoids
in scales
Open cage is
intended to
allow full
parasitoids
full access to
scales
Uncaged
branch is a
check on
cage effects
Cage exclusion and CA red scale

Leaf clip cages are
used to assess
impacts of
parasitoids on
sedentary species
such as scale,
mealybugs and
whiteflies

Pest mortality inside and outside leaf clip cages
Example #1: Effect of parasites on CA red scale on ivy

Cage exclusion example #2: control of cassava mealybug
(Phenococcus manihoti) in Africa by Epidinocarsis lopezi

Cage exclusion example #2: control of cassava mealybug
(Phenococcus manihoti) in Africa by Epidinocarsis lopezi
Note log scale
>97% pest
reduction

1. Temperature may be increased inside cages,
causing pests to increase faster, perhaps
raising pest population density.
2. Humidity may be increased inside cages,
leading to higher rates of mortality from
fungal pathogens.
3. Pest progeny will be confined inside cages,
raising pest density by restricting pest
dispersal
Potential problems or limitations with
the “cage exclusion” design

ASSESSING IMPACT OF
CLASSICAL BIOLOGICAL CONTROL AGENTS
METHOD #4. Pesticide Exclusion
Assessment of pest density in plots
sprayed with a pesticide that kills the
natural enemy but not the pest vs.
unsprayed areas with the natural enemy

Use of pesticides to exclude natural enemy being evaluated
Pesticides must
1. Kill the natural enemy
2. Be safe to the pest
3. Not stimulate pest reproduction

Use of DDT
to exclude
natural
enemies of
California
red scale
Example #1 of chemical exclusion
70-fold pest
increase

Example #2 of chemical exclusion
Use of carbaryl to exclude predators of
Pacific mite in California vineyards
>30-fold pest
increase
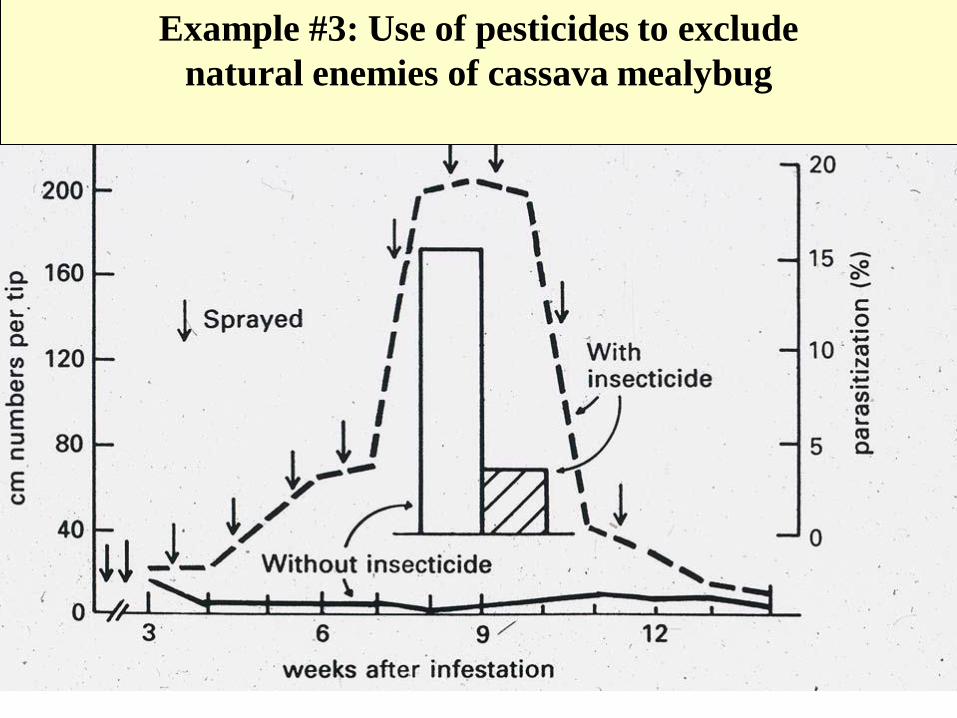
Example #3: Use of pesticides to exclude
natural enemies of cassava mealybug

The residues of some pesticides stimulate the population
growth of such groups as mites or
1.2 eggs
for
controls
One of the problems in chemical exclusion: hormolygosis
1.6 eggs for low
residue treatment
0.6 eggs
for high
residue
treatment

Melaleuca invasion of the Everglades NP in the US-
converted miles of everglades to swamp forests

Thick Stands of Melaleuca in Florida
The melaleuca weevil

In FL in an insecticide exclusion trial, plots from which BC
agents were excluded showed lowered rates of tree mortality
than ones in which they were present
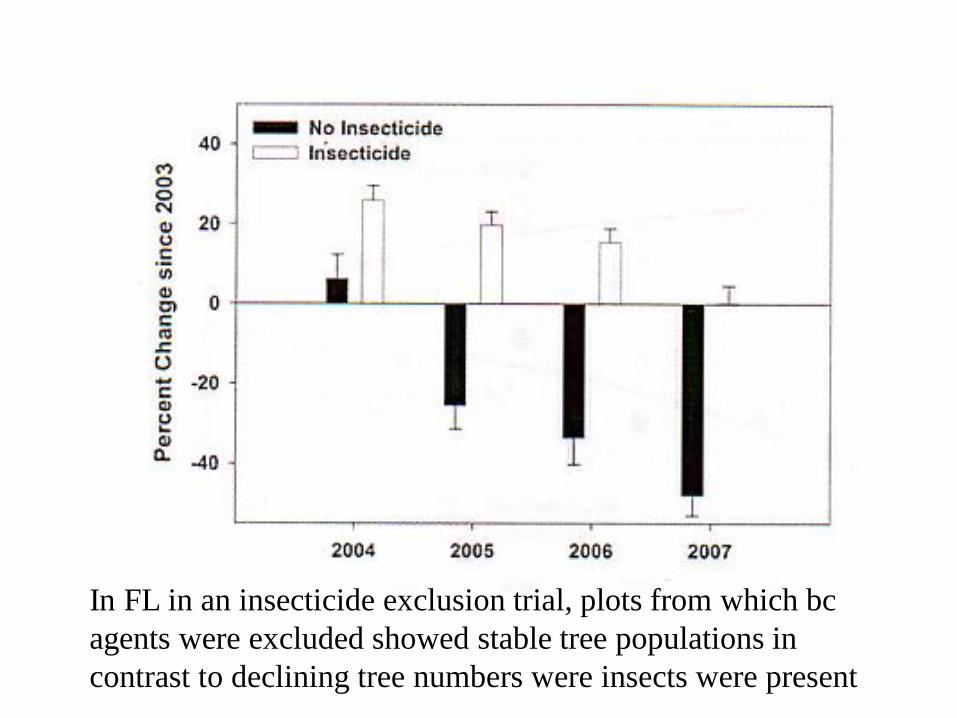
In FL in an insecticide exclusion trial, plots from which bc
agents were excluded showed stable tree populations in
contrast to declining tree numbers were insects were present

Insecticide exclusion trial on melaleuca in Florida
BC agents killed with insecticides unsprayed

1. It may be difficult to find a pesticide that has
no effect on the pest but kills the natural
enemy (easy if pest is a weed).
2. Pesticides are likely to eliminate the whole
natural enemy complex, not just the newly
introduced species.
3. Some pesticides stimulate pest fecundity,
raising pest density.
Potential problems or limitations with
the “pesticide exclusion” design

Ants that tend honey-dew-producing Homopera can
exclude natural enemies in some cases, acting as a
“biological check”

ASSESSING IMPACT OF CLASSICAL BIOLOGICAL
CONTROL AGENTS
Using life tables

Life tables
1. Provide an organizational framework for
data collection and comparison
2. Allow contributions of specific mortalities in
restricting population growth to be assessed
3. Allow separate effects of contemporaneous
mortalities to be distinguished
4. Series allow detection of density dependent
action of sources of mortality
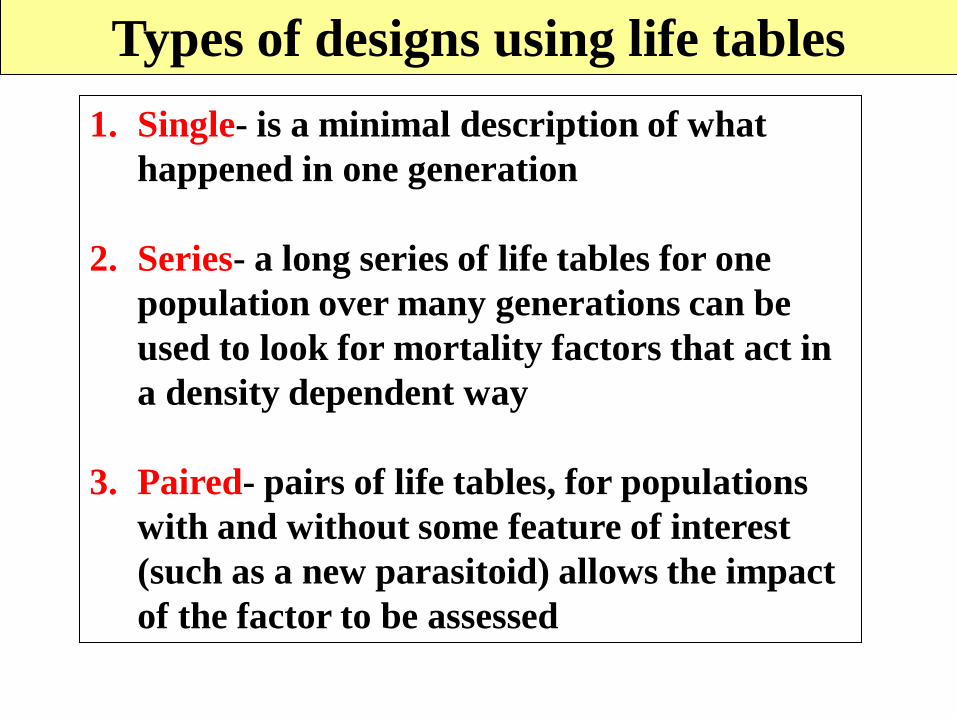
Types of designs using life tables
1. Single- is a minimal description of what
happened in one generation
2. Series- a long series of life tables for one
population over many generations can be
used to look for mortality factors that act in
a density dependent way
3. Paired- pairs of life tables, for populations
with and without some feature of interest
(such as a new parasitoid) allows the impact
of the factor to be assessed

Cohort vs population based life tables
1. Cohort life table- is based on a group of
individuals that are created for the purpose
of tracking their fate. They are synchronized
and do not suffer exactly the same fates as
the real population since that may be more
protracted over time
2. Real population life table- based on samples
drawn from the population of interest in
some representative way

Cohort lifetables of
sessile species such
as leafminers are
readily obtained, as
a group can be
marked and easily
reencountered later
Mines of apple blotch leafminer (Phyllonorycter crataegella,
Lepidoptera: Gracillariidae) on apple
Sessile vs mobile stages or species

Cohort of immatures of apple blotch leafminer
(Phyllonorycter crataegella, Lepidoptera: Gracillariidae)

Mines retain a story of what happened to the pest, which can be
sorted out by what life stages, cast skins or residues are found
sap larva-pest
pupa-pest
pest pupal skins outside mines
larva of parasitoid
cadaver of
pest larva

Sample life table
How much mortality is enough
for pest control?
R0 is the best measure

Paired lifetable-example #1- apple blotch leafminers

Unsprayed
plot
Lifetable apple blotch leafminer (Phyllonorycter
crataegella) on unsprayed trees in Buckland, MA, 1981
65% larval parasitism
Popl’n increased by 1.8X
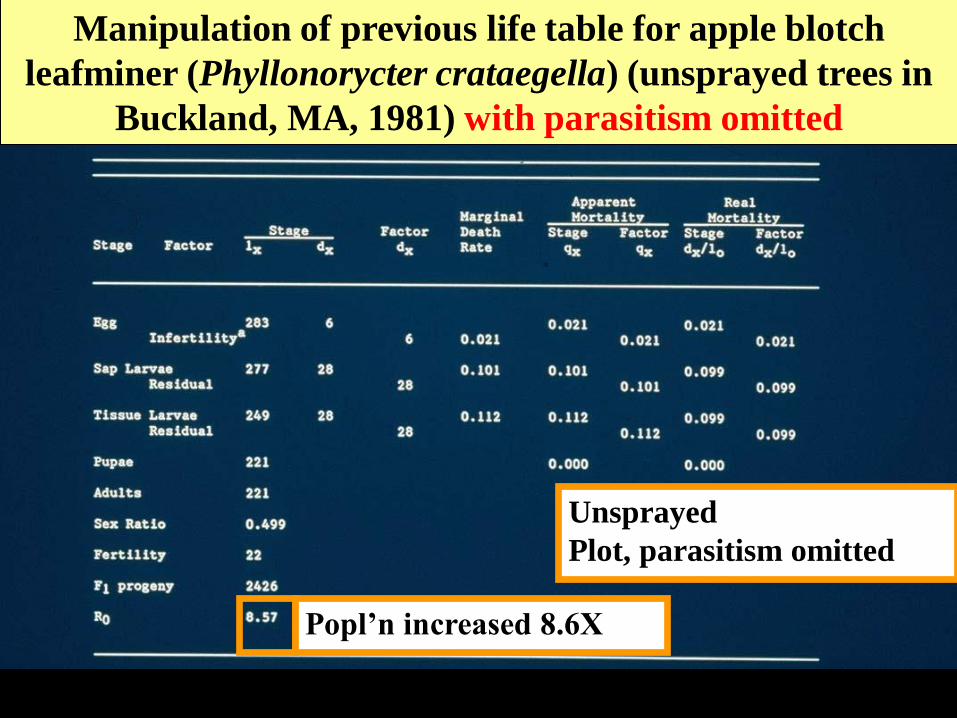
Manipulation of previous life table for apple blotch
leafminer (Phyllonorycter crataegella) (unsprayed trees in
Buckland, MA, 1981) with parasitism omitted
Unsprayed
Plot, parasitism omitted
Popl’n increased 8.6X

Real field lifetable for apple blotch leafminer
(Phyllonorycter crataegella) on sprayed trees (leafminer
resistant but parasitoids not resistant)
Sprayed Plot, parasitism
eliminated by pesticides
Popl’n increased 8.5X

Contrasting the Ro values for populations with and
with the natural enemy of interest in paired life tables
Ro values
• Unsprayed wild orchard 1.8X
• Table #1, parasitism removed 8.6X
• Sprayed orchard-
chemical check 8.5X
Conclusion: prediction made based on
lifetable from wild orchard matches
actual pest population growth in
sprayed orchard

Paired lifetable-example #2-whiteflies on poinsettia
B. tabaci, B strain adult and nymphs

Eretmocerus eremicus, parasitoid of the whitefly Bemisia
tabaci used in poinsettia via augmentative BC

Paired cohort lifetables to measure impact of Eretmocerus
eremicus on Bemisia tabaci in greenhouse poinsettia
Defined leaf areas are
repeatedly photographed
and survival of individual
whitefly nymphs recorded
Whitefly nymph

Life table for the whitefly Bemisia tabaci on poinsettia in
the absence of parasitoid releases
75% egg-to-adult-survival, R0 = 67 (90 eggs/F)

Life table for the whitefly Bemisia tabaci on poinsettia with
Eretmocerus eremicus releases
8% egg-to-adult-survival, R0 = 7.2 (90 eggs/F)

Parasitoids from the native
range imported to the USA
Four parasitoids
a)Oobius agrili (CH)
b)Tetrastichus
planipennisi (CH)
c)Spathius agrili (CH)
d)Spathius n sp. (Russia)
Major releases in USA
of first 3 began in 2008

Antanycolus spp. – a group of native parasitoids that now
dominate the EAB larval parasitoid guild

EAB: 2008-2009
An exploding pest population
Stage lx
dx di Factors
Egg 144 39 37 Infertility/predation
2 Oobius agrili
1st - 2nd 105 16 16 Tree resistance
3rd – 4th 89 4 2 Undetermined-Di/Com/other
1 T. planipennisi
1 Atanycolus sp
JL-PP 85 10 9 WP predation
1 Undetermined-Di/Com/other
(22) (22) (Overwintering WP-29%)
(Adults) (53) (3) (3) (Fungus disease -5%)
(F1 Eggs) 2529 (1:1 sex ratio/100 eggs/F)
R0 17.5

EAB: 2008-2009
Reduced to an expanding, not exploding, population
Stage lx
dx di Factors
Egg 417 78 78 Infertility/predation
0 Oobius agrili
1st - 2nd 339 55 54 Tree resistance
1 Undetermined-Di/Com/other
3rd – 4th 284 137 73 Undetermined-Di/Com/other
60 Atanycolus sp
4 T.planipennis/others
JL-PP 147 104 103 WP predation
1 Undetermined-Di/Com/other
(12) (12) (Overwintering WP-29%)
(Adults) (31) (2) (2) (Fungus disease -5%)
(F1 Eggs) 1450 (1:1 sex ratio/100 eggs/F)
R0 3.5

Comparison of EAB Population Growth in North America vs.
Asia
2009
MI -
gre
en a
sh
2010
MI -
gre
en a
sh
Asia
- gre
en a
sh
Asia-
Orie
ntal a
sh
Net P
opu
lation
Gro
wth
(R
0)
0
2
4
6
8
10
12
14
16
18
20
No woodpeckers60% egg parasitism60% larval parasitismLimited tree restance
Woodpecker predationDisease/competition/otherslittle egg parasitism~20% larval parasitismlimited tree resistance
High resistance (70%)
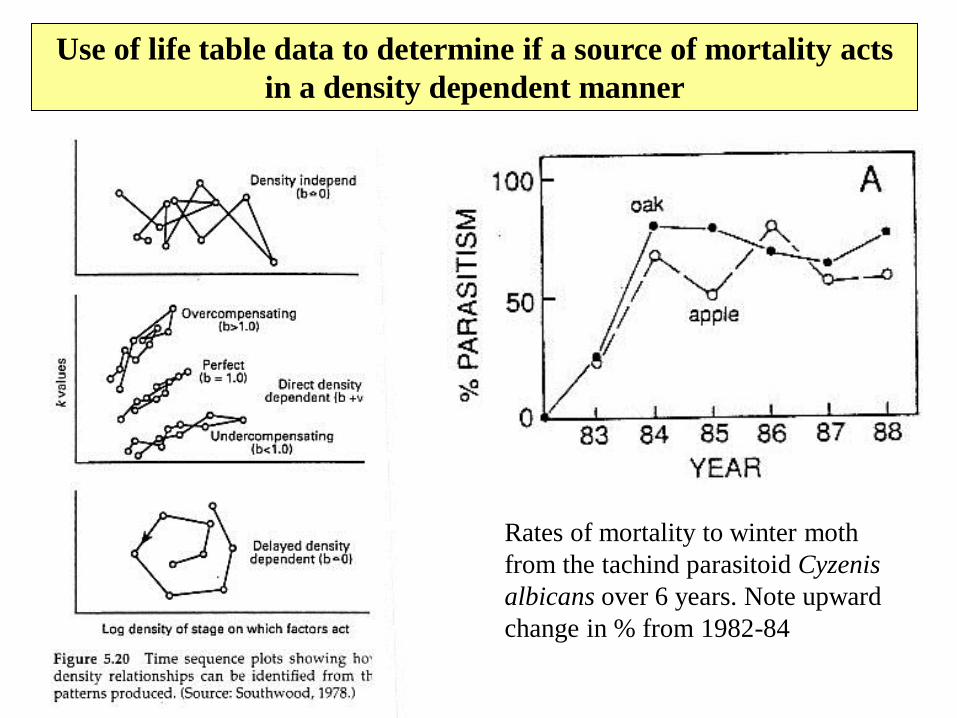
Use of life table data to determine if a source of mortality acts
in a density dependent manner
Rates of mortality to winter moth
from the tachind parasitoid Cyzenis
albicans over 6 years. Note upward
change in % from 1982-84
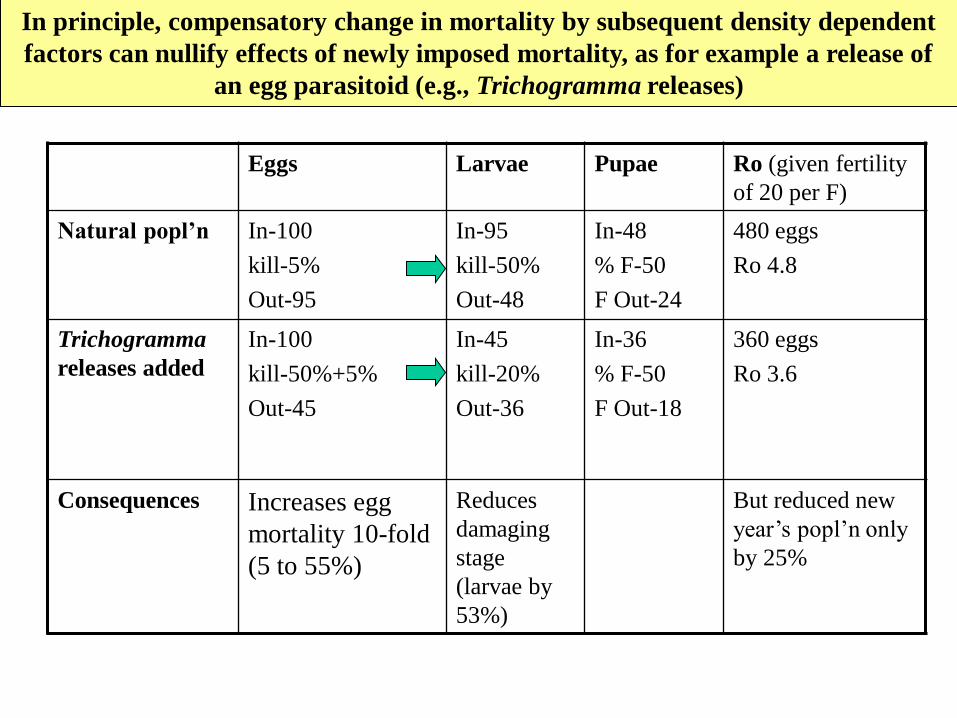
In principle, compensatory change in mortality by subsequent density dependent
factors can nullify effects of newly imposed mortality, as for example a release of
an egg parasitoid (e.g., Trichogramma releases)
Eggs Larvae Pupae Ro (given fertility
of 20 per F)
Natural popl’n In-100
kill-5%
Out-95
In-95
kill-50%
Out-48
In-48
% F-50
F Out-24
480 eggs
Ro 4.8
Trichogramma
releases added
In-100
kill-50%+5%
Out-45
In-45
kill-20%
Out-36
In-36
% F-50
F Out-18
360 eggs
Ro 3.6
Consequences Increases egg
mortality 10-fold
(5 to 55%)
Reduces
damaging
stage
(larvae by
53%)
But reduced new
year’s popl’n only
by 25%

Construction of life tables

How does one build accurate lifetables?

Previous life table examples were based on cohorts (a
marked set of individuals), not samples from a population

If insects are not sessile, you usually can’t follow the fate of
a set of individuals (a cohort). Rather, you have to estimate
the current numbers of each life stage by sampling
If insects are not sessile, you usually can’t follow the fate of
a set of individuals (a cohort). Rather, you have to estimate
the current numbers of each life stage by sampling
Change in density over time of Heliothis spp.
eggs and larvae

Density vs. numbers entering a stage

Components of a Lifetable
Data Used to Construct table
• Number entering each life stage (lx)
• Number dying, for each cause, in each stage (dx)
Calculations made from data
• Apparent mortality (qx) = dxi/lxi for a factor and
stage
• Irreplaceable mortality- dx/lx (stage 1)
• Marginal rate of mortality- rate of death for each
factor modified (when there are 2 or more sources
of mortality acting together) to reflect underlying
attack rates

Life tables are not built on density date. They ask for
numbers (summed over a generation) that enter each life
stage and how many die in each stage
In a generation, how many Colorado potato beetle eggs get laid?

Density and Recruitment
Estimating CPB egg
density and recruitment in
a potato field- stakes mark
sampling locations
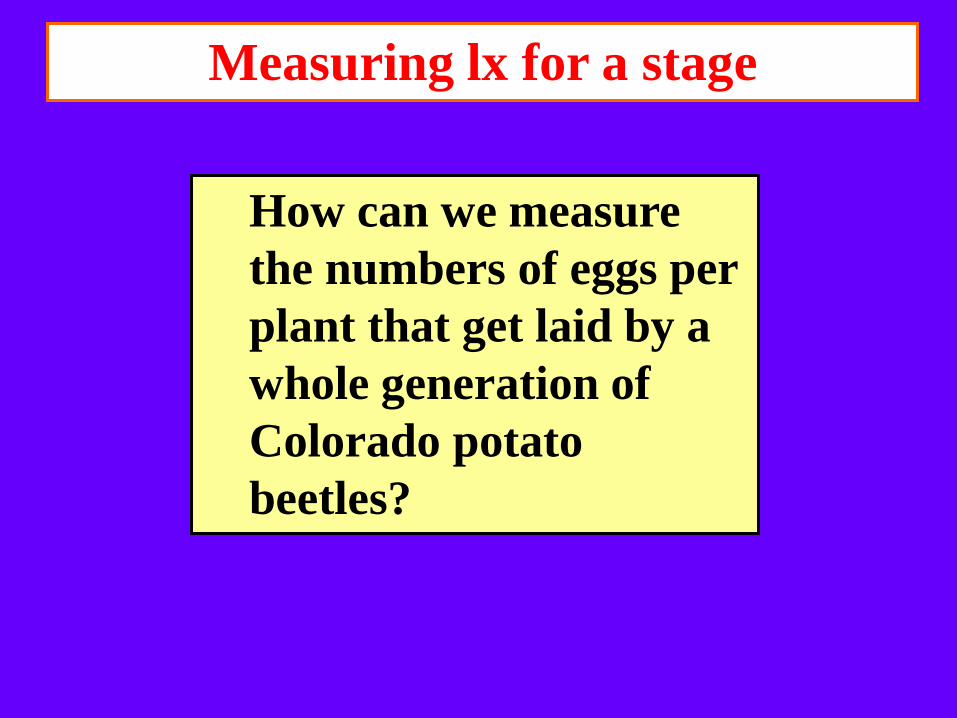
Measuring lx for a stage
How can we measure
the numbers of eggs per
plant that get laid by a
whole generation of
Colorado potato
beetles?

Double Sample Method
1. Density– select sample plants and count egg
masses per plant on each date
2. Remove all egg masses found on plants sampled
to estimate density
3. Recruitment. On next sample date (3 or 4 days
later), recheck old density plants. Any egg
masses found on these plants had to have been
laid during the period between sample date.
This is a recruitment value (# eggs laid per plant
per time period).

Comparison of egg density over a series of dates and
numbers of new eggs laid per day in each time period
(recruitment to the stage)
Year 1
Year 2
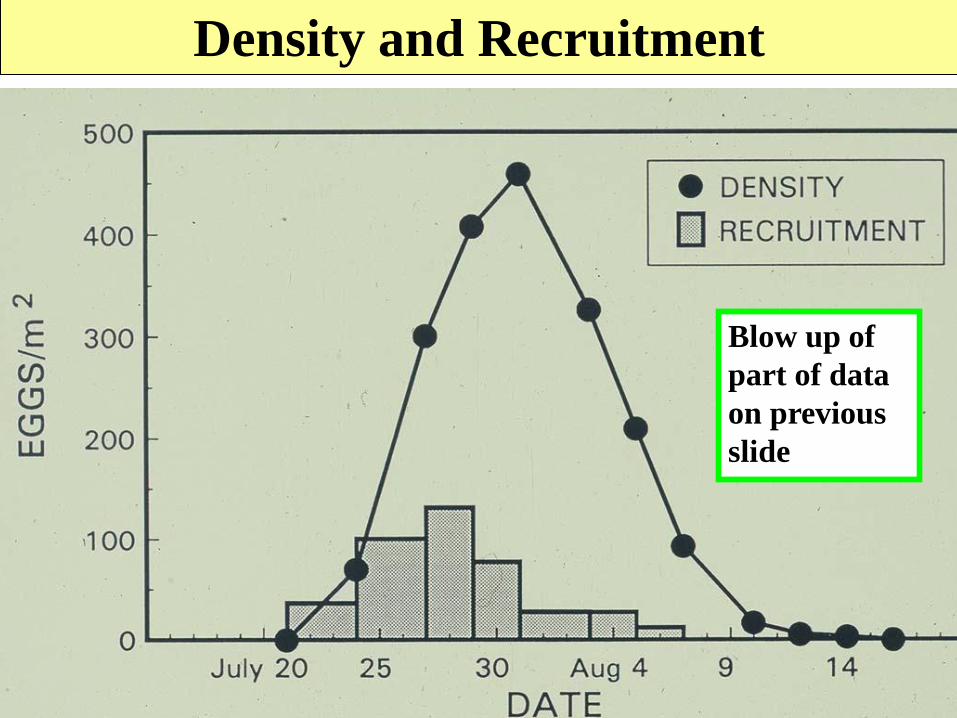
Density and Recruitment
Blow up of
part of data
on previous
slide
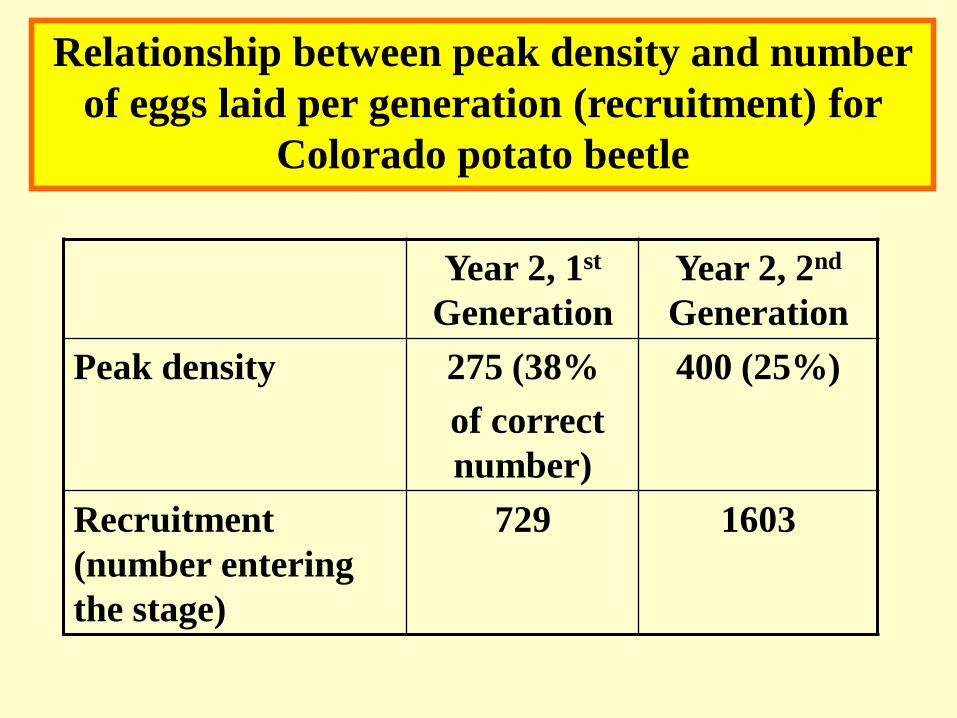
Year 2, 1st
Generation
Year 2, 2nd
Generation
Peak density 275 (38%
of correct
number)
400 (25%)
Recruitment
(number entering
the stage)
729 1603
Relationship between peak density and number
of eggs laid per generation (recruitment) for
Colorado potato beetle

Measuring dx for a stage
How can we measure the
numbers of eggs per plant
that get parasitized by a
parasitoid species over
the course of a whole pest
generation?

Measuring the
host’s dx from
parasitism is
the same as
measuring the
lx to the
lifestage of the
immature
parasitoid
Host
popl’n
Imm. Par.
popl’n
Host gain/day
Imm par.
gain/day
Loss to next
host stage
Loss to parasite
emergence from host
Loss to death
Loss to death

Edovum puttleri, a eulophid, new association egg parasitoid
or Colorado potato beetle from Colombia

Measuring losses to parasitism
(dx parasitism from E. puttleri for Colorado potato beetle)
To measure total losses to parasitism:
1. Measure host lx to the egg stage as above
2. Measure semiweekly parasitoid attacks by
rearing eggs recruited in each time interval to
detect newly parasitized eggs
3. Sum all parasitized eggs in recruitment samples
for the whole egg generation (this is both
parasitoid lx to immature stage and dx from
parasitism for the host) (assumes eggs not
vulnerable to parasitism after one time period)
4. Generational loss to parasitism (qx of lifetable)
is dx parasitism/lx CPB egg \
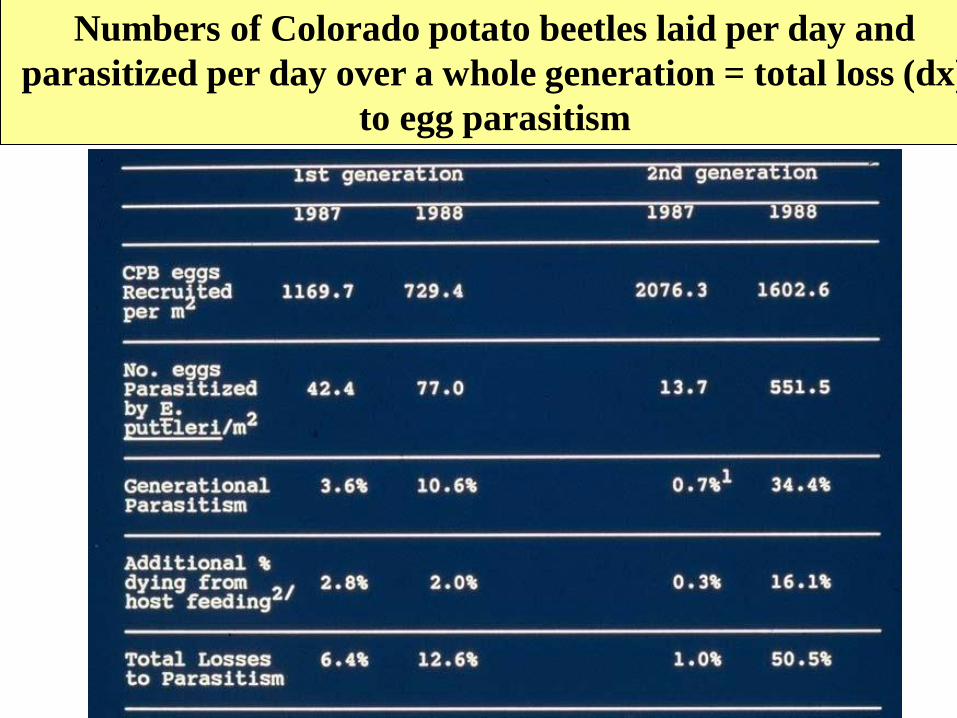
Numbers of Colorado potato beetles laid per day and
parasitized per day over a whole generation = total loss (dx)
to egg parasitism

Cotesia glomerata is an imported parasitoid of Pieris rapae,
a pest of cabbage
Measuring losses to parasitism example #2
(dx parasitism from C. glomerata for P. rapae larvae)

Pieris rapae larvae parasitized by Cotesia glomerata, plus
cocoons from another previously parasitized larva

Measuring losses to parasitism #2
(dx parasitism from C. glomerata for P. rapae larvae)
1. Measure host lx to 1st larval instar (relatively
non mobile between leaves) using the double
sample methods described for CPB example)
2. Dissect all larvae (all instars) found on plants
sampled to measure P. rapae density.
3. Among dissected larvae (step 2), count only
those with small parasitoid eggs (= young
enough to be laid between sample dates).
4. Over whole insect generation, sum larvae with
small parasitoid eggs (step 3) and divide by
total host larvae (step1)

Summation for a generation of the total P. rapae larvae
entering the larval stage and the total number dying from
C. glomerata parasitism

Can good life table lx values be extracted from
samples of an insect stage’s density?

Only the graphical method of Southwood has ever been
widely used to obtain lx values from density sample data
Big issue: as
mortality in the
stage increases,
the value
obtained
becomes
progressively
TOO SMALL

Separating Simultaneous
Mortalities
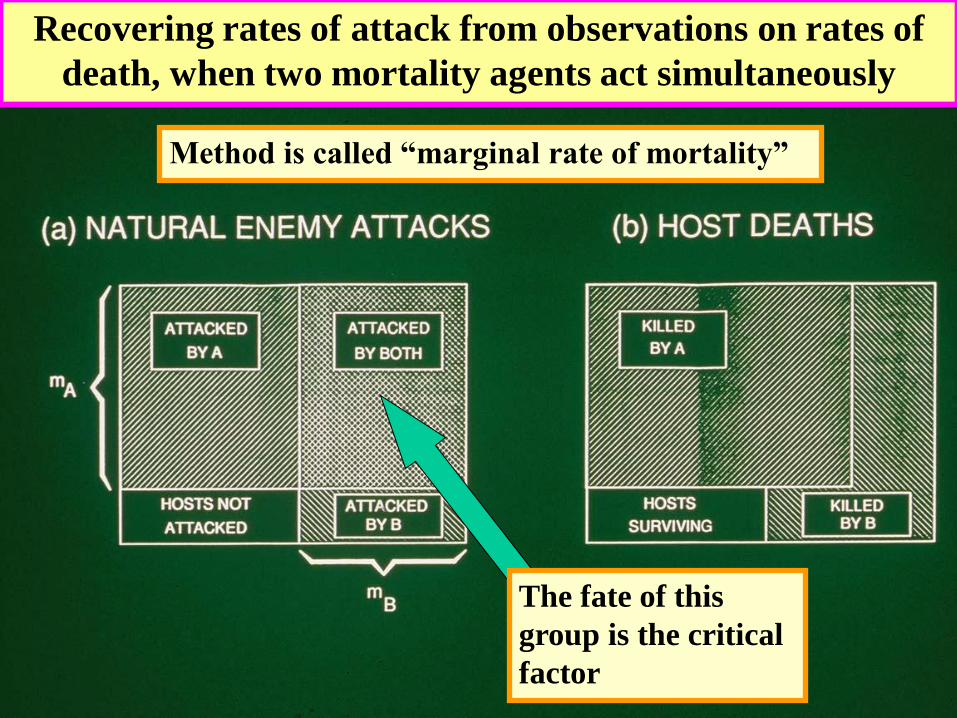
Recovering rates of attack from observations on rates of
death, when two mortality agents act simultaneously
The fate of this
group is the critical
factor
Method is called “marginal rate of mortality”

When two
factors act
together, the
discrepancy
between
apparent
mortality and
the marginal
rate is
important only
when both
attack rates are
large

WHEN DEATH LEAVES NO TRACE: COUNTING LOSSES WHEN CADAVERS ARE MISSING
OR NOT DISTINCTIVE
1. Predation on non-attached prey stages
2. Host feeding by parasitoids

Predacious Hemiptera attacking a caterpillar
When the dead
caterpillar falls to
the ground, there is
nothing to mark
that it ever existed

Early option: ELISA
Current methods:
PCR-for prey DNA
An alternative is to seek remains of prey
inside predators

Caterpillar of apple blotch leafminer (Phyllonorycter
crataegella) that was killed by a host feeding parasitoid
Blood binding neck
of caterpillar to
skin of mine
Host fed
individuals are
findable in field
samples only if
cadavers are
stuck to plant
or contained in
leafmine, gall,
etc