naturally occurring enzyme activity variation … · naturally occurring enzyme activity variation...
TRANSCRIPT

Copyright 0 1982 by the Genetics Society of America
NATURALLY OCCURRING ENZYME ACTIVITY VARIATION IN DROSOPHILA MELANOGASTER. I. SOURCES OF VARIATION
FOR 23 ENZYMES'
C. C. LAURIE-AHLBERG,' A. N. WILTON? J. W. CURTSINGER4 AND T. H. EMIGH
Departments of Genetics, North Carolina State University, Raleigh, North Carolina 27650
Manuscript received November 6, 1981 Revised copy accepted June 11, 1982
ABSTRACT
The genetic component of variation of enzyme activity levels in Drosophila melanogaster was investigated by using 48 second- and 48 third-chromosome isogenic substitution lines derived from natural populations. The results confirm those of our earlier experiments with the same lines and extend them to a number of additional enzymes. All 23 enzymes show a significant genetic component to the variation in one or both sets of lines and only a small part of this variation is accounted for by variation among the lines in the amount of tissue per fly. The magnitude of line effects is, in most cases, considerably larger than the magnitude of environmental and measurement error effects, and the line effects are approximately continuous in distribution. Variation in the geographic origin and karyotype of the chromosomes generally does not con- tribute to the line component of variation, but allozymes provide an important source of variation for a few of the enzymes. Many of the enzymes show evidence for variation of activity modifiers that are not linked to the structural locus of the enzyme.
ATURALLY occurring genetic variants that affect activity levels have been N reported for a number of enzymes in Drosophila melanogaster (e.g., DICK- INSON 1975; CHOVNIK et al. 1976; THOMPSON et al. 1977; ABRAHAM and DOANE 1978; MARONI 1978; MCDONALD and AYALA 1978; MCCARRON et al. 1979; BEWLEY 1981; LAURIE-AHLBERG et al. 1980, 1981; MARONI et al. 1982), Mus musculus (reviewed by PAIGEN 1979 and FELDER 1980) and Zea mays (reviewed by SCANDALIOS and BAUM 1982). These observations along with recent models of the regulation of gene expression in eukaryotes (e.g., BRITTEN and DAVIDSON 1969; DAVIDSON and BRITTEN 1979) suggest that, in natural populations, there may be several polymorphic loci distributed throughout the genome that affect the expression of a given structural gene and thereby contribute to variation in the activity of an enzyme. Furthermore, it has been suggested that polymor- phism of such modifiers may provide a more important source of variation for adaptive evolutionary change than structural gene variation (BRITTEN and DAV- IDSON 1969; WILSON 1976). However, at present there is very little quantitative information about the extent of genetic variation of enzyme activity levels, the
' Paper No. 8071 of the journal series of thc North Caro1in;l Agric:ulturiil Research Service. Raleigh, North Carolina.
To whom reprint requests should he addressed. Present address: Department of Genetics, Llnivcrsity [if California. Davis, Cklifomia 95616. Present address: Department of Genctics a n d Ccl l Hiology, Ilnivcrsity of Minnesota. St. Paul, Minnesota
55108.
Genetics 102: 191-206 October. 1982.

192 C. C. LAURIE-AHLBERG ET AL.
types of genes that cause this variation or the ultimate effects of such variation on complex physiological or morphological phenotypes. We have therefore undertaken a systematic approach to investigating the extent and nature of genetic variation that affects the activities of a variety of different enzymes in Drosophila melanogaster.
Our basic approach to quantifying the amount of genetic variation of enzyme activity in natural populations of Drosophila is to view activity as a quantitative trait and to partition its variance into genetic and environmental components with standard biometrical methods. This partitioning is simplified by the use of isogenic lines, so that genotypes can be replicated over environments. In order to localize activity variants, two sets of homozygous lines were constructed in which either second or third chromosomes from natural populations were substituted into a common isogenic background. Within the set of second- chromosome substitution lines, for example, all X and third-chromosome loci are constant but second-chromosome loci vary. This design permits detection of activity variants that are not linked to the structural locus of the enzyme and can therefore easily identify one type of modifier locus. In a preliminary experiment, six of the seven enzymes showed a significant genetic component to the variation in activity in one or both sets of lines and five of the seven enzymes showed evidence for variation of modifiers that are not linked to the structural gene (LAURIE-AHLBERG et al. 1980). The experiment reported here was conducted with the purpose of extending our investigation to a number of additional enzymes in order to better understand the generality and repeatabil- ity of these results and, particularly, to determine whether the genetic effects on related enzymes are intercorrelated. This paper summarizes the design and results of the experiment in terms of univariate statistics, particularly analyses of variance, and the companion paper (WILTON et al. 1982) summarizes the bivariate and multivariate approaches to investigating intercorrelations of the activities of different enzymes.
MATERIALS AND METHODS
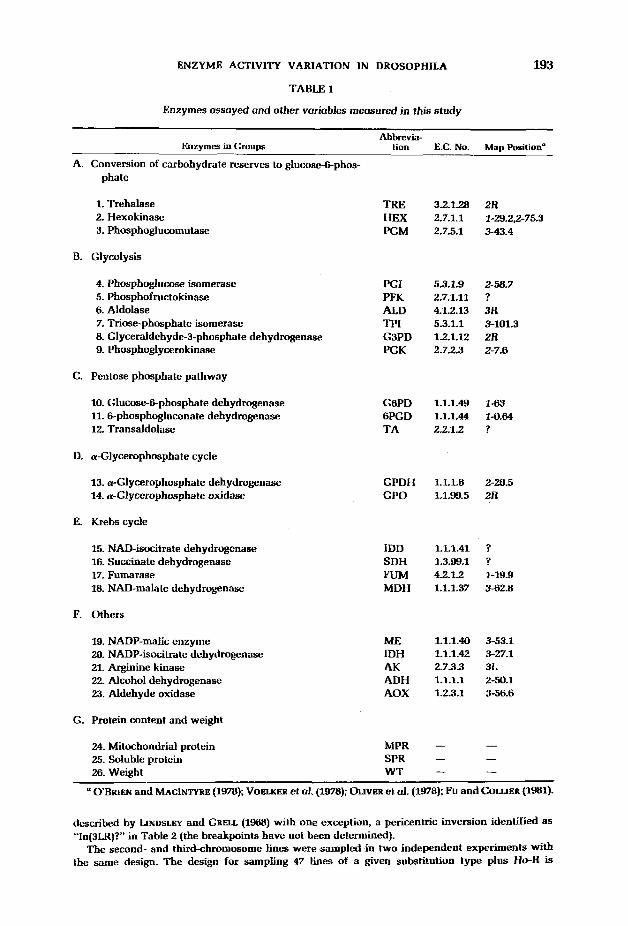
The enzymes assayed and other variables measured in this study are listed in Table 1 with their abbreviations. These enzymes were selected on the basis of convenient assay procedure, localization of the gene or gene(s) that code for the isozyme(s) and because, in most cases, their metabolic role is reasonably well understood. In addition, most of the enzymes are thought to be coded for by a single structural gene, and the list includes a number of enzymes known to be involved in flight metabolism. The latter criterion was used because one of the goals of the experiment, to be discussed in a later publication, is to determine whether genetic variation in the enzymes of flight metabolism cause or are associated with variation in the power output of the flight muscles during tethered 'flight' (see CURTSINGER and LAURIE-AHLBERG 1981).
Two sets of isogenic chromosome substitution lines were used in this study, 47 second-chromo- some lines, ih; +2/ +z; i3/i3, and 47 third-chromosome lines, i ~ / i l : i ~ / i ~ : +3/ +d, where i refers to a chromosome from a highly inbred line, Ho-R, and + refers to a chromosome from one of four natural populations within the United States (Kansas, North Carolina, Rhode Island and Wisconsin). The + but not the i chromosomes vary within a set of lines and each line is homozygous for all three major chromosomes. The construction and electrophoretic analysis of these lines have been described (LAURIE-AHLBERG et al. 1980). The karyotype of each line was determined by crossing it to a stock that is homozygous Standard for the X, second and third chromosomes and examining the salivary gland chromosomes of larvae cytologically. All three major chromosomes of Ho-R have the Standard sequence. Table 2 shows the state of origin of the chromosome for each line, the karyotype of that chromosome and the single letter abbreviation of the line that can be used to identify it in Figure 2. All of the inversions observed were of the common cosmopolitan type
ENZYME ACTIVITY VARIATION IN DROSOPHILA
TABLE 1
Enzymes assayed and other voriobles measured in th is study
193
Abbrevia- Enzymes in Groups tion E.C. No. Map Position"
A. Conversion of carbohydrate reserves to glucose-6-phos- phate
1. Trehalase 2. Hexokinase 3. Phosphoglucomutase
B. Glycolysis
4. Phosphoglumse isomerase 5. Phosphofructokinase 6. Aldolase 7. Triose-phosphate isomerase 8. Glyceraldehyde-%phosphate dehydrogenase 9. Phosphoglycerokinase
C. Pentose phosphate pathway
10. Glucose-6phosphate dehydrogenase 11.6phosphogluconate dehydrogenase 12. Transaldolase
D. a-Glycerophosphate cycle
13. a-Glycerophosphate dehydrogenase 14. a-Glycerophosphate oxidase
E. Krebs cycle
15. NAD-isocitrate dehydrogenase 16. Succinate dehydrogenase 17. Fumarase 18. NAD-malate dehydrogenase
F. Others
19. NADP-malic enzyme U). NADP-isocitrate dehydrogenase 21. Arginine kinase 22. Alcohol dehydrogenase 23. Aldehyde oxidase
G. Protein content and weight
TRE 3.2.1.28 2R
PGM 2.7.5.1 3-43.4 HEX 2.7.1.1 1-29.2.2-75.3
PGI 5.3.1.9 2-58.7 PFK 2.7.1.11 ? ALD 4.1.2.13 3R TPI 5.3.1.1 3-101.3 G3PD 1.2.1.12 2R PGK 2.7.2.3 2-7.6
G6PD 1.1.1.49 1-63 6PGD 1.1.1.44 10.64 TA 2.2.12 ?
GPDH 1.1.1.8 2-20.5 GPO 1.1.99.5 2R
IDD 1.1.1.41 ? SDH 1.3.99.1 ?
MDH 1.1.1.37 3-62.8 FUM 4.2.12 1-19.9
ME 1.1.1.40 3-53.1
AK 2.7.3.3 3L
AOX 1.2.3.1 3-56.6
IDH 1.1.1.42 3-27.1
ADH 1.1.1.2 2-50.1
- 24. Mitochondrial protein MPR - 25. Soluble protein SPR - -
- - 26. Weight WT e OBRIEN and MACINTYRE (1978); V0-m et al. (1978); OLIVER et al. (1978); Fu and Comm (1981).
described by ~ N D S L E Y and GRELL (1968) with one exception. a pericentric inversion identified as "In(3LR)?" in Table 2 (the breakpoints have not been determined).
The second- and third-chromosome lines were sampled in two independent experiments with the same design. The design for sampling 47 lines of a given substitution type plus Ho-R is

194 C. C. LAURIE-AHLBERG ET AL.
e - 5 U
c w
U a;& a z- 22 3
~
m $
2 E g i 2 g g z g z 4 - z g g $ k g g g g k z g g k g g g g e c U
4 <b<5<~--UUU,,,,,,,,,--, 5 . Y Y Y Y Y ~ 3 3 z z z a a d a d z d d d ~ a d
a 2 W
+ . U -- 2 a 4 h l 3
g 5 bc-bEb c- F t- F bc- b b c- b c- t- t- t-b t- FFt- 5: 2 ~ ~ ~ 5 ~ m ~ m ~ ~ m ~ ~ m ~ ~ ~ ~ m m ~ - ~ m E 2
Q U W a 2 b 5 < < U < - - U U U U U U , - - , , n n , , i- A 5 . Y u Y Y Y Y 3 3 z z z z z z d d d ~ ~ z d z ~ 5
i
s
c
0
- r: m D 1 < m u n w ~ c 3 z , - Y ~ Z Z 0 a ~ z m c - 3 > 3 : ~ .m
.- M
+ N 2 Z o ~ w h a m o w ~ m ~ ~ w ~ m m o e ~ m d ~ w h m ; j z N N ~ N ~ m m m m m m m m m m ~ d ~ d d ~ ~ ~ d w : cl m *- .
CL 0 c cz
L % .2 - $ 4 - C
CL. - 3
.m +- m $
5
2 z o
B g g % P i g 5% 3 ?? & U x = n a G Q -
s 5 f 2 k z g g ~ ~ ~ ~ g z ~ z k ~ ~ z ~ g k g g g ~ g
2 x <Qb5b<&5--UU,,,,--,,,,,, 5 Y Y Y Y Y u Y Y 3 3 z z d d z d a d a a a ~ d d
a, a 2 * - I + -
3 3 3 3 c u B
g g b b ~ ~ ~ t - b t - t - ~ t - t - t - c - ~ t - c - F t - ~ b t - ~ b 5: 9 ~ ~ ~ ~ 5 ~ ~ ~ ~ ~ ~ ~ ~ ~ s ~ m m ~ s ~ ~ - m 2 2 u m c
z < 5 < < < < - - - - ;j ~ Y Y Y Y Y 3 3 3 3 ~ a a a a a ~ a ~ a a ~ ~ ~
m D m m P 0 - Q l r , Mm-c.-.-3- E G 0 a m . c L o + 5 > 3 X -1
-
Z e " ~ m ~ ~ w ~ m m o e ~ m ~ ~ w h a m 0 3 ~ n ~ ;Ti2 w 3 3 3 e ~ " e + " N N N N N
+
5 .e 8 P Y Ql -s
3 B &
2 .E
$ T

ENZYME ACTIVITY VARIATION IN DROSOPHILA 195
summarized in Figure 1. The sampling took place during three partially overlapping periods of time, “blocks”. The 48 lines were divided into two “groups” of 24 at random and the two groups were sampled on different days within each block. The sampling proceeded in three stages within each block: (1) On each of 4 consecutive days, 24 lines were set up in bottles (4 bottles per line with 50 pairs of parents per bottle), group 1 lines on the 1st and 3rd days and group 2 lines on the 2nd and 4th days. (2) After progeny began emerging from the bottles (11 days after being set up), male imagoes were collected on 4 consecutive days and aged in vials. (3) After aging, 25 each of 5-, 6-, 7-, and 8-day-old males were pooled, weighed and then homogenized. The homogenizations for each block took place on 4 consecutive days, in the same order as the bottles were set up. The homogenization, sample preparation and assay procedures have been described by STAM and LAURIE-AHLBERG (1982), who also estimate the measurement errors associated with these procedures. Briefly, a set of 100 flies was homogenized gently in order to leave mitochondria intact and the suspension was centrifuged in order to pellet the mitochondria. Eighteen enzymes plus general protein were assayed from the supernatant fraction and five mitochondrial enzymes plus general protein were assayed from the resuspended pellet. One activity value for each enzyme was estimated from each homogenate. All of the activity measurements for a given enzyme were performed with frozen samples on 1 day except for PFK, which was assayed from each homogenate immediately after centrifugation because of its cold lability. Most of the assays were performed with a computer-interfaced centrifugal fast analyzer. This design gives a total of six observations per line, where each observation is made on a different set of 100 flies reared in a different set of four bottles, at a different time and homogenized independently of the other sets for that line. There was a total of 288 observations for each variable and set of chromosome substitution lines.
The model for analysis of variance is:
Ytikl = + (YI + b, + (@)q + Y e k + 8,l + (“6)c~l + eykl
where aL is the effect of the i-th block ( i = 1, 2, 3), /3, is the effect of j-th group ( j = 1, 2), (ab),, is the block-by-group interaction, yrrk is the effect of the k-th day nested within the i-th block and the j-th group ( k = 1, 2). a,, is the effect of the I-th line nested within the j-th group ( I = 1, 2, . . . , 24), (cd) ,~ is the block-by-line within group interaction and eykl is the residual. All effects are random.
RESULTS
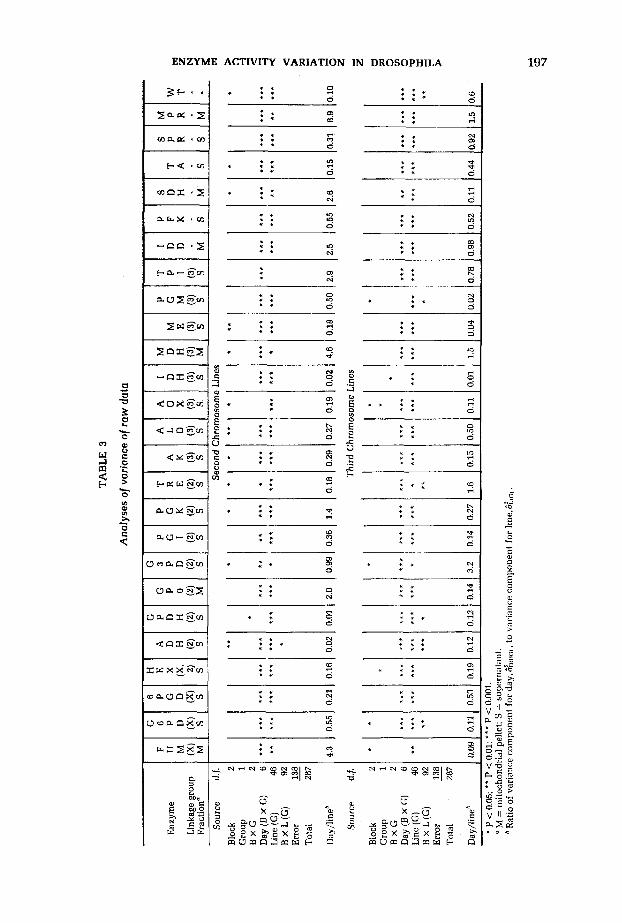
The results of the analyses of variance of the raw data (units of activity per fly) are summarized in Table 3. “Days within a cycle-by-group” and “lines within group” are significant sources of variation for nearly all of the variables in both sets of lines, whereas the other sources were not generally significant. The day effect includes differences among sets of bottles in which the flies were reared, time of rearing (e.g., different batch of culture medium), as well as the measurement error caused by variation in the efficiency of enzyme extraction among different homogenates. The relative magnitudes of the effects of days and lines can be assessed from the ratio of the variance component estimate for days over that for lines (Table 3) and from the comparison of the day and line mean ranges (Table 4). Both types of comparison show that the day effects are generally smaller than the line effects, but there is considerable variation among the enzymes in this respect. A complication in this comparison arises because of a technical problem on the first homogenization day for the first group of the second-chromosome lines, which resulted in a low degree of solubilization of the mitochondrial pellet. Therefore, the day component of variance for some of the mitochondrial enzymes and for the mitochondrial protein in second-chro- mosome lines is unusually high.
Lines are a significant source of variation of the raw activities of all 23 enzymes in both sets of lines except for TPI in second-chromosome lines. Live weight and the protein content of both supernatant and mitochondrial pellet fractions also show significant second- and third-chromosome line effects,

E X P E R I M E N T A L D E S I G N
A
B
C
Block 1
A
B
C -
Block i, Homogenizing Days
Mon. Group 1 (Lines 1-24) Tues. Group 2 (Lines 25-48) Wed. Group 1 (Lines 1-24) Thurs. Group 2 (Lines 25-48)
3
A
B
C /
4- th Line on h-th Day Within i - t h Block and j - t h Group
ADH AK ALD AOX
S e t Up 4 Bottles
C o l l e c t d d o n 4 Consecutive ~ a y s
Weigh, Homogenize & Cent r i fuge
Supernatant S o l u b i l i z e d P e l l e t 19- a1 iquo t s
G3PD TA PGK G6PD TPI PGI HEX TRE PGM IDH PFK SPR
6 a l i q u o t s
FUM GPO MDH IDD
GPDH ME 6pGD SDH MPR
FIGURE 1.-Diagram illustrating the experimental design, which involves three blocks and three stages of sampling within cach block (A, B, C).
ENZYME ACTIVITY VARIATION IN DROSOPHILA
0 * I ? ::: 8 2
8 3
a 2
8
0
* * * I 2 * *
2 * I
r( * * N * *
VI I *
cl 0 * I * * 0
CI :: 2 Lo * * N q * * * * 0
* * m * * * * ?
N
* * m * + 5 I * 0
N
cI__ ~ ~~ ~~ __ 2 2 8
8
* * 0
m * * * ? ( 1 l i e 0
? * * n '9 * * * l i *
N V 1 r4
El x m m * . r4
? g i * * * 1 ::
h E 2 e * *
m u 2 a * *
m b
s . $ * * + er m
0 I j l 0
0 * i v! 0
* * VI * I ? 0
* * 5 c,
r: m a l
4 0 W E m -E L2
$ 5 ? 0 I . : 2 0 (F1 * * h
2 * * f 2 * * - * * *
't I / 0 * * a
0 @?
m
2 7
x B
z
* * 8
4 ) i *
z I j *
8 * * .
* * * * *
3 1 * N * * *
( C l i N
0
m 't 0
* I m
* / I 1 N
* * " * * * * (0
0
* I 3
0
* * VI
? I * . * Z W X g S W I *
COaUagW * *
uaoaago, % *
* * 2 ::: B
31 N
x - -8
w dlr, o o x ~ . g x e ~ g : gY. 2.2. e s Z i g m a a m B c - a ~ 3 m ~ a m A S a
111 * I N
* I - 2
: * @?
* I
8 0 ~. L43zgz . * *
+ N @ N W ( D N ~ ~ w m m m U
w m o m a 2 N 3 N a w " 31 N t\
6 C O
&e 3
B $ 2; 3.: z : y ~ u m u _ _ l k X -.c - q 8 5 g r a u m e k - p
197
- U_ -1
'; C
0
.- - L
CI .d
8 a
f m
9 .* m 0 4-
2 s +-n S E
E & p 0 2 2 /I : :.ls ; z g .=,a
g 2 ; :: .$
e j 's 7 II ,$
m 'e
0 .z r m
r C u *.. x F
azd g * e . c
198 C. C. LAURIE-AHLBERG ET AL.
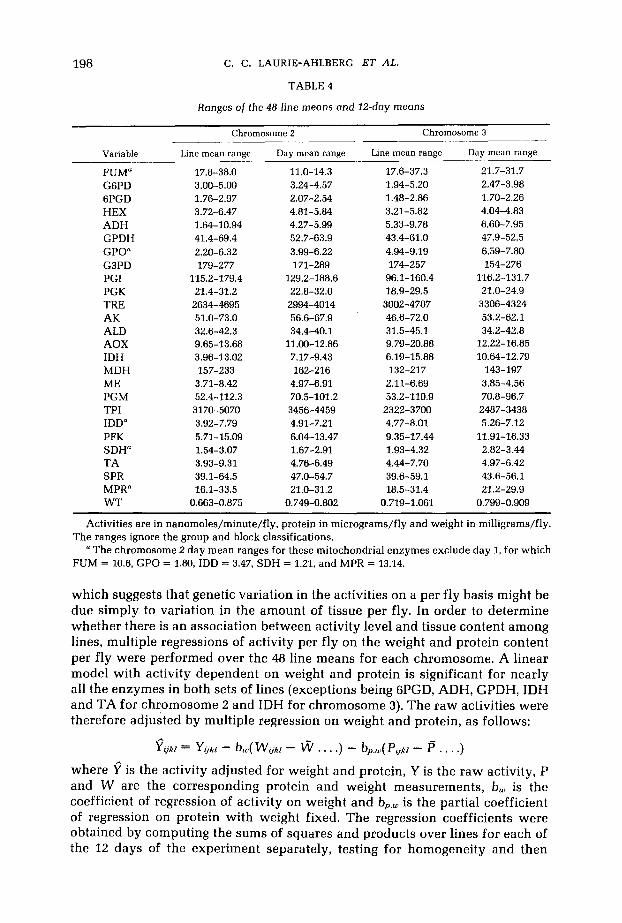
TABLE 4
Ranges of the 4 8 - h e means ond 12-day means
Chromosome 2 Chromosome 3
Variable Line mean range Day mean range Line mean range Day mean range
FUM" 17.8-38.0 11.0-14.3 17.6-37.3 21.7-31.7 1.94-5.20 2.47-3.98 G6PD 3.00-5.00 3.24-4.57
6PGD 1.76-2.97 2.07-2.54 1.48-2.86 1.70-2.26 HEX 3.72-6.47 4.81-5.84 3.21-5.82 4.04-4.83 ADH 1.64-10.94 4.27-5.99 5.33-9.78 6.60-7.95 GPDH 41.4-69.4 52.7-63.9 43.4-61.0 47.9-52.5 GPO" 2.20-6.32 3.99-6.22 4.94-9.19 6.59-7.80 G3PD 179-277 171-289 174-257 154-276 PGI 115.2-179.4 129.2-188.6 96.1-160.4 116.2-131.7
TRE 2634-4695 2994-4014 3002-4707 3306-4324 PGK 21.4-31.2 22.8-32.0 18.9-29.5 21.0-24.9
AK 51.0-73.0 56.6-67.9 46.6-72.0 53.2-62.1 ALD 32.6-42.3 34.4-40.1 31.5-45.1 34.2-42.8 AOX 9.65-13.68 11.00-12.86 9.79-20.88 12.22-16.85 IDH 3.96-13.02 7.17-9.43 6.19-15.88 10.64-12.79 MDH 157-233 162-216 132-217 143-197 ME 3.71-8.42 4.97-6.91 2.11-6.69 3.85-4.56 PGM 52.4-112.3 70.5-101.2 53.2-110.9 70.8-96.7 TPI 3170-5070 3456-4459 2322-3700 2487-3438 IDD" 3.92-7.79 4.91-7.21 4.77-8.01 5.26-7.12 PFK 5.71-15.09 6.04-13.47 9.35-17.44 11.91-16.33 SDH" 1.54-3.07 1.67-2.91 1.93-4.32 2.82-3.44 TA 3.93-9.31 4.76-6.49 4.44-7.70 4.97-6.42 SPR 39.1-64.5 47.0-54.7 39.6-59.1 43.6-56.1 MPR" 16.1-33.5 21.0-31.2 18.5-31.4 21.2-29.9 W T 0.663-0.875 0.749-0.802 0.719-1.061 0.799-0.909
Activities are in nanomoles/minute/fly, protein in micrograms/fly and weight in milligrams/fly.
a The chromosome 2 day mean ranges for these mitochondrial enzymes exclude day 1, for which The ranges ignore the group and block classifications.
FUM = 10.6, GPO = 1.80, IDD = 3.47, SDH = 1.21, and MPR = 13.14.
which suggests that genetic variation in the activities on a per fly basis might be due simply to variation in the amount of tissue per fly. In order to determine whether there is an association between activity level and tissue content among lines, multiple regressions of activity per fly on the weight and protein content per fly were performed over the 48 line means for each chromosome. A linear model with activity dependent on weight and protein is significant for nearly all the enzymes in both sets of lines (exceptions being GPGD, ADH, GPDH, IDH and TA for chromosome 2 and IDH for chromosome 3). The raw activities were therefore adjusted by multiple regression on weight and protein, as follows:
y.. A ~ k i - y . . - qki - b,( W g k i - W . . . .) - bP.,( P+i - I? . . . .) where 9 is the activity adjusted for weight and protein, Y is the raw activity, P and W are the corresponding protein and weight measurements, b, is the coefficient of regression of activity on weight and bP., is the partial coefficient of regression on protein with weight fixed. The regression coefficients were obtained by computing the sums of squares and products over lines for each of the 12 days of the experiment separately, testing for homogeneity and then

ENZYME ACTIVITY VARIATION IN DROSOPHILA
TABLE 5
Significance of the F-test of the line within group effect for raw and adjusted data and a variance component ratio, K"
199
Second chromosome lines Third chromosome lines
Raw data Adjusted data Raw data Adjusted data
Variable F-Test K F-Test K F-Test K F-Test K
FUM (l)b G6PD (1) 6PGD (1) HEX (1, 2) ADH (2) GPDH (2) GPO (2) G3PD (2) PGI (2) PGK (2) TRE (2)
ALD (3) AOX (3) IDH (3) MDH (3)
PGM (3) TPI (3) IDD (?) PFK (?) SDH (?) TA (7) SPR' MPR' WT
AK (3)
ME (3)
* * * * * * * * *** * * * * * * * * *
* * * *** * * * * * * * * * *** * * *
* * * ***
ns * * * * * * ** * * * * * * ** ***
0.13 0.14 0.16 0.60 0.36 0.37 0.35 0.42 0.42 0.40 0.48 0.55 0.55 0.93 0.93 0.50 0.53 0.53 0.26 0.37 0.27
0.10 0.09 0.11 0.52 0.18 0.22 0.43 0.35 0.46
0.13 0.10 0.25 0.46 0.42 0.48 0.39 0.35 0.43 0.67 0.16 0.20 0.49 0.85 0.84 0.17 0.08 ns 0.06 0.83 0.53 0.58 0.40 0.50 0.53 0.16 0.14 ns 0.06 0.27 0.17 0.21 0.36 0.32 0.38 0.39 0.18 0.16 0.38 0.66 0.65 0.45 0.34 0.46 0.19 0.14 0.09 0.82 0.72
t*
**t
**I
* * * * * * * * * * * * *
* * * * * * *
* * * * * * * * * *** *** *** * * * * * * * * * *** * * * * * * * * * * * * * * *
** * f *
*** *** *** * * * * * *
*** * * * * * * * * * * * *** ***
* * * ***
* * * * * * ** * * * *** * - -
ns * * * * * * * * * * * * * * * * * *
ns * * * * * *
ns * * * * * * * * * * * * * * * * * * * * * * * * * * *
* * * * * * * * *
* -
0.05 0.58 0.32 0.37 0.46 0.40 0.24 0.02 0.48 0.25 0.01 0.33 0.33 0.66 0.51 0.19 0.81 0.38 0.14 0.18 0.11 0.35 0.33 0.42 0.11 -
* P C 0.05; * * P < 0.01; * * * P < 0.001. K = &G)/(&) + &(o) + %)E); see text for definition. The chromosomal location is given in parentheses.
e Adjusted by weight only.
pooling to obtain a single pair of values. The protein concentration of the fraction (supernatant or mitochondrial pellet) from which the enzyme was assayed was used for adjustment.
The results of the analyses of variance of the adjusted data are very similar to those for the raw data. Days are significant for all the adjusted variables in both sets of lines except for GPDH in the second-chromosome experiment and HEX and IDH in the third-chromosome experiment. Table 5 provides a com- parison of the F-tests of lines for raw and adjusted variables and it also gives a variance component ratio, K, where
and where & G ) , &(GI and 6% are the variance component estimates for lines within group, block-by-line within group and error, respectively. K is the proportion of variance within a block that is attributable to lines; it is analogous to a broad-sense heritability except that here the experimental unit is a set of

200
0.-
r
IT---- ( L E - - 7--
m-- UG--
>= == -1
C. C. LAURIE-AHLBERG ET AL.
* ;r
0 a-f
jf
J
ff
fJ
=re
21.42
E
U-- O - - oc--
z-- E=
I---
(/> w z H _J
a-
J J
JJ
u)---J
a- == a-*
a-
w =;z 0 cn 0 x 0 c1F I 0
n E H I I-
cn w z H A
0 cn
K I U
x w I
6.986
J a-
& x
=I-- c)
m " 1
1
x 0 C I I
13.45
"=I==-- I -.
L T- 4.128
a F-
9.180
-$1

ENZYME ACTIVITY VARIATION IN DROSOPHILA 202
100 flies rather than a single individual. Lines lose significance after weight and protein adjustment in only four cases, MDH in the second-chromosome exper- iment and FUM, G3PD and TRE in the third-chromosome experiment. In most cases, the variance component ratio K decreases only slightly as a result of adjustment. These results indicate that the genetic effects on enzyme activity are not simply caused by variation among lines in the amount of tissue per fly. Even after adjustment of activity by weight and protein content, lines are a significant source of variation for all 23 enzymes in one or both sets of lines. Most of the variance component ratios are above 0.30 and some are extremely high. For example, 85% of the IDH activity variation within a block is attribut- able to differences among lines in the second-chromosome experiment.
The distributions of line means are approximately continuous, as shown for example in Figure 2 by the HEX and TA variation over third-chromosome lines. Only a few “outlier” lines were observed. Second-chromosome lines V and S have extremely high activities for TA, as shown in Figure 2, and two lines have “null” isozyme variants. The second-chromosome line k is null for HEX-C but, because of the contribution to activity of the other two HEX isozymes, its activity is not a great deal lower than the other lines. Third-chromosome line j has no detectable ME activity.
The line or genetic component of variance could, in principle, be partitioned into variance components for the state of origin (KA, NC, RI, WI) and the karyotype of the wild-type substituted chromosome, the allozyme type of the enzyme (when such variation occurs), the two- and three-way interactions among these sources, and the lines within a state-by-karyotype-by-allozyme type. Because of the extremely unbalanced nature of the data with respect to these sources (see Table 2 and Figure 2), it was not possible to analyze the full model. Instead, the three main sources of variation that potentially contribute to the variance among lines (states, inversions, allozymes) were analyzed separately.
When the among lines source of variation is partitioned into “states” and “lines within states”, the states source is significant in only 5 out of 46 tests for adjusted enzyme activities and is not significant for SPRO, MPRO or WT in either experiment. The enzymes showing significant state effects (at the 5% level in each case) are 6PGD in the second-chromosome experiment and AK, ALD, GPO and IDH in the third-chromosome experiment. Even for these cases, the distributions of the line means for the different states overlap extensively. The geographic origin of the chromosome does not generally contribute sub- stantially to the genetic variation of activity.
The possible importance of karyotype to the enzyme activity variation among second-chromosome lines was analyzed by simply partitioning lines into “karyotype” and “lines within karyotype”. No distinction between right and left
~ ~~
FIGURE 2.-The distributions of the line means (ignoring group) of activities adjusted by regression on weight and protein. The bar below each distribution shows the smallest magnitude of the difference between two lines that is significant at the 5% level (Tukey’s multiple comparison procedure). The numbers at each end of a distribution show the range of activity values (units are nanomoles/minute/fly after adjustment by regression on weight and protein: see text). The single letter abbreviation for each line (Table 2) is given. The AOX and HEX allozymes are given below those distributions (the allozyme numbers are ordered according to mobility, with the most cathodal forms being AOX’ and HEXS).

202 C. C. LAURIE-AHLBERG ET AL.
arm was made because no second chromosome had inversions on both arms. Only 4 of the 23 adjusted enzyme activities show a significant effect of second- chromosome karyotype: ALD at the 1% level and ME, PGK and SDH at the 5% level. Even in these cases, however, there is considerable overlap in activity among the karyotypic classes.
The third-chromosome karyotypic effects on adjusted activities were ana- lyzed by partitioning lines into “left-arm karyotype”, “right-arm karyotype”, the interaction between arms and “lines within a karyotype”. The right-arm kary- otype was significant for AOX at the 1% level and for G3PD and ME at the 5% level, but the left arm was not significant for any enzyme. The karyotypic effect on AOX activity is probably caused by an allozyme-inversion association (five of the seven Zn(3R)P chromosomes carry AOX3 and each of the three Zn(3R)C chromosomes carries AOX’). Two of the enzymes, AK and PGK, show a significant left-by-right-arm interaction, which, in both cases, seems to result from low activity of the two In(3L)P + In(3R)P chromosomes and high activity of the one Zn(3L)P + In(3R)C chromosome. In general, however, karyotypic variation contributes little to the activity variation.
Seven of the enzymes that are coded by loci on the second or third chromo- some were screened for allozyme variation by starch-gel electrophoresis. There was no electrophoretic variation for MDH or ME but second-chromosome lines varied for HEX-C, GPDH and ADH and third-chromosome lines varied for PGM and AOX. We found two allozymes (S,F) for ADH, GPDH and PGM, three allozymes for HEX-C (2, 4, and 6) and five allozymes for AOX (1-5). When the among lines source of variation for the adjusted enzyme activity is partitioned into “allozymes” and “lines within allozyme”, both components are significant (P < 0.001) for ADH and AOX, whereas only the lines within allozyme com- ponent is significant (P < 0,001) for GPDH and PGM. However, the tests for GPDH and PGM allozyme differences may not be powerful since only 6 of 48 second chromosomes are GPDH’ and only 7 of 48 third chromosomes are PGMS. The strong associations between allozymes and activity for AOX (see Figure 2) and ADH are entirely consistent with the results of our earlier experiments with the same lines (LAURIE-AHLBERG et al. 1980; MARONI et al. 1982). The allozyme component constitutes about 86% of the total line variance for ADH and about 82% of the total line variance for AOX. Both HEX-C allozymes and lines within allozyme are highly significant sources of variation of the total HEX activity, to which three major isozymes contribute (HEX-A, -B, -C). The HEX-C null line ( k ) was excluded from this analysis. Figure 2 shows that the HEX-C allozyme effect seems to be caused by the rather low activity of the four HEX-C2 lines.
The repeatability of the line effects on activity can be evaluated by comparing the line means from experiments performed at different times. Three experi- ments are of particular interest in this respect, since each involves a number of our isogenic lines and a number of enzymes. These experiments differ some- what in design, sample preparation and assay procedures as well as in the time at which the lines were sampled. The sampling for experiment 1 (LAURIE- AHLBERG et al. 1980), which included 50 each of second- and third-chromosome lines, began in April 1978 (chromosome 2) and August 1978 (chromosome 3). The sampling for experiment 2 (LAURIE-AHLBERG et al. 1981), which included 11 lines of each chromosome substitution type, began in January 1980. The sam-

ENZYME ACTIVITY VARIATION IN DROSOPHILA 203
pling for experiment 3, described in this report, began in February 1980 (chro- mosome 2) and April 1980 (chromosome 3). The partial correlations (with weight fixed) over the lines included in each pair of experiments are provided in Table 6. Most of the correlations are highly positive, indicating a high degree of repeatability of the line effects over time. Additional data showing the high repeatability of GGPD, 6PGD and ADH activities are reported elsewhere (LAU- RIE-AHLBERG et al. 1981; MARONI et al. 1982).
Additional materials describing the data set and the statistical analysis are available on request of the authors. These include a listing of the line means, the line mean distributions for each of the variables (as in Figure 2), a table summarizing the multiple regression analyses of activity on weight and protein, plots of activity on weight or protein (which demonstrate the appropriateness of linear adjustment), and tables showing the overlap in activities among state and karyotypic classes for those enzymes that showed significant state and karyotypic effects.
DISCUSSION
The results presented here confirm those of our earlier experiments with the same lines (LAURIE-AHLBERG et al. 1980, 1981) and extend them to include a number of additional enzymes. There is clearly a great deal of genetic variation among chromosomes derived from natural populations that affects enzyme activity levels. Only a small part of this variation is accounted for by variation among lines in the amount of tissue per fly. The range of line effects is, in most cases, considerably larger than the range of environmental and measurement error effects ("days" in this experiment), the line effects are approximately continuous in distribution and they are quite repeatable over time. Variation in
TABLE 6
Partial correlations between experiments
Chromosome 2 Chromosome 3 Experiment
Pair (n) 1, 2 (10) 1, 3 (46) 2, 3 (11) 1.2 (10) 1, 3 (46) 2. 3 (9) ' ~
ADH" AK ALD AOX" FUM GPDH GPO GGPD IDH ME 6PGD PGI TA
0.96* * * - - 0.73% 0.70 0.51
0.68 -
- - 0.50 - -
0.94*** - - 0.51***
0.74* * * 0.57* * * 0.42* *
-0.10
- - 0.32* -
0.98* * * 0.81* 0.82* 0.90* * 0.23 0.94* *
0.89** 0.99* * * 0.84** 0.90** 0.85** 0.95* *
0.85** - - 0.95* * * 0.87** 0.41
0.61 - - o.n5* *
0.59*** 0.81* - 0.62
0.87*** 0.97" * * 0.29 0.29 0.22 0.71 0.41** - 0.43*" 0.78* - 0.80* - 0.96* * 0.39** 0.78* - 0.90** - 0.91**
- o m *
- The partial correlations over line means between experiments conducted at different times. The
live weight means from both experiments are fixed, so the degrees of freedom for each correlation estimate = n - 4. Because of the small number of degrees of freedom for some experiment pairs, some of the high correlations are not significant.
The within-allozyme correlations are somewhat lower. For example, for experiments 1 and 3, ADHS = 0.87***, ADHF = 0.75**, AOX' = 0.50** and AOX3 = 0.77***.
* P < 0.05; * * P < 0.01: * * * P < 0.001.

204 c. C. LAURIE-AHLBERG ET AL.
the geographic origin or in the karyotype of the chromosomes generally does not contribute to the line component of variation, although these sources do appear to be of minor importance in a few cases. In contrast, allozymes make a very important contribution to the line component of variation of ADH and AOX activities, and to a lesser extent to HEX activity, but they do not contribute significantly to GPDH or PGM variation. It should be noted that the tests for differences among karyotypes, and also among allozymes for GPDH and PGM, may lack power because of the low degrees of polymorphism in these lines.
The crosses made in constructing our isogenic lines (LAURIE-AHLBERG et al. 1980) are the type that usually result in hybrid dysgenesis (KIDWELL et al. 1977), which suggests the possibility that some of the variation among lines arose by mutation in the laboratory. However, newly arisen dysgenic mutations will not generally occur as fixed differences among the lines, and should lead to instability and lack of repeatability of the line effects. The large extent of variation affecting virtually every enzyme examined as well as the high repeat- ability of the line effects on most enzymes argue against the importance of hybrid dysgenesis, but the question clearly remains open.
Many of the structural genes that code for the enzymes examined in this study have been localized in D. melanogaster (Table 1). Most of these localiza- tions are based on the mapping of electrophoretic variants, but some have been mapped only by segmental aneuploidy (TRE, G3PD, GPO, AK). In only a few cases of intensively studied gene-enzyme systems, such as ADH and GPDH, can we have a large degree of confidence that there is just one coding region that determines the primary structure of the isozyme(s) responsible for the activity measured in crude extracts. However, in most cases, the available evidence does suggest a single coding region. Several of the enzymes have null variants that give essentially no activity in crude extracts and which map to the same chromosomal region as the electrophoretic variants [GGPD, GPGD, ADH, GPDH, ME, AOX (see O'BRIEN and MACINTYRE 1978)).
If the localizations in Table 1 are assumed to represent the only coding region(s) for the respective enzyme, then the results in Table 6 provide much evidence for variation of activity modifiers that are not linked to the structural locus of the enzyme. There is significant variation among the second-chromo- some lines affecting the activities of three X-linked enzymes (FUM, G6PD and 6PGD) and six third-chromosome-linked enzymes (AK, ALD, AOX, IDH, ME and PGM). Similarly, variation among the third-chromosome lines affects the activities of two of the three X-linked enzymes (GGPD and GPGD) and 5 second- chromosome-linked enzymes (ADH, GPDH, GPO, PGI and PGK) as well as HEX activity (which is determined by three major isozymes, two of which are coded for by an X-linked locus and the other by a second-chromosome locus).
The activity variation among our isogenic lines is presently being investigated with respect to several problems such as the genetic basis of the continuous variation (the relative importance of "major" and "minor" genes), the biochem- ical basis of the activity variation (catalytic properties vs. quantity of enzyme), the specificity of the genetic effects on activity (with respect to different enzymes as well as tissue type and developmental stage) and finally, the possible physiological effects of the activity variation. Some progress has been made in analyzing the biochemical basis of the activity variation. Most of the variation in the activities of GGPD, GPGD, ME and ADH is accounted for by
ENZYME ACTIVITY VARIATION IN DROSOPHILA 205
variation in the quantity of enzyme protein estimated by immunoelectrophoresis (LAURIE-AHLBERG et al. 1981 and MARONI et al. 1982). The tissue- and stage- specificity of the effects have not yet been analyzed extensively, but our preliminary work indicates that more than one tissue is affected (GGPD and GPGD, LAURIE-AHLBERG et al. 1981, ADH and GPDH, MARONI et al. 1982) and that the effects on third instar larvae and adults are highly correlated (ADH and GPDH, MARONI et al. 1982). The experiment reported here was designed in large part to investigate the specificity of the genetic effects on the activities of different enzymes, which is discussed in detail in the companion paper (WILTON et al. 1982). Another major goal of this experiment is to determine whether variation in the activities of the enzymes involved in flight metabolism has any physiological consequences in terms of variation in the power output of the flight muscles during tethered “flight”. We therefore also measured flight parameters on contemporaneous siblings of the flies used for the enzyme activity measurements. The rationale of this approach is described by CURT- SINGER and LAURIE-ALHBERG (1981) and the results will be discussed in the next paper of that series.
We wish to thank LYNN STAM, SHIRLEY CHAO, JUSTINA WILLIAMS, FREDERICK IMMERMAN, ROSEMARY BATTEN, MONICA SHELTON, ELIZABETH REID and MARY BISCOE for their expert technical assistance. We are very grateful to F. M. JOHNSON and S. E. LEWIS for making the centrifugal fast analyzer available for our use. This work was supported by United States Public Health Service Grant GM 11546.
LITERATURE CITED
ABRAHAM, I. and W. W. DOANE, 1978
BEWLEY, G. C., 1981
Genetic regulation of tissue-specific expression of Amylase structural genes in Drosophila melanogoster. Proc. Natl. Acad. Sci. USA 75 4446-4450.
Genetic control of the developmental program of L-glycerol-3-phosphate dehydrogenase isozymes in Drosophila melanogaster: identification of a cis-acting temporal element affecting GPDH expression. Dev. Genet. 2: 113-129.
BRITTEN, R. J. and E. H. DAVIDSON, 1969 Gene regulation for higher cells: a theory. Science 165: 349-357.
CHOVNIK, A., W. GELBART, M. MCCARRON, B. OSMUND, E. P. M. CANDIDO and D. L. BAILLIE, 1976 Organization of the rosy locus in Drosophila melanogaster: evidence for a control element adjacent to the xanthine dehydrogenase structural element. Genetics 84: 233-255.
Genetic variability of flight metabolism in Drosophila melonogaster. I. Characterization of power output during tethered flight. Genetics
DAVIDSON, E. H. and R. J. BRITTEN, 1979 Regulation of gene expression: possible role of repetitive sequences. Science 204: 1052-1059.
DICKINSON, W. J., 1975 A genetic locus affecting the developmental expression of an enzyme in Drosophila melanogaster. Dev. Biol. 42: 131-140.
FELDER, M. R., 1980 Biochemical and developmental genetics of isozymes in the mouse, Mus musculus. pp. 1-68. In: Isozymes: Current Topics in Biologicol and Medical Research, Vol. 4, Edited by M. C. RATTAZZI, J. G. SCANDALIOS and G. S. WHITT. Alan R. Liss, Inc., New York.
Cytogenetic localization of the dosage sensitive regions for arginine kinase and glyceraldehyde-3-phosphate dehydrogenase in Drosophila melanogaster. Genetics 9jr: s37-38.
Hybrid dysgenesis in Drosophila melanogaster. A syndrome of aberrant traits including mutation, sterility and male recombination. Genetics
CURTSINGER, J. W. and C. C. LAURIE-AHLBERG, 1981
98 549-564.
Fu, L. J. and G. E. COLLIER, 1981
KIDWELL, M. G., J. F. KIDWELL and J. A. SVED, 1977
86 813-833.

206 C. C. LAURIE-AHLBERG ET AL.
LAURIE-AHLBERG, C. C., G. MARONI, G. C. BEWLEY, J. C. LUCCHESI and B. S. WEIR, 1980 Quantitative genetic variation of enzyme activities in natural populations of Drosophila melanogoster. Proc. Natl. Acad. Sci. USA 77: 1073-1077.
LAURIE-AHLBERG, C. C., J. H. WILLIAMSON, B. J. COCHRANE, A. N. WILTON and F. I. CHASALOW, Autosomal factors with correlated effects on the activities of the glucose-6-phosphate
Genetic variations of Drosophila melanogaster. Carnegie
Genetic control of alcohol dehydrogenase levels in Drosophila. Biochem. Genet.
Genetic variation in the
1981 and 6-phosphogluconate dehydrogenases in Drosophilo melanogaster. Genetics 99: 127-150.
Inst. Wash. 627. LINDSLEY, D. C. and E. H. GRELL, 1968
MARONI, G., 1978 16 509-523.
MARONI, G., C. C. LAURIE-AHLBERG, D. A. ADAMS and A. N. WILTON, 1982 expression of Adh in Drosophila melanogaster. Genetics. 101 431-446.
MCCARRON, M., J. O'DONNELL, A. CHOVNIK, B. S. BHULLAR, J. HEWITT and E. P. M. CANDIDO, 1979 Organization of the rosy locus in Drosophila melanogaster: further evidence in support of a CIS-acting control element adjacent to the xanthine dehydrogenase structural element. Genetics
Genetic and biochemical basis of enzyme activity variation in natural populations. I. Alcohol dehydrogenase in Drosophila melanogaster. Genetics 89:
O'BRIEN, S. J. and R. J. MACINTYRE, 1978 Genetics and biochemistry of enzymes and specific proteins of Drosophila pp. 396-551. In: The Genetics and Biology of Drosophila, Vol. 2a, Edited by M. ASHBURNER and T. R. F. WRIGHT. Academic Press, New York.
Genetic and biochemical aspects of trehalase from Drosophila melanogaster. Biochem. Genet. 16 927-940.
91: 275-293.
MCDONALD, J. F. and F. J. AYALA, 1978
371-388.
OLIVER, M. J., R. E. HUBER and J. H. WILLIAMSON, 1978
PAIGEN, K., 1979 Acid hydrolases as models of genetic control. Ann. Rev. Genet. 13: 417-466.
SCANDALIOS, J. G. and J. A. BAUM, 1982 Regulatory gene variation in higher plants. Adv. Genet. 21: 347-370.
STAM, L. and C. C. LAURIE-AHLBERG, 1982 A semi-automated procedure for the assay of 23 enzymes from Drosophila melanogaster. Insect Biochem. In press.
THOMPSON, J. N., M. ASHBURNER and R. C. WOODRUFF, 1977 Presumptive control mutation for alcohol dehydrogenase in Drosophila melanogaster. Nature 270 363.
VOELKER, R. A., C. H. LANGLEY, A. J. LEIGH-BROWN and S. OHNISHI, 1978 New data on allozyme loci in Drosophila melanogoster. Drosophila Inform. Serv. 53: 200.
WILSON, A. C., 1976 Gene regulation in evolution. pp. 225-234. In: Moleculor Evolution. Edited by F. j. AYALA. Sinauer Assoc., Inc., Sunderland, MA.
WILTON, A. N., C. C. LAURIE-AHLBERG, T. H. EMIGH and J. W. CURTSINGER, 1982 Naturally occurring enzyme activity variation in Drosophila melanogaster. 11. Relationships among enzymes. Genetics 102 207-221.
Corresponding editor: D. L. HARTL