naval postgraduate schoolfaculty.nps.edu/hcschram/docs/12mar_neboshynsky.pdf · naval postgraduate...
TRANSCRIPT
NAVAL
POSTGRADUATE
SCHOOL
MONTEREY, CALIFORNIA
THESIS
This thesis was performed at the MOVES Institute Approved for public release; distribution is unlimited
EXPERTISE ON COGNITIVE WORKLOADS AND PERFORMANCE DURING NAVIGATION AND TARGET
DETECTION
by
Christopher M. Neboshynsky
March 2012
Thesis Advisor: Quinn Kennedy Thesis Co-Advisor: Ji Hyun Yang Second Reader: Harrison Schramm

THIS PAGE INTENTIONALLY LEFT BLANK
i
REPORT DOCUMENTATION PAGE Form Approved OMB No. 0704–0188 Public reporting burden for this collection of information is estimated to average 1 hour per response, including the time for reviewing instruction, searching existing data sources, gathering and maintaining the data needed, and completing and reviewing the collection of information. Send comments regarding this burden estimate or any other aspect of this collection of information, including suggestions for reducing this burden, to Washington headquarters Services, Directorate for Information Operations and Reports, 1215 Jefferson Davis Highway, Suite 1204, Arlington, VA 22202–4302, and to the Office of Management and Budget, Paperwork Reduction Project (0704–0188) Washington DC 20503.
1. AGENCY USE ONLY (Leave blank)
2. REPORT DATE
March 2012
3. REPORT TYPE AND DATES COVERED
Master’s Thesis
4. TITLE AND SUBTITLE Expertise on Cognitive Workloads and
Performance During Navigation and Target Detection
5. FUNDING NUMBERS
6. AUTHOR(S) Christopher M. Neboshynsky
7. PERFORMING ORGANIZATION NAME(S) AND ADDRESS(ES)
Naval Postgraduate School Monterey, CA 93943–5000
8. PERFORMING ORGANIZATION REPORT NUMBER
9. SPONSORING /MONITORING AGENCY NAME(S) AND ADDRESS(ES)
N/A
10. SPONSORING/MONITORING AGENCY REPORT NUMBER
11. SUPPLEMENTARY NOTES The views expressed in this thesis are those of the author and do not reflect the
official policy or position of the Department of Defense or the U.S. Government. IRB Protocol number NPS.2012.0012-IR-EP6-A.
12a. DISTRIBUTION / AVAILABILITY STATEMENT
Approved for public release; distribution is unlimited
12b. DISTRIBUTION CODE
A
13. ABSTRACT (maximum 200 words)
Today’s military pilots are required to perform multiple tasks simultaneously, including maintaining control of the aircraft, navigating, communicating, and detecting targets. Mental workload may affect a pilot’s ability to effectively learn to manage these tasks. Studies have shown that there are certain involuntary, physiological changes in eye gaze patterns, such as blink rate, frequency of fixations, and saccade rate that indicate increased mental workload. We hypothesize that experienced pilots, defined by total flight hours, would show more efficient eye scan patterns (higher frequency of fixations, lower dwell durations, and higher frequency of saccades per minute) during simulated tasks that required navigation and target detection and identification (tD&I). This would therefore lead to better performance in tD&I tasks.
Fourteen active duty military pilots completed three different scenarios while operating the flight controls in a helicopter flight simulator: overland navigation, tD&I while on autopilot, and tD&I while completing overland navigation. Eyetracking data were collected while the pilots completed the scenarios. Flight experience did not correlate to scan pattern or task performance. It did, however, show an interaction with cognitive workload as judged by blink rate. Results indicate that implementing eyetracking information into current aviation training programs could improve training effectiveness and efficiency.
14. SUBJECT TERMS Navigation, target detection, identification, expertise, pilot, flight,
experience
15. NUMBER OF PAGES
143
16. PRICE CODE
17. SECURITY CLASSIFICATION OF REPORT
Unclassified
18. SECURITY CLASSIFICATION OF THIS PAGE
Unclassified
19. SECURITY CLASSIFICATION OF ABSTRACT
Unclassified
20. LIMITATION OF ABSTRACT
UU
NSN 7540–01–280–5500 Standard Form 298 (Rev. 2–89) Prescribed by ANSI Std. 239–18

ii
THIS PAGE INTENTIONALLY LEFT BLANK
iii
Approved for public release; distribution is unlimited
EXPERTISE ON COGNITIVE WORKLOADS AND PERFORMANCE DURING NAVIGATION AND TARGET DETECTION
Christopher M. Neboshynsky Lieutenant, United States Navy
B.S., United States Naval Academy, 2004
Submitted in partial fulfillment of the requirements for the degree of
MASTER OF SCIENCE IN MODELING, VIRTUAL ENVIRONMENTS, AND SIMULATION (MOVES)
from the
NAVAL POSTGRADUATE SCHOOL March 2012
Author: Christopher M. Neboshynsky
Approved by: Quinn Kennedy Thesis Advisor
Ji Hyun Yang Thesis Co-Advisor
Harrison Schramm Second Reader
Chris Darken Chair, MOVES Academic Committee

iv
THIS PAGE INTENTIONALLY LEFT BLANK
v
ABSTRACT
Today’s military pilots are required to perform multiple tasks simultaneously,
including maintaining control of the aircraft, navigating, communicating, and
detecting targets. Mental workload may affect a pilot’s ability to effectively learn
to manage these tasks. Studies have shown that there are certain involuntary,
physiological changes in eye gaze patterns, such as blink rate, frequency of
fixations, and saccade rate that indicate increased mental workload. We
hypothesize that experienced pilots, defined by total flight hours, would show
more efficient eye scan patterns (higher frequency of fixations, lower dwell
durations, and higher frequency of saccades per minute) during simulated tasks
that required navigation and target detection and identification (tD&I). This would
therefore lead to better performance in tD&I tasks.
Fourteen active duty military pilots completed three different scenarios
while operating the flight controls in a helicopter flight simulator: overland
navigation, tD&I while on autopilot, and tD&I while completing overland
navigation. Eyetracking data were collected while the pilots completed the
scenarios. Flight experience did not correlate to scan pattern or task
performance. It did, however, show an interaction with cognitive workload as
judged by blink rate. Results indicate that implementing eyetracking information
into current aviation training programs could improve training effectiveness and
efficiency.

vi
THIS PAGE INTENTIONALLY LEFT BLANK

vii
TABLE OF CONTENTS
I. INTRODUCTION ............................................................................................. 1 A. PROBLEM STATEMENT ..................................................................... 1 B. PURPOSE OF THE THESIS ................................................................ 2 C. RESEARCH QUESTIONS ................................................................... 3
D. HYPOTHESES ..................................................................................... 4 E. THESIS ORGANIZATION AND TABLE OF CONTENTS .................... 5
II. BACKGROUND .............................................................................................. 7 A. INTRODUCTION .................................................................................. 7
B. ASSESSMENT OF WORKLOAD ........................................................ 8 1. Performance Measures ........................................................... 8 2. Subjective Measures ............................................................. 10
a. Cooper-Harper ............................................................. 11 b. SWAT ........................................................................... 11
c. NASA-TLX .................................................................... 11 3. Psychophysiological Measures ............................................ 12
a. Brain Activity ............................................................... 12 b. Cardiac and Galvanic Skin Response ....................... 13 c. Eye Tracking ................................................................ 14
4. Secondary Task Measures .................................................... 17
C. NAVIGATION ..................................................................................... 17 1. Confidence of Navigation ...................................................... 18 2. Navigation Methods ............................................................... 19
a. Maintenance ................................................................ 20 b. Repair ........................................................................... 20
3. Navigation and Workload ...................................................... 21
III. METHODOLOGY .......................................................................................... 23 A. INTRODUCTION ................................................................................ 23
1. Overview of the Tasks ........................................................... 23 B. PARTICIPANTS ................................................................................. 25
C. EQUIPMENT ...................................................................................... 26
1. Hardware ................................................................................ 26
a. Computers ................................................................... 26 b. Physical Setup ............................................................ 28
2. Software.................................................................................. 30 D. SCENARIOS ...................................................................................... 31
1. Practice Scenario ................................................................... 31
2. Scenario 2–Navigation without Targets ............................... 31 3. Scenario 3–Navigation and Target Detection and
Identification .......................................................................... 32 4. Scenario 4–Target Detection and Identification on Auto-
Pilot ......................................................................................... 32
viii
E. MEASURES ....................................................................................... 32 1. Surveys ................................................................................... 32
a. Demographic ............................................................... 32
b. Pre/Post-Experiment ................................................... 33 2. Data Collection ....................................................................... 33 3. Procedure ............................................................................... 34
IV. RESULTS AND DATA ANALYSIS ............................................................... 35 A. DATA PREPARATION / PRELIMINARY ANALYSIS ........................ 35
1. Data Preparation .................................................................... 35 a. Blink Data .................................................................... 36 b. Saccade Data ............................................................... 36
c. Fixation Data ............................................................... 36 d. Scan Pattern Data ....................................................... 37 e. Eye Scan Efficiency .................................................... 37
f. Target Detection Data ................................................. 38 2. Preliminary Analysis ............................................................. 39
B. HYPOTHESIS TESTING .................................................................... 40 1. Hypothesis One ..................................................................... 40 2. Hypothesis Two ..................................................................... 44
a. Navigation .................................................................... 44 b. Target Detection .......................................................... 45
3. Hypothesis 3 .......................................................................... 45
V. DISCUSSION, CONCLUSION, AND RECOMMENDATIONS ...................... 47
A. DISCUSSION ..................................................................................... 47 1. Hypothesis 1 .......................................................................... 47 2. Hypothesis 2 .......................................................................... 49
3. Hypothesis 3 .......................................................................... 50 4. Benefits of the Study ............................................................. 51
B. CONCLUSION ................................................................................... 52 C. RECOMMENDATIONS ...................................................................... 53
1. Future Work ............................................................................ 53
a. Pupil Data .................................................................... 53 b. Use Fleet and Training Squadrons ............................ 53
c. Allow Full Flight Control ............................................. 54 2. Training Applications ............................................................ 55
APPENDIX A. RATING SCALES ........................................................................... 57
APPENDIX B. SCENARIO CHARTS ..................................................................... 61
APPENDIX C. DATA FIGURES/TABLES .............................................................. 65
APPENDIX C. SUMMARY STATISTICS ................................................................ 79
APPENDIX D. APPROVED IRB PROTOCOL........................................................ 81
APPENDIX E. RECRUITMENT E-MAIL ................................................................. 99
APPENDIX F. SUBJECT CHECKLIST ................................................................ 101
ix
APPENDIX G. WELCOME SCRIPT ..................................................................... 103
APPENDIX H. DEMOGRAPHIC SURVEY ........................................................... 105
APPENDIX I. EYE SCAN CALIBRATION SCRIPT .............................................. 109
APPENDIX J. EQUIPMENT FAMILIARIZATION SCRIPT ................................... 111
APPENDIX K. PRE/POST-FLIGHT SURVEY ...................................................... 113
LIST OF REFERENCES ........................................................................................ 119
INITIAL DISTRIBUTION LIST ............................................................................... 123

x
THIS PAGE INTENTIONALLY LEFT BLANK
xi
LIST OF FIGURES
Yerkes-Dodson Law (After Yerkes & Dodson, 1908)............................ 9 Figure 1. Friendly Downed Aircraft and Enemy SAM Launcher......................... 25 Figure 2. Cockpit Setup ..................................................................................... 29 Figure 3. Overhead Cockpit Arrangement ......................................................... 30 Figure 4. Increasing Trend of Saccades per Minute by Ranked Experience Figure 5.
Across All Scenarios. .......................................................................... 41 Distribution of Dwell Times ................................................................. 42 Figure 6. Comparison by Scenario of Blinks per Minute vs. Ranked Figure 7.
Experience ......................................................................................... 46 Cooper-Harper Rating Scale (From Cooper & Harper, 1969) ............. 57 Figure 8. Scenario 2 – Navigation Only ............................................................. 61 Figure 9.
Scenario 3 – Navigation and Target Detection and Identification ....... 62 Figure 10. Scenario 4 – Target Detection and Identification on Auto-Pilot .......... 63 Figure 11. Total Flight Hours vs. Overland Hours Correlation ............................. 65 Figure 12. Multivariate Overall Median Dwell Times, Overall Mean Fixations, Figure 13.
Ranked Experience ............................................................................ 67 Saccades per Minute vs. Total Fixations ............................................ 68 Figure 14. Multivariable Fixation Counts (by Location), Rank.............................. 69 Figure 15. Multivariate Median Fixation Times (by Location), Rank .................... 70 Figure 16. Bivariate Trends of Ranked Experience vs. Areas of Fixation per Figure 17.
Scenario ............................................................................................. 71 Multivariate Navigation RMS Error, Median Dwell, Fixation Count, Figure 18.
Saccades per Minute .......................................................................... 72 Fit Model of Navigation RMS Error with Fixation Count, Median Figure 19.
Dwell Time, Saccades per Minute, and Associated Interactions ........ 73 Scenario 3 True Positive Target Detection with Fixation Count, Figure 20.
Median Dwell Time, Saccades per Minute, and Associated Interactions ......................................................................................... 74
Scenario 4 True Positive Target Detection with Fixation Count, Figure 21.Median Dwell Time, Saccades per Minute, and Associated Interactions ......................................................................................... 75
Bivariate Fit of Blinks per Minute to Ranked Experience by Figure 22.Scenario ............................................................................................. 76
ANOVA of Blinks per Minute by Scenario ........................................... 77 Figure 23. Summary Statistics Across All Scenarios ........................................... 79 Figure 24.

xii
THIS PAGE INTENTIONALLY LEFT BLANK
xiii
LIST OF TABLES
Table 1. Matrix for Assessing Navigational Skills (From Sullivan, 2010) .......... 18 Table 2. Participant Demographics .................................................................. 26 Table 3. Viewing Angles from Pilot’s Seat ........................................................ 30 Table 4. SWAT (From Proctor & Van Zandt, 2008; Megaw, 2005) ................... 58
Table 5. NASA-TLX Rating Scale (From Hart, 1998) ....................................... 58 Table 6. CSV Table Fields................................................................................ 60 Table 7. Target Detection Matrix ...................................................................... 66

xiv
THIS PAGE INTENTIONALLY LEFT BLANK

xv
LIST OF ACRONYMS AND ABBREVIATIONS
CSV Comma-Separated-Value
CWL Cognitive Workload
EEG Electroencephalogram
ERP Event-related Brain Potential
IP Instrument Panel
MWL Mental Workload
NASA TLX National Aeronautics and Space Administration Task Load Index
OTW Out the Window
RMS Root-Mean-Square
SAM Surface-to-Air Missile
SWAT Subjective Workload and Assessment Technique
TERP Task Evoked Pupillary Response
WL Workload

xvi
THIS PAGE INTENTIONALLY LEFT BLANK

xvii
ACKNOWLEDGMENTS
First and foremost, I would like to thank my family who have been a
source of support and encouragement as I ventured to Monterey to further my
education. To my mother, whom I must thank for instilling in her children the
notion that being able to write intelligently is a direct reflection of oneself, and for
keeping me on track by asking how my thesis was coming every month. To my
father, who has always been an inspiration and a role model, as shown by me
following his example 30 years later.
Thank you to Jesse Huston and Michael Day, without whom the
experiment could not have taken flight. Your expertise and knowledge with the
systems allowed us to gain valuable data and information that will provide the
basis for many future works.
Lastly, a special thanks to my advising team, Dr. Quinn Kennedy, Dr. Ji
Hyun Yang, and CDR Harrison Schramm, USN. Dr. K, thank you for taking me
on and guiding me through the process to create an intelligent and worthwhile
thesis. Dr. Yang, thank you for showing me how to analyze, what to analyze,
and ensuring that I stayed on track and did not waste time analyzing the data in
ways that would not be productive. Lastly, CDR Schramm, from the wardroom to
the classroom, thank you for being a friend and a mentor. I’ve learned a lot from
you in the past 4 to 5 years that I will take with me back to the fleet and beyond.

xviii
THIS PAGE INTENTIONALLY LEFT BLANK
1
I. INTRODUCTION
A. PROBLEM STATEMENT
Operating in the “information age” makes the ability to perform multiple
tasks simultaneously a necessary skill. While selection and training focus on this
ability, it is keenly critical for military aviators to perform multiple tasks in a time-
pressured environment. Single seat aviators are responsible for all aspects of a
mission from before takeoff until after they land. Crew aircraft have similar
challenges, although the workload is now shared between multiple members.
Cognitive workload has been determined to affect how well pilots are able to do
multi-tasking.
Cognitive workload defined as the combined interactions of task
demands/difficulty, operator workload, other stressors, and primary task
performance (Megaw, 2005). Cognitive workload itself can be tracked and
monitored with multiple methods. First, performance-based measures such as
adherence to a course or number of correct responses quantify how well an
individual performs with an increase in task load. Alternately, subjective
measures can be acquired simply by asking individuals what they are thinking or
how they feel about their workload. While important, this approach is subjective
and may not accurately represent the cognitive workload of the individual. Lastly,
there are physiological markers, which are universal, that can identify when an
individual faces an increase in mental workload (MWL). Some of these markers
are brainwaves, galvanic skin response, heart rate, pupil diameter and
dilation/contraction rates, and blink data (Jessee, 2010; Megaw, 2005).
Eye behavior generally has been the subject of many studies of mental
workload (Jessee, 2010; Fong et al., 2011; Sibley et al., 2011; Marshall, 2007),
which can be converted to an objective and measurable index. Using eye
tracking technology to observe the movements of the eyes, we are able to relate
how much of an increase there may be on an individual’s cognitive load when

2
given multiple tasks to accomplish. What used to require various invasive
methods, the technology now exists to give incredibly accurate (±1mm
translation, ±1º rotational) results on an individual without being invasive at all.
The equipment that will be utilized has no effect on the individuals, and other
than knowing the equipment is there, the participant has no interaction with it.
This allows for more pure data collection by decreasing the amount of random
variability introduced by knowledge of equipment and the inherent discomfort or
distractions of wearing it for any extended period.
Our a priori expectation is that as an individual’s experience and skills
increase, the resultant mental workload that they experience should decrease
(Sibley et al., 2011). Additionally, expert pilots tend to have a more efficient
visual scan pattern than novice pilots (Sullivan, 2010). Previous work has shown
that experienced pilots, as defined by flight hours, have more refined and efficient
scan patterns that allow them to be able to accomplish difficult tasks (Kasarskis
et al., 2001; Starkes & Allard, 1993; Sullivan, 2010). They have more fixations
(pauses in eye movement to allow visual intake), shorter durations on each
fixation, and more saccades (rapid, simultaneous movements of both eyes to
fixate on a common focus). A more efficient scan pattern presumably would
decrease cognitive load. Additionally, faster scan times mean that pilots spend
less time obtaining information from their instruments and therefore have more
attention to devote to the tasks of overland navigation and target detection. Does
this refined scan pattern transfer over into a reduced cognitive workload for the
pilot?
B. PURPOSE OF THE THESIS
Currently, it is suspected that expertise has an impact on scan patterns
and performance across combination tasks, but this impact is not quantified.
This thesis aimed to fill in these important gaps in knowledge by assessing
performance and measuring scan patterns and, by implication, workload, while
navigating an aircraft in a mountainous region, locate and identify targets of
3
interest, and a combination of the two. While participants completed the tasks,
their visual scan and basic eye characteristics were captured in real time via
eyetracking. They also completed surveys prior to and after each scenario in
which they indicate the level of perceived task difficulty at each waypoint. Finally,
participants completed a demographic survey that asked about relevant flight
experience information. Thus, we used performance-based, objective, and
subjective objective measures of cognitive workload across the three tasks:
Performance based measure: adherence to the given route and
ability to detect (find along the route) and correctly identify (friend or
foe) various contacts along the flight route
Objective cognitive workload data (scan pattern, saccade rate,
fixation data)
Subjective cognitive workload data (from pre- and post-surveys)
Flight expertise is commonly measured by total flight hours. However, a
more useful and nuanced measure of task-specific expertise may be visual scan
pattern. Therefore, we used two measures of expertise in analyzing the data:
total flight hours and eye scan pattern. Finally, because subjective reports of
cognitive workload can be inaccurate, we will compare the subjective surveys to
the objective eye scan data. If it is possible to determine how an individual
adapts to the change in tasks, and a corresponding change in performance, task
saturating situations could be anticipated and, in some cases, mitigated. By
identifying when an individual reaches a threshold level of experience, measured
by physiological factors such as those studied here, the military could potentially
increase training effectiveness by tailoring syllabi focusing on individual tasks.
C. RESEARCH QUESTIONS
Does self-reported expertise, measured in total flight hours, predict
eye scan pattern, measured by fixations, saccades, and dwell
4
times, across the three tasks of Navigation, Target Detection &
Identification, and Navigation and Target Detection & Identification?
Is expertise associated with less cognitive workload across the
three tasks of Navigation, Target Detection & Identification, and
Navigation and Target Detection & Identification?
Can eye scan be used to predict performance?
D. HYPOTHESES
1. H0: There is no significant correlation between total flight hours
and eye scan patterns in the Navigation, Target Detection, and Navigation &
Target Detection tasks.
HA: More experienced pilots will have more saccades, shorter and more
fixations, more fixations on salient instruments and stimuli than inexperienced
pilots.
2. H0: There is no significant correlation between eye scan pattern
and performance in the Navigation, Target Detection, and Navigation & Target
Detection tasks.
HA: Pilots with more efficient eye scan patterns (more saccades, shorter
and more fixations, fixations on salient instruments and stimuli) will perform
better on the navigation (by adherence to the given course and waypoints), task
detection (more Correct Detections versus Incorrect and Missed Detections), and
combination tasks.
3. H0: Regardless of expertise, there will be no difference in blink
rates across scenarios.
HA: Pilots with more experience will have a higher blink rate than pilots
with less experience.

5
E. THESIS ORGANIZATION AND TABLE OF CONTENTS
Chapter I: Introduction. This chapter describes the problem, lists
the research and exploratory questions, presents the hypotheses,
and describes the scope and benefits of the study.
Chapter II: Background. This chapter will provide a literature
review of previous work in the field. The review includes current
work on cognition, attention, types of workloads, and different
methods of measuring an individual’s workload while performing
tasks.
Chapter III: Methodology. This chapter describes how the research
team designed the experiment, including participant selection,
experiment setup, procedures, and equipment configuration.
Chapter IV: Results and Data Analysis. This chapter will analyze
the data collected and present the results and how they apply to the
given research questions and hypotheses.
Chapter V: Discussion, Conclusion, and Recommendations. This
chapter will look at the implications of the study and possible future
work that can come from it.
Appendix A: Rating Scales. This appendix contains the rating
scales that were referenced for the subjective portions of the
experiment.
Appendix B: Data Figures/Tables. This appendix contains the
tables and statistical figures that are not placed in the body of the
text.
Appendix C: Summary Statistics. This appendix contains a
summary of the statistical information from the data. Individual

6
performance is not included, nor are other divisions in the data. If
there were divisions, the statistic is for the overall set.
Appendix D: Approved IRB Protocol. This appendix contains the
submitted and approved Institutional Review Board Protocol for the
experiment.
Appendix E: Recruitment E-mail. This appendix contains the e-
mail sent to the students, staff, and faculty of the Naval
Postgraduate School requesting participants for the experiment.
Appendix F: Subject Checklist. This appendix contains a checklist
used for each participant to ensure consistency between volunteers
and verify that all necessary steps have been taken prior to, during,
and after the experiment.
Appendix G: Welcome Script. This appendix contains a short
explanation for the participant about how the experiment will
progress.
Appendix H: Eye Scan Calibration Script. This appendix contains
the script that we used to set up and calibrate the face tracking
equipment.
Appendix I: Equipment Familiarization Script. This appendix is
used during the Practice Scenario in order to allow the volunteer to
understand the equipment and the controls.
Appendix J: Demographic Survey. This appendix allowed the
researchers to gather demographic information from the
participants regarding various aspects of their experience.
Appendix K: Pre/Post-Flight Survey. This appendix is the survey
given to each participant before and after each scenario.
7
II. BACKGROUND
A. INTRODUCTION
This thesis focuses on how a pilot performs when presented with different
tasks simultaneously. Even in multi-piloted aircraft such as helicopters, the
workload inside the cockpit consists of many tasks occurring simultaneously.
Early in training new pilots are trained to “Aviate. Navigate. Communicate.”
This rule helps prioritize when task loading becomes considerable. Most
importantly, the job of the pilot is to keep the aircraft in the air. Second,
knowledge of where the aircraft is and where it is going is vital to mission
success. Lastly, but not to downplay its importance, communication allows the
pilot to send and receive information and coordinate actions. Simply put, failing
to navigate or communicate may possibly lead to disaster whereas failing to
aviate will.
The aviate and navigate portion of this rule have large visual workloads as
the pilot scans the cockpit to monitor aircraft performance and parameters, and
scans out the window to maintain situational awareness of his location. The scan
pattern is also taught early in aviation training and each pilot develops their own
pattern as they acquire hours in the cockpit. In the beginning, the scan is
inefficient as it has long dwell times, less fixations, and a less refined “flow”
around the cockpit than those with more experience (Kasarskis et al., 2001;
Sullivan, 2010). According to Sullivan, experts take less time to take in the
salient details in a scene, shifting their gaze more frequently and overlapping
successive scans in order to create a finer mental picture of their environment.
Additionally, less experienced pilots will fixate on less salient features while
taking longer to encode and process what their seeing in order to understand
their respective situations.
There are various methods of detecting and measuring changes in
cognitive workload. We examined previous work on attention, vigilance,
8
cognition, multitasking, and the ways in which these combine to give an
individual the situational awareness, or sight picture, of what is going on during
navigation, target detection, or the combination of the two. Different methods
exist for measuring workload of an individual, namely performance, subjective,
and physiological. By using all three of these in the research, it is possible to
correlate not only one’s actual performance, but also their perceived
performance. Technology today has progressed to the point where it is possible
to measure an individual’s workload empirically without any imposing equipment
that may have an effect on the data. To be able to assess an individual’s
cognitive workload in real time and detect visual scan patterns associated with
differing cognitive loads gives the potential for tailored training that can improve
performance and maximize and throughput.
B. ASSESSMENT OF WORKLOAD
Proctor and Van Zandt (2008) define workload as “an estimate of the
cognitive demands of an operator’s duties.” In order to explore workload, it is
necessary to define precisely the tasks and benchmarks. Empirical methods for
measuring workload include primary task, subjective measures, secondary task,
and physiological (Proctor & Van Zandt, 2008; Megaw, 2005). Analytical
methods exist as well, defined similarly in the same sources; however, these are
often used early in the development of a system to predict behavior. As such,
only the empirical methods will be reviewed and used in this research.
1. Performance Measures
Performance measures of workload, also known as primary-task
measures, are those that measure how well an individual performs a task.
Performance and workload are, in general, not linearly related. Instead, with
workload on the x-axis, they typically follow an inverted “U” shape, commonly
described as the Yerkes-Dodson law (Aral et al., 2007; Proctor & Van Zandt,
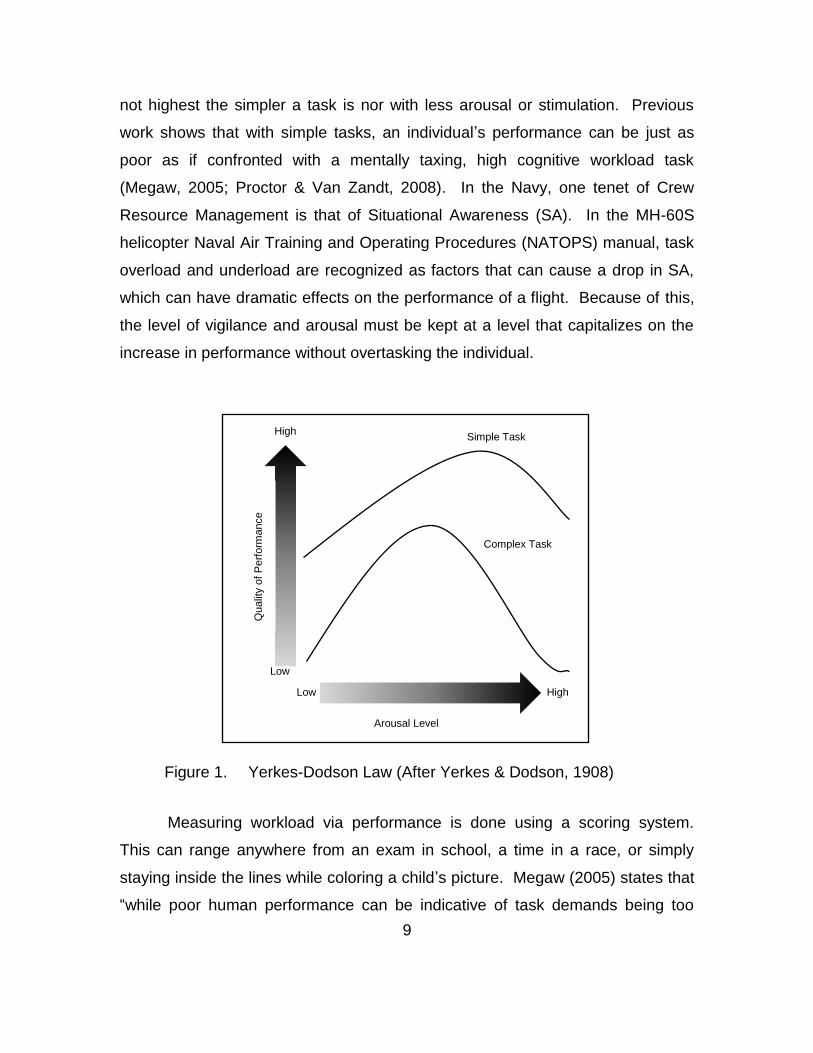
2008). Shown in Figure 1, the Yerkes-Dodson Law states that performance is
9
not highest the simpler a task is nor with less arousal or stimulation. Previous
work shows that with simple tasks, an individual’s performance can be just as
poor as if confronted with a mentally taxing, high cognitive workload task
(Megaw, 2005; Proctor & Van Zandt, 2008). In the Navy, one tenet of Crew
Resource Management is that of Situational Awareness (SA). In the MH-60S
helicopter Naval Air Training and Operating Procedures (NATOPS) manual, task
overload and underload are recognized as factors that can cause a drop in SA,
which can have dramatic effects on the performance of a flight. Because of this,
the level of vigilance and arousal must be kept at a level that capitalizes on the
increase in performance without overtasking the individual.
Yerkes-Dodson Law (After Yerkes & Dodson, 1908) Figure 1.
Measuring workload via performance is done using a scoring system.
This can range anywhere from an exam in school, a time in a race, or simply
staying inside the lines while coloring a child’s picture. Megaw (2005) states that
“while poor human performance can be indicative of task demands being too
Low
Low High
High
Arousal Level
Qualit
y o
f P
erf
orm
ance
Simple Task
Complex Task
10
high, acceptable performance does not necessarily reflect task demands.”
Because of this, if one is to use performance measures to assess workloads, it is
best to use multiple measures (Proctor & Van Zandt, 2008). Different measures
of performance measure different aspects of workload. If we were to use just
one, there would be a hole in the data that could lead to incorrect assumptions
and conclusions.
With respect to the scenarios presented to our participants, we expect that
performance (adherence to assigned route and quality of target detection) will be
higher in the scenarios in which these two tasks individually are the sole tasks
being asked of the participant. When combined into one scenario, the mental
workload will have to be allocated accordingly in order to complete both tasks.
Depending on the individual, they may give more attention to the target detection
and identification at the expense of the navigation.
2. Subjective Measures
Subjective measures of performance are based on the opinions and
feelings of the individuals immediately after the completion of their task. As such,
these methods are subject to biases, such as hindsight (Pezzo, 2011), mood
congruent (Mayer & Bower, 1985), and egocentricity (Epley et al., 2004; Fellner
et al., 2004) and have certain shortcomings when it comes to using one as a sole
measure of workload. Subjective measures include rating scales and
questionnaires. Proctor and Van Zandt (2008) point out three issues with using
subjective measures:
They may not be sensitive to aspects of task environment that
affect primary-task performance,
Operators may confuse perceived difficulty with perceived
expenditure of effort,
11
Many factors that determine workload are inaccessible to conscious
evaluation (such as ability to compartmentalize, prior training, or
fatigue, etc).
There are a variety of methods to measure subjective workload. The following
three measures are those that form the backbone of most current subjective
measuring scales.
a. Cooper-Harper
The Cooper-Harper method (Cooper & Harper, 1969) uses a single
10-point scale to which subjects would rate their experiences. Originally
designed for analyzing aircraft handling, the scale is adaptable to a wide variety
of fields. The scale ranges from having “Major Deficiencies” (10 points), to
“Excellent, Highly Desirable” (1 point). Other than major deficiencies, the rest are
grouped in threes that make for easy classification and navigation, essentially
providing an objective path to the subjective measure.
b. SWAT
The Subjective Workload Assessment Technique shown in
Appendix A was developed as an alternative to the Cooper-Harper method and
uses a series of cards to assess workload. These cards are differentiated from
each other by time load, mental effort load, and stress load (Proctor & Van Zandt,
2008). There are three levels for each of the subcategories and all combinations
are represented on the cards for a total of 27 cards. Through the ordering of the
cards and applying a “conjoint measuring technique” (Megaw, 2005) to place
each of the 27 cards on a 1–100 point scale. The SWAT technique is time
consuming and the weighing of each subcategory differs between participants.
c. NASA-TLX
One of the most widely used methods of acquiring a subjective
measure of performance is NASA’s Task Load Index. Using six scales similar to
12
the oft-used Likert scale, TLX takes a user’s input as a gradient, matching their
rating on the particular scale to a score between 0 to 100 (Hart & Steveland,
1988). Appendix A shows the scales that TLX utilizes. In Hart and Steveland’s
report, there was a weight given to the measurements that would make the data
analysis take slightly longer. Further studies with and without the weights have
suggested that this step is superfluous; however, they have been countered just
as often with studies showing the weights give a “small but significant
contribution” (Megaw, 2005).
3. Psychophysiological Measures
One of the most effective ways to get a true gauge on the workload an
individual is experiencing is through psychophysiological measurements. These
typically fall into two categories: arousal and brain activity (Proctor & Van Zandt,
2008). As the name implies, brain activity focuses on the minute electrical
impulses that are detectable with various methods. Arousal is measured via a
variety of subconscious reactions that occur in the body when exposed to
different levels of stress and workload. These indicators, largely in the
sympathetic nervous system, include pupil diameter, pupil dilation/contraction
rate, heart rate and variability, galvanic skin response, blood pressure, blink data,
and respiration rate, among others (Proctor & Van Zandt, 2008; Marshall, 2000;
Marshall, 2007; Jessee, 2010; Fong et al., 2011; Sibley et al., 2011). The
responses can be measured with a variety of accurate and dependable
instruments.
a. Brain Activity
Brain activity is a second measure of mental workload. Using an
electroencephalogram (EEG), it is possible to measure brain activity in response
to given stimuli (Megaw, 2005; Proctor & Van Zandt, 2008). The EEG uses a
network of electrodes attached to the scalp that measure tiny variations in
voltage and translates it into a visual representation of mental activity. Event-
13
related brain potentials (ERP) are the changes in brain activity that occur
when the events occur that require a differing amount of processing. Data
analysis is required to determine the difference between these ERPs and the
background, normal brain activity (Megaw, 2005). Other brain measurements
include positron emission tomography, functional magnetic resonance imaging,
magnetoencephalography, transcranial Doppler sonography, and optical brain
imaging (Proctor & Van Zandt, 2008). These methods provide much more
detailed data, but as they are intrusive, we opted not to utilize any of them.
b. Cardiac and Galvanic Skin Response
Cardiac activity and galvanic skin response are two factors that a
mentally loaded individual may be conscious of, but over which they would have
no control. These responses come from the sympathetic nervous system and
are noticeable manifestations of the “fight or flight” response and show an
increase or decrease in heart rate (Megaw, 2005; Roscoe, 1984), or the increase
of skin moisture (sweat) thereby increasing skin conductivity. Megaw proceeds
to describe how “there is a lack of understanding as to why or how mean heart
rate should increase with increasing mental demands.” Like measuring brain
activity, measuring these two markers of mental workload are intrusive and were
not used in this study.
Although advances in technology allow for better measurement of
arousal, these techniques remain cumbersome and intrusive (Marshall, 2000).
Measuring brain activity still involves attaching electrodes to the scalp and
therefore remains to be more intrusive than other methods. This process affects
a participant in more ways than one. First, the equipment itself can be
cumbersome, causing discomfort or hot-spots if left on for an extended period of
time (Marshall, 2000). Second, the knowledge of the equipment itself can cause
the body to have subconscious reactions that can affect the data. An aviator
flying a simulation while being recorded is barely different from them doing it just
being observed (which occurs all the time); having them fly while hooked up to
14
wires and equipment can put undue stressors and pressures on their mind. As
will be discussed next, eye-tracking technology allows the experimenter to
measure accurately a participant’s reaction to workload without being intrusive.
Being able to disconnect the detection equipment from the individual allows for a
more natural environment and therefore a more pure collection of data.
c. Eye Tracking
Eye tracking is one field that has progressed greatly in the past few
decades. Originally, the equipment needed to track one’s eye movements was
bulky and was worn on the head. As mentioned, this can skew the data collected
if the individual is uncomfortable or just thinking about the equipment. Now,
being able to detect and collect data from eye-trackers is completely non-
intrusive to an individual, save the knowledge that there are cameras observing
them.
(i) Eye blink activity. As every schoolchild knows, one of the
main purposes of blinking is to lubricate the eye. There is a variety of other
purposes, but the eye will also blink for seemingly spontaneous reasons (Stern et
al., 1984). Stern et al. call this the endogenous blink. At the time of their
publication, there was little work done on cognitive activity and blink rate. Almost
thirty years later, there has been much research relating blink rate to cognition.
Studies have shown that when a blink occurs, the brain temporarily shuts down
visual input (Stern et al., 1984; Jessee, 2010). Additionally, blinks tend to occur
after taking in visual information, possibly as the brain switches from a visual
workload (VWL) (taking in the information) to a mental workload (processing the
information) (Megaw, 2005). In some situations, blink rate decreases with an
increase in VWL, such as driving and flying. However, Megaw (2005) and Stern
et al. (1984) both state that blink rate increases in other cases where visual
processing is not as demanding. Although published more than twenty years
later, Megaw sums it up concisely saying, “The inconsistent results relating to
blink rate may indicate a diagnostic potential for the measure with the acquisition
15
of visual information being associated with lower blink rates, and visual cognitive
processes with higher rates.” While performing demanding tasks, regardless of
difficulty, the blinks tend to occur at times when there is no need for steady and
constant visual intake (Stern et al., 1984). In tracking tasks, such as those used
in this thesis, if an individual knew a visually demanding portion of the task was
approaching, blink rate would increase prior to and after the portion, with a drop
in between (Stern et al., 1984).
(ii) Saccadic events. Saccades are periods of time when
the eye is actively in motion. During this movement, uptake of visual information
is temporarily paused (Carlson-Radvansky, 1999). Because of this, the time in
between saccadic events, the fixation, is when the eyes actually take in the
scene before them. Fixations and saccades are not related on a one-to-one
scale. There can be multiple saccades from one fixation to the next as the eye
rotates to the next object of interest (Marshall, 2007). Times in between
saccades (fixation or dwell times) vary as well; longer fixations imply more time
required for the visual uptake and the VWL. A NASA report found that novice
pilots spend more time per fixation than expert pilots (Tole et al., 1983). The
expert pilots in this study were able to acquire the information they needed in a
much more expedient fashion and proceed with their scan. This does not
necessarily indicate a lower cognitive workload, only that they are able to
process more information in a shorter amount of time than the inexperienced
pilots.
With larger shifts in focus, it is necessary to move the eye
through an increased number of degrees in the field of view. As mentioned,
when the eye is moving, there is no uptake of visual information. This would
therefore lead to the conclusion that with larger shifts, there is a longer amount of
time spent without visual input. Jessee (2010) mentions that although having
objects close together would lead to less VWL, the ability to discern one from
another would lead to an increase in MWL.
16
(iii) Pupillometric Measurements. With the increase of
computing power and the ability to collect and analyze data in real time, we can
observe an individual’s pupils for telltale signs of cognition. Poker players for
centuries have known that when presented with an appealing hand, the pupils
will dilate, giving a tell that is extremely hard to control. Multiple studies
corroborate the hypothesis that pupil size increases with an increase in arousal
and motivation (Fong et al., 2011; Sibley et al., 2011; Jessee, 2010; Megaw,
2005; Just et al., 2003). When using pupils as a tool to measure MWL and VWL,
the experimenter has to be aware of the environment. Pupils are very sensitive
to changes in illumination level and if there are fluctuations, this can confound the
data (Megaw, 2005). The eyes and pupils also vary between individuals.
Although it can be said that pupil size will increase with an increase in workload,
there is no given method to say they will increase or decrease a given amount.
Even within an individual, pupil size can vary due to what Jessee (2005) calls
“operator state variables.” These would be such things as fatigue level, caffeine
intake, alcohol, drugs, etc. that would affect the individual on the physiological
level.
Pupil size is not the only indicator that we can use from this
type of data. The dilation and contraction rate is useful in revealing an increase
in cognitive workload and how much of an increase there is. In Sibley et al.
(2011), they describe how pupil size is greatest in the beginning of a task of
increased difficulty, and would then decrease. Additionally, as the individuals
learn the task and become accustomed to it, the amount of dilation would
decrease and the rate at which they return to normal would increase with the
same cognitive stimulation. In Fong et al. (2011), they also showed that the
dilation rate is inversely related to the change in cognitive workload that an
individual experiences. Their method of measuring, Task Evoked Pupillary
Response (TERP), relies more on the change in size vice the size itself and is
therefore more resistant to the confounding factors mentioned.

17
4. Secondary Task Measures
Secondary tasks are those tasks that an individual performs in addition to
their primary task. Also referred to as dual or concurrent tasking, the purpose of
secondary task measures is to measure the amount of remaining cognitive
processing power while completing the primary task (Megaw, 2005). As the
names imply, the primary task should be the focus of the attention during the
exercise. Measuring performance using secondary tasks does not necessarily
mean measuring performance of the secondary task. The two basic types of
secondary task techniques are the loading task paradigm and the subsidiary task
paradigm. With the former, a researcher instructs the participant to maintain
performance on the secondary task. The goal is to measure the degradation in
the primary task, thus indicating what kind of effect the secondary has. The
second type, subsidiary task, is the opposite. It instructs the participant to
maintain priority on the primary task while measuring the decrease in
performance on the secondary task. Both of these measures rely on the use
tasks that make use of similar psychological resources (e.g., visual, oral, or
auditory). Megaw states that when the two tasks share none of the same
processes, there is no interference and an individual can reasonably perform
both tasks with no degradation in performance.
C. NAVIGATION
Navigation as a skillset within flying is one that, behind maintaining actual
flight, has the most potential on outcome of a flight. Training on navigation
begins before pilots even sit inside a cockpit with basic understanding of terrain,
features, flight paths, and obstacles. By the time the student sits in the aircraft
with their instructor, the expectation is that they can successfully find their way to
an outlying field at which they will begin training, even without knowing how to
control the aircraft quite yet. As they progress in the training pipeline, the
navigation becomes an automated task with the student recognizing certain
18
waypoints by features and within a few months, the student can be flying solo,
capable of handling all tasks required of the solo flight in the training areas.
1. Confidence of Navigation
In the operational squadrons, and specific to helicopters, flying is a crew
effort with one pilot at the controls (PAC), and one pilot not-at-controls (PNAC),
handling tasks not involved with actual control of the aircraft. Navigation is
among the tasks typically designated to the PNAC and it is his responsibility to
maintain the flight on course and on time (Lennerton, 2004; Hahn, 2005). A
given route is not intended to be followed exactly. The flight has the ability and
the responsibility to be dynamic. If a threat is discovered, or weather moves in, it
is up to the aircraft commander to adjust the course in order to keep the
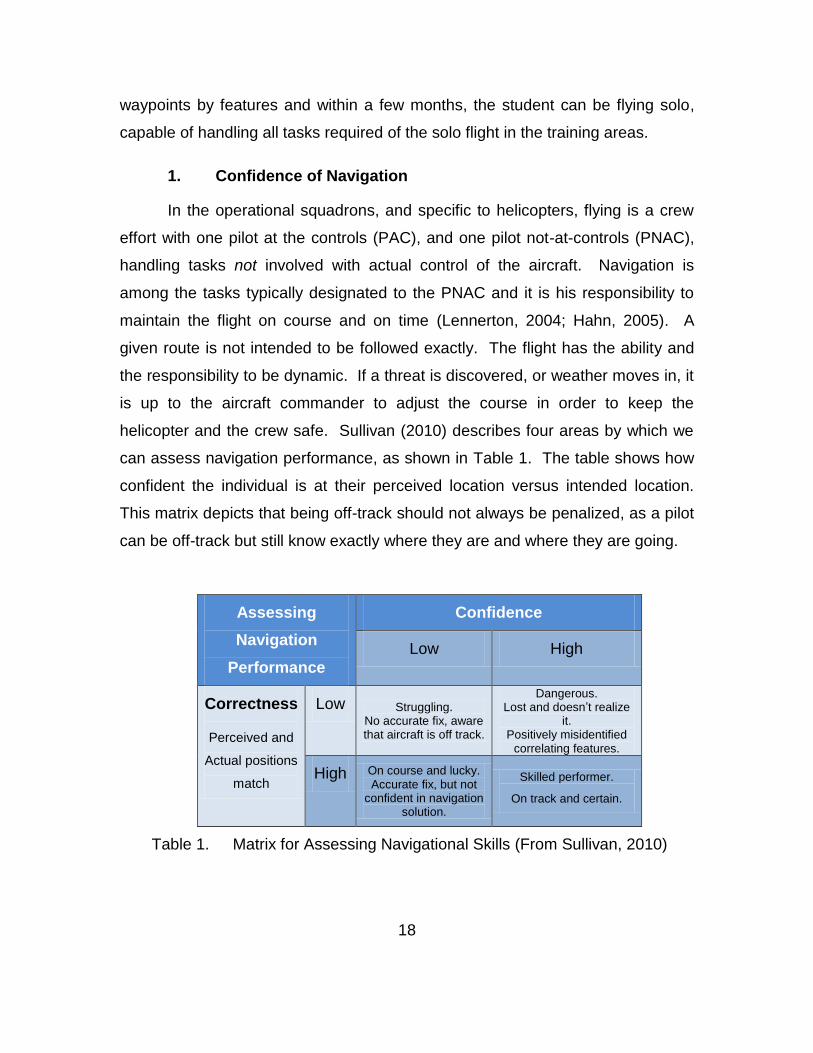
helicopter and the crew safe. Sullivan (2010) describes four areas by which we
can assess navigation performance, as shown in Table 1. The table shows how
confident the individual is at their perceived location versus intended location.
This matrix depicts that being off-track should not always be penalized, as a pilot
can be off-track but still know exactly where they are and where they are going.
Assessing
Navigation
Performance
Confidence
Low High
Correctness
Perceived and
Actual positions
match
Low Struggling. No accurate fix, aware that aircraft is off track.
Dangerous. Lost and doesn’t realize
it. Positively misidentified
correlating features.
High On course and lucky. Accurate fix, but not
confident in navigation solution.
Skilled performer.
On track and certain.
Table 1. Matrix for Assessing Navigational Skills (From Sullivan, 2010)
19
2. Navigation Methods
For a typical low-level flight, the non-flying pilot will have a 1:50,000 chart
like the ones used in this thesis. Sullivan (2010) writes that sub-skills involved in
helicopter navigation are dependent on certain goal-seeking methods that
develop and change with experience. As a novice, a pilot is primarily means-
based—following practices and procedures known through rote memorization
and represent hard and fast guidelines by which to fly. With a little more
experience, an intermediate pilot moves on to schema-based navigation. They
have a plan and they have the ability to see beyond the “now” and provide
information to the flying pilot as to what they will see or what to expect. Lastly,
an expert’s method of navigation is rule-based meaning they will describe a set
of rules that lead to the ultimate goal. Actual execution of the rules is left to the
discretion of the PAC, however the PNAC will continually asses and update his
rules as the flight progresses.
Being able to navigate successfully involves being able to take the 2-
dimensional representation of the terrain represented on the chart and
associating it with the 3-dimensional out-the-window (OTW) view. For novices or
anyone without overland navigation experience, this typically is a difficult task.
With experience, an individual is able to understand which OTW features will be
easily noticed on the chart, and conversely, which chart features can be used for
navigation. Key terrain features include checking features (“on the right track”),
channeling features (“follow to the next point of interest”), and limiting features
(“you have gone too far”) (Lennerton, 2004; Hahn, 2005). The ability to go from
chart-to-OTW and OTW-to-chart comes with practice and is enhanced with an
efficient scan within and without the cockpit. This creates two distinct phases of
navigation, depending on how the pilot perceives their current situation:
maintenance and repair.
20
a. Maintenance
Maintenance of navigation is the practice of knowing where one is
and keeping control over their location on the chart. The search/scan pattern of
an individual in a maintenance regime is directed and deliberate. They are
looking for confirmation on their location rather than trying to determine where
they are (Sullivan, 2010). Pilots in maintenance mode are confident in their
location regardless of how much the flight may deviate from the route. As shown
in Table 1, when they are high on “correctness,” this is good and would be the
performance expected of more experienced pilots. According to Sullivan’s
dissertation, less experienced pilots “will have increased dwell time, taking longer
to capture and encode features in the OTW view.” Ideally, staying in the
maintenance phase should be easier than repair as one only has the task of
matching and not searching.
b. Repair
Repair strategy involves perceiving that one has unintentionally
strayed from the assigned route and finding a solution to recover. As shown in
Table 1, repair would not occur if the pilot were purposefully off track for
something such as terrain, weather, or threat avoidance. Sullivan (2010) calls
this a naïve search in that the pilot does not have the confidence of his location
by which to make a matchmaking maintenance search. Experts in repair select a
few key features across a wide swath that will allow them to better triangulate
their position. The repair search of a novice is focused on relevant and non-
relevant features in a smaller region leading to further lack of confidence in their
position. For this experiment, if an individual recognized they were lost, the
research team member gave them a heading to fly in order to put them back on
course.
21
3. Navigation and Workload
In a crewed aircraft, navigation occurs with cooperation from all members
being able to pick out and describe salient features from the surrounding terrain
(Sullivan, 2010; NATOPS, 2008). In a single-seat aircraft, the pilot must
accomplish this task concurrently with the aviation and communication portions
of the flight, thereby increasing their workload. At 150’ above ground level (AGL)
in a mountainous region, terrain avoidance has consequences that are even
more serious should it be ignored. Thus, the pilot has even greater workload
when flying in this type of environment. One could slow down in order to provide
more time with which to process the scene, but in an operational environment,
this is not practical, as a slow aircraft is an easier target. Additionally, if one
slows too much, they enter a zone where the airspeed-altitude combination is
dangerous should an emergency occur (NATOPS, 2008). In our experiment,
although flying a simulated helicopter, we put the participants in a single-seat
aircraft to increase their workload beyond just navigating or just target detection.

22
THIS PAGE INTENTIONALLY LEFT BLANK
23
III. METHODOLOGY
A. INTRODUCTION
The purpose of this thesis was to identify differences in scan patterns
among pilots of varying experience in order to gain insight into (1) how these
differences can relate to workload and (2) to capitalize on these differences to
create more effective and efficient pilot training. We built upon previous work
(Sullivan, 2010) that investigated neurophysiological cues of pilots in a single
task environment. In order to address differences in workload, we chose two
scenarios that, by themselves, are not particularly stressing—navigation, and
target detection and identification. We also created a scenario in which pilots
had to perform both tasks simultaneously (combined task). In dual-piloted
aircraft, these tasks are often split between the pilots in order to reduce the
workload and increase safety. By having two tasks and examining the pilots in
each single task as well as the combined task, we could identify changes in their
behavior as the cognitive task load increases.
1. Overview of the Tasks
The research team created three experimental scenarios and one practice
scenario. Each scenario was designed to elicit appropriate responses for the
task(s) at hand; i.e., the navigation task assessed navigation skills. In all cases,
the Practice Scenario was the first one to be administered. Scenario 2
(navigation only) followed in order to decrease the possibility of an order effect
when analyzed with an earlier navigation experiment. The order of Scenarios 3
(navigation and target detection & identification) and 4 (target detection &
identification only, auto-navigation) were counterbalanced in order to reduce
confounds and order effects for this experiment. All scenarios simulated flight in
an area near Twenty-Nine Palms, CA, which has an established military training
area. The routes flown were typical of low-level routes that could be expected in
both training and real world missions. Although all scenarios were in the same
24
general region of Twenty-Nine Palms, none of them reused waypoints, nor did
the routes of flight intersect.
Although we seek realism in training environments, there are limitations on
what we have and what we can use. The variation inherent in the past flight
experiences of the pilots made it so that a simplification of the cockpit was
necessary.
For the navigation task, we instructed the pilots to navigate their way
around a series of waypoints. We measured their performance on this task as
adherence to the straight line, waypoint-to-waypoint route. Utilizing root-mean-
square (RMS) error, we calculated their distance from the given route at each
data collection instance. Although there is no way to score a 0 (perfect
adherence), namely because turns are inherently off the sharp corner of the
route, this is constant across all pilots and is therefore already controlled. The
pilots did not have complete control of the aircraft during the navigation tasks. In
order to reduce random variability, they only had control of the heading of the
aircraft. Altitude was constant at 150’ above ground level; airspeed was a
constant 60 knots. This simplified the controls and minimized variability in “basic
air work” which involves the overarching task of maintaining control of an aircraft
so that more attention could be applied to what we wanted to measure—
navigation performance.
The target detection and identification task, as the name implies, was a
two-piece task. The Practice Scenario, Scenario 3, and 4 each had two types of
targets interspersed along the route. Because detection of the target could be as
simple as discerning anomalies in the simulated terrain, we added identification
as a method to get the pilots to concentrate more on the target. Along with
increasing the mental workload, this had the added bonus of allowing the eye
tracking equipment to detect more accurately when the individual identified the
target. Downed aircraft, designated with a “crashed” A-10 Warthog, represented
friendly targets for the identification portion. A SAM launcher represented the
25
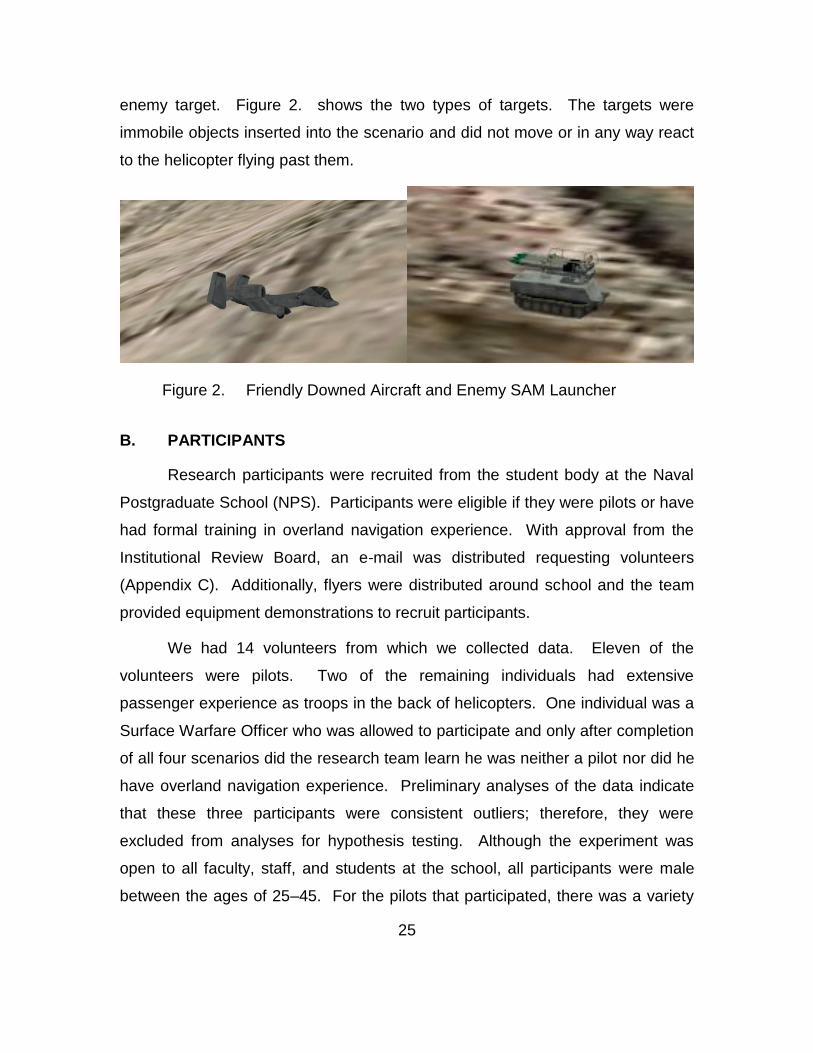
enemy target. Figure 2. shows the two types of targets. The targets were
immobile objects inserted into the scenario and did not move or in any way react
to the helicopter flying past them.
Friendly Downed Aircraft and Enemy SAM Launcher Figure 2.
B. PARTICIPANTS
Research participants were recruited from the student body at the Naval
Postgraduate School (NPS). Participants were eligible if they were pilots or have
had formal training in overland navigation experience. With approval from the
Institutional Review Board, an e-mail was distributed requesting volunteers
(Appendix C). Additionally, flyers were distributed around school and the team
provided equipment demonstrations to recruit participants.
We had 14 volunteers from which we collected data. Eleven of the
volunteers were pilots. Two of the remaining individuals had extensive
passenger experience as troops in the back of helicopters. One individual was a
Surface Warfare Officer who was allowed to participate and only after completion
of all four scenarios did the research team learn he was neither a pilot nor did he
have overland navigation experience. Preliminary analyses of the data indicate
that these three participants were consistent outliers; therefore, they were
excluded from analyses for hypothesis testing. Although the experiment was
open to all faculty, staff, and students at the school, all participants were male
between the ages of 25–45. For the pilots that participated, there was a variety
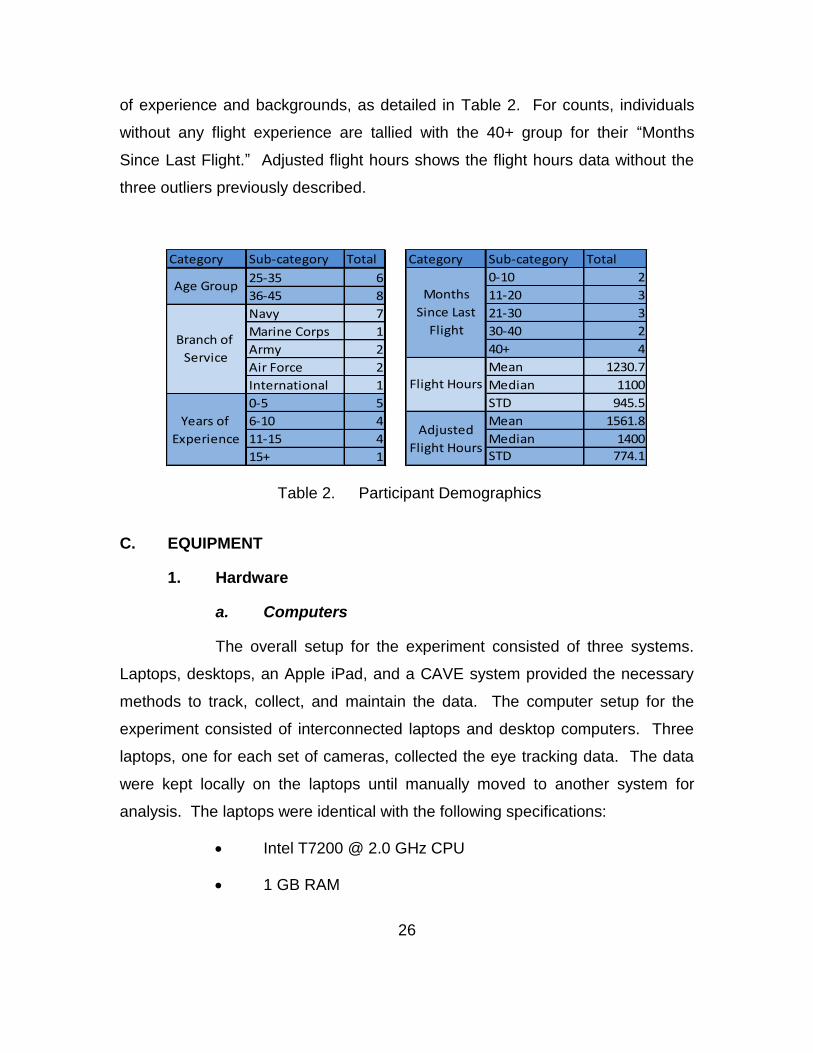
26
of experience and backgrounds, as detailed in Table 2. For counts, individuals
without any flight experience are tallied with the 40+ group for their “Months
Since Last Flight.” Adjusted flight hours shows the flight hours data without the
three outliers previously described.
Category Sub-category Total
25-35 6
36-45 8
Navy 7
Marine Corps 1
Army 2
Air Force 2
International 1
0-5 5
6-10 4
11-15 4
15+ 1
Age Group
Branch of
Service
Years of
Experience
Category Sub-category Total
0-10 2
11-20 3
21-30 3
30-40 2
40+ 4
Mean 1230.7
Median 1100
STD 945.5
Mean 1561.8
Median 1400
STD 774.1
Months
Since Last
Flight
Flight Hours
Adjusted
Flight Hours
Table 2. Participant Demographics
C. EQUIPMENT
1. Hardware
a. Computers
The overall setup for the experiment consisted of three systems.
Laptops, desktops, an Apple iPad, and a CAVE system provided the necessary
methods to track, collect, and maintain the data. The computer setup for the
experiment consisted of interconnected laptops and desktop computers. Three
laptops, one for each set of cameras, collected the eye tracking data. The data
were kept locally on the laptops until manually moved to another system for
analysis. The laptops were identical with the following specifications:
Intel T7200 @ 2.0 GHz CPU
1 GB RAM
27
Mobile Intel 945 Express Chipset Family Graphics
Windows XP Service Pack 3 Operating System
Three desktop computers created the scenes, controlled the flights,
gave supervisory authority, and aggregated the data from the laptops. Each
desktop was identical in its specifications:
Intel T7200 @ 2. GHz
3 GB RAM
NVidia GeForce 8800 Ultra graphics card
Windows XP Service Pack 3 Operating System
Although identical in components, the desktops performed very
different jobs. The X-Plane system handled the actual flight of the helicopter.
Participant input from the joystick was handled via the system in the Practice
Scenario, 2, and 3. The X-Plane system also provided output to the instructor
system for administrative capabilities. Terrain generation and rendering were
performed by Delta3D and OpenSceneGraph.
The instructor system gave the research team the ability to
maintain control over the flow of the scenarios. From this station, and with input
from the X-Plane system, the instructor knew where the subject was on the chart
(as well as in relation to the given route), what they see on all three screens, and
with input from the FaceLAB computers, a general locus of their gaze.
The CAVE system consisted of an identically configured desktop,
screens, and projectors, the latter of which we will discuss below. The desktop’s
primary job was to take display outputs from the other computers and route them
to the appropriate projectors and displays. This computer generated the
instrument panel located inside the cockpit for the participant’s use. This system
also provided the output files for the researchers.

28
Lastly, on the display aspect, an Apple iPad displayed the chart for
the participant. Although physically fixed in position to allow calibration with the
IR cameras, the pilot could rotate the chart on the screen to maintain his
orientation if he desired. The iPad communicated with the rest of the system
wirelessly to a Macbook Pro, which was physically (wired) connected to the NPS
intranet and the other computers from there.
b. Physical Setup
The most noticeable pieces of the physical setup of the apparatus
were the cockpit and the screens. The cockpit (Figure 3. is a model cockpit
without any instrumentation of its own. To reduce variation from the two seats,
and to maintain one configuration of the cameras, pilots sat in the right seat. In
front of them, in the cockpit, a 10.6″ × 17.3″ (20″) screen displayed the virtual
instrument panel. The screen had the following instruments:
Airspeed
Barometric altitude
Time
Heading
To the pilot’s left, within arm’s reach, was the iPad. Both cockpit displays
(instrument panel and iPad) were in fixed locations to maintain calibration with
the cameras.
The CAVE system provided the out-the-window (OTW) display for
the experiment. Encompassing over 180º (~103º left, ~118º right), three screens
provided a wrap-around view for the flight. Three projectors connected to the
CAVE computer backlit three 96″ × 72″ (120”) screens in full 1024 × 768
resolution. The positions of the screens were fixed to allow calibration with the
IR cameras. Figure 3 shows the cockpit setup (with one extra configuring laptop)
and the large display screens. This system had on it X-Plane 9.0, the image
generator, the data logger, and Delta3D and OpenSceneGraph in order to create
the graphics for the scenarios.
29
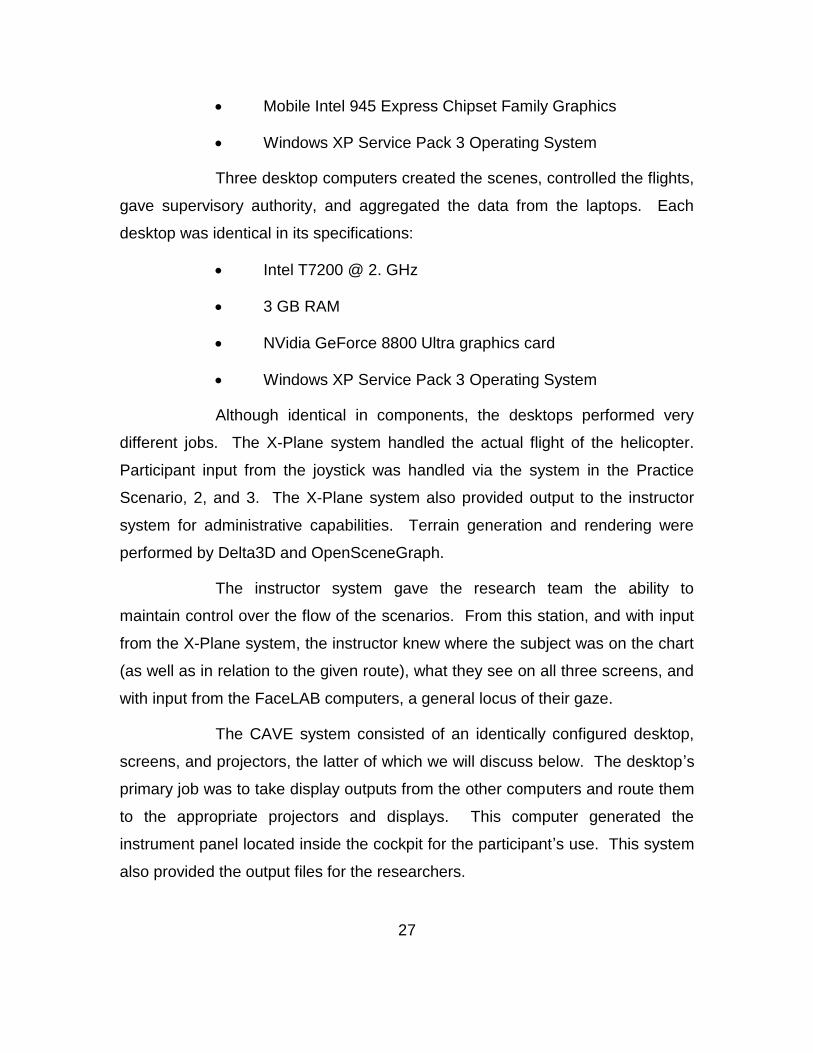
Cockpit Setup Figure 3.
Due to the fixed position of the seat and screens, there could be
minor differences between viewing angles per individual. Figure 4 shows the
arrangement of the cockpit. From the center of the seat, the right screen is 30″
away, the front (center) screen is 80″, and the left screen is 66″. The iPad sits on
the empty seat, arm level, 22″ from pilot’s center. The seat bottom is 36” from
the floor. Each screen is raised 17.5″ from the ground. With these
measurements, we can approximate the field-of-view. The elevation and
depression angles given in Table 2 are calculated for an American male in the
50th percentile for sitting eye-height (31.5”) (Phaesant & Haslegrave, 2006). As
mentioned above, the transverse angles are 103º to the left and 118º to the right.
30
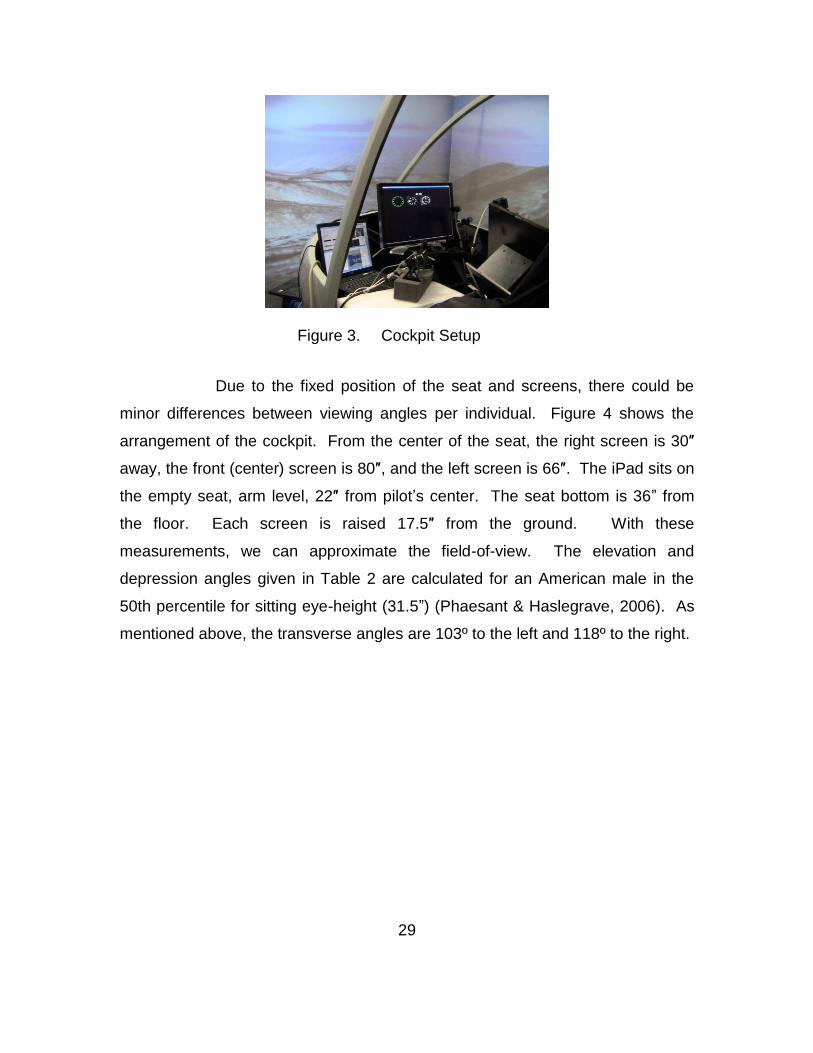
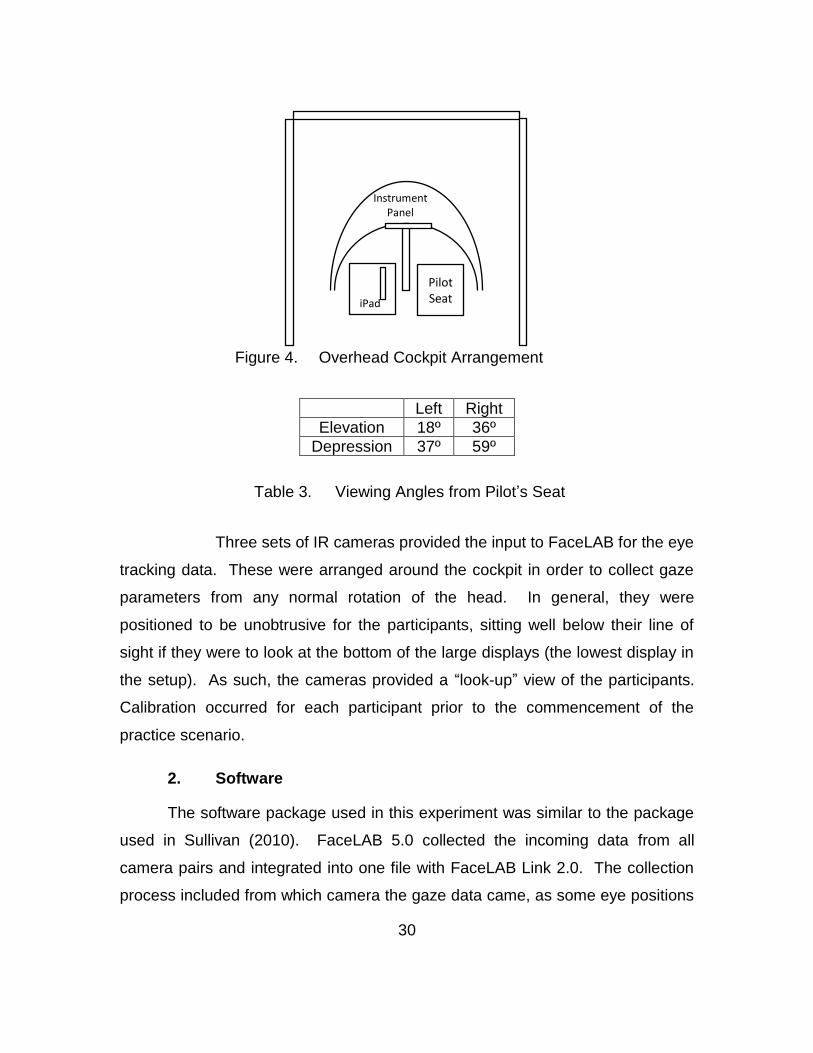
Overhead Cockpit Arrangement Figure 4.
Left Right
Elevation 18º 36º
Depression 37º 59º
Table 3. Viewing Angles from Pilot’s Seat
Three sets of IR cameras provided the input to FaceLAB for the eye
tracking data. These were arranged around the cockpit in order to collect gaze
parameters from any normal rotation of the head. In general, they were
positioned to be unobtrusive for the participants, sitting well below their line of
sight if they were to look at the bottom of the large displays (the lowest display in
the setup). As such, the cameras provided a “look-up” view of the participants.
Calibration occurred for each participant prior to the commencement of the
practice scenario.
2. Software
The software package used in this experiment was similar to the package
used in Sullivan (2010). FaceLAB 5.0 collected the incoming data from all
camera pairs and integrated into one file with FaceLAB Link 2.0. The collection
process included from which camera the gaze data came, as some eye positions
Pilot Seat
iPad
Instrument Panel
31
could be tracked by more than one set of cameras (e.g., center OTW display).
FaceLAB required a one-time calibration per individual. After this calibration, the
participant had reasonable range of head rotation in the transverse and frontal
planes for the duration of the experiment. The programs used to render and
collect data were:
X-Plane 9.0
FaceLAB 5.0
Delta3D and OpenSceneGraph
D. SCENARIOS
Charts for Scenarios 2, 3, and 4 can be found in Appendix B.
1. Practice Scenario
The Practice Scenario is a combination scenario involving both navigation
and target detection and identification. It contained both tasks, and although
data collection occurred, this scenario was done to ensure the equipment was
properly set up and functioning and to introduce the individuals to the equipment
and allowed them to acclimate to differences from equipment or platforms on
which they may have previous experience. When situated, the research member
“unfroze” the simulator, thus commencing the flight and giving the participant
control of the aircraft. The participant flew through the established waypoints
detecting targets as they showed in his view.
2. Scenario 2–Navigation without Targets
Scenario 2 involved strictly navigation without the burden of target
detection and identification. Twelve waypoints provided approximately six to nine
minutes of flight time depending on the accuracy of the pilot in maintaining
adherence to the given course. Although just a single task, navigation is the
second hardest of the three tasks because the pilot must physically maintain the
heading of the aircraft, and keep track of the location of the aircraft. This meant
looking out the window, taking in visual cues from the terrain, and comparing
32
them to what was presented on the chart in order to mentally place and track the
movement of the aircraft through the scenario.
3. Scenario 3–Navigation and Target Detection and Identification
Scenario 3 was the combination task involving both navigation and
target detection and identification. The purpose of this scenario was to
determine how the individual performed when presented with multiple tasks
simultaneously. They were given no instruction as to which task to prioritize.
Upon commencement of the scenario, the individuals flew around 12 designated
waypoints while detecting 11 targets. Targets were placed such that if gaze data
was available, there would not be confusion as to which target an individual is
observing (i.e., there was ample lateral separation between targets as viewed
from the vicinity of the given course).
4. Scenario 4–Target Detection and Identification on Auto-Pilot
Scenario 4 involved target detection and identification while the
software controlled the movement of the helicopter (i.e., while on autopilot).
Although given a chart study period, this was for consistency as there was no
need and the pilot could not influence the direction of the helicopter. As with
Scenario 3, seven waypoints were provided, among which 10 targets were
placed. Total flight time ranged from approximately seven to nine minutes. This
scenario explored the pilot’s ability to concentrate strictly on one task, which
although slightly more complicated than just detection, we deemed as the
simplest of the three experimental scenarios.
E. MEASURES
1. Surveys
a. Demographic
We collected demographic data from all participants prior to the
commencement of the experiment. Appendix G shows the demographic survey.
33
The purpose of this survey was to collect information regarding the participants’
backgrounds and experience, including flight hours and time since their last flight.
Pertinent information collected for this experiment is detailed in Table 2.
b. Pre/Post-Experiment
The pre- and post-flight surveys (Appendix H) served the purpose
of both determining how confident the individual was that he would be able to
accomplish the tasks just from the chart study period, and then after the
scenario, how confident they were that they actually did accomplish the tasks.
The surveys make use of the Likert scale and ask the participants to rank their
difficulty on a scale. Instead of using a 1–5 ordinal scale, we opted for a line
graphic which allowed the participants to select a continuous value along the line.
Immediately after the chart study, we gave the pre-flight survey to the participant
and they filled it out. Upon completion, the research team member proceeded
with the scenario. With the scenario complete, the researcher gave the individual
the post-flight survey, which asked the same questions, this time acquiring a
post-facto representation of the flight performance.
2. Data Collection
Data collection began before the individual had control of the aircraft. The
instructor would start the scenario with the model on motion freeze, meaning the
scenario was running, data was being collected, but the simulated helicopter
would not move. Once the researcher confirmed correct operation, the
participant was given control of the aircraft and taken off motion freeze. Data
from FaceLAB would be aggregated in one file per participant per scenario.
Table 5 shows the fields captured in the data logs. Additionally, a Canon VIXIA
HF R11 camera captured audio and visual during each trial. The audio/visual
data was not utilized in the analysis of this data.
34
3. Procedure
Upon arrival at the lab, we briefed each participant on the structure of the
experiment and had him sign consent forms illustrating the voluntary nature of
the experiment. The volunteer filled out the demographic survey described
above anonymously. To decrease confounds coming from vision differences, we
administered a basic eye test using the Snellen eye chart to ensure that all
participants had corrected vision of at least 20/30 in one eye. They would then
take their place in the right seat of the cockpit and the instructor would proceed to
calibrate the cameras (Appendix F).
Prior to commencing each scenario, we gave the participants a
topographical land map on the scale of 1:50,000. These charts are familiar to
pilots as they are often used in low-level flight planning and execution. Each one
featured the assigned route, headings, and straight-line times between
subsequent waypoints. After a five-minute chart study, we administered the
surveys as described in the surveys portion of this chapter. This allowed us to
collect subjective data from the participants on how difficult they think the flight
will be. Once complete with the chart study, the individuals commenced the
mission. Actual flight times varied per individual and scenario, but most runs did
not last any more than about 10 minutes.
During the flight, the researcher would monitor progress from the
instructor station. If the participant at any time admitted to being lost they would
be given a heading to get them back on track. If they were more than 2 km off
track at any point, the researcher would ask them where they thought they were,
then proceed to give them a heading back to the last waypoint that was
successfully found. At the completion of the scenario, we gave the participant a
post hoc survey to reassess the difficulty of the scenario.

35
IV. RESULTS AND DATA ANALYSIS
A. DATA PREPARATION / PRELIMINARY ANALYSIS
This section will look at the collected data and analyze it as it pertains to
the hypotheses. We use the software packages Microsoft Office Excel v14 and
JMP Pro v9.0.0 to perform our analysis. Unless otherwise stated, each
hypothesis is analyzed per scenario with comparisons made thereafter.
1. Data Preparation
The data was collected from Image Generator, FaceLAB, and X-Plane.
The output came as one comma-separated-value (.csv) file per participant, per
scenario for a total of 60 csv files. Participant 13 had corrupted FaceLAB data
and was removed. This left 14 participants with quality data for analysis.
The data required substantial preprocessing before statistical analysis
could begin. The initial portion of the analysis dealt with removing FaceLAB data
that was acquired before and after the actual commencement of the scenario.
For continuity and thoroughness of data, collection began before the participant
was given control of the aircraft (helicopter held in constant position) and ended
after the scenario was frozen at the end. These rows of data had to be removed
in order to have only the data that occurred while the participant was in control of
the helicopter and engaged in the scenario. As all scenarios started out with the
helicopter heading in a roughly northerly direction, latitude would have the
quickest deviation once the scenario was unfrozen. This allowed a comparison
of the latitudes as the benchmark of when the scenario actually began. A Δº =
.000005º (corresponding to one-half meter on the ground) was chosen as the
benchmark for helicopter movement apart from scenario initialization. This
corresponds to approximately half a meter of movement at the scenarios’ specific
latitudes. After cleaning the header of every scenario run, the data files were
reversed and run through the algorithm again, effectively eliminating the footers
36
of every file. Additional prepreocessing was performed in Python v2.7 to
examine the csvs, we created valid files that had strictly the data from when the
participants were in active control of the helicopter.
a. Blink Data
The next step of data preparation was to extract the necessary
values to explore the hypotheses. Blink data was extracted from the raw data by
comparing subsequent values from the “Blink” column in the csvs. For the blinks,
a “1” represents the time when the individual is in the process of blinking while a
“0” means the eyes are open. When the value transitioned from 1 to 0 or vice
versa, the column and appropriate information was collected and written to a new
file. We collected tally information for the entire sample group in a separate file.
As we were only concerned with the blink rate (number of blinks per minute), this
was the extent of blink data extraction.
b. Saccade Data
Saccade data was extracted in a similar manner to the blink data by
comparing their respective cells in subsequent frames. As shown in Table 6.
data collection represents a saccade with the value of “1.” “Zeros” showed when
the eyes were fixated for the saccade data. Saccade extraction included not just
when a saccade occurred, but data as to on which screen the saccade occurred.
c. Fixation Data
Because FaceLAB and Image Generator both take data points
ranging from 30–60Hz, it was necessary to filter the data to eliminate noise.
Fixations that did not last 70 msec or more were considered noise and filtered
out of the data. All fixations longer than 70 msec were sorted to count the
number of fixations that the individual had while focused either out-the-window
(OTW), at the instrument panel (IP), or at the chart (Map) so that they could be
tallied per area. Individual assessments of each subject-scenario pairing
37
included the time and location of each fixation. The overall tally had the
collective time of each pairing’s total saccades, and the count and time of each of
the three generalized scan locations detailed below.
d. Scan Pattern Data
Scan data was collected by first determining at which screen the
participant was focused on. If scan data was unavailable, i.e., there was no gaze
intersection, the scan data for those particular frames was ignored. Given this
issue and the need to aggregate scan data, the possible scan locations were
grouped into three locations: out-the-window, instrument panel, and map. These
corresponded to respective “screenNames” from FaceLAB. Individual
assessments of each subject-scenario pairing had merely the elapsed time and
screenName, which were then run through a third program to gather counts for
every transition. Given three scan locations (OTW, IP, Map), this gave six
possible transitions (OTW-IP, OTW-Map, IP-OTW, IP-Map, Map-OTW, Map-IP),
which were also calculated.
The three measures named above comprise the “salient stimuli”
referenced in the hypotheses. To minimize differences in actual flying ability,
controls were in place to keep the helicopter at a constant altitude (150’) with a
constant airspeed (90 knots). Although we provided multiple instruments, with
the above parameters on autopilot, the only instrument on the instrument panel
under the participants’ was the heading indicator (if used). With this knowledge,
“salient stimuli” represents an understanding of where the individual is focused to
determine where they are gathering their information (OTW, IP, Map).
e. Eye Scan Efficiency
We calculated eye scan efficiency using the overall fixation count,
median dwell times, and saccades per minute (SPM). Due to the ability of a few
long dwells to skew the mean times (whether actual or from the inability of the
equipment to detect a shift in attention), we opted to use the median dwell times
38
as these more truly represent the length of time spent fixated on an area across
the entire scenario. SPM shows a normalized representation of how often the
participants shifted their gaze and equalizes the differences in total saccades due
to increased scenario run times. Otherwise, eye scan efficiency is the effects of
these parameters and required no further calculations or data preparation.
f. Target Detection Data
Target detection data was analyzed from the set of
deheadered/defootered files. Button press was the initial parameter for target
detection. The initial filter program looked at when a button was depressed and
compared it to the gaze intersection. A tolerance of .01º (≈1 km) on gaze
intersection straight line distance as calculated from the difference of lat/long
positions was considered “in sight” for an accurate detection1. Although 1 km
may seem large, this value allowed for eye movement while processing the
visual image, and the reaction being relayed to the hand to depress the button.
True positive and false positive determination came from the button the
participant pressed compared to the target’s nature. A secondary analysis was
conducted to determine if a strictly distance-wise collection could be done vice
the gaze data. This turned out to result in worse detection data as the
participants often sighted the targets (adversary missile or crashed plane) from a
distance greater than within the provided tolerance (Δ = .005º). As such, this
avenue was abandoned and we reverted to gaze data with the following deeper
looks. Because gaze data was not available for every frame of data collection,
the individual files were manually analyzed to determine whether the individual
could reasonably have been looking at a target even though the gaze data was
not collected.
There were two levels to analyzing target detection data in the absence of
gaze data. The first was if the helicopter was in a position that could be in sight
1 Although longitudinal degree distance varies with latitude, due to the small latitudinal range
of the study, a Euclidean distance suffices for distances from each lat/long pairing.
39
of the target (Δ = .005º). Secondly, the button presses examined in the context
of their surroundings. If an appropriate button was pressed, at a point when it
could be considered reasonable to press said button, within a reasonable
distance from the target, the target was designated as a “Probable” detection in
the matrix. In 0, the detections are shown by whether they were detected via eye
gaze information, helicopter distance, or reasonable surrounding data. For
calculations, we classified “probable” detections as true detections (true
positives). Lastly, if there were button presses that could not be explained with a
detection on target, they were classified as false negatives. For obvious
reasons, there is no “true negative” detection as that would indicate the
participant did not push a button when there was no button to push. Target
detection analysis is summarized in Table 7 in Appendix B.
Analyzing the individual data sets occurred following the previous data
filtering. Each hypothesis had a different requirement of data and therefore the
code created separate csv files to analyze. Summary statistics are shown in
Figure 24. Appendix C. The following sections discuss these results.
2. Preliminary Analysis
Preliminary analysis of the data began with a comparison of Total Flight
Hours versus Overland Flight Hours. As this is a navigation task based on land
features, we collected both data points from the demographic surveys given to
each participant. However, as Figure 12. illustrates, there is a very strong
relationship between total flight hours and overland hours (p < .001, F = 101.4),
meaning that one may reasonably be thought of as a proxy for the other.
Therefore, we considered experience as based on Total Flight Hours, as this is a
more typical measure of a flight experience. The flight hours were categorized
as ordinal data such that the participant with the least flight hours was denoted
as “1.” These ranked hours then were used for hypothesis testing.
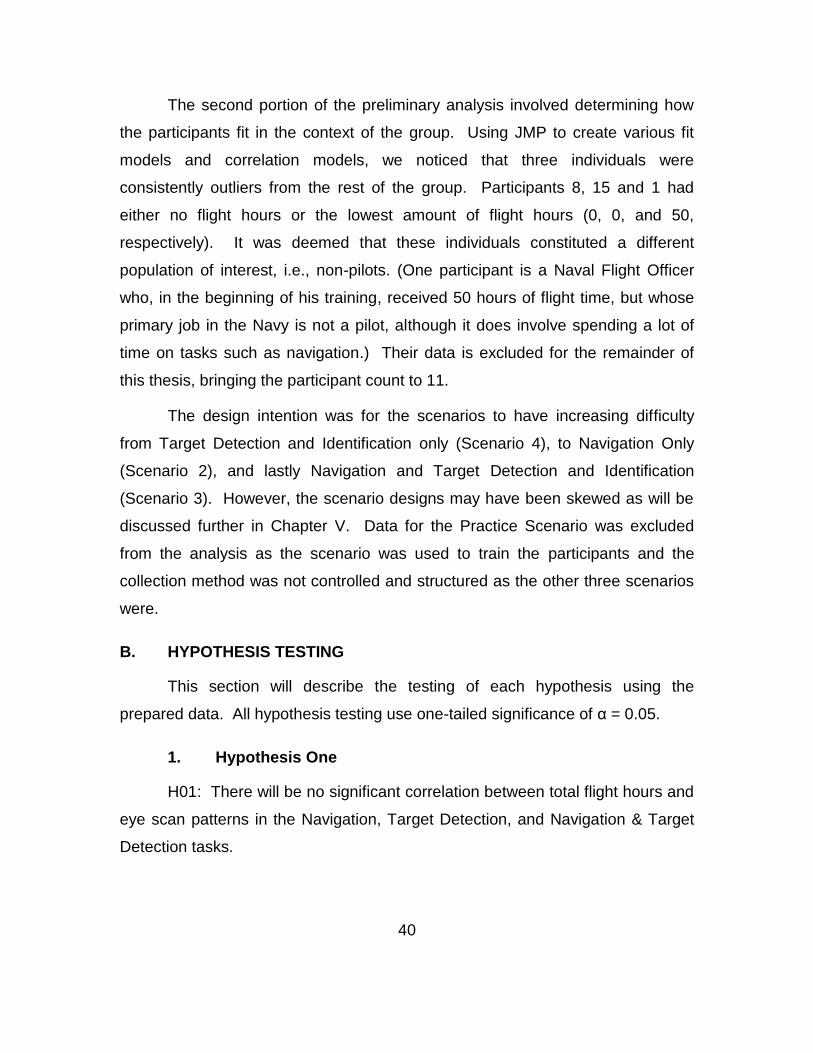
40
The second portion of the preliminary analysis involved determining how
the participants fit in the context of the group. Using JMP to create various fit
models and correlation models, we noticed that three individuals were
consistently outliers from the rest of the group. Participants 8, 15 and 1 had
either no flight hours or the lowest amount of flight hours (0, 0, and 50,
respectively). It was deemed that these individuals constituted a different
population of interest, i.e., non-pilots. (One participant is a Naval Flight Officer
who, in the beginning of his training, received 50 hours of flight time, but whose
primary job in the Navy is not a pilot, although it does involve spending a lot of
time on tasks such as navigation.) Their data is excluded for the remainder of
this thesis, bringing the participant count to 11.
The design intention was for the scenarios to have increasing difficulty
from Target Detection and Identification only (Scenario 4), to Navigation Only
(Scenario 2), and lastly Navigation and Target Detection and Identification
(Scenario 3). However, the scenario designs may have been skewed as will be
discussed further in Chapter V. Data for the Practice Scenario was excluded
from the analysis as the scenario was used to train the participants and the
collection method was not controlled and structured as the other three scenarios
were.
B. HYPOTHESIS TESTING
This section will describe the testing of each hypothesis using the
prepared data. All hypothesis testing use one-tailed significance of α = 0.05.
1. Hypothesis One
H01: There will be no significant correlation between total flight hours and
eye scan patterns in the Navigation, Target Detection, and Navigation & Target
Detection tasks.
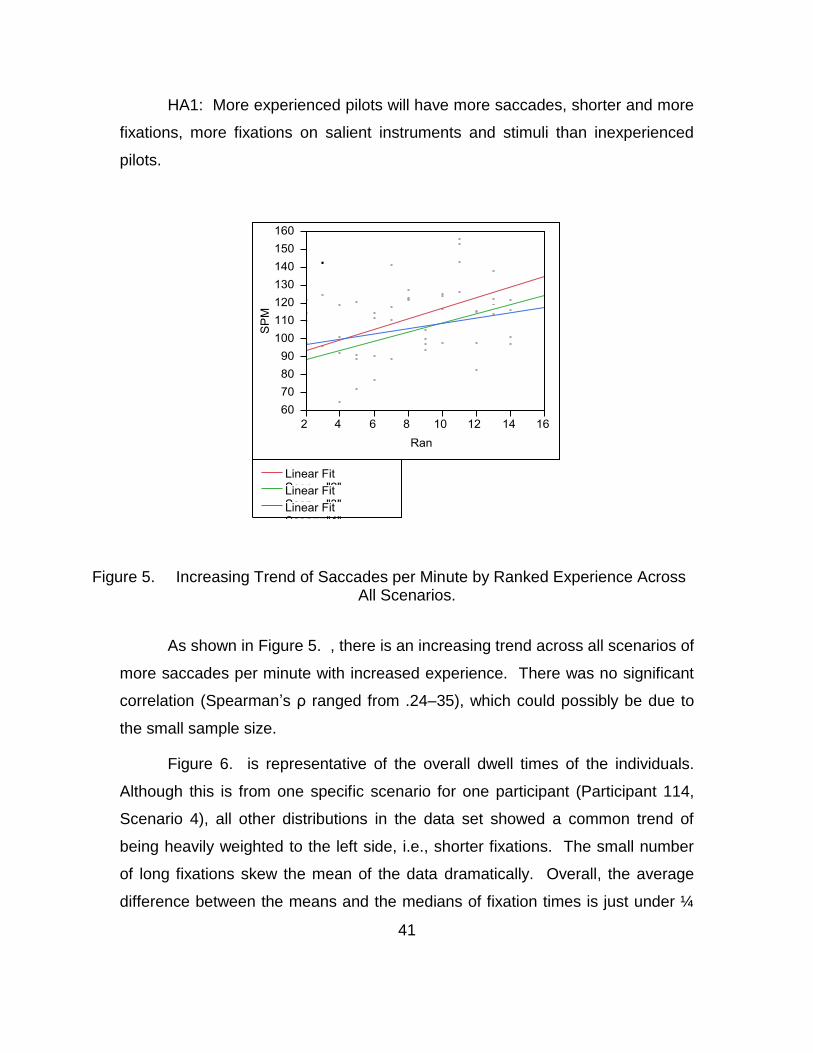
41
HA1: More experienced pilots will have more saccades, shorter and more
fixations, more fixations on salient instruments and stimuli than inexperienced
pilots.
Increasing Trend of Saccades per Minute by Ranked Experience Across Figure 5. All Scenarios.
As shown in Figure 5. , there is an increasing trend across all scenarios of
more saccades per minute with increased experience. There was no significant
correlation (Spearman’s ρ ranged from .24–35), which could possibly be due to
the small sample size.
Figure 6. is representative of the overall dwell times of the individuals.
Although this is from one specific scenario for one participant (Participant 114,
Scenario 4), all other distributions in the data set showed a common trend of
being heavily weighted to the left side, i.e., shorter fixations. The small number
of long fixations skew the mean of the data dramatically. Overall, the average
difference between the means and the medians of fixation times is just under ¼
42
of a second (.2495sec). As such, we analyzed the data using median values as
this more truly represents the representative values of the data set.
Distribution of Dwell Times Figure 6.
Figure 13. (Appendix B) demonstrates the multivariate relationships
between fixation numbers, fixation durations, and ranked experience. As shown,
there is no significant relationship between the average number of fixations
across all scenarios and ranked experience (ρ = 0.127, p = 0.482). As would be
43
expected, a strong, negative correlation between dwell time and fixation number
was found (ρ = -0.604, p < 0.001), indicating that participants with longer dwell
times had fewer fixations. The results indicate that although more experienced
pilots do trend towards more saccades, surprisingly, they do not have shorter
dwell times or greater numbers of fixations. In this study, overall, the more
experienced pilots do not have more fixations than inexperienced pilots do.
Although saccades correlate to fixations in two out of three scenarios (Figure 14.
; see Appendix B), the statistical results do not show that experience correlates
to fixations.
The amount of time or number of times that an individual fixates on a
certain area was not significant for both cases. Figure 15. and Figure 16. (see
Appendix B) show the multivariate and Spearman correlations for the time spent
in each designated area (OTW, IP, Map) and how many times the individual’s
gaze went there. For the most part, the results are not significant. However, one
condition stands out as significant—experience on median map dwell time
(ρ = -0.376, p = 0.031). This shows that as the experience of the participant
increased, they spent less of their scan time looking at the map. Although not
significant, a slight trend is also seen in a bivariate regression of the times and
fixation counts on the map and instrument panel. These two fixation locations
show decreases in both areas with increased experience. Correspondingly, a
slight increase in out-the-window dwell times and fixation occurs.
Figure 17. in the Appendix shows the trends in gaze locations by
scenario. When we look at the OTW graph, we see that all experience levels
look out the window most when the task is strictly target detection & identification
(Scenario 4). The IP and map regressions are relatively inconclusive for
Scenarios 3 and 4, but in Scenario 2, there was a trend of decreasing fixations
with experience. These will be discussed more in the following chapter.
44
2. Hypothesis Two
H02: There will be no significant correlation between eye scan pattern
and performance in the Navigation, Target Detection, and Navigation & Target
Detection tasks.
HA2: Pilots with more efficient eye scan patterns (more saccades, shorter
and more fixations, fixations on salient instruments and stimuli) will perform
better on the navigation (by adherence to the given course), target detection
(more Correct Detections versus Incorrect and Missed Detections), and
combination tasks.
a. Navigation
We analyzed navigation performance via the fixation count, median
dwell time, saccades per minute, and the respective interactions between the
three. Only Scenarios 2 and 3 were analyzed as Scenario 4 was on autopilot
and the minor differences in RMS error were due to randomness in the
applications rather than pilot ability. Figure 18. shows the multivariate
interactions between these variables. As shown in Hypothesis 1, there is a
strong and logical correlation between fixation count, median dwell time, and
saccades per minute. However, none of these variables appears to have any
effect on the root-mean-square (RMS) error in the navigation tasks. When we
test the interactions between the effects (Figure 19. ), we do not get any
statistically significant results. However, given the sample size, there are some
candidates for significance if a larger sample could be attained: overall fixations
(p = 0.186), fixation × median dwell time (p = 0.086), and median dwell time ×
SPM (p = 0.238). Additionally, we ran RMS error against total flight hours and
ranked experience and found that neither of these had any effect on the accuracy
of navigation (flight hours p = 0.927, ranked experience p = 0.849). This
supports the findings by Sullivan (2010) and could be explained by a more
45
experienced pilot’s purposeful deviation from a given path for obstacle
avoidance, timing, or possible other reasons.
b. Target Detection
Using similar methodologies, we analyzed target detection using
the correct detections from Scenarios 3 and 4. Although false positive
(incorrectly identified detection) data was collected, the false alarm rate was too
low to warrant any sort of dependable analysis on the data. In Scenario 3
(Figure 20. ), Navigation & Target Detection, there is a very strong effect factor
(p = 0.002, F = 80.64), with significant correlations showing up across all
parameters and interactions; overall fixations (p = 0.029), SPM (p = 0.005),
median dwell × overall fixations (p = 0.003), median dwell × SPM (p = 0.039),
overall fixations × SPM (p < 0.001), overall fixations × median dwell × SPM (p <
0.001). Interestingly, in Scenario 4 where the participant’s only task was to
detect and identify the targets, the effects from Scenario 3 did not carry over.
The overall model for Scenario 4 was not significant (p = 0.107, F = 4.998) and
the only significant predictor was median dwell time (p = 0.046) (Figure 21. )
However, overall fixations (p = 0.089), and median dwell × SPM (p = 0.097) both
show a possible significance given a larger data set. In both scenarios, total
flight hours and ranked experience did not show any correlation with correct
detections. We did not find any correlation between scan patterns (gaze
locations) and target detection performance.
3. Hypothesis 3
H0: Regardless of expertise, there will be no difference in blink rates
across scenarios.
HA: Pilots with more experience will have a higher blink rate than pilots
with less experience.
Hypothesis 3 is not supported by the data. However, there was a trend
towards a lower blink rate as experience increased. Figure 7. shows all three
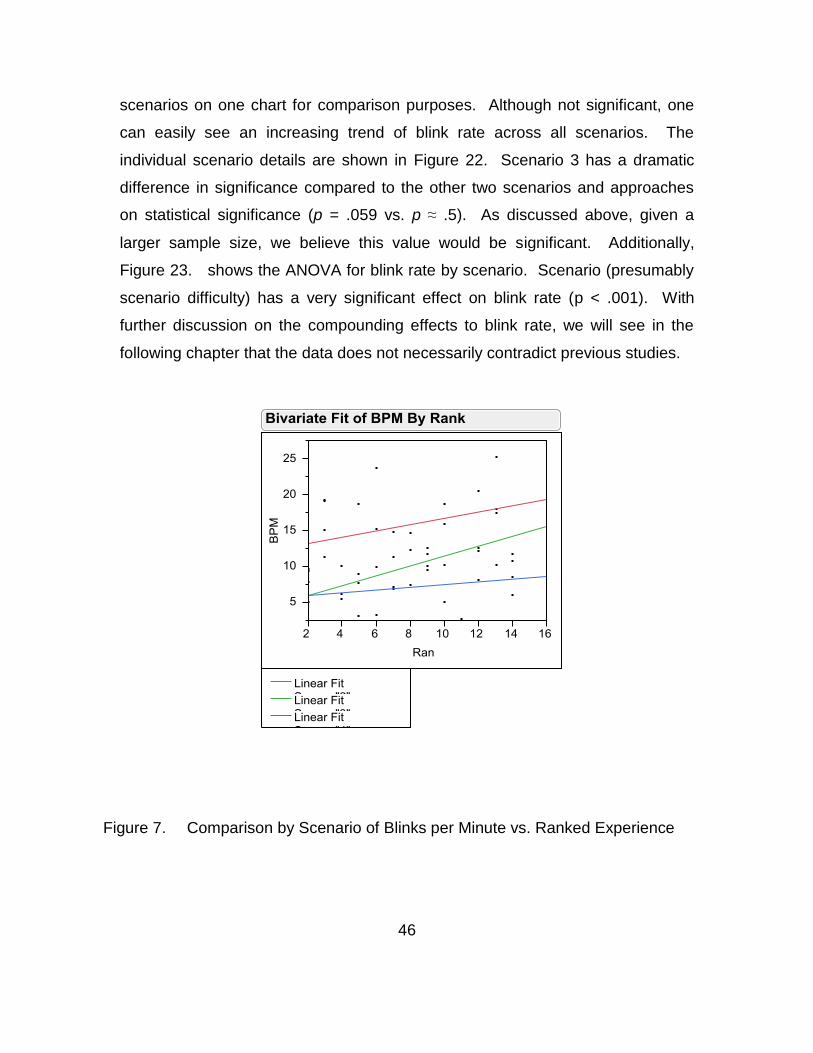
46
scenarios on one chart for comparison purposes. Although not significant, one
can easily see an increasing trend of blink rate across all scenarios. The
individual scenario details are shown in Figure 22. Scenario 3 has a dramatic
difference in significance compared to the other two scenarios and approaches
on statistical significance (p = .059 vs. p ≈ .5). As discussed above, given a
larger sample size, we believe this value would be significant. Additionally,
Figure 23. shows the ANOVA for blink rate by scenario. Scenario (presumably
scenario difficulty) has a very significant effect on blink rate (p < .001). With
further discussion on the compounding effects to blink rate, we will see in the
following chapter that the data does not necessarily contradict previous studies.
Comparison by Scenario of Blinks per Minute vs. Ranked Experience Figure 7.
47
V. DISCUSSION, CONCLUSION, AND RECOMMENDATIONS
A. DISCUSSION
The purpose of this study was to analyze the effects of expertise and skills
that would typically be associated with expertise during navigation, target
detection, and combination tasks on a flight simulator. Although the results do
not support all of the hypotheses, we will discuss what would affect the data.
One common denominator across the hypotheses is the small sample size on
which the team conducted the tests. With the population available at the Naval
Postgraduate School, the ability to recruit larger samples is not always a readily
viable option. However, even with a small sample size, we are able to glean
some insights into the effects of experience on various tasks.
1. Hypothesis 1
HA1: More experienced pilots will have more saccades, shorter and more
fixations, more fixations on salient instruments and stimuli than inexperienced
pilots—partially accepted.
Although the regression for the saccades per minute by ranked
experience did not show any significance, there is an increasing trend between
the two that may show significance if we had a larger sample population. We
propose that experienced pilots are looking around the scene more, acquiring
more visual information, and presumably, processing this information faster than
inexperienced pilots to create a more thorough mental picture of their
environment.
Contrary to the above inference, the lack of a significant relationship
between fixations (dwell time and total fixations) and experience provides an
intriguing result. We found a strong correlation between median dwell time and
the overall fixations (p < .001), which should come from an analysis of cause-
effect—in order to have more fixations in a set time, one must reduce the length
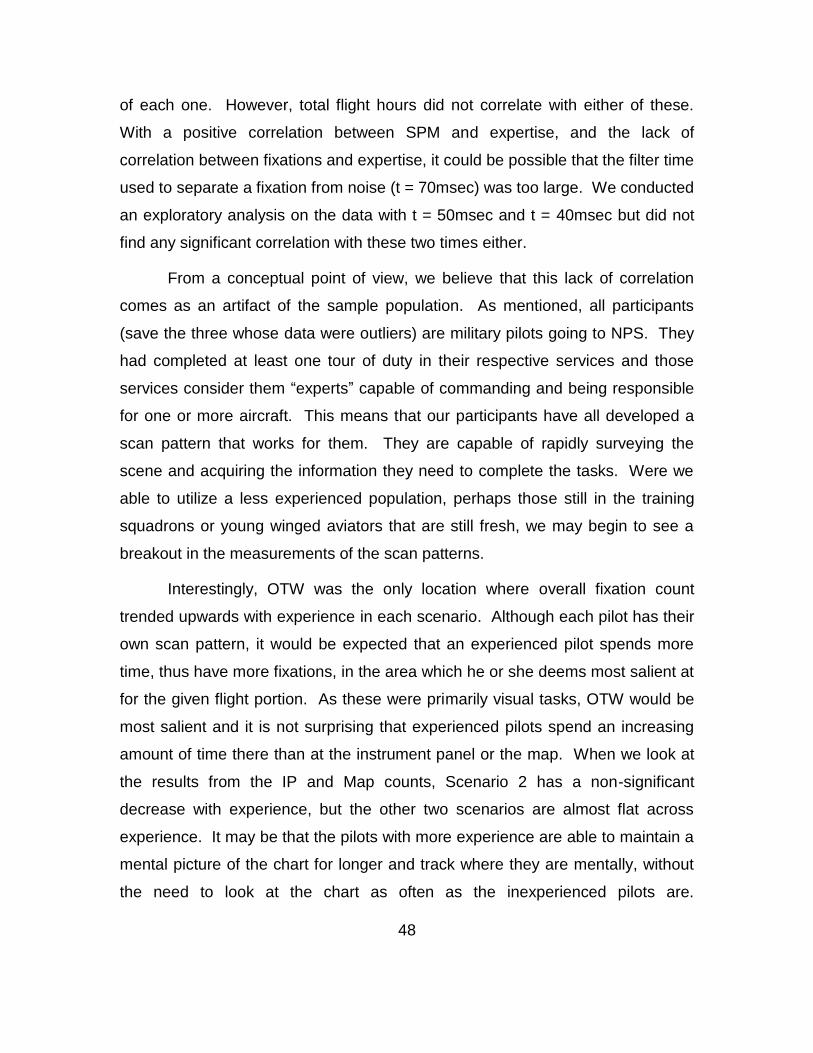
48
of each one. However, total flight hours did not correlate with either of these.
With a positive correlation between SPM and expertise, and the lack of
correlation between fixations and expertise, it could be possible that the filter time
used to separate a fixation from noise (t = 70msec) was too large. We conducted
an exploratory analysis on the data with t = 50msec and t = 40msec but did not
find any significant correlation with these two times either.
From a conceptual point of view, we believe that this lack of correlation
comes as an artifact of the sample population. As mentioned, all participants
(save the three whose data were outliers) are military pilots going to NPS. They
had completed at least one tour of duty in their respective services and those
services consider them “experts” capable of commanding and being responsible
for one or more aircraft. This means that our participants have all developed a
scan pattern that works for them. They are capable of rapidly surveying the
scene and acquiring the information they need to complete the tasks. Were we
able to utilize a less experienced population, perhaps those still in the training
squadrons or young winged aviators that are still fresh, we may begin to see a
breakout in the measurements of the scan patterns.
Interestingly, OTW was the only location where overall fixation count
trended upwards with experience in each scenario. Although each pilot has their
own scan pattern, it would be expected that an experienced pilot spends more
time, thus have more fixations, in the area which he or she deems most salient at
for the given flight portion. As these were primarily visual tasks, OTW would be
most salient and it is not surprising that experienced pilots spend an increasing
amount of time there than at the instrument panel or the map. When we look at
the results from the IP and Map counts, Scenario 2 has a non-significant
decrease with experience, but the other two scenarios are almost flat across
experience. It may be that the pilots with more experience are able to maintain a
mental picture of the chart for longer and track where they are mentally, without
the need to look at the chart as often as the inexperienced pilots are.
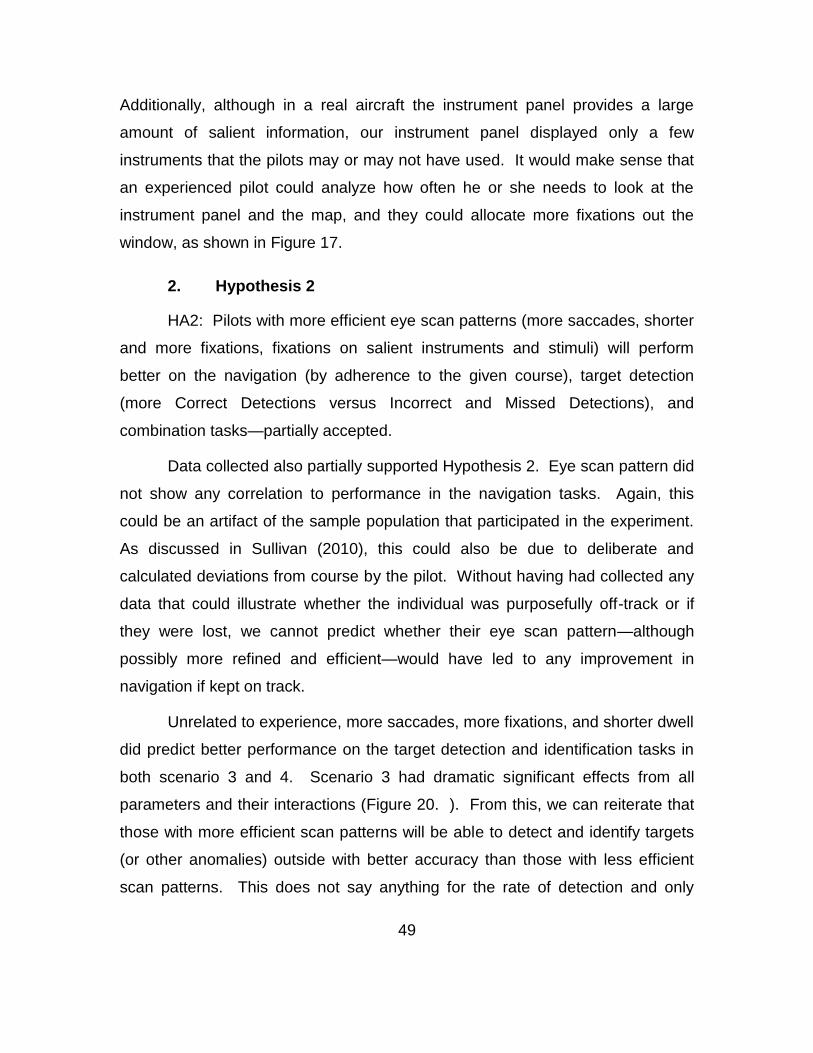
49
Additionally, although in a real aircraft the instrument panel provides a large
amount of salient information, our instrument panel displayed only a few
instruments that the pilots may or may not have used. It would make sense that
an experienced pilot could analyze how often he or she needs to look at the
instrument panel and the map, and they could allocate more fixations out the
window, as shown in Figure 17.
2. Hypothesis 2
HA2: Pilots with more efficient eye scan patterns (more saccades, shorter
and more fixations, fixations on salient instruments and stimuli) will perform
better on the navigation (by adherence to the given course), target detection
(more Correct Detections versus Incorrect and Missed Detections), and
combination tasks—partially accepted.
Data collected also partially supported Hypothesis 2. Eye scan pattern did
not show any correlation to performance in the navigation tasks. Again, this
could be an artifact of the sample population that participated in the experiment.
As discussed in Sullivan (2010), this could also be due to deliberate and
calculated deviations from course by the pilot. Without having had collected any
data that could illustrate whether the individual was purposefully off-track or if
they were lost, we cannot predict whether their eye scan pattern—although
possibly more refined and efficient—would have led to any improvement in
navigation if kept on track.
Unrelated to experience, more saccades, more fixations, and shorter dwell
did predict better performance on the target detection and identification tasks in
both scenario 3 and 4. Scenario 3 had dramatic significant effects from all
parameters and their interactions (Figure 20. ). From this, we can reiterate that
those with more efficient scan patterns will be able to detect and identify targets
(or other anomalies) outside with better accuracy than those with less efficient
scan patterns. This does not say anything for the rate of detection and only
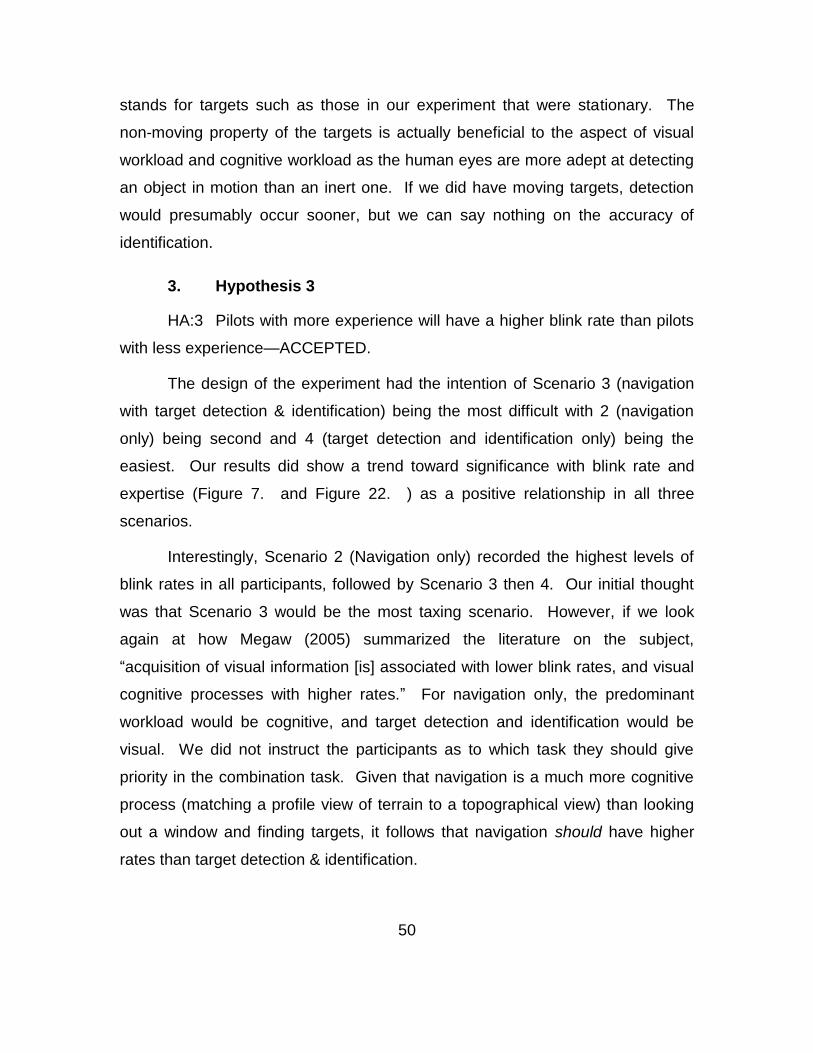
50
stands for targets such as those in our experiment that were stationary. The
non-moving property of the targets is actually beneficial to the aspect of visual
workload and cognitive workload as the human eyes are more adept at detecting
an object in motion than an inert one. If we did have moving targets, detection
would presumably occur sooner, but we can say nothing on the accuracy of
identification.
3. Hypothesis 3
HA:3 Pilots with more experience will have a higher blink rate than pilots
with less experience—ACCEPTED.
The design of the experiment had the intention of Scenario 3 (navigation
with target detection & identification) being the most difficult with 2 (navigation
only) being second and 4 (target detection and identification only) being the
easiest. Our results did show a trend toward significance with blink rate and
expertise (Figure 7. and Figure 22. ) as a positive relationship in all three
scenarios.
Interestingly, Scenario 2 (Navigation only) recorded the highest levels of
blink rates in all participants, followed by Scenario 3 then 4. Our initial thought
was that Scenario 3 would be the most taxing scenario. However, if we look
again at how Megaw (2005) summarized the literature on the subject,
“acquisition of visual information [is] associated with lower blink rates, and visual
cognitive processes with higher rates.” For navigation only, the predominant
workload would be cognitive, and target detection and identification would be
visual. We did not instruct the participants as to which task they should give
priority in the combination task. Given that navigation is a much more cognitive
process (matching a profile view of terrain to a topographical view) than looking
out a window and finding targets, it follows that navigation should have higher
rates than target detection & identification.
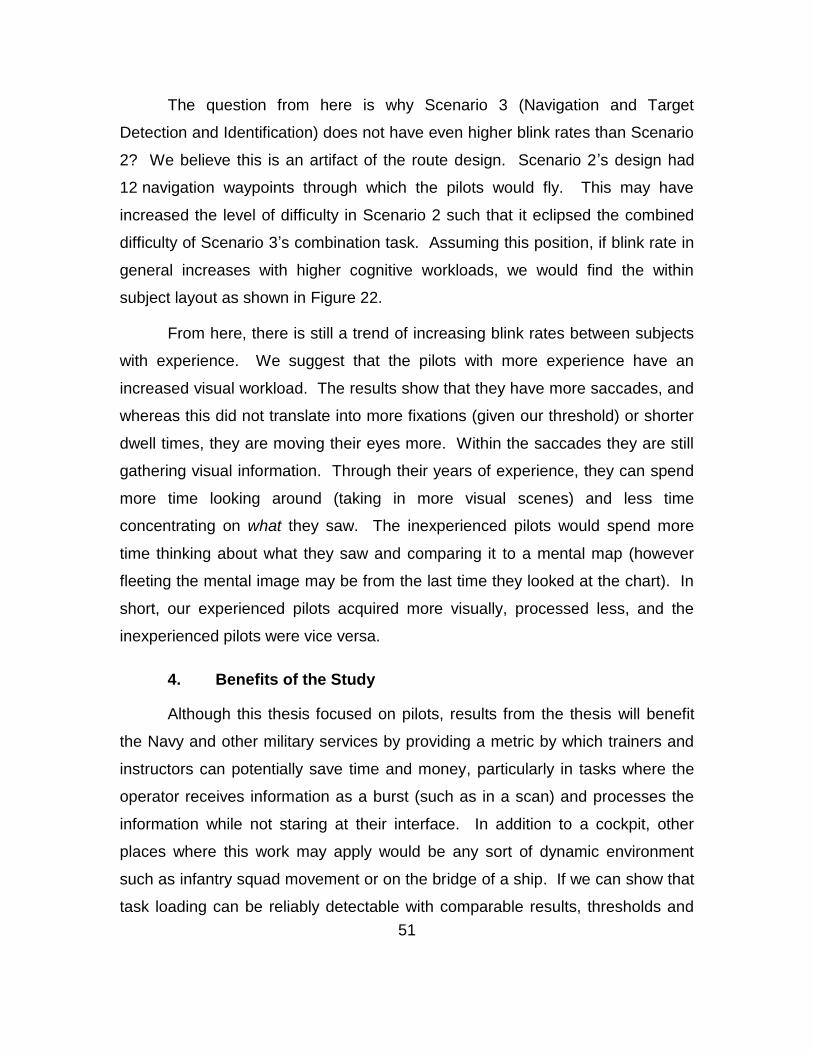
51
The question from here is why Scenario 3 (Navigation and Target
Detection and Identification) does not have even higher blink rates than Scenario
2? We believe this is an artifact of the route design. Scenario 2’s design had
12 navigation waypoints through which the pilots would fly. This may have
increased the level of difficulty in Scenario 2 such that it eclipsed the combined
difficulty of Scenario 3’s combination task. Assuming this position, if blink rate in
general increases with higher cognitive workloads, we would find the within
subject layout as shown in Figure 22.
From here, there is still a trend of increasing blink rates between subjects
with experience. We suggest that the pilots with more experience have an
increased visual workload. The results show that they have more saccades, and
whereas this did not translate into more fixations (given our threshold) or shorter
dwell times, they are moving their eyes more. Within the saccades they are still
gathering visual information. Through their years of experience, they can spend
more time looking around (taking in more visual scenes) and less time
concentrating on what they saw. The inexperienced pilots would spend more
time thinking about what they saw and comparing it to a mental map (however
fleeting the mental image may be from the last time they looked at the chart). In
short, our experienced pilots acquired more visually, processed less, and the
inexperienced pilots were vice versa.
4. Benefits of the Study
Although this thesis focused on pilots, results from the thesis will benefit
the Navy and other military services by providing a metric by which trainers and
instructors can potentially save time and money, particularly in tasks where the
operator receives information as a burst (such as in a scan) and processes the
information while not staring at their interface. In addition to a cockpit, other
places where this work may apply would be any sort of dynamic environment
such as infantry squad movement or on the bridge of a ship. If we can show that
task loading can be reliably detectable with comparable results, thresholds and

52
limits can be established primarily in the training commands so that individualized
training syllabi can be developed. Additionally, in the operational squadrons, it
can be utilized to determine which individuals are naturally inclined towards
certain mission sets and tracks can be defined for further training.
B. CONCLUSION
The realm of cognition is broad and in a military environment specifically,
anything that can maintain the balance between performance and arousal level is
beneficial. However, we must be able to detect these changes in individuals in
real time. Experience was not found to have significance in many of the
analyses we conducted. As mentioned in the discussion for Hypothesis 1, we
posit that our sample size may have been too small to get significance from the
experiment. With a Spearman’s correlation accounting for the flight hour bias in
the study, we did get significance showing that more experience can be detected
by an increase in saccades. Although we were not able to determine how the
saccades related to scan pattern, the increase in saccades allows for more
fixations, which should lead to a greater intake of visual information. It is in the
processing of this visual information where experience would come into play. A
more experienced pilot should be able to process what he or she is seeing with
better efficiency than an inexperienced pilot.
Our results from the navigation portion support previous research done by
Sullivan (2010). Navigation is a fluid process where unless told otherwise, one is
able to make adjustments on the fly. Knowing that waypoints are (most often)
not optional, the ability for an experienced pilot to make adjustments along his
route of flight is one aspect, and responsibility, that they have in being a senior
pilot. We did not show any decrease in RMS error along the flight route as
experience increased, but as explained above, this could possibly be the
experienced pilots merely making up for lost time, earlier deviations, threats,
terrain, or weather by adjusting their route.
53
Cognitive workload in this experiment, although not statistically significant,
showed a nice trend to support the given literature. In a task that requires more
processing of the visual information, our blink rates supported what Megaw
(2005) wrote regarding both the increase within tasks (between individuals) and
between tasks. To be able to use this metric in future work would be reliable as it
does not require the fidelity and resolution that pupillometry would require.
C. RECOMMENDATIONS
1. Future Work
This research can benefit from further study in multiple areas. Presented
below are a few of the areas, but any one of them could be expanded or
narrowed in order to refine the process of detecting cognitive workloads.
a. Pupil Data
In Chapter II, we explained how pupils are effective indicators of
cognitive workload. When collected, the data can provide a much more precise
indicator of when an individual is experiencing cognitive load. Although one can
consciously control blinks if they wanted to, they cannot control the fine workings
of the pupil. It will contract and dilate unbeknownst to the individual and in
response to certain environmental and cognitive cues. With this experiment, we
were not able to capture enough pupil data to make this a viable option. As of
this writing, another experiment is being designed at NPS to explore pupillometry
and cognitive workload further, but it could benefit from larger populations, and
populations that are more diverse.
b. Use Fleet and Training Squadrons
One major obstacle at NPS is that of sample populations. A
majority of military officers (U.S. and international) that have already completed
one or more tours of duty in their respective services attends the school. As
such, and as mentioned, our pool of pilots was, in the eyes of the military,
54
experienced. Those with less hours than our population would be found in the
fleet squadrons (< ~800 hours), the Fleet Replacement Squadrons (< ~300
hours), and the training squadrons (< ~200 hours). To be able to use those
populations as well would create a much more dynamic mix of experience from
the truly novice in the training squadrons, to the officers with multiple fleet tours
of experience. The Navy’s initial core training occurs in a few cities in Florida,
Texas, and Mississippi. If those training squadrons are not available to use, the
Fleet Replacement Squadrons in Virginia, California, and Florida would provide
the next layer of experience. This would consist of officially designated pilots that
have completed flight training and are learning their operational aircraft. The
other services have similar programs that would allow a more assorted selection
of individuals and training regimes. Lastly, only one participant could be
considered “current” with his flight hours, with the rest having not flown in none
less than five months. Access to the squadrons would reduce this variability as
well as pilots in fleet squadrons are required to maintain a minimum monthly
flight hour quota.
c. Allow Full Flight Control
The discussion for Hypothesis 3 mentioned how our navigation
scenario may have been more difficult than planned. In actual flight, one is not
only maintaining heading and possibly looking for targets on the ground. They
would be maintaining altitude and airspeed, communicating with other forces,
checking the status and health of the aircraft, along with a myriad of other tasks.
In a crewed aircraft this can, and is, divided among the members, but in a single-
seat aircraft, one individual is responsible for the entirety. To test cognitive
workload and truly see how experienced pilots manage their scans and tasks, we
would need an experiment that incorporates more of these tasks, perhaps in
increments. It would be interesting to see how experienced pilots cope when
they finally reach their cognitive workload threshold. Which tasks do they shed (if
any) in order to give priority to the more essential jobs? Is there a method they
55
use to remain at the peak of the arousal-performance curve? What happens
when they start falling one way or another on the curve?
2. Training Applications
Training applications with the use of cognitive workload detection would
have to be refined and incorporated into current training syllabi in order to be
effective. In a concurrent thesis at NPS, an individual has taken the eye tracking
equipment to simulators in existing fleet squadrons to study scan patterns in
relation to controlled flight into terrain. This shows that the equipment can be set
up and operated in operational commands. To be able to use it regularly to
analyze the pilots’ gazes and scan patterns could provide instant feedback and
allow them to consciously adjust their scan if need be. For obvious reasons, the
equipment use in an actual aircraft is not feasible for safety reasons, but being
able to set it up temporarily or permanently in a simulator is safe.
If we could detect and analyze cognitive workloads in real time, the
training environment could change dramatically. Trainers and instructors would
know what tasks an individual has difficulty on and concentrate on those while
spending less time on a task in which the individual shows proficiency. It could
also allow a young pilot to fine tune his or her scan prior to entering the actual
cockpit. As time is at a premium in the military, optimization of the time and
resources available can lead to a better product in the end.

56
THIS PAGE INTENTIONALLY LEFT BLANK
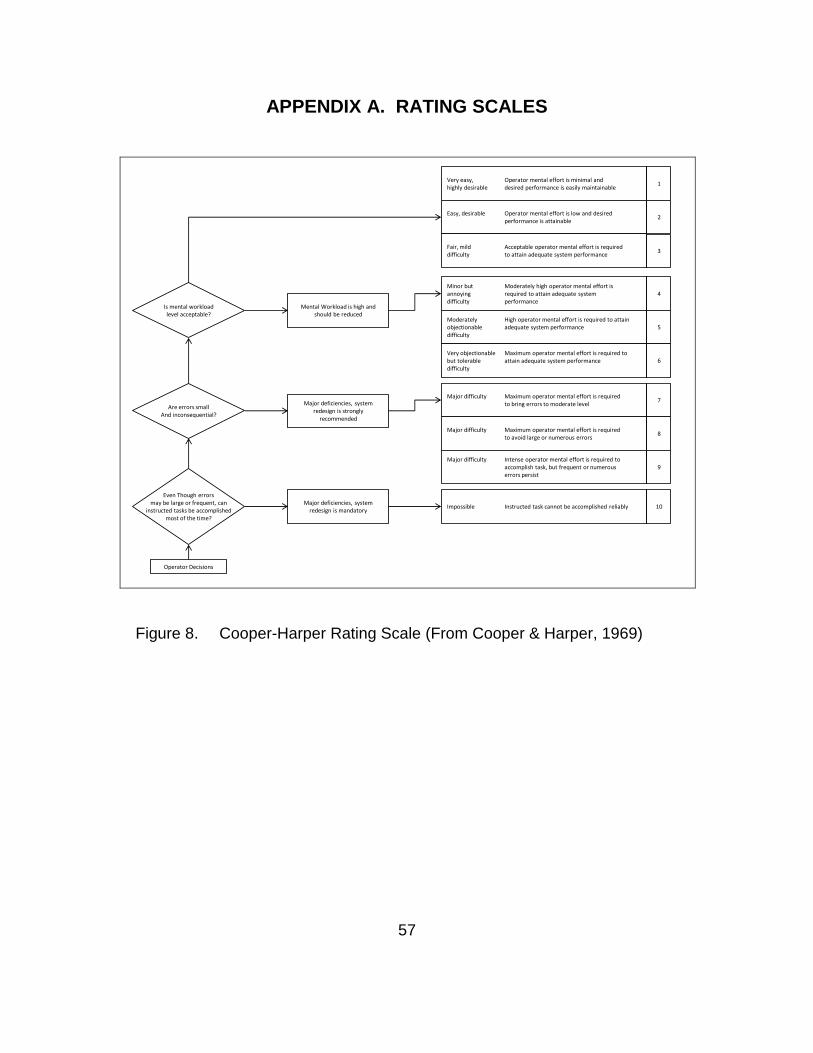
57
APPENDIX A. RATING SCALES
Operator Decisions
Even Though errorsmay be large or frequent, can
instructed tasks be accomplishedmost of the time?
Are errors smallAnd inconsequential?
Is mental workloadlevel acceptable?
Mental Workload is high and should be reduced
Major deficiencies, system redesign is strongly
recommended
Major deficiencies, system redesign is mandatory
Minor but Moderately high operator mental effort isannoying required to attain adequate systemdifficulty performance
4
Very easy, Operator mental effort is minimal andhighly desirable desired performance is easily maintainable
1
Easy, desirable Operator mental effort is low and desired performance is attainable
2
Fair, mild Acceptable operator mental effort is requireddifficulty to attain adequate system performance
3
Moderately High operator mental effort is required to attainobjectionable adequate system performancedifficulty
5
Very objectionable Maximum operator mental effort is required tobut tolerable attain adequate system performancedifficulty
6
Major difficulty Maximum operator mental effort is requiredto bring errors to moderate level
7
Major difficulty Maximum operator mental effort is requiredto avoid large or numerous errors
8
Major difficulty Intense operator mental effort is required toaccomplish task, but frequent or numerouserrors persist
9
Impossible Instructed task cannot be accomplished reliably 10
Cooper-Harper Rating Scale (From Cooper & Harper, 1969) Figure 8.
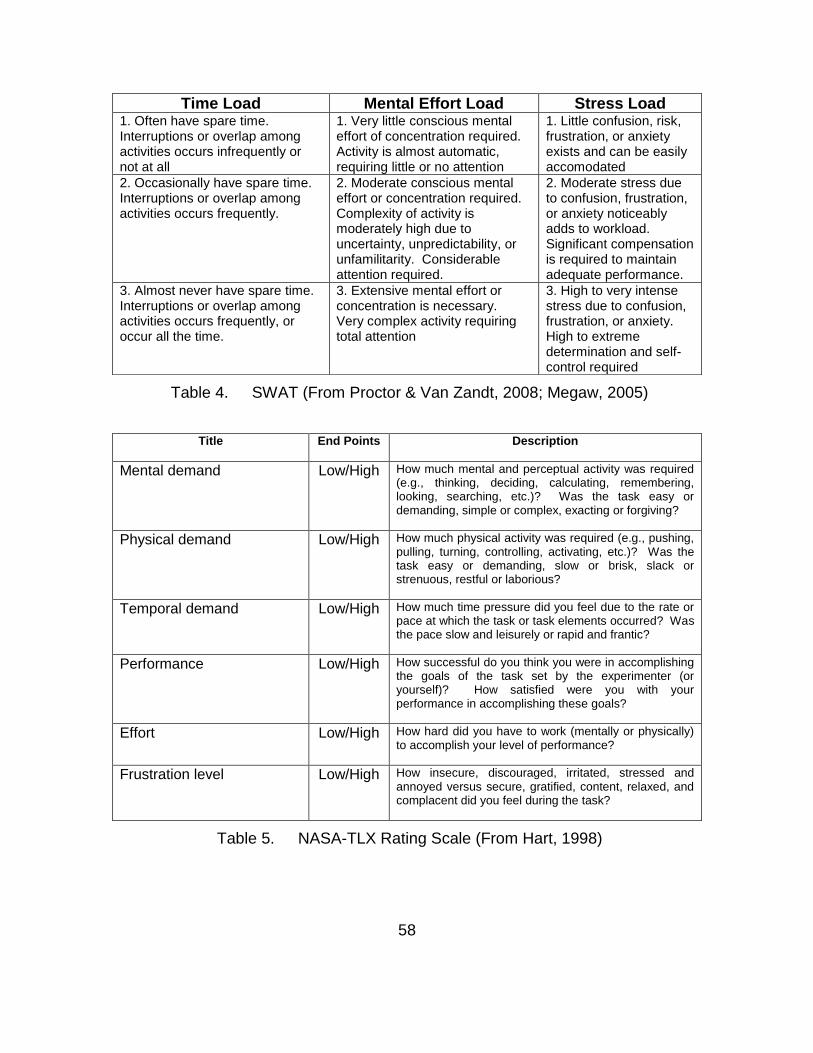
58
Table 4. SWAT (From Proctor & Van Zandt, 2008; Megaw, 2005)
Title End Points Description
Mental demand Low/High How much mental and perceptual activity was required (e.g., thinking, deciding, calculating, remembering, looking, searching, etc.)? Was the task easy or demanding, simple or complex, exacting or forgiving?
Physical demand Low/High How much physical activity was required (e.g., pushing, pulling, turning, controlling, activating, etc.)? Was the task easy or demanding, slow or brisk, slack or strenuous, restful or laborious?
Temporal demand Low/High How much time pressure did you feel due to the rate or pace at which the task or task elements occurred? Was the pace slow and leisurely or rapid and frantic?
Performance Low/High How successful do you think you were in accomplishing the goals of the task set by the experimenter (or yourself)? How satisfied were you with your performance in accomplishing these goals?
Effort Low/High How hard did you have to work (mentally or physically) to accomplish your level of performance?
Frustration level Low/High How insecure, discouraged, irritated, stressed and annoyed versus secure, gratified, content, relaxed, and complacent did you feel during the task?
Table 5. NASA-TLX Rating Scale (From Hart, 1998)
Time Load Mental Effort Load Stress Load 1. Often have spare time. Interruptions or overlap among activities occurs infrequently or not at all
1. Very little conscious mental effort of concentration required. Activity is almost automatic, requiring little or no attention
1. Little confusion, risk, frustration, or anxiety exists and can be easily accomodated
2. Occasionally have spare time. Interruptions or overlap among activities occurs frequently.
2. Moderate conscious mental effort or concentration required. Complexity of activity is moderately high due to uncertainty, unpredictability, or unfamilitarity. Considerable attention required.
2. Moderate stress due to confusion, frustration, or anxiety noticeably adds to workload. Significant compensation is required to maintain adequate performance.
3. Almost never have spare time. Interruptions or overlap among activities occurs frequently, or occur all the time.
3. Extensive mental effort or concentration is necessary. Very complex activity requiring total attention
3. High to very intense stress due to confusion, frustration, or anxiety. High to extreme determination and self-control required
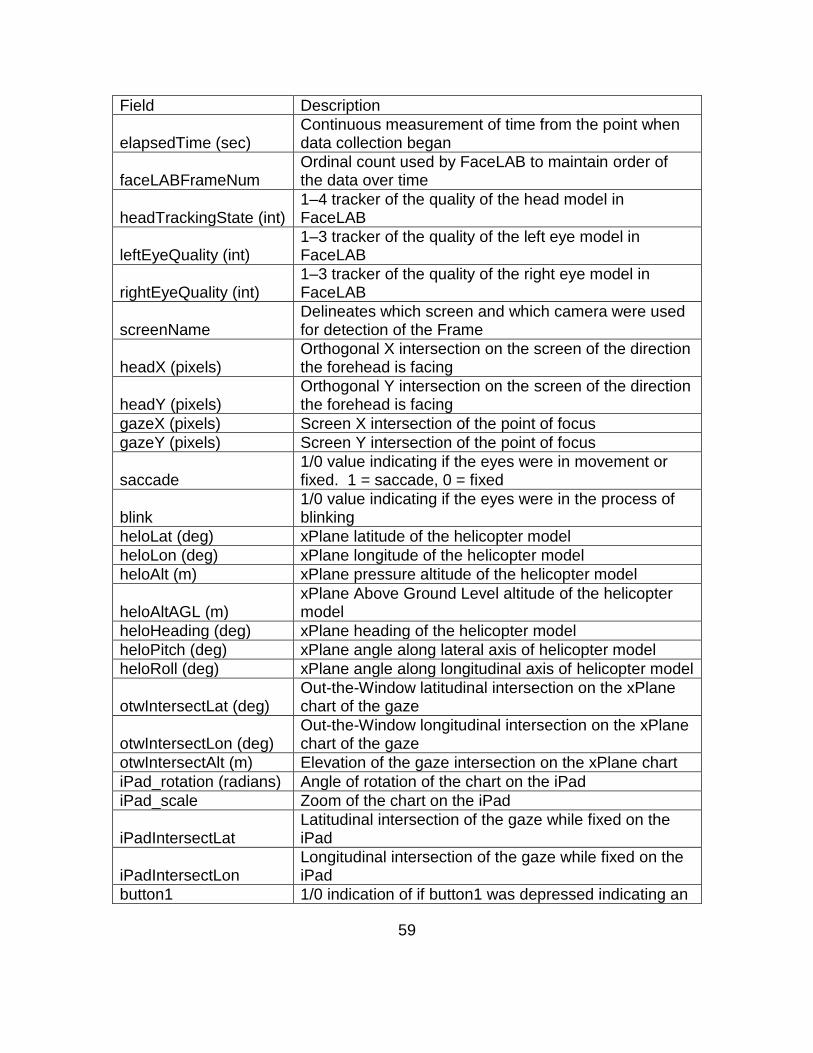
59
Field Description
elapsedTime (sec) Continuous measurement of time from the point when data collection began
faceLABFrameNum Ordinal count used by FaceLAB to maintain order of the data over time
headTrackingState (int) 1–4 tracker of the quality of the head model in FaceLAB
leftEyeQuality (int) 1–3 tracker of the quality of the left eye model in FaceLAB
rightEyeQuality (int) 1–3 tracker of the quality of the right eye model in FaceLAB
screenName Delineates which screen and which camera were used for detection of the Frame
headX (pixels) Orthogonal X intersection on the screen of the direction the forehead is facing
headY (pixels) Orthogonal Y intersection on the screen of the direction the forehead is facing
gazeX (pixels) Screen X intersection of the point of focus
gazeY (pixels) Screen Y intersection of the point of focus
saccade 1/0 value indicating if the eyes were in movement or fixed. 1 = saccade, 0 = fixed
blink 1/0 value indicating if the eyes were in the process of blinking
heloLat (deg) xPlane latitude of the helicopter model
heloLon (deg) xPlane longitude of the helicopter model
heloAlt (m) xPlane pressure altitude of the helicopter model
heloAltAGL (m) xPlane Above Ground Level altitude of the helicopter model
heloHeading (deg) xPlane heading of the helicopter model
heloPitch (deg) xPlane angle along lateral axis of helicopter model
heloRoll (deg) xPlane angle along longitudinal axis of helicopter model
otwIntersectLat (deg) Out-the-Window latitudinal intersection on the xPlane chart of the gaze
otwIntersectLon (deg) Out-the-Window longitudinal intersection on the xPlane chart of the gaze
otwIntersectAlt (m) Elevation of the gaze intersection on the xPlane chart
iPad_rotation (radians) Angle of rotation of the chart on the iPad
iPad_scale Zoom of the chart on the iPad
iPadIntersectLat Latitudinal intersection of the gaze while fixed on the iPad
iPadIntersectLon Longitudinal intersection of the gaze while fixed on the iPad
button1 1/0 indication of if button1 was depressed indicating an

60
identified SAM
button2 1/0 indication of if button1 was depressed indicating an identified crashed plane
Table 6. CSV Table Fields
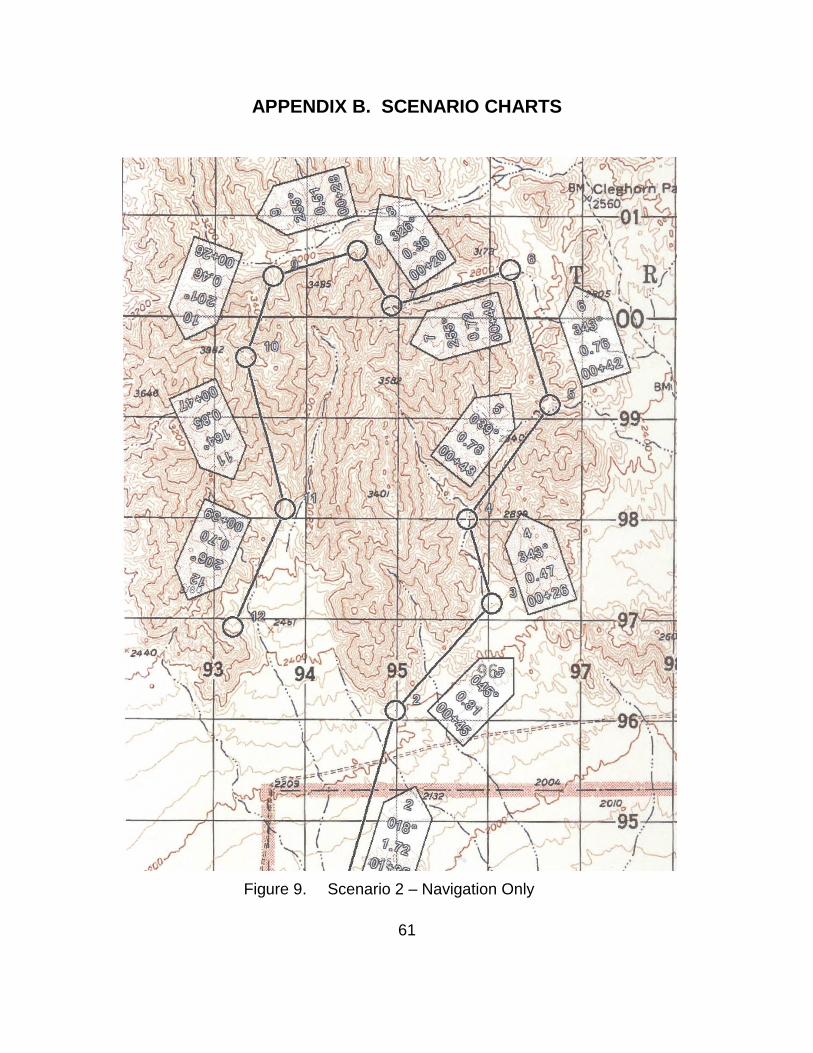
61
APPENDIX B. SCENARIO CHARTS
Scenario 2 – Navigation Only Figure 9.
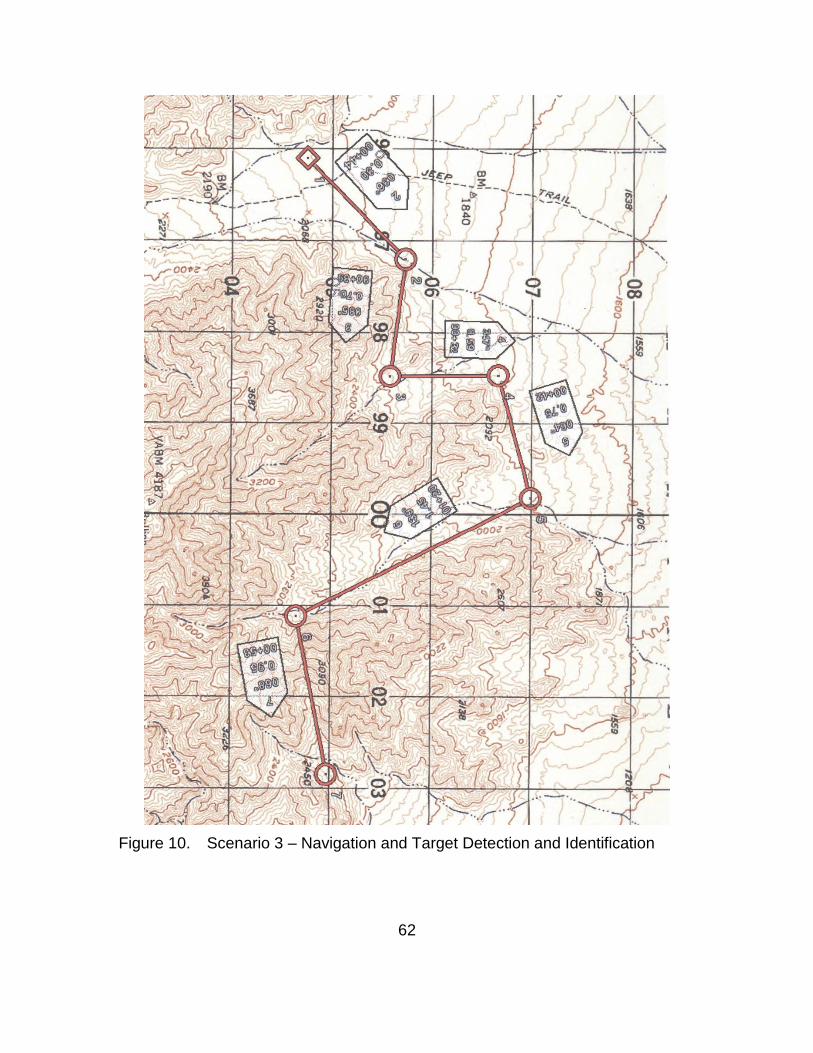
62
Scenario 3 – Navigation and Target Detection and Identification Figure 10.
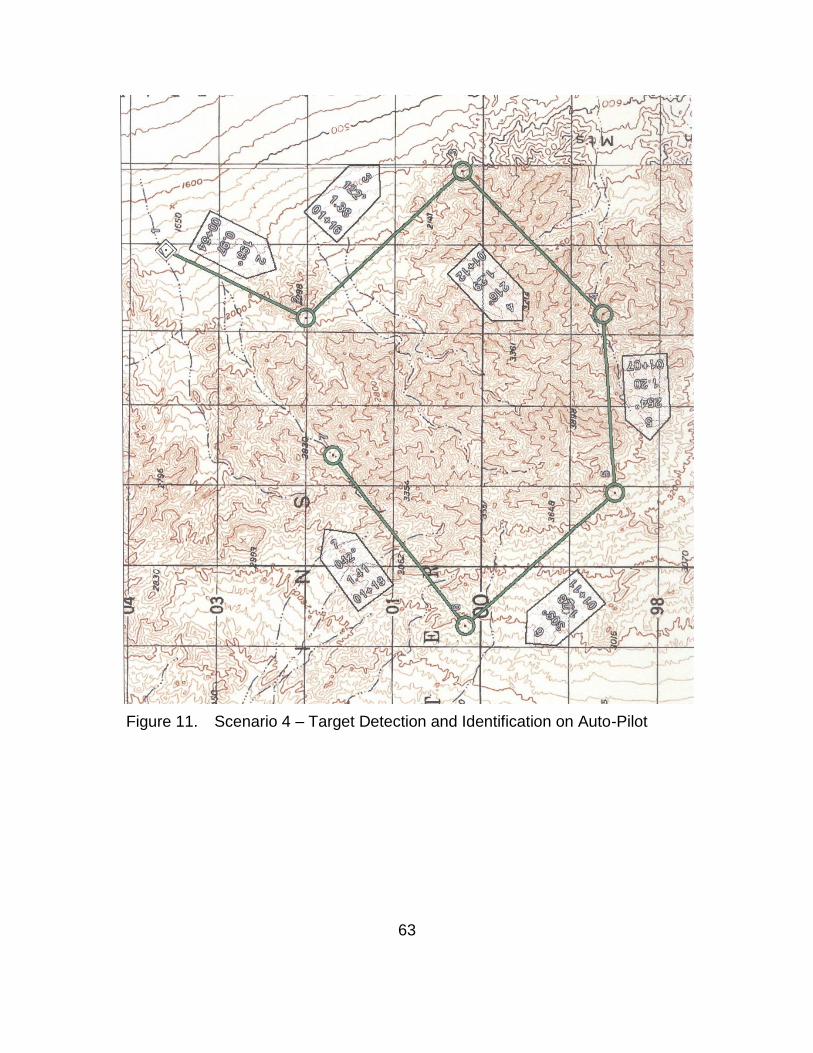
63
Scenario 4 – Target Detection and Identification on Auto-Pilot Figure 11.

64
THIS PAGE INTENTIONALLY LEFT BLANK
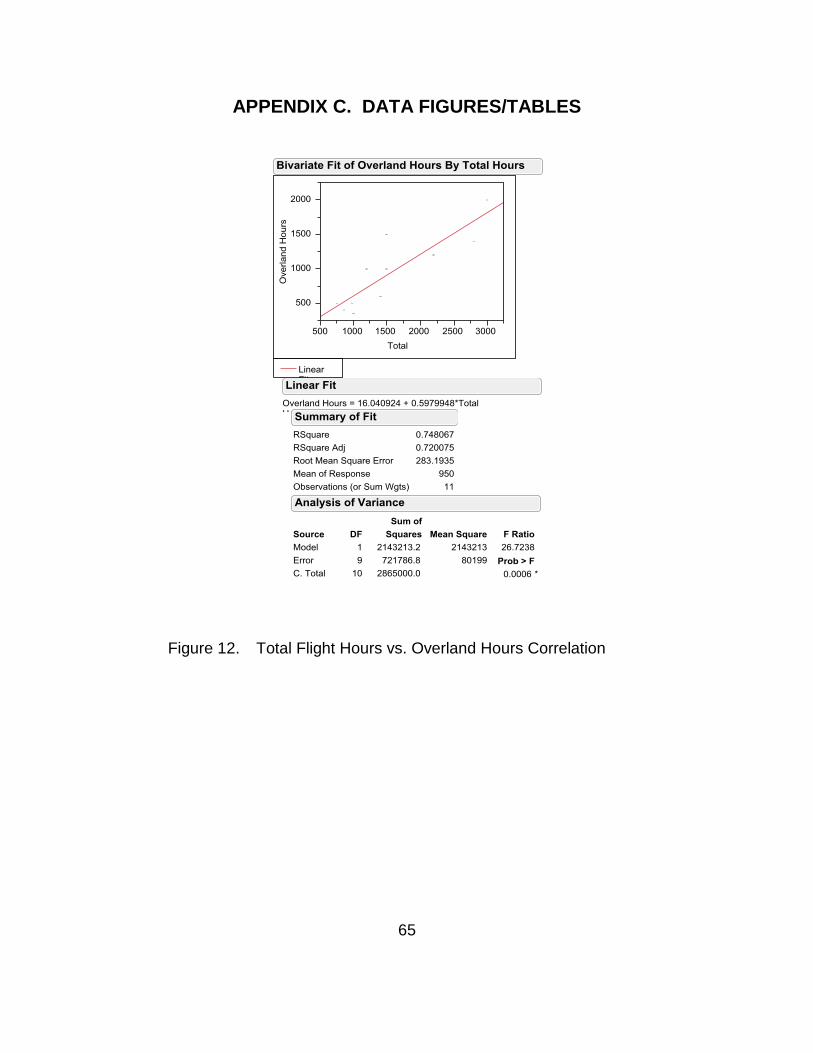
65
APPENDIX C. DATA FIGURES/TABLES
Total Flight Hours vs. Overland Hours Correlation Figure 12.

66
Route Type Lat Lon 108 115 101 103 111 102 112 109 106 107 105 104 114 110
Practice SAM 34.303032 -115.895676 0.004 0.006 0.008 Detected & Identified
SAM 34.3148167 -115.8903167 0.005 0.005 0.002 Detected & Misidentified
Crashed Plane 34.3185 -115.883533 0.010 Probable Detection
SAM 34.319767 -115.876033 0.012 0.007 Not Detected
Crashed Plane 34.3208 -115.87055 0.016 0.004 From Helo Position
Crashed Plane 34.324863 -115.857674 0.005 0.004 0.005
SAM 34.330303 -115.85276
SAM 34.336517 -115.856308 0.002 0.002 0.010
Crashed Plane 34.362141 -115.869911
Crashed Plane 34.367672 -115.889862 0.003 0.003 0.007
SAM 34.340786 -115.888756 0.003
Crashed Plane 34.335411 -115.892281 0.003 0.004
True Positive Plane 1 4 3 5 2 5 2 5 4 4 3 2 5 5
False Positive Plane 1 0 0 0 1 0 0 0 0 1 1 0 0 0
True Positive SAM 3 4 4 3 2 6 1 3 4 3 3 2 5 6
False Positive SAM 0 1 1 0 0 0 0 0 1 0 0 0 0 0
False Negative 0 0 0 0 0 0 0 2 0 0 0 0 0 0
Missed Detection 7 3 4 4 7 1 9 4 3 4 5 8 2 1
Nav and Identify Crashed Plane 34.386154 -115.95 0.005 0.006 0.005 0.003
SAM 34.387405 -115.943802 0.009 0.007
SAM 34.392745 -115.941994 0.006 0.008 0.005 0.003 0.004
SAM 34.389198 -115.939331 0.004 0.004
Crashed Plane 34.392277 -115.928734 0.005 0.003 0.001 0.002 0.001 0.002
Crashed Plane 34.40279 -115.927483 0.007
SAM 34.3988 -115.914169 0.006 0.007 0.006 0.006
Crashed Plane 34.394493 -115.911667
SAM 34.384644 -115.909927 0.005 0.009
Crashed Plane 34.379684 -115.90448 0.001 0.003
Crashed Plane 34.382454 -115.883095 0.002 0.009 0.011
True Positive Plane 3 3 4 5 4 3 4 1 2 3 3 3 3 2
False Positive Plane 0 1 0 0 1 2 0 1 0 1 0 0 1 0
True Positive SAM 4 4 3 4 4 5 4 5 2 4 2 4 5 5
False Positive SAM 1 0 0 0 0 0 0 0 0 0 0 0 0 0
False Negative 0 0 0 1 1 0 0 0 0 0 0 0 0 0
Missed Detection 3 3 4 2 2 1 3 4 7 3 6 4 2 4
Auto Pilot Crashed Plane 34.361977 -115.769272
SAM 34.356796 -115.767075
Crashed Plane 34.351295 -115.773979 0.003 0.013 0.003 0.002
SAM 34.343479 -115.763817 0.004 0.007 0.002 0.005 0.002 0.007 0.004
SAM 34.343895 -115.756401 0.004 0.012 0.003 0.008 0.005
Crashed Plane 34.329517 -115.764389 0.003 0.006 0.013 0.005
SAM 34.327057 -115.772789 0.005 0.005 0.005
Crashed Plane 34.326965 -115.785065 0.004 0.008 0.004 0.004 0.005 0.007 0.010 0.008
Crashed Plane 34.329311 -115.805344 0.007 0.006 0.002 0.013 0.004 0.008
SAM 34.354527 -115.787178 0.006
True Positive Plane 5 3 4 4 4 4 3 2 3 5 3 3 3 3
False Positive Plane 0 0 0 0 0 0 0 1 0 0 0 0 0 0
True Positive SAM 3 5 4 2 5 4 4 3 4 4 3 3 4 4
False Positive SAM 0 0 0 0 0 0 0 0 0 0 0 0 0 0
False Negative 0 0 0 0 2 0 0 2 0 0 0 1 0 0
Missed Detection 2 2 2 4 1 2 3 4 3 1 4 4 3 3
Table 7. Target Detection Matrix
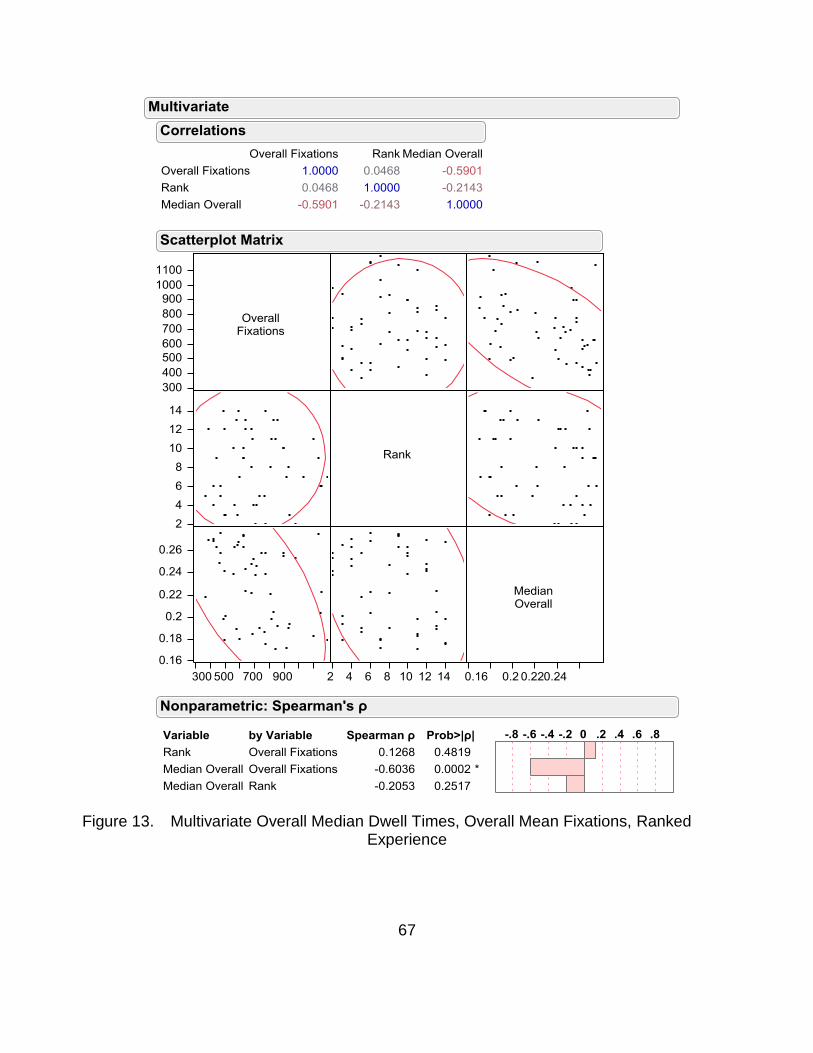
67
Multivariate Overall Median Dwell Times, Overall Mean Fixations, Ranked Figure 13. Experience

68
Saccades per Minute vs. Total FixationsFigure 14.
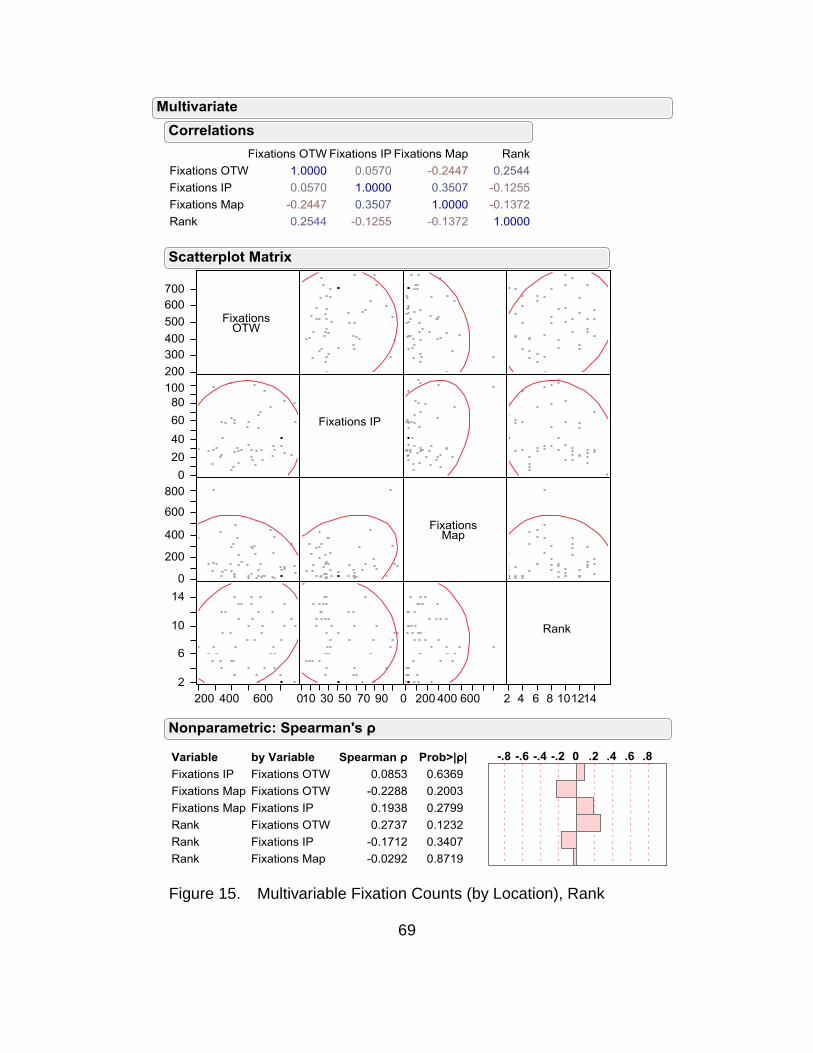
69
Multivariable Fixation Counts (by Location), Rank Figure 15.
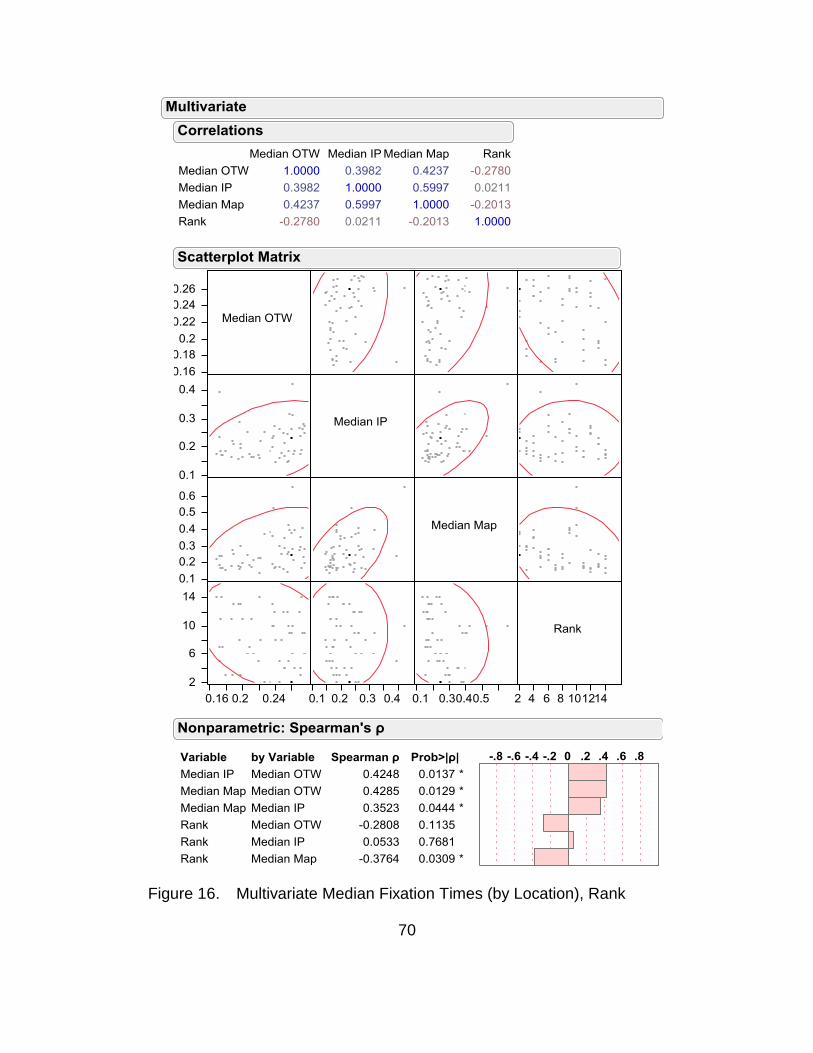
70
Multivariate Median Fixation Times (by Location), Rank Figure 16.
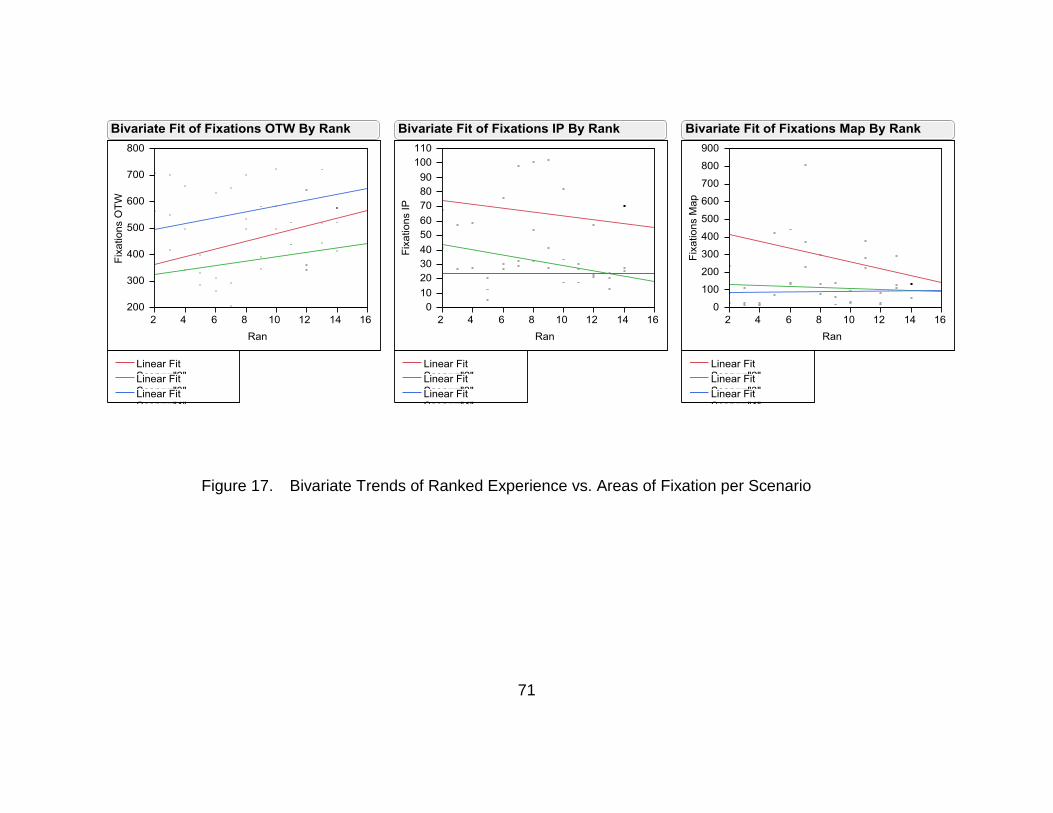
71
Bivariate Trends of Ranked Experience vs. Areas of Fixation per Scenario Figure 17.
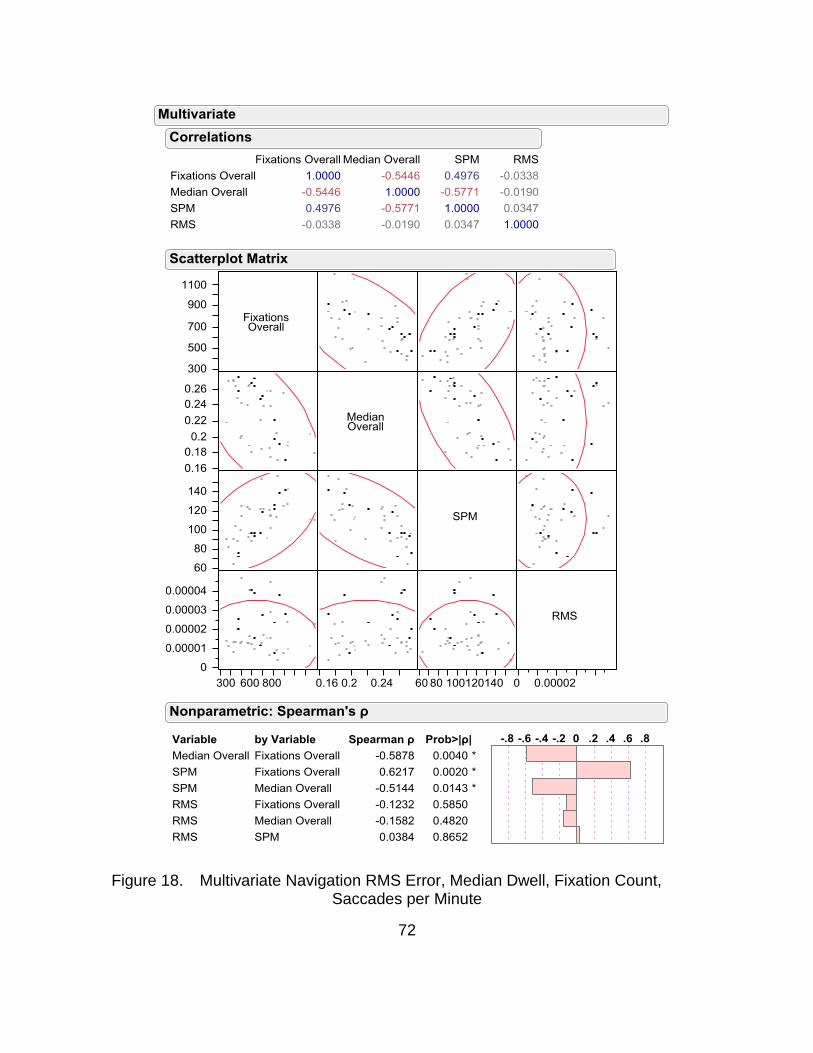
72
Multivariate Navigation RMS Error, Median Dwell, Fixation Count, Figure 18. Saccades per Minute
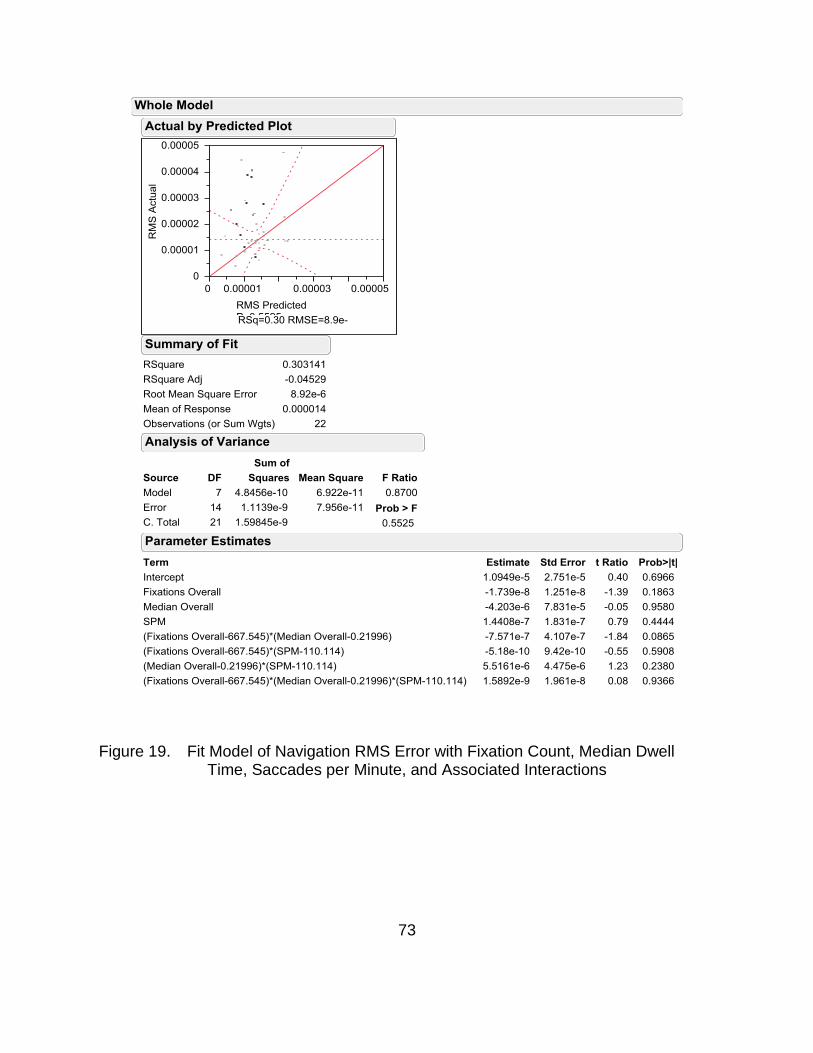
73
Fit Model of Navigation RMS Error with Fixation Count, Median Dwell Figure 19. Time, Saccades per Minute, and Associated Interactions
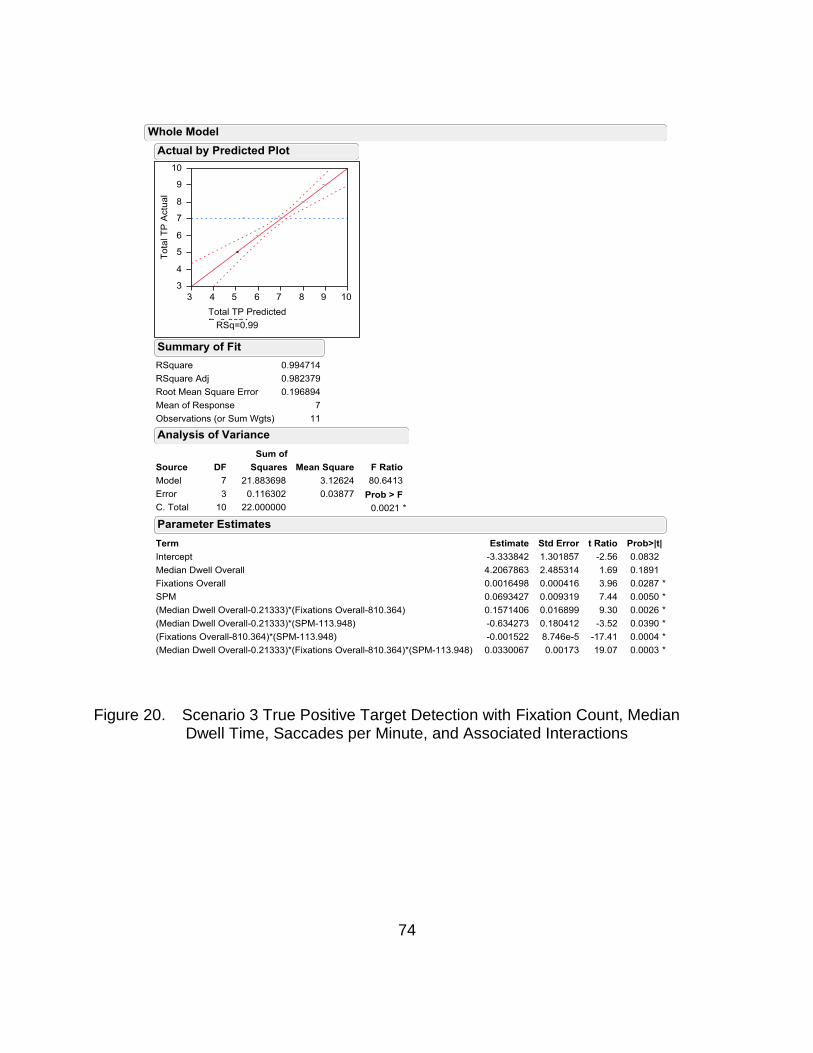
74
Scenario 3 True Positive Target Detection with Fixation Count, Median Figure 20. Dwell Time, Saccades per Minute, and Associated Interactions
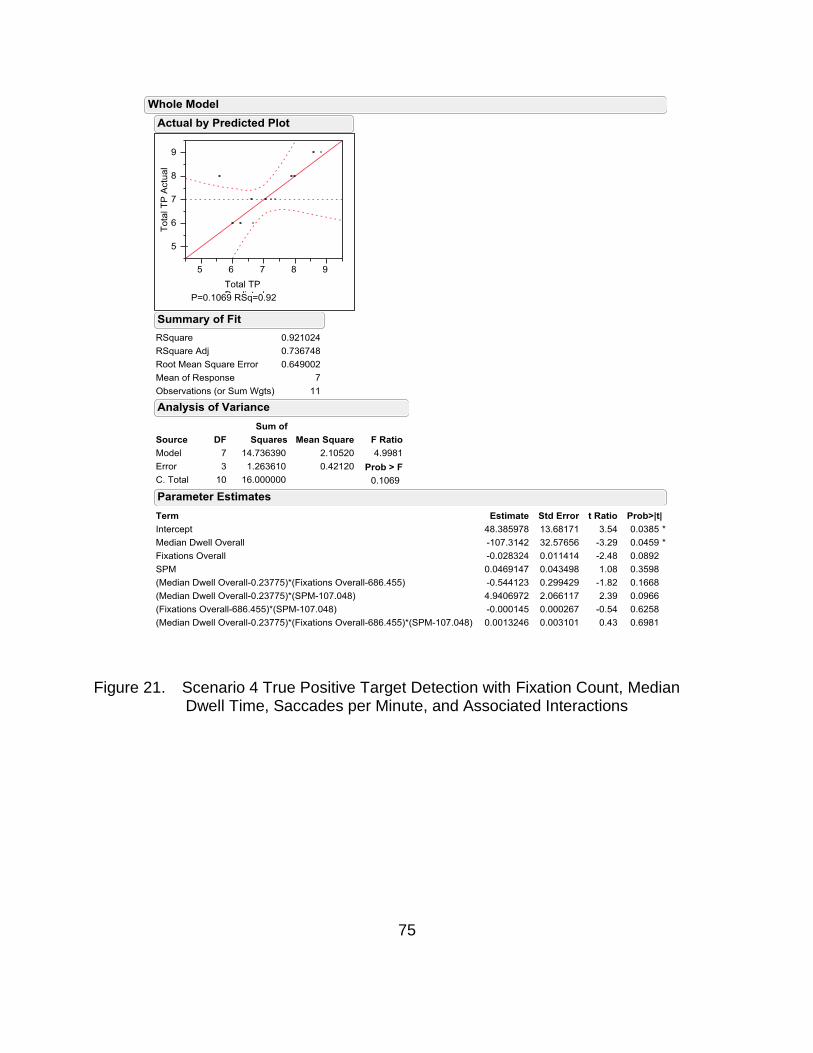
75
Scenario 4 True Positive Target Detection with Fixation Count, Median Figure 21. Dwell Time, Saccades per Minute, and Associated Interactions
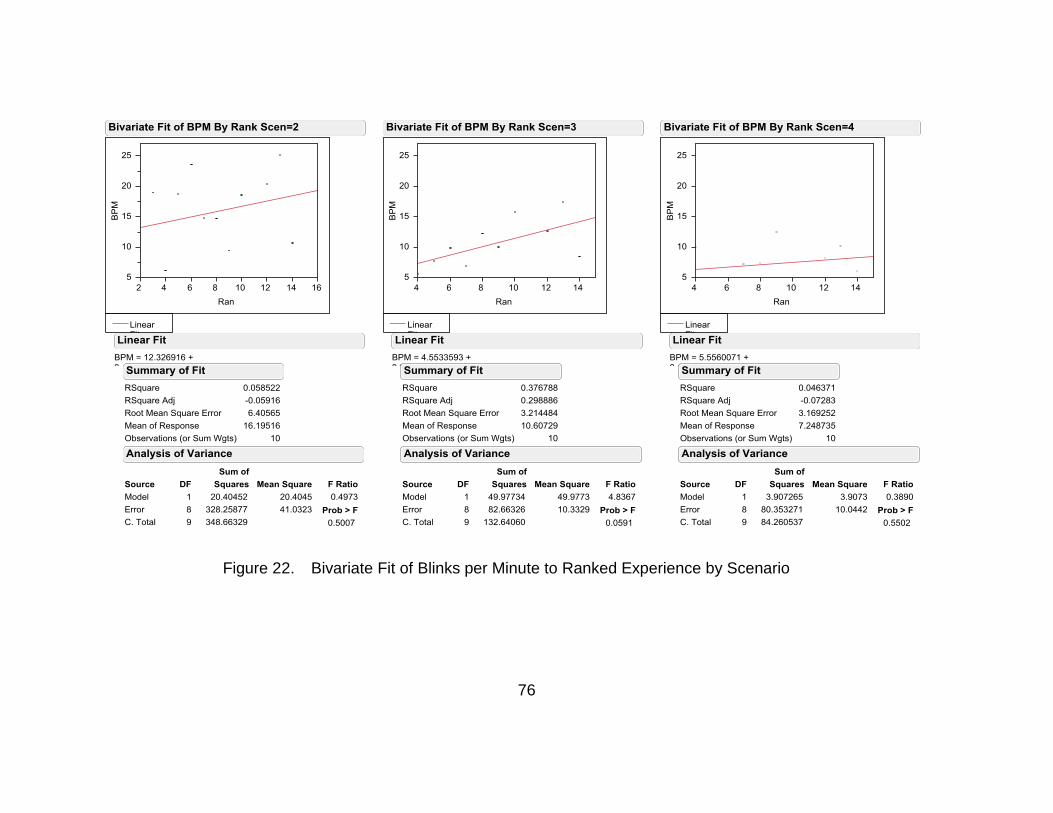
76
Bivariate Fit of Blinks per Minute to Ranked Experience by ScenarioFigure 22.
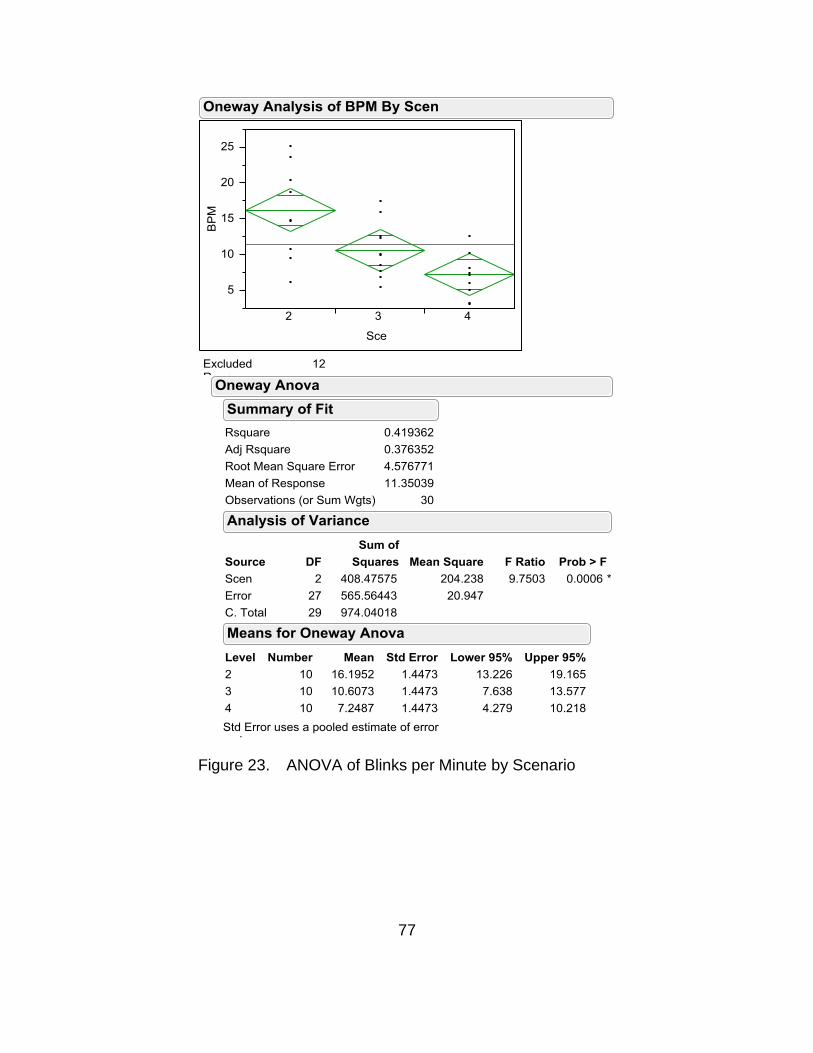
77
ANOVA of Blinks per Minute by Scenario Figure 23.

78
THIS PAGE INTENTIONALLY LEFT BLANK
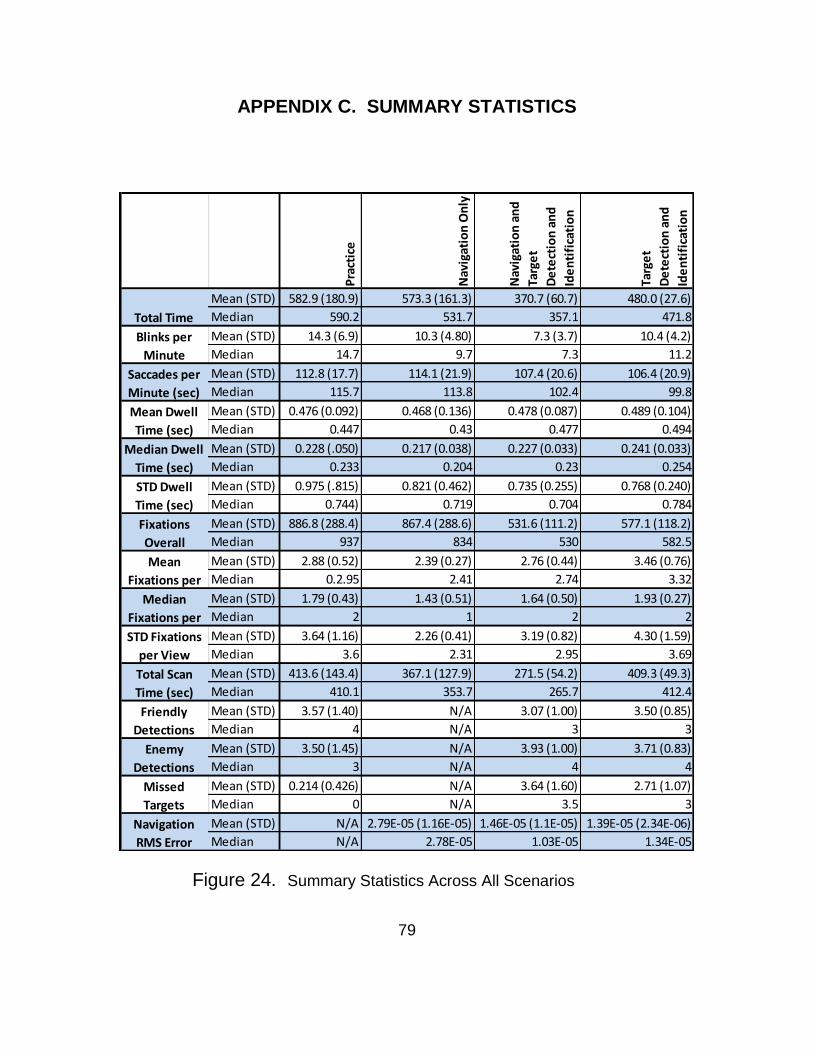
79
APPENDIX C. SUMMARY STATISTICS
Summary Statistics Across All Scenarios Figure 24.
Pra
ctic
e
Nav
igat
ion
On
ly
Nav
igat
ion
an
d
Targ
et
De
tect
ion
an
d
Ide
nti
fica
tio
n
Targ
et
De
tect
ion
an
d
Ide
nti
fica
tio
n
Mean (STD) 582.9 (180.9) 573.3 (161.3) 370.7 (60.7) 480.0 (27.6)
Median 590.2 531.7 357.1 471.8
Mean (STD) 14.3 (6.9) 10.3 (4.80) 7.3 (3.7) 10.4 (4.2)
Median 14.7 9.7 7.3 11.2
Mean (STD) 112.8 (17.7) 114.1 (21.9) 107.4 (20.6) 106.4 (20.9)
Median 115.7 113.8 102.4 99.8
Mean (STD) 0.476 (0.092) 0.468 (0.136) 0.478 (0.087) 0.489 (0.104)
Median 0.447 0.43 0.477 0.494
Mean (STD) 0.228 (.050) 0.217 (0.038) 0.227 (0.033) 0.241 (0.033)
Median 0.233 0.204 0.23 0.254
Mean (STD) 0.975 (.815) 0.821 (0.462) 0.735 (0.255) 0.768 (0.240)
Median 0.744) 0.719 0.704 0.784
Mean (STD) 886.8 (288.4) 867.4 (288.6) 531.6 (111.2) 577.1 (118.2)
Median 937 834 530 582.5
Mean (STD) 2.88 (0.52) 2.39 (0.27) 2.76 (0.44) 3.46 (0.76)
Median 0.2.95 2.41 2.74 3.32
Mean (STD) 1.79 (0.43) 1.43 (0.51) 1.64 (0.50) 1.93 (0.27)
Median 2 1 2 2
Mean (STD) 3.64 (1.16) 2.26 (0.41) 3.19 (0.82) 4.30 (1.59)
Median 3.6 2.31 2.95 3.69
Mean (STD) 413.6 (143.4) 367.1 (127.9) 271.5 (54.2) 409.3 (49.3)
Median 410.1 353.7 265.7 412.4
Mean (STD) 3.57 (1.40) N/A 3.07 (1.00) 3.50 (0.85)
Median 4 N/A 3 3
Mean (STD) 3.50 (1.45) N/A 3.93 (1.00) 3.71 (0.83)
Median 3 N/A 4 4
Mean (STD) 0.214 (0.426) N/A 3.64 (1.60) 2.71 (1.07)
Median 0 N/A 3.5 3
Mean (STD) N/A 2.79E-05 (1.16E-05) 1.46E-05 (1.1E-05) 1.39E-05 (2.34E-06)
Median N/A 2.78E-05 1.03E-05 1.34E-05
Enemy
Detections
Missed
Targets
Navigation
RMS Error
Fixations
Overall
Mean
Fixations per
Median
Fixations per
STD Fixations
per View
Total Scan
Time (sec)
Friendly
Detections
Total Time
Blinks per
Minute
Saccades per
Minute (sec)
Mean Dwell
Time (sec)
Median Dwell
Time (sec)
STD Dwell
Time (sec)

80
THIS PAGE INTENTIONALLY LEFT BLANK
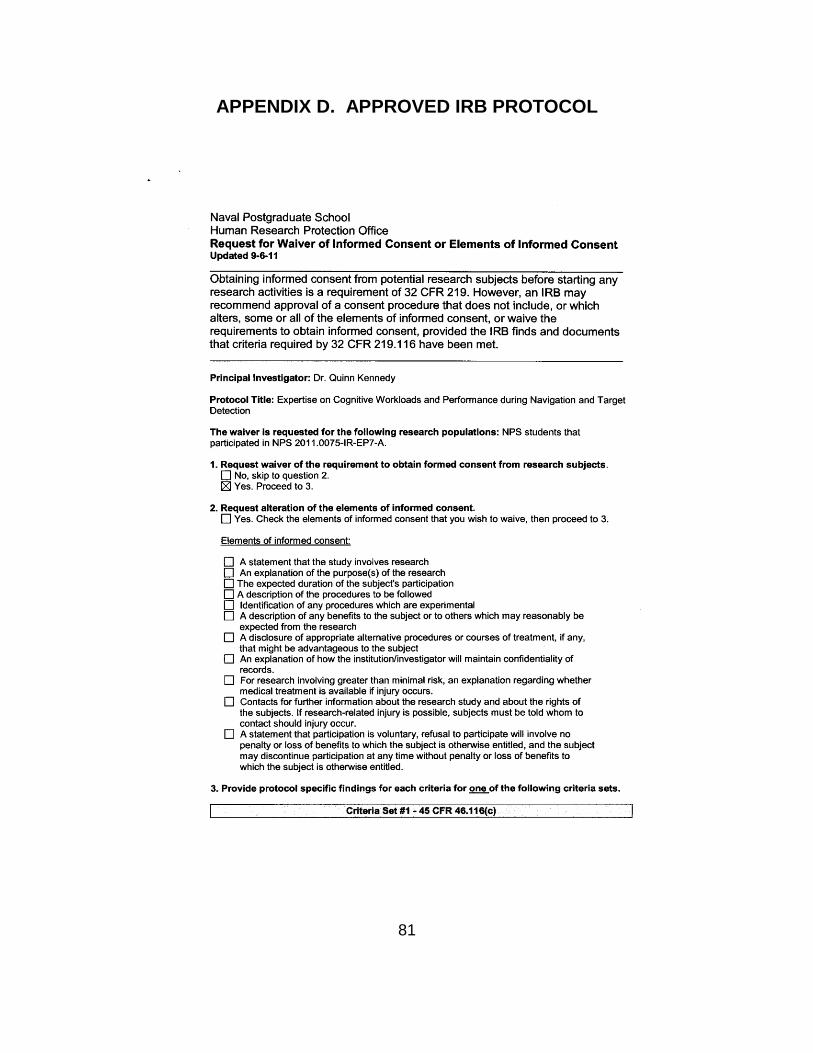
81
APPENDIX D. APPROVED IRB PROTOCOL
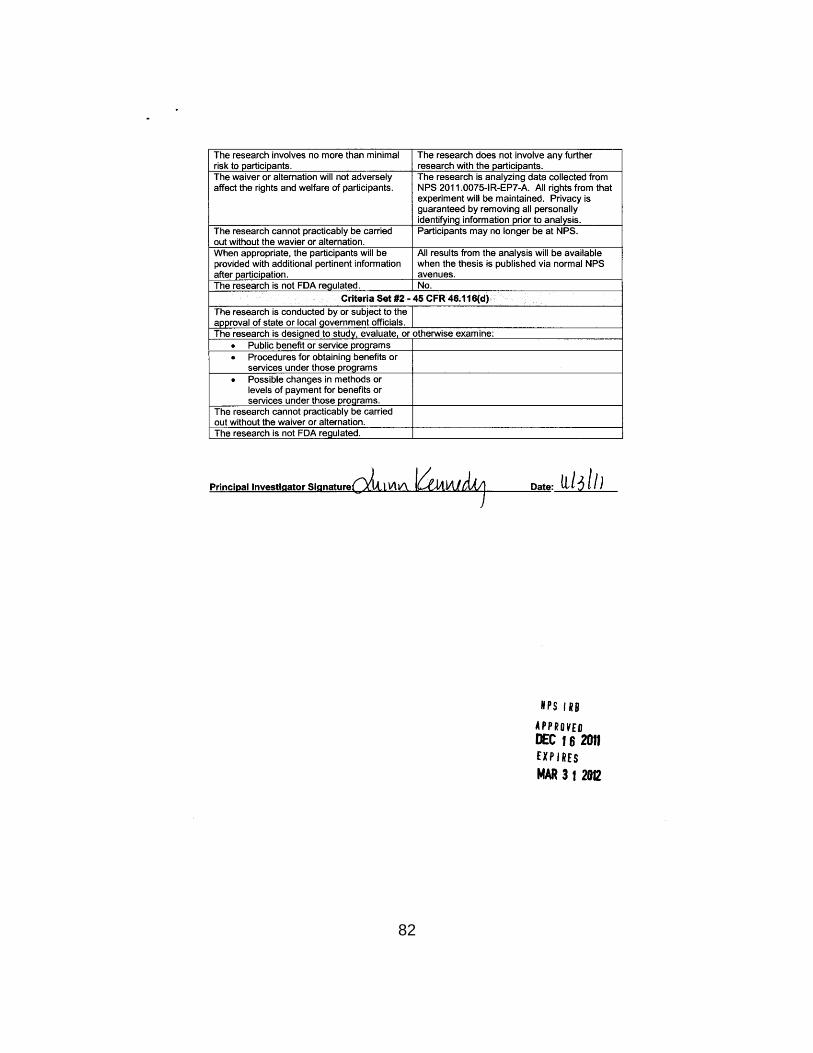
82

83

84
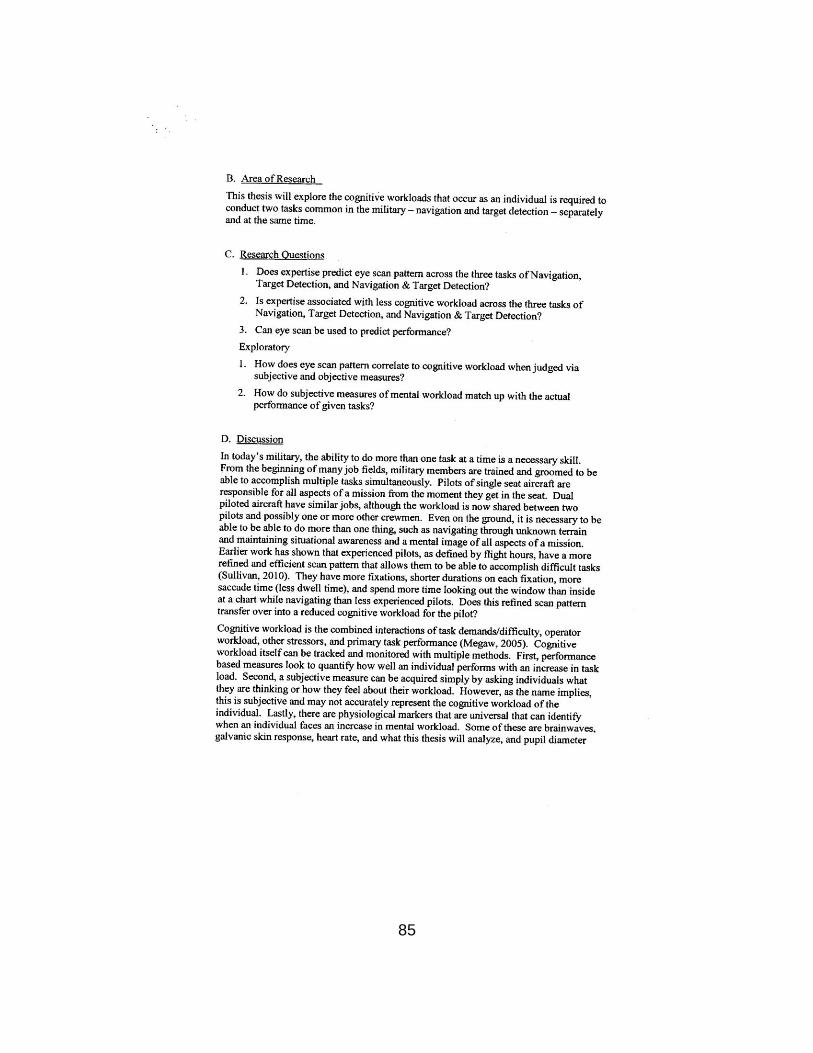
85
86
87

88
89

90
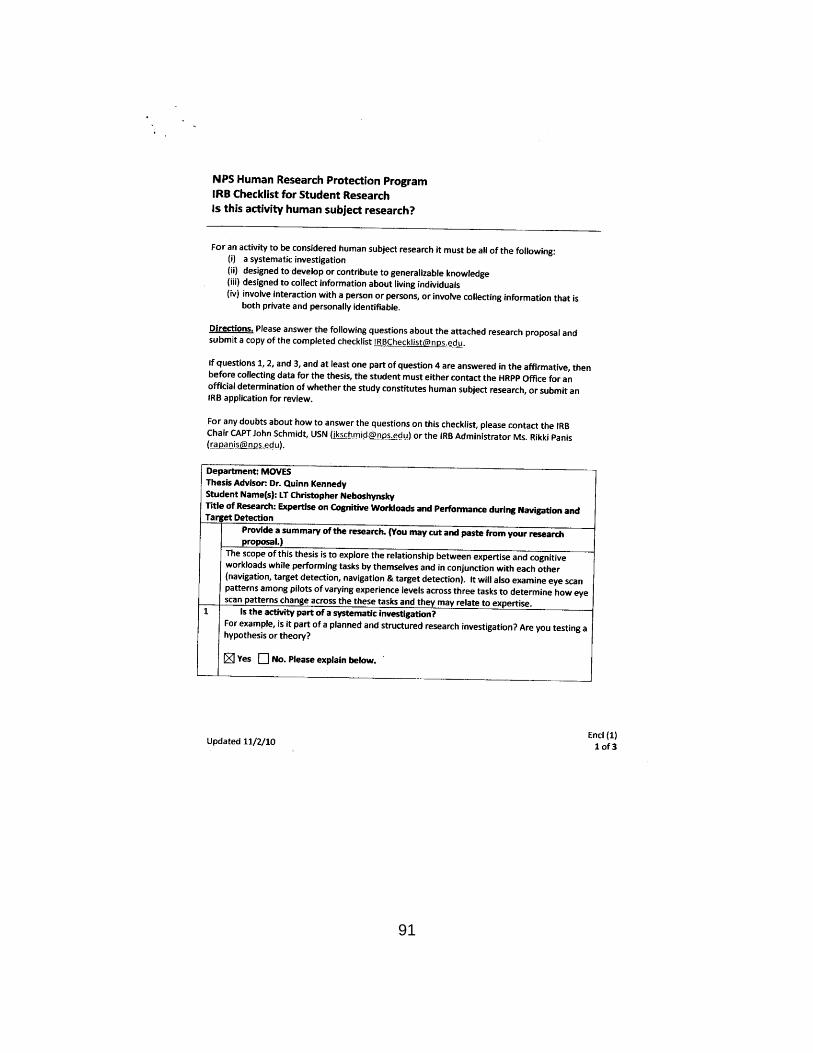
91
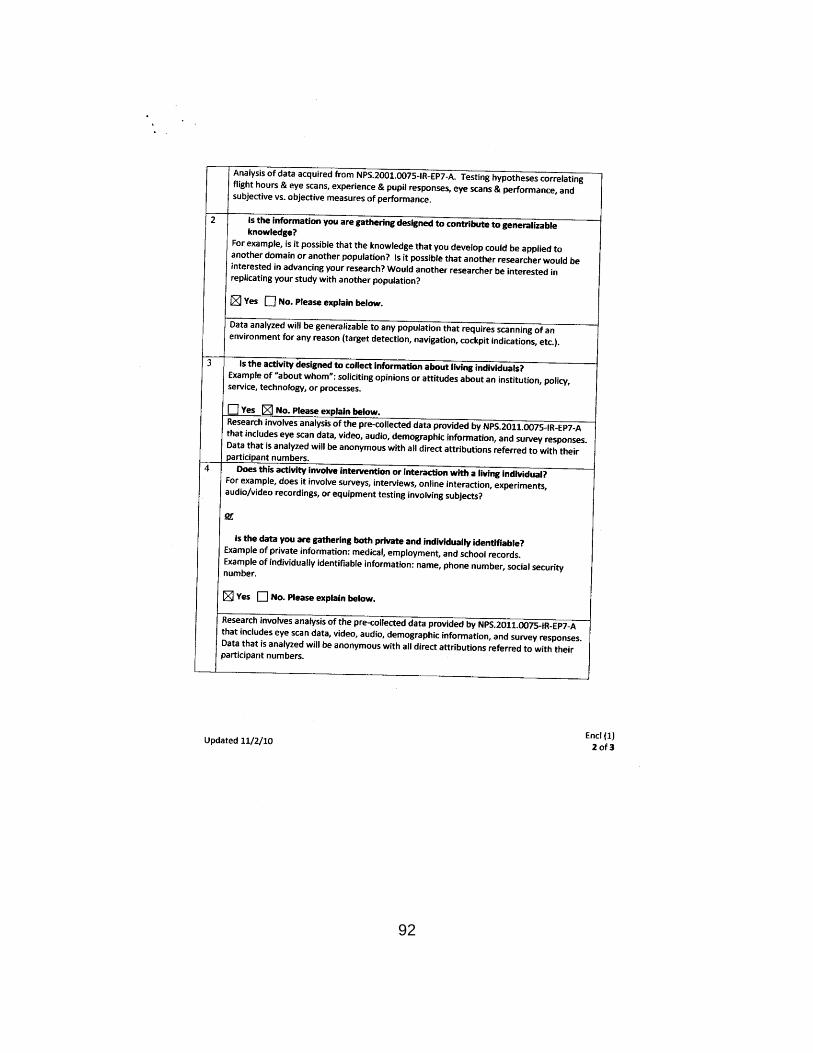
92

93
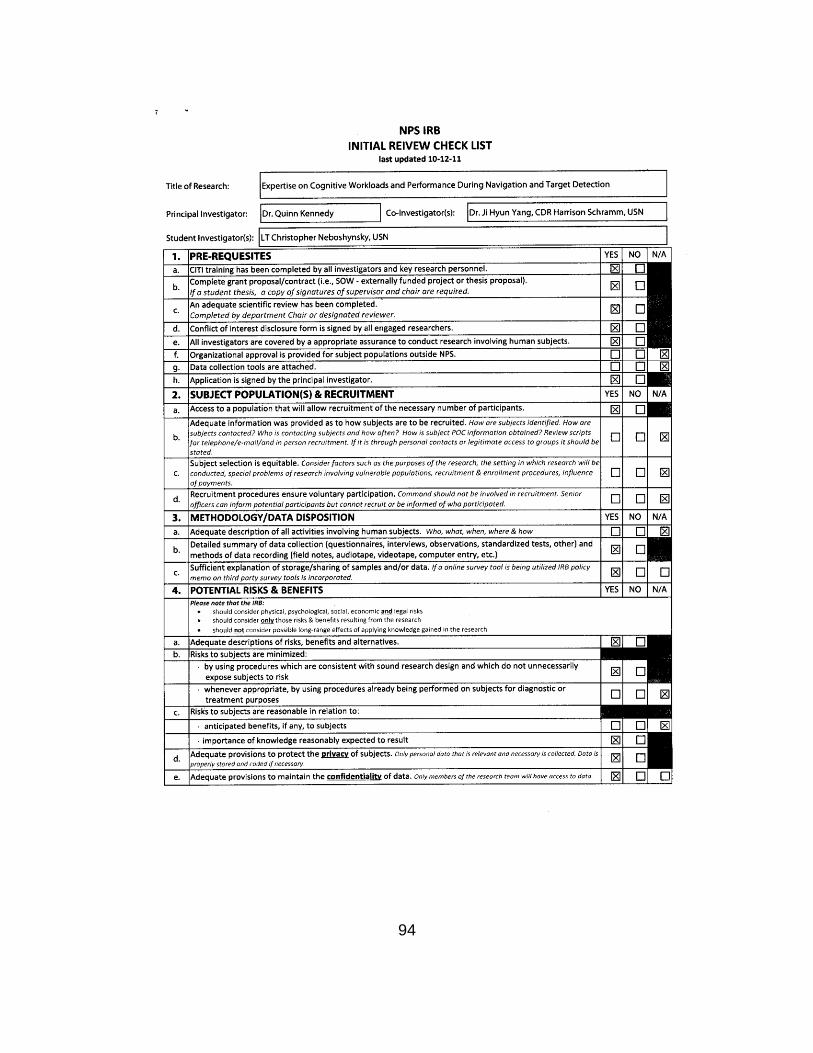
94
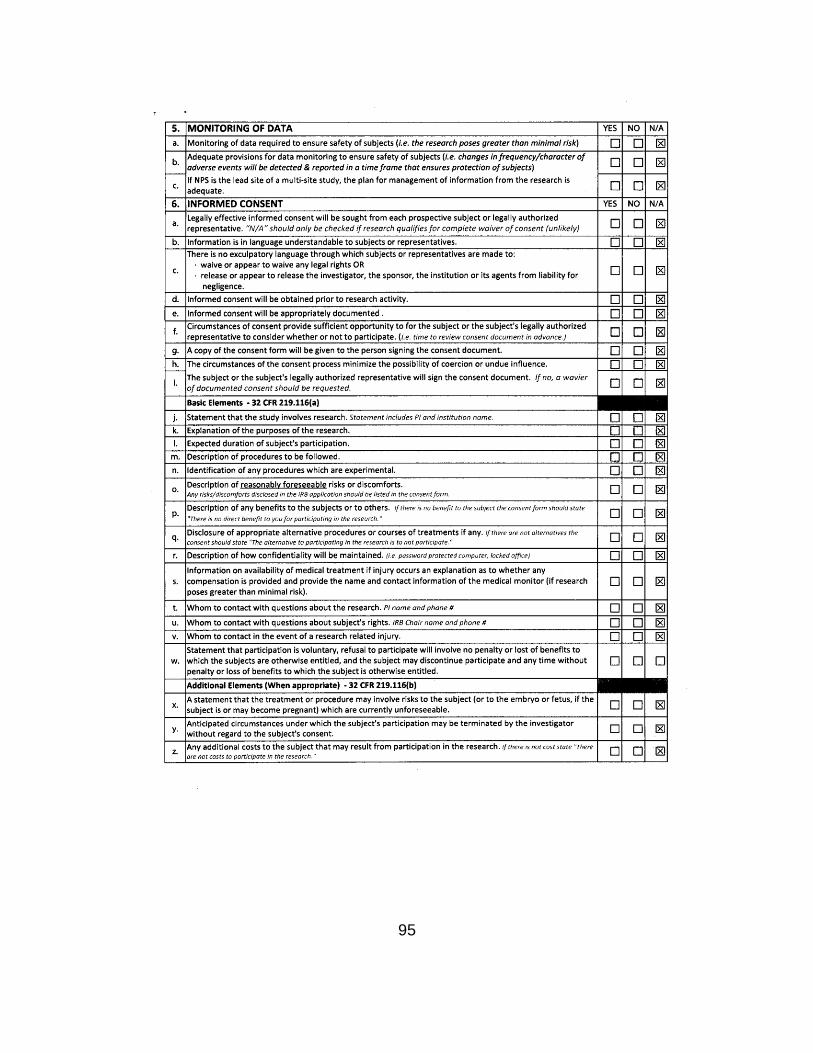
95
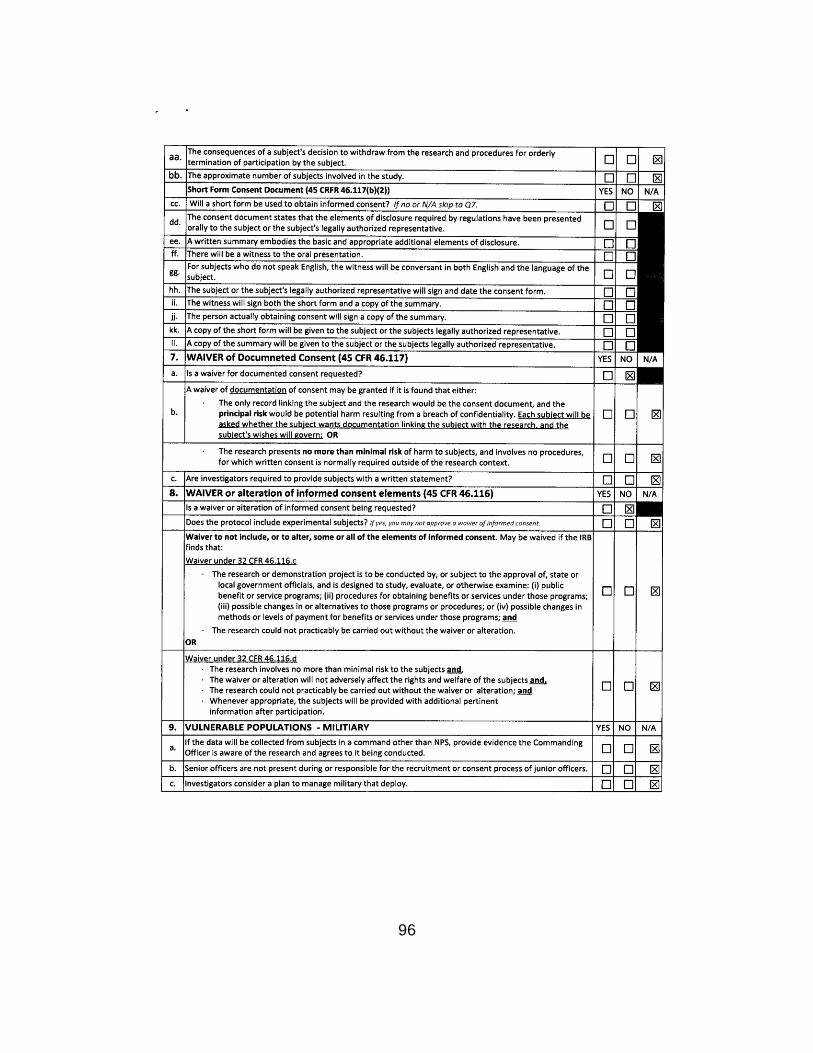
96
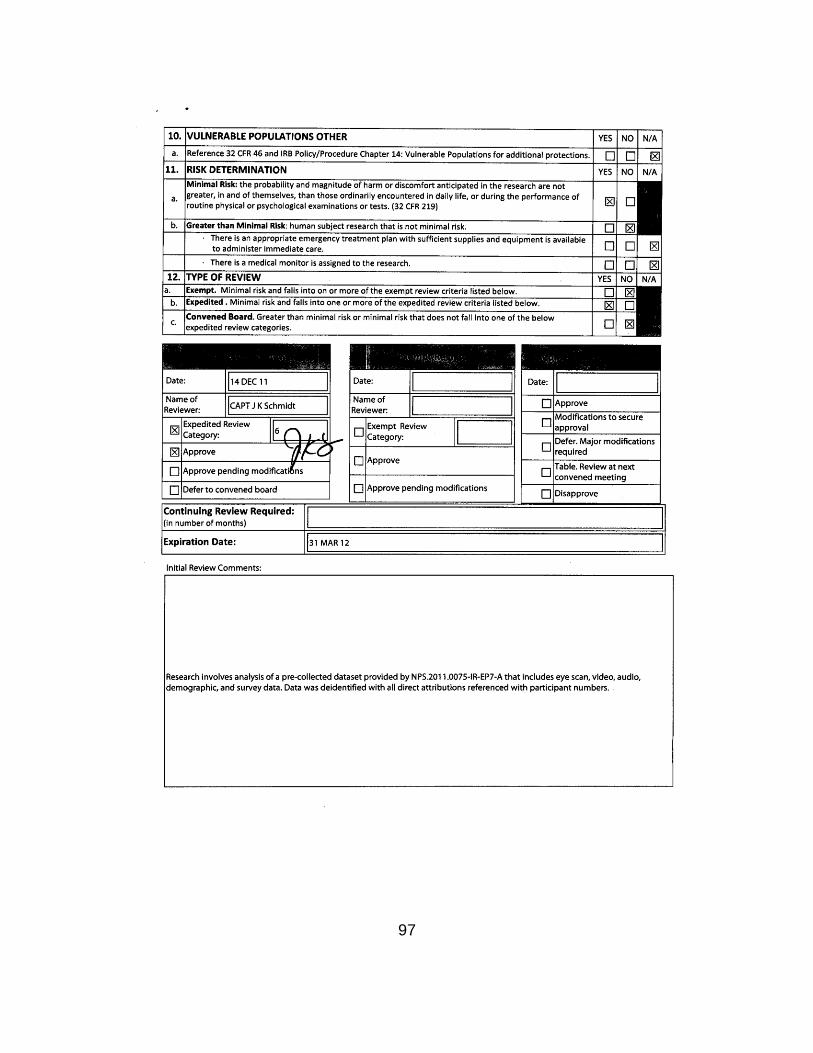
97

98
THIS PAGE INTENTIONALLY LEFT BLANK
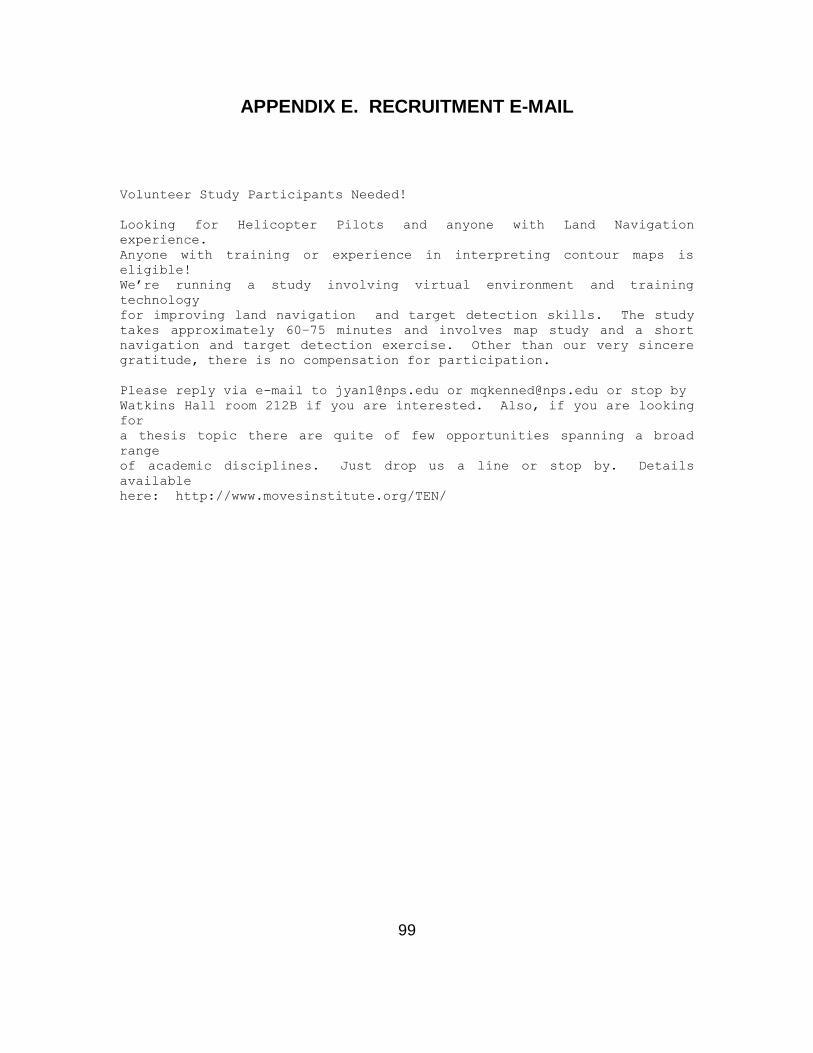
99
APPENDIX E. RECRUITMENT E-MAIL
Volunteer Study Participants Needed!
Looking for Helicopter Pilots and anyone with Land Navigation
experience.
Anyone with training or experience in interpreting contour maps is
eligible!
We’re running a study involving virtual environment and training
technology
for improving land navigation and target detection skills. The study
takes approximately 60–75 minutes and involves map study and a short
navigation and target detection exercise. Other than our very sincere
gratitude, there is no compensation for participation.
Please reply via e-mail to [email protected] or [email protected] or stop by
Watkins Hall room 212B if you are interested. Also, if you are looking
for
a thesis topic there are quite of few opportunities spanning a broad
range
of academic disciplines. Just drop us a line or stop by. Details
available
here: http://www.movesinstitute.org/TEN/

100
THIS PAGE INTENTIONALLY LEFT BLANK

101
APPENDIX F. SUBJECT CHECKLIST
Subject ID:
E-mail confirming date and time
Notify lab participants of data collection time
Validate equipment hardware and software
o Screen brightness and contrast settings
o Lab lighting conditions
“Experiment in Progress” signs
Bottled water in fridge.
Introductory Script
Informed Consent
Visual Acuity equipment
Background questionnaire
Map set up
Route brief
Trial period instructions
Calibration script
Video recording equipment (storage media, files naming and backup scheme)
Navigation and target detection exercise
Save and backup data; folder name: subject ID and date
Post exercise questionnaires
Wrap up and thank you, contact information

102
THIS PAGE INTENTIONALLY LEFT BLANK
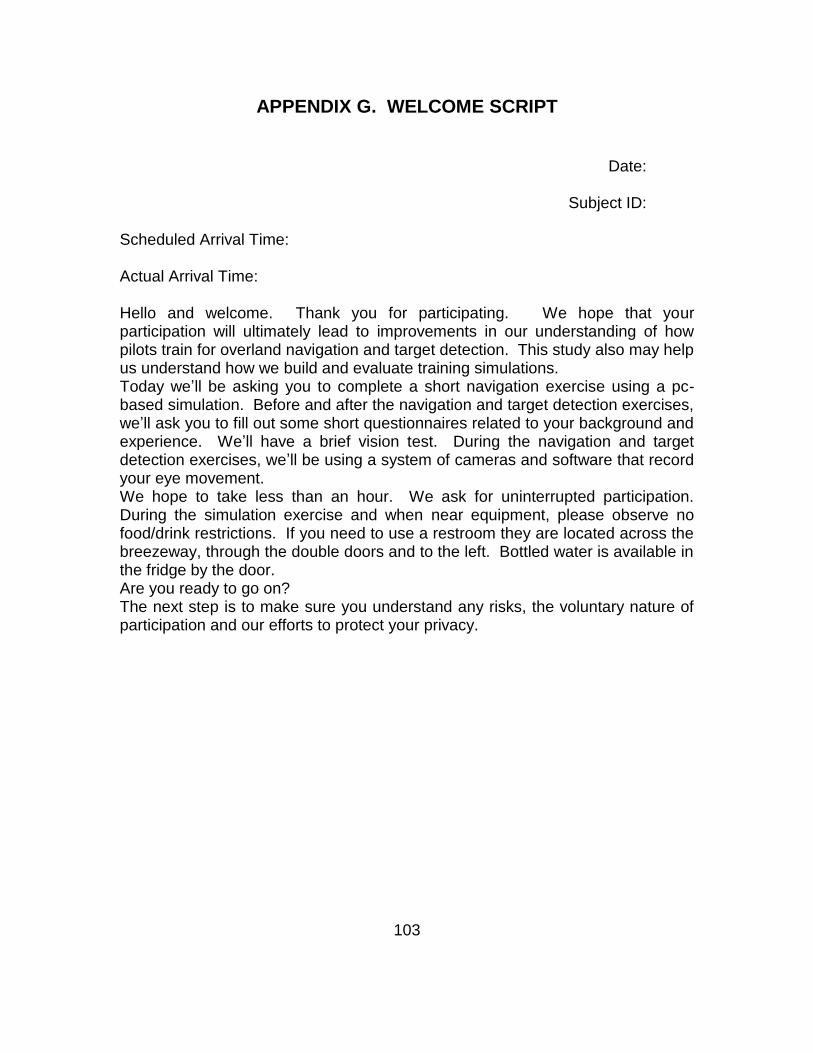
103
APPENDIX G. WELCOME SCRIPT
Date:
Subject ID:
Scheduled Arrival Time: Actual Arrival Time: Hello and welcome. Thank you for participating. We hope that your participation will ultimately lead to improvements in our understanding of how pilots train for overland navigation and target detection. This study also may help us understand how we build and evaluate training simulations. Today we’ll be asking you to complete a short navigation exercise using a pc-based simulation. Before and after the navigation and target detection exercises, we’ll ask you to fill out some short questionnaires related to your background and experience. We’ll have a brief vision test. During the navigation and target detection exercises, we’ll be using a system of cameras and software that record your eye movement. We hope to take less than an hour. We ask for uninterrupted participation. During the simulation exercise and when near equipment, please observe no food/drink restrictions. If you need to use a restroom they are located across the breezeway, through the double doors and to the left. Bottled water is available in the fridge by the door. Are you ready to go on? The next step is to make sure you understand any risks, the voluntary nature of participation and our efforts to protect your privacy.

104
THIS PAGE INTENTIONALLY LEFT BLANK
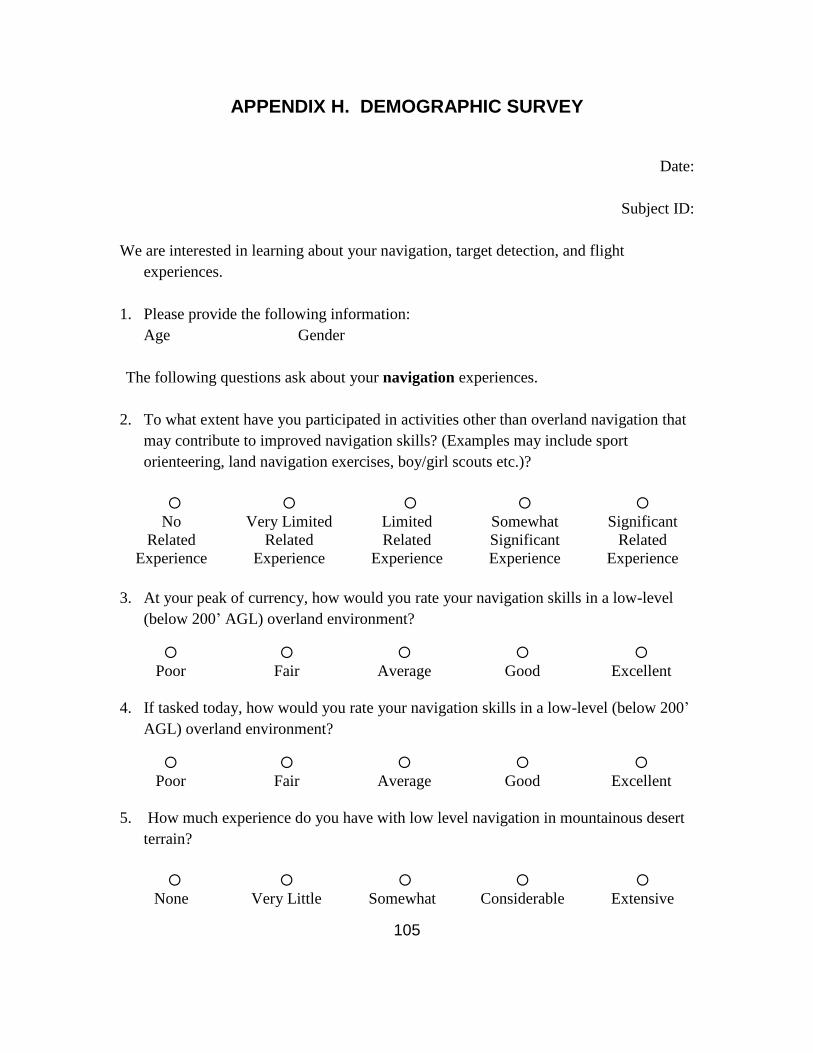
105
APPENDIX H. DEMOGRAPHIC SURVEY
Date:
Subject ID:
We are interested in learning about your navigation, target detection, and flight
experiences.
1. Please provide the following information:
Age Gender
The following questions ask about your navigation experiences.
2. To what extent have you participated in activities other than overland navigation that
may contribute to improved navigation skills? (Examples may include sport
orienteering, land navigation exercises, boy/girl scouts etc.)?
No
Related
Experience
Very Limited
Related
Experience
Limited
Related
Experience
Somewhat
Significant
Experience
Significant
Related
Experience
3. At your peak of currency, how would you rate your navigation skills in a low-level
(below 200’ AGL) overland environment?
Poor Fair Average Good Excellent
4. If tasked today, how would you rate your navigation skills in a low-level (below 200’
AGL) overland environment?
Poor Fair Average Good Excellent
5. How much experience do you have with low level navigation in mountainous desert
terrain?
None Very Little Somewhat Considerable Extensive
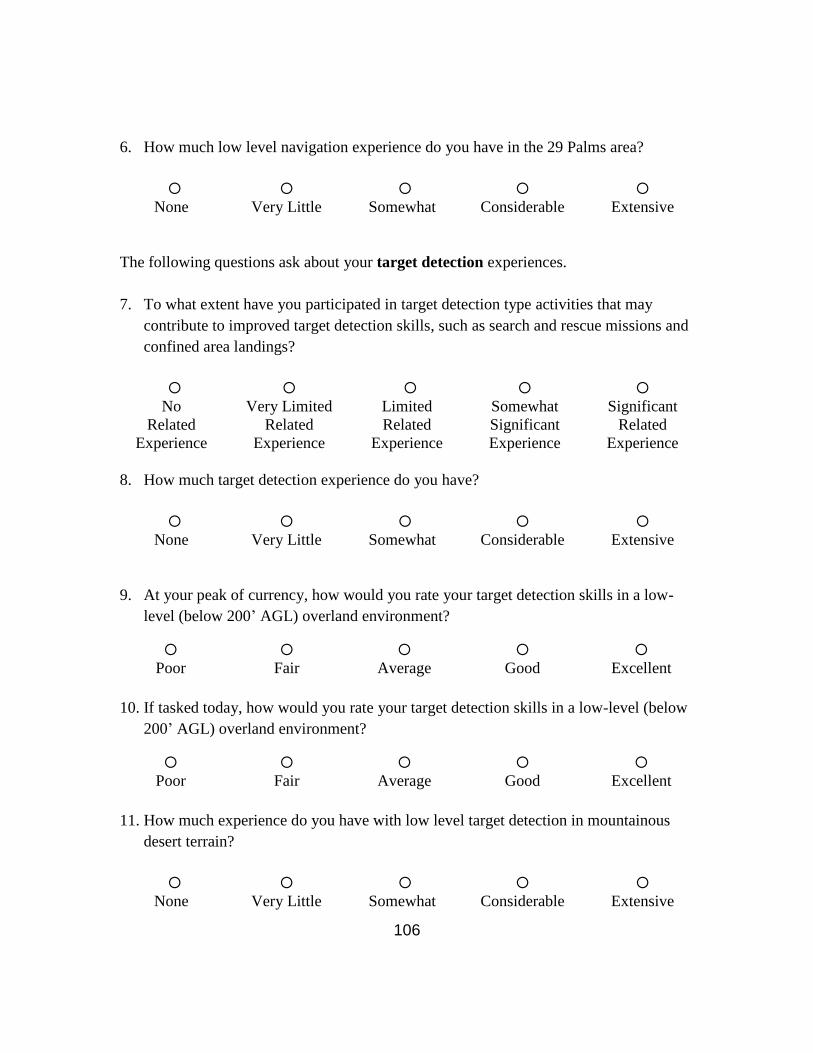
106
6. How much low level navigation experience do you have in the 29 Palms area?
None Very Little Somewhat Considerable Extensive
The following questions ask about your target detection experiences.
7. To what extent have you participated in target detection type activities that may
contribute to improved target detection skills, such as search and rescue missions and
confined area landings?
No
Related
Experience
Very Limited
Related
Experience
Limited
Related
Experience
Somewhat
Significant
Experience
Significant
Related
Experience
8. How much target detection experience do you have?
None Very Little Somewhat Considerable Extensive
9. At your peak of currency, how would you rate your target detection skills in a low-
level (below 200’ AGL) overland environment?
Poor Fair Average Good Excellent
10. If tasked today, how would you rate your target detection skills in a low-level (below
200’ AGL) overland environment?
Poor Fair Average Good Excellent
11. How much experience do you have with low level target detection in mountainous
desert terrain?
None Very Little Somewhat Considerable Extensive
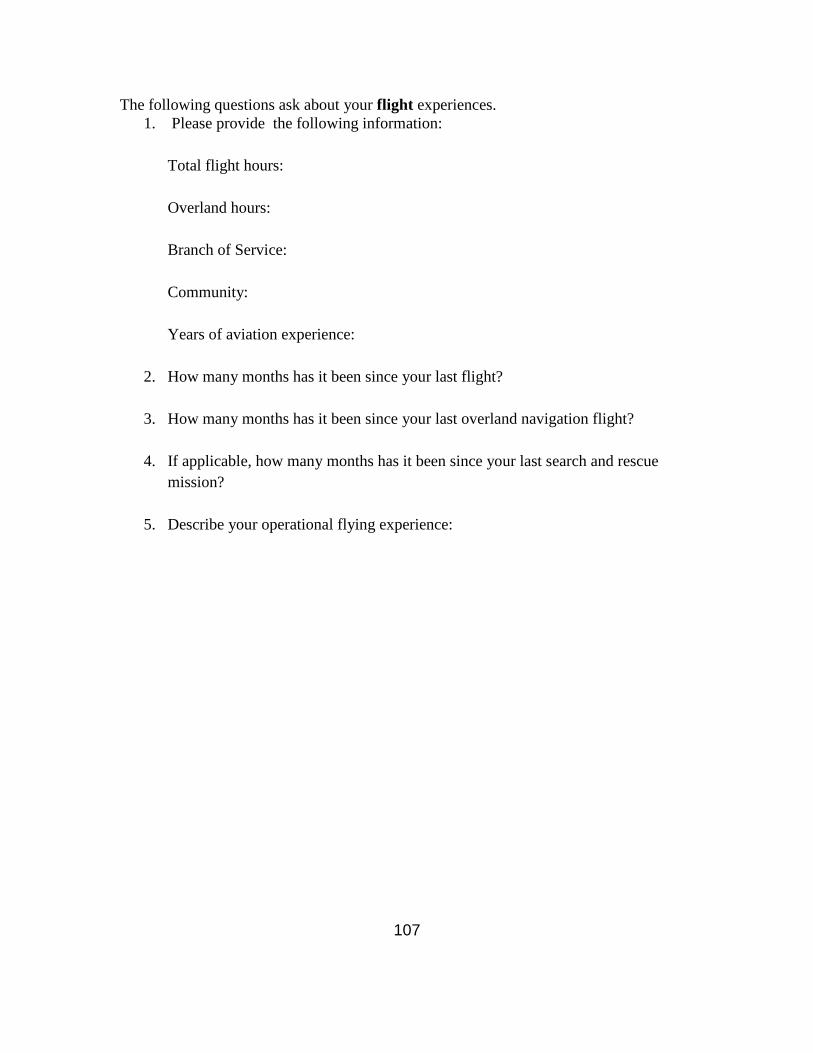
107
The following questions ask about your flight experiences.
1. Please provide the following information:
Total flight hours:
Overland hours:
Branch of Service:
Community:
Years of aviation experience:
2. How many months has it been since your last flight?
3. How many months has it been since your last overland navigation flight?
4. If applicable, how many months has it been since your last search and rescue
mission?
5. Describe your operational flying experience:

108
THIS PAGE INTENTIONALLY LEFT BLANK
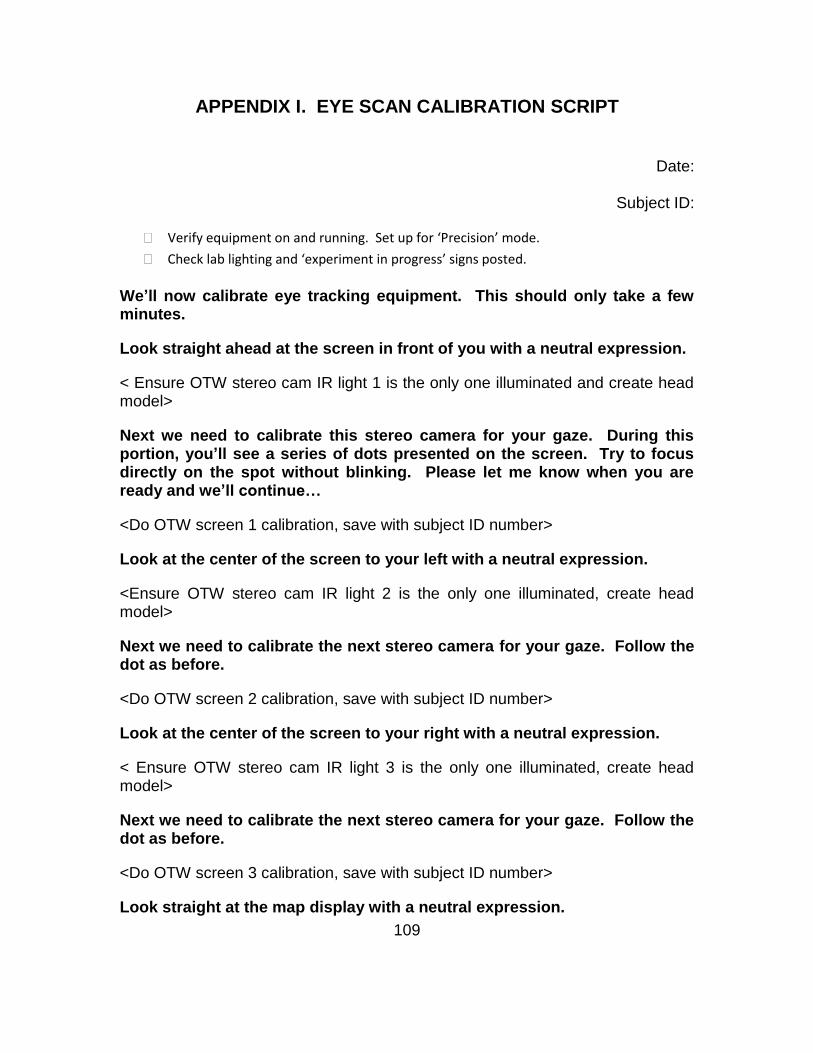
109
APPENDIX I. EYE SCAN CALIBRATION SCRIPT
Date:
Subject ID:
Verify equipment on and running. Set up for ‘Precision’ mode.
Check lab lighting and ‘experiment in progress’ signs posted.
We’ll now calibrate eye tracking equipment. This should only take a few minutes.
Look straight ahead at the screen in front of you with a neutral expression.
< Ensure OTW stereo cam IR light 1 is the only one illuminated and create head model>
Next we need to calibrate this stereo camera for your gaze. During this portion, you’ll see a series of dots presented on the screen. Try to focus directly on the spot without blinking. Please let me know when you are ready and we’ll continue…
<Do OTW screen 1 calibration, save with subject ID number>
Look at the center of the screen to your left with a neutral expression.
<Ensure OTW stereo cam IR light 2 is the only one illuminated, create head model>
Next we need to calibrate the next stereo camera for your gaze. Follow the dot as before.
<Do OTW screen 2 calibration, save with subject ID number>
Look at the center of the screen to your right with a neutral expression.
< Ensure OTW stereo cam IR light 3 is the only one illuminated, create head model>
Next we need to calibrate the next stereo camera for your gaze. Follow the dot as before.
<Do OTW screen 3 calibration, save with subject ID number>
Look straight at the map display with a neutral expression.

110
<Ensure Map stero cam IR light is the only one illuminated and create head model>
Next we’ll calibrate the screen used for the map display. As before, please focus on the dot without blinking. Please let me know when you are ready to continue…
<Map Display calibration>
Next we’ll link all 4 stereo cameras. We’re going to ask to to look in a series of locations both on each OTW screen and on the map display so that the FaceLink system can learn where your gaze travels as you move your head.
<Ensure ALL stereo cam IR lights are illuminated, start FaceLink, link stereo cameras>
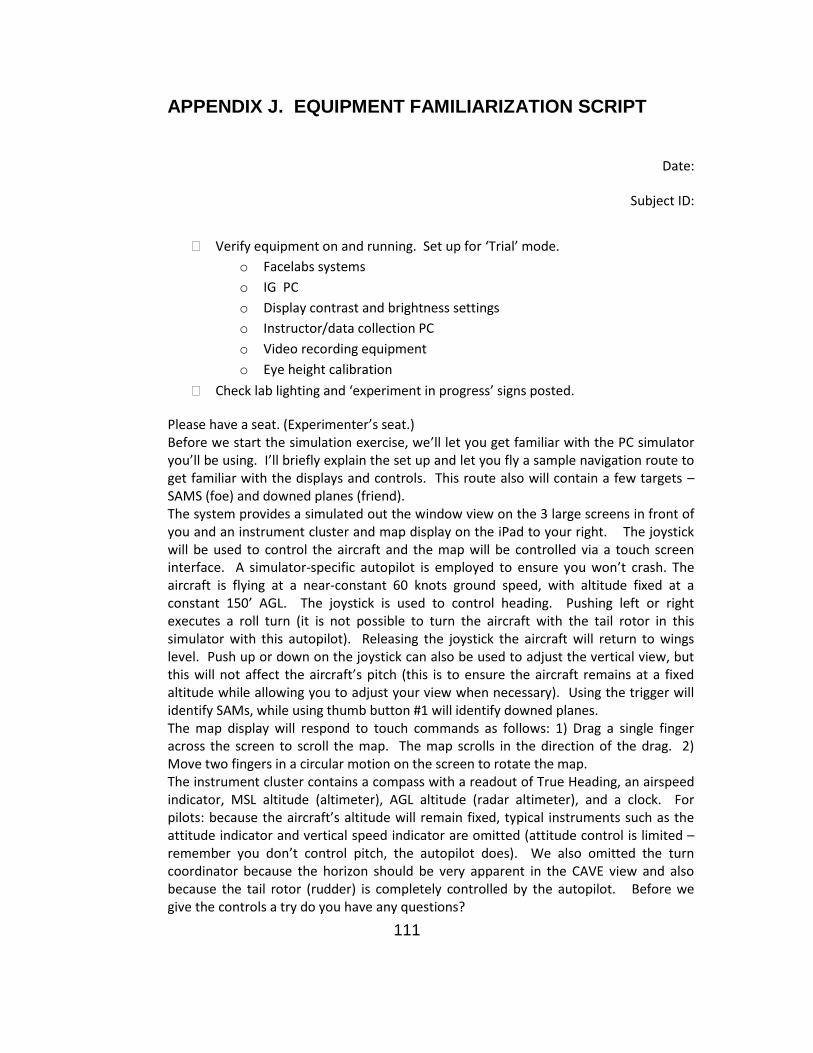
111
APPENDIX J. EQUIPMENT FAMILIARIZATION SCRIPT
Date:
Subject ID:
Verify equipment on and running. Set up for ‘Trial’ mode.
o Facelabs systems
o IG PC
o Display contrast and brightness settings
o Instructor/data collection PC
o Video recording equipment
o Eye height calibration
Check lab lighting and ‘experiment in progress’ signs posted.
Please have a seat. (Experimenter’s seat.) Before we start the simulation exercise, we’ll let you get familiar with the PC simulator you’ll be using. I’ll briefly explain the set up and let you fly a sample navigation route to get familiar with the displays and controls. This route also will contain a few targets – SAMS (foe) and downed planes (friend). The system provides a simulated out the window view on the 3 large screens in front of you and an instrument cluster and map display on the iPad to your right. The joystick will be used to control the aircraft and the map will be controlled via a touch screen interface. A simulator-specific autopilot is employed to ensure you won’t crash. The aircraft is flying at a near-constant 60 knots ground speed, with altitude fixed at a constant 150’ AGL. The joystick is used to control heading. Pushing left or right executes a roll turn (it is not possible to turn the aircraft with the tail rotor in this simulator with this autopilot). Releasing the joystick the aircraft will return to wings level. Push up or down on the joystick can also be used to adjust the vertical view, but this will not affect the aircraft’s pitch (this is to ensure the aircraft remains at a fixed altitude while allowing you to adjust your view when necessary). Using the trigger will identify SAMs, while using thumb button #1 will identify downed planes. The map display will respond to touch commands as follows: 1) Drag a single finger across the screen to scroll the map. The map scrolls in the direction of the drag. 2) Move two fingers in a circular motion on the screen to rotate the map. The instrument cluster contains a compass with a readout of True Heading, an airspeed indicator, MSL altitude (altimeter), AGL altitude (radar altimeter), and a clock. For pilots: because the aircraft’s altitude will remain fixed, typical instruments such as the attitude indicator and vertical speed indicator are omitted (attitude control is limited – remember you don’t control pitch, the autopilot does). We also omitted the turn coordinator because the horizon should be very apparent in the CAVE view and also because the tail rotor (rudder) is completely controlled by the autopilot. Before we give the controls a try do you have any questions?

112
<…> Please have a seat in the operator’s station and sit in a position you’ll be comfortable in for about an hour. We’ll adjust cameras as necessary. <…> The map is operated via touch and should be fairly intuitive. I’ll give you few minutes to try that out, then we’ll move on to the flight controls. You’ll notice the route is marked on the map. Please scroll the map to position the route starting point near the center of the screen. When you’re comfortable with the map control we’ll move on. <…> We’ll now bring up the main display and let you get familiar with the flight controls. On the screen you see terrain similar to where you will be flying. You’ll notice the flight path is depicted on the map is also depicted in this view. You’ll now have a few minutes to get familiar with the controls. When you’re comfortable, please fly to the second waypoint. We’ll pause there and then practice flying the entire practice route while exercising map controls. You are almost certainly going to want to maintain the map oriented to your compass (though some pilots may have another preference). <…> You’ll now have a few minutes to fly along the depicted route, update the map and use the clock to verify timing. This route consists of 3 legs, each about a minute and a half long. When the route is complete you can repeat it if you would like more practice. Let me know when you are ready and we’ll start the practice route along the depicted path. Thank you. Do you have any questions before we move on? <…>
During the next stage we’ll calibrate the eye-tracking equipment. Following this we’ll
provide a brief on the route you will be flying, provide some time for map study and then let you
fly the test route.
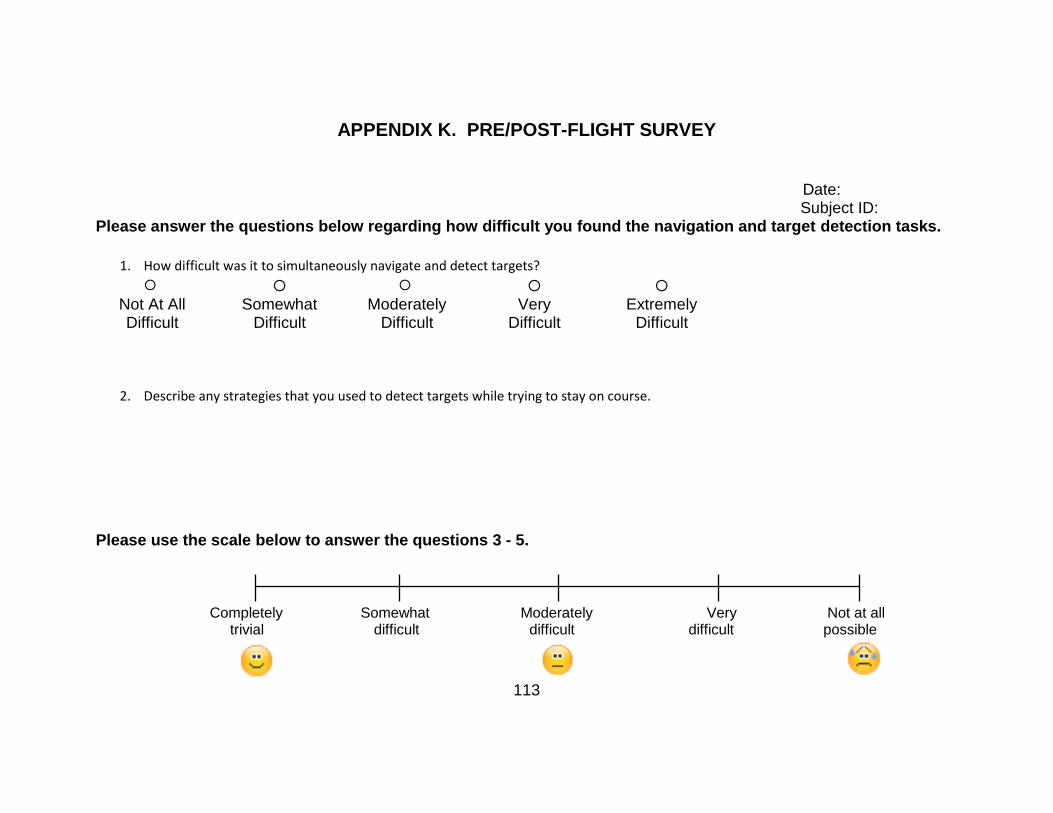
113
APPENDIX K. PRE/POST-FLIGHT SURVEY
Date: Subject ID:
Please answer the questions below regarding how difficult you found the navigation and target detection tasks.
1. How difficult was it to simultaneously navigate and detect targets?
Not At All Difficult
Somewhat Difficult
Moderately Difficult
Very Difficult
Extremely Difficult
2. Describe any strategies that you used to detect targets while trying to stay on course.
Please use the scale below to answer the questions 3 - 5. Completely Somewhat Moderately Very Not at all trivial difficult difficult difficult possible
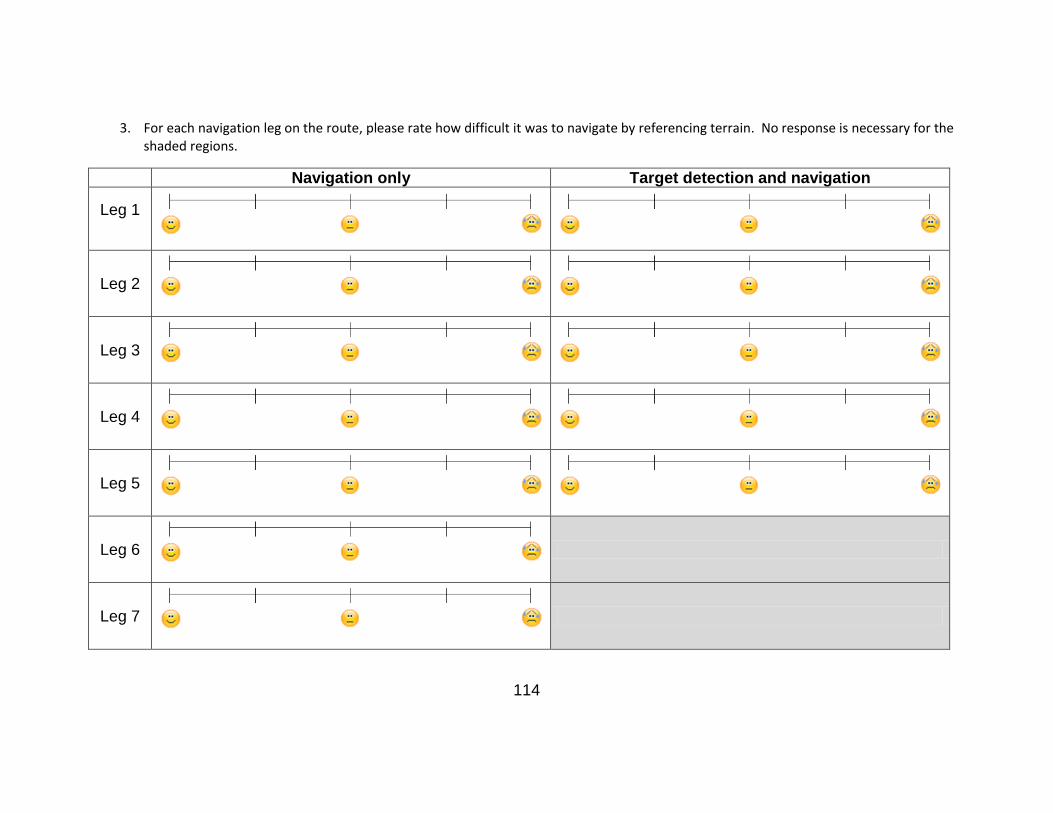
114
3. For each navigation leg on the route, please rate how difficult it was to navigate by referencing terrain. No response is necessary for the shaded regions.
Navigation only Target detection and navigation
Leg 1
Leg 2
Leg 3
Leg 4
Leg 5
Leg 6
Leg 7

115
Leg 8
Leg 9
Leg 10
Leg 11
Leg 12
4. For each navigation leg on the route, please rate how difficult it was to detect the targets.
Target detection and navigation Target detection only
Leg 1
Leg 2
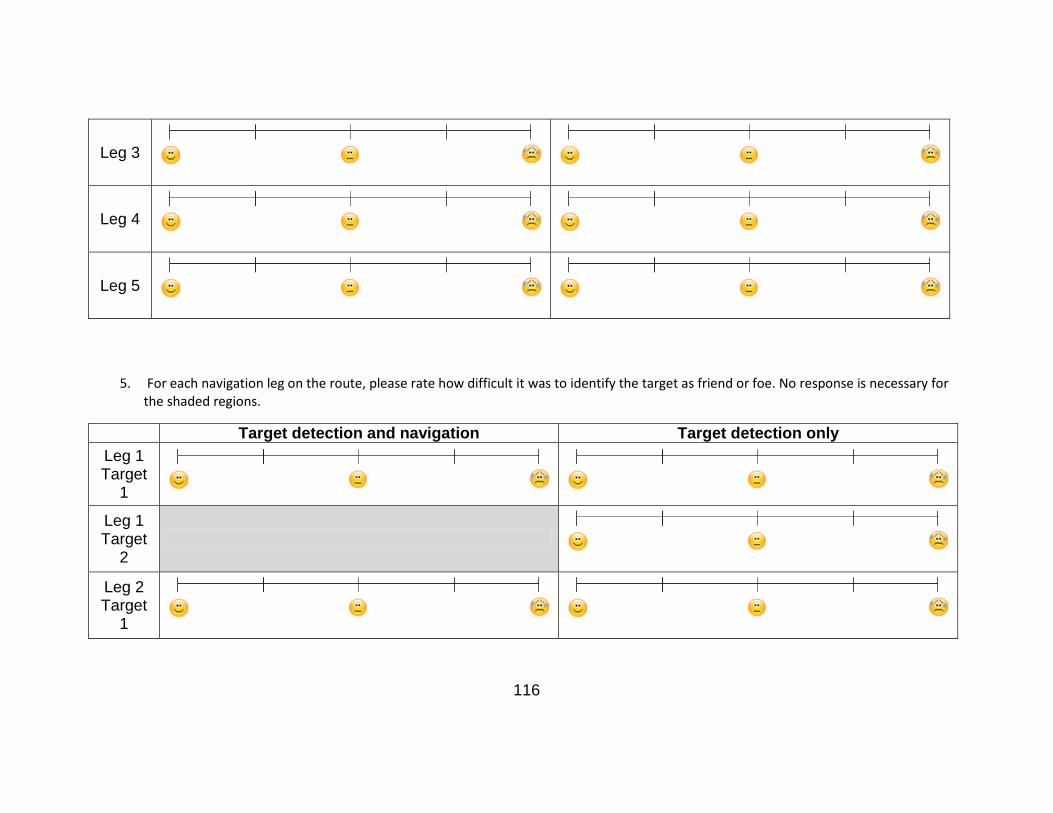
116
Leg 3
Leg 4
Leg 5
5. For each navigation leg on the route, please rate how difficult it was to identify the target as friend or foe. No response is necessary for the shaded regions.
Target detection and navigation Target detection only
Leg 1 Target
1
Leg 1 Target
2
Leg 2 Target
1
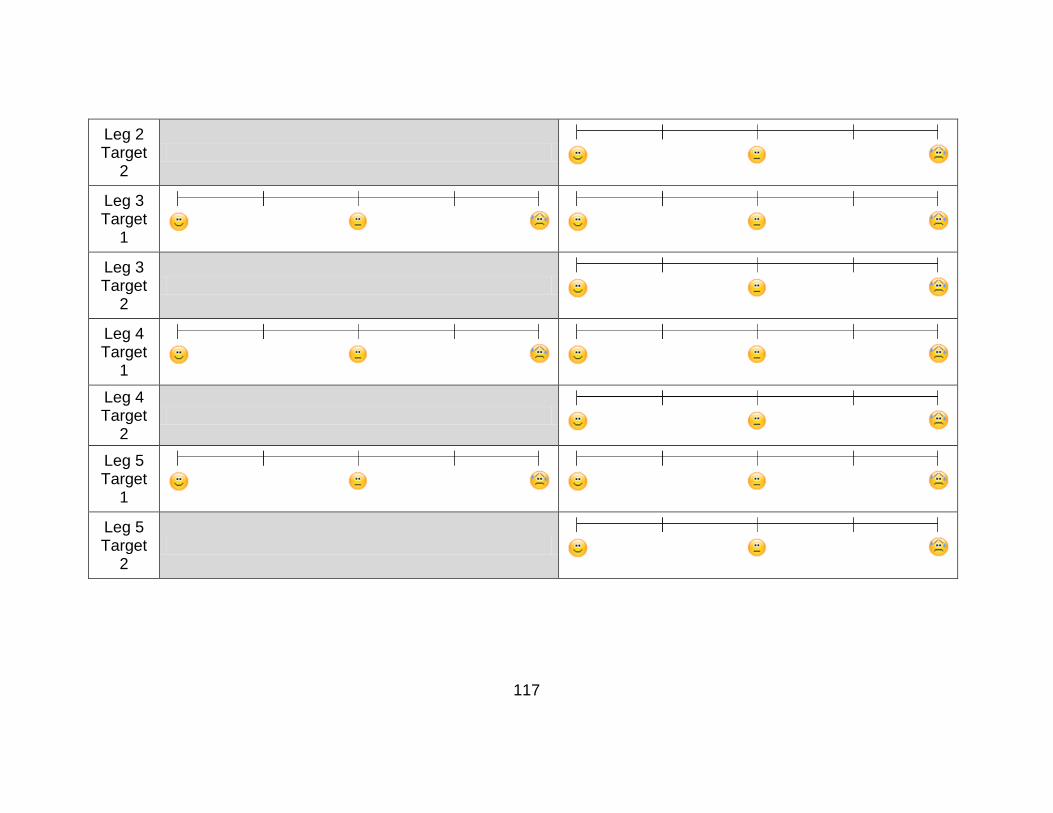
117
Leg 2 Target
2
Leg 3 Target
1
Leg 3 Target
2
Leg 4 Target
1
Leg 4 Target
2
Leg 5 Target
1
Leg 5 Target
2
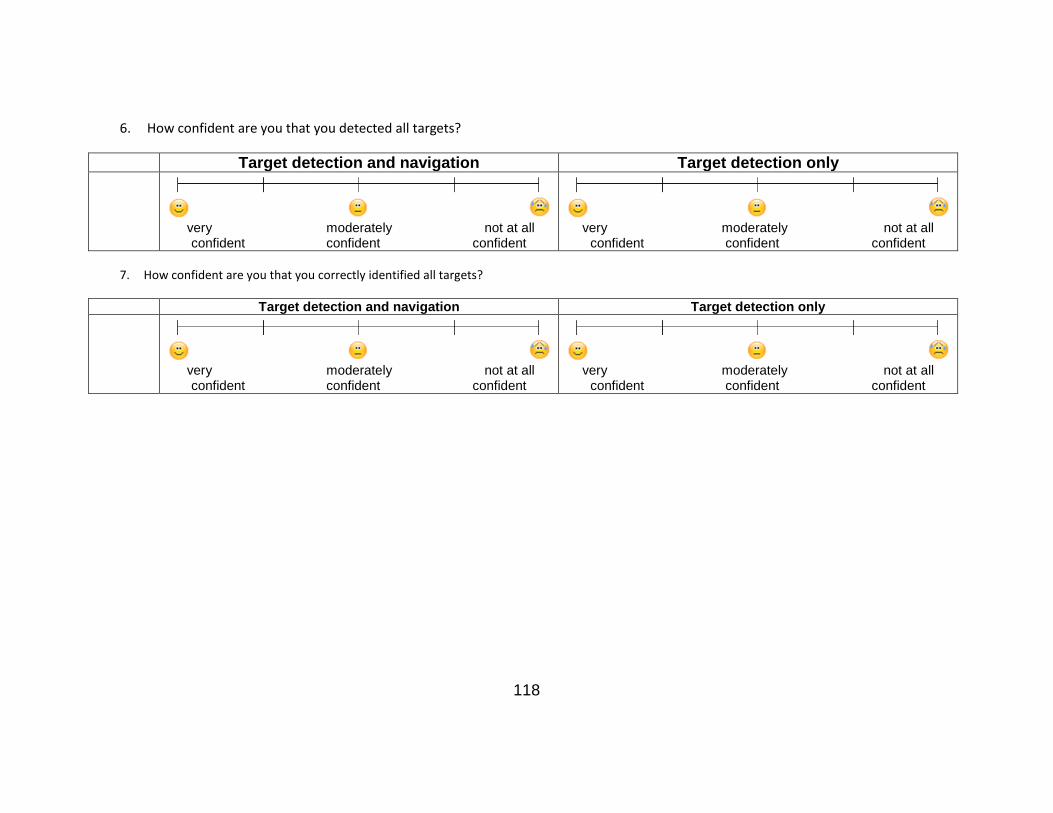
118
6. How confident are you that you detected all targets?
Target detection and navigation Target detection only
very moderately not at all confident confident confident
very moderately not at all confident confident confident
7. How confident are you that you correctly identified all targets?
Target detection and navigation Target detection only
very moderately not at all confident confident confident
very moderately not at all confident confident confident

119
LIST OF REFERENCES
Allen, R., McGeorge, P., Pearson, D., & Milne, A. B. (2004). Attention and expertise in multiple target tracking. Applied Cognitive Psychology, 18, 337–347.
Aral, S., Brynjolfsson, E., & Van Alstyne, M. (2006). Information, technology and information worker producitivity: Task level evidence. International Conference on Information Systems Proceedings. Retrieved from http://aisel.aisnet.org/icis2006/21.
Biers, D. W. (1995). Do we need conjoint measurement. The Human Factors and Ergonomics Society, 39(19), 1233–1237.
Carlson-Radvansky, L. A. (1999). Memory for relational information across eye movements. Perception & Psychophysics, 61(5), 919–934.
Causse, M., Baracat, B., Pastor, J., & Dehais, F. (2011). Reward and uncertainty favor risky decision-making in pilots: evidence from cardiovascular and oculomatric meaurements. Applied Psychophysiological Biofeedback, 36(4), 231–242.
Colbert, H. J., & Tack, D. W. (2005). Augmented reality for battlefield awareness, Toronto, Ontario: DRDC Toronto Scientific Authority.
Cooper, G. E., & Harper, R. P. J. (1969, April). The use of pilot rating in the evaluation of aircraft handling qualities (AD689722 #567). Moffett Field, CA: NATO AGARD.
Cunningham, J. A., Nelson, W. T., Hettinger, L. J., Haas, M. W., & Russell, C. A. (1995). Assessing target detection performance using head position data: A qualitative and quantitative analysis. International Symposium on Aviation Psychology, 8, 158–163.
Epley, N., Keysar, B., Van Boven, L., & Gilovich, T. (2004). Perspective taking as egocentric anchoring and adjustment. Journal of Personality and Social Psychology, 87(3), 327–339.
Fellner, G., Güth, W., & Maciejovsky, B. (2004). Illusion of Expertise in Portfolio Decisions: An Experimental Approach. Journal of Economic Behavior & Organization, 55(3), 355–376.
Fong, A., Sibley, C., Coyne, J., & Baldwin, C. (2011). Method for characterizing and identifying task evoked pupillary pesponses during varying workload

120
levels. Proceeding of the Human Factors and Ergonomics Society Annyal Meeting, 55(1), 207–211.
Hahn, M. E. (2005). Implementation and analysis of the chromakey augmented virtual environment (ChrAVE) version 3.0 and virtual environment helicopter (VEHelo) version 2.0 in simulated helicopter training (Master’s thesis, Naval Postgraduate School). Retrieved from http://edocs.nps.edu/npspubs/scholarly/theses/2005/Jun/05Jun_Hahn_Mark.pdf
Hart, S. G., & Steveland, L. E. (1988). Development of NASA-TLX (Task Load Index): Results of empirical and theoretical research.. In P. A. Hancock & N. Meshkati (Eds.) Human mental workload. Amsterdam: North Holland Press.
Jessee, M. S. (2010). Examining the convergent and discriminant validity of visual and mental workload using ocular activity variables (ARL-TR-5132). Aberdeen Proving Ground, MD: Army Research Laboratory
Jessee, M. S. (2010). Eye Tracker: Implementing a Physiological Measure of Visual and Mental Workload. Retrieved from http://www.manprint.army.mil/documents/2010/Sage_Jessee_PPT.pdf
Just, M. A., Carpenter, P. A., & Miyake, A. (2003). Neuroindices of cognitive workload: neuroimaging, pupillometric, and event-related potential studies of brain work. Theoretical Issues in Ergonomic Sciences, 4, 56–88.
Kasarskis, P., Stehwien, J., Hickox, J., & Aretz, A. (2001). Comparison of Expert and Novice Scan Behaviors During VFR. Proceedings of the 11th International Symposium on Aviation.
Lavine, R., Dickens, B., McNamara, J., Sibert, J., Gokturk, M., & Heckman, K. (1999). Eye-Tracking in a Visual Vigilance Task. International Symposium of Aviation Psychology, 10, 903–909.
Lennerton, M. J. (2004). Exploring a chromakeyed augmented virtual environment for viability as an embedded training system for military helicopters (Master’s thesis, Naval Postgraduate School). Retrieved from http://edocs.nps.edu/npspubs/scholarly/theses/2004/Jun/04Jun_Lennerton.pdf
Marshall, S. P. (2000). Method and apparatus for eye tracking and monitoring pupil dilation to evaluate cognitive activity. USA, Patent No. 6090051.
Marshall, S. P. (2007). Identifying cognitive state from eye metrics. Aviation, Space, and Environmental Medicine, 78(5), B165–B175.

121
Mayer, J. D., & Bower, G. H. (1985). Naturally occurring mood and learning: Comment on Hasher, Rose, Zacks, Sanft, and Doren. Journal of Experimental Psychology: General, 114(3), 396–403.
Megaw, T. (2005). The definition and measurement of mental workload. In Wilson, J. R., Corlett, N. (Eds.), Evaluation of Human Work. Boca Raton, FL: CRC Press.
NATOPS Flight Manual Navy Model MH-60S Helcopter (A1-H60SA-NFM-000). 2008. U.S. Navy.
Pezzo, M. V. (2011). Hindsight bias: A primer for motivational researchers. Social and Personality Psychology Compass, 5(9), 665–678.
Phaesant, S., & Haslegrave, C. M. (2006). Bodyspace; anthropometry, ergonomics, and the design of work, 3rd ed. New York: Taylor & Fancis.
Proctor, R. W. & Van Zandt, T. (2008). Human factors in simple and complex systems, 2nd ed. Boca Raton: CRC Press.
Roscoe, A. H. (1984). Assessing pilot workload in flight. Why measure heart rate, HRV, and respiration? Luton, UK: Royal Aircraft Establishment Bedford.
Shepherd, A., & Stammers, R. B. (2005). Task Analysis. In: Evaluation of Human Work. Boca Raton(FL): CRC Press.
Sibley, C., Coyne, J., & Baldwin, C. (2011). Pupil Dilation as an Index of Learning. Proceedings of the Human Factors and Ergonomics Society Annual Meeting, 55, 237–241.
Starkes, J. L., & Allard, F. (1993). Cognitive issues in motor expertise. Amsterdam: North Holland.
Stern, J. A., Walrath, L. C., & Goldstein, R. (1984). The endogenous eyeblink. Psychophysiology, 21(1), 22–33.
Sullivan, J. A. (2010). Assessing neurophysiological markers for training and simulation to develop expertise in complex cognitive skills (PhD Dissertation, Naval Postgraduate School). Retrieved from http://edocs.nps.edu/npspubs/scholarly/dissert/2010/Sep/10Sep_Sullivan_PhD.pdf
Tole, J. R., Stephens, A. T., Vivaudou, M., Ephrath, A., Young, L. R. (1983). Visual scanning behavior and pilot workload [Final Report], Washington, D.C.: NASA.

122
Yerkes, R. M., & Dodson, J. D. (1908). The relations of strength of stimulus to rapidity of habit formation. Journal of Comparative Neurology and Psychology, 18(5), 459–482.

123
INITIAL DISTRIBUTION LIST
1. Defense Technical Information Center Ft. Belvoir, Virginia
2. Dudley Knox Library Naval Postgraduate School Monterey, California
3. Dr. Quinn Kennedy
Naval Postgraduate School Monterey, California
4. Dr. Ji Hyun Yang
Naval Postgraduate School Monterey, California
5. CDR Harrison Schramm
Naval Postgraduate School Monterey, California