naval postgraduate school monterey, … classification of this page ... the performance evaluation...
TRANSCRIPT

AD-A246 020
NAVAL POSTGRADUATE SCHOOLMonterey, California
00JAN ,3. 11992
oTHE SISo ,
THE ERROR PERFORMANCE ANALYSIS OVERCYCLIC REDUNDANCY CHECK CODES
by
Yoon, Hee Byung
June 1991
Thesis Advisor: Chyan Yang
Approved for public release; distribution is unlimited
92-024221111 11111 11111 1111 1111 1111 1111 II! 1

UNCLASSIFIEDSECURITY CLASSIFICATION OF THIS PAGE
Form ApprovedREPORT DOCUMENTATION PAGE OMB No. 0704-0188
la REPORT SECURITY CLASSIFiCATION lb RESTRICTIVE MARKINGS
UNCLASSIFIED2a SECURITY CLASSIFICATION AUTHORITY 3 DISTRIBUTION /AVAILABILITY OF REPORT
Approved for public release;2b. DECLASSIFICATION/DOWNGRADING SCHEDULE distribution j - unlimited
4. PERFORMING ORGANIZATION REPORT NUMBER(S) 5 MONITORING ORGANIZATION REPORT NUMBER(S)
6a NAME OF PERFORMING ORGANIZATION 6b OFFICE SYMBOL 7a NAME OF MONITORING ORGANIZATION(if applicable)
Naval Postgraduate School EC Naval Postgraduate School6c. ADDRESS (City, State, and ZIP Code) 7b ADDRESS (City, State, and ZIP Code)
Monterey, CA 93943-5000 Monterey, CA 93943-5000
8a. NAME OF FUNDING/SPONSORING 8b OFFICE SYMBOL 9 PROCUREMENT INSTRUMENT IDENTIFICATION NUMBERORGANIZATION (If applicable)
8c. ADDRESS (City, State, and ZIP Code) 10 SOURCE OF FUNDING NUMBERS
PROGRAM PROJECT I TASK WORK UNITELEMENT NO NO NO jACCESSION NO
11. TITLE (Include Security Classification) THE ERROR PERFORMANCE ANALYSIS OVER CYCLIC
REDUNDANCY CHECK CODES
12 PERSONAL AUTHOR(S)
YOON, Hee Byung13a TYPE OF REPORT 113b TIME COVERED 14 DATE OF REPORT (Year, Month, Day) 15 PAGE COUNT
Master's Thesis I FROM On_19-1 7716 SUPPLEMENTARY NOTATIONThe views expressed in this thesis are those of theauthor and do not reflect the official policy or position of the Depart-ment of Defense or the US Government.17 COSATI CODES 18 SUBJECT TERMS (Continue on reverse if necessary and identify by block number)
FIELD GROUP SUB-GROUP Error Performance Analysis; Cyclic RedundancyCheck Codes; CRC Block Burst Error
19 ABSTRACT (Continue on reverse if necessary and identify by block number)
The burst error is generated in digital communication networks byvarious unpredictable conditions, which occur at high error rates, forshort durations, and can impact services. To completely describe a bursterror one has to know the bit pattern. This is impossible in practice onworking systems. Therefore, under the memoryless binary symmetric channel(MBSC) assumptions, the performance evaluation or estimation schemes fordigital signal (DS) 1 transmission systems carrying live traffic is aninteresting and important problem.
This study will present some analytical methods, leading to efficientdetecting algorithms of burst error using cyclic redundancy check (CRC)code. The definition of burst error is introduced using three differentmodels. Among the three burst error models, the mathematical model is
20 DfSTRiBUTION/AVAILABfLITY OF ABSTRACT 21 ABSTRACT SECURITY CLASSIFICATION
[UNCLASSIFEDrUNLIMITED 0] SAME AS ROT 0 DTIC USERS UNCLASSIFIED22a NAME OF RESPONSIBLE INDIVIDUAL 22b TELEPHONE (include Area Code) 22c OFFICE SYMBO.
VANC rhlnn ,.408-646-2266 EC/Y2DD Form 1473, JUN 86 Previous editions are obsolete SECURITY CLASSIFCATOh, OF Ti,.S "cAu
S/N 0102-LF-014 ,-6603UNCLASSI FIED
i

UNCLASSIFIED
SECURITY CLASSIFICATION OF THIS PAGE
19. cont.used in this study.
The probability density function f(b) of burst error of length bis proposed. The performance of CRC-n codes is evaluated and analyzedusing f(b) through the use of computer simulation model within CRCblock burst error. The simulation result shows that the mean blockburst error tends to approach the pattern of the burst error whichrandom bit errors generate.
DD Form 1473, JUN 86 (Reverse') !,I i1 l II A ;'II I;Atl )N (! III:, PA I
UNCLASSIFIEDii

Approved for public release; distribution is unlimited
The Error Performance Analysis overCyclic Redundancy Check Codes
by
Yoon, Hee ByungLT, Korean Navy
B.S, Naval Academy Korea, 1983
Submitted in partial fulfillment of therequirements for the degree of
MASTER OF SCIENCE IN ELECTRICAL AND COMPUTER ENGINEERING
from the
NAVAL POSTGRADUATE SCHOOL
June, 1991
Author: _____
Yoon, Hee Byung
Approved by: -1
Chyan Yang, Thesis' Advisr
Tri T. Ha, Second Reader
Acoe I0 ForDTIS TABI
M.A. Morgan, ChairmWz' tA - 0Department of Electrical and Computer Engineering J,,
D ist

ABSTRACT
The burst error is generated in digital communication networks by various un-
predictable conditions, which occur at high error rates, for short durations, and can
impact services. To completely describe a burst error one has to know the bit pattern.
This is impossible in practice on working systems. Therefore, under the memoryless
binary symmetric channel (MBSC) assumptions, the performance evaluation or esti-
mation schemes for digital signal 1 (DS1) transmission systems carrying live traffic is
an interesting and important problem.
This study will present some analytical methods, leading to efficient detecting
algorithms of burst error using cyclic redundancy check (CRC) code. The definition
of burst error is introduced using three different models. Among the three burst error
models, the mathematical model is used in this study.
The probability density function f(b) of burst error of length b is proposed. The
performance of CRC-n codes is evaluated and analyzed using f(b) through the use of
a computer simulation model within CRC block burst error. The simulation result
shows that the mean block burst error tends to approach the pattern of the burst
error which random bit errors generate.
iv
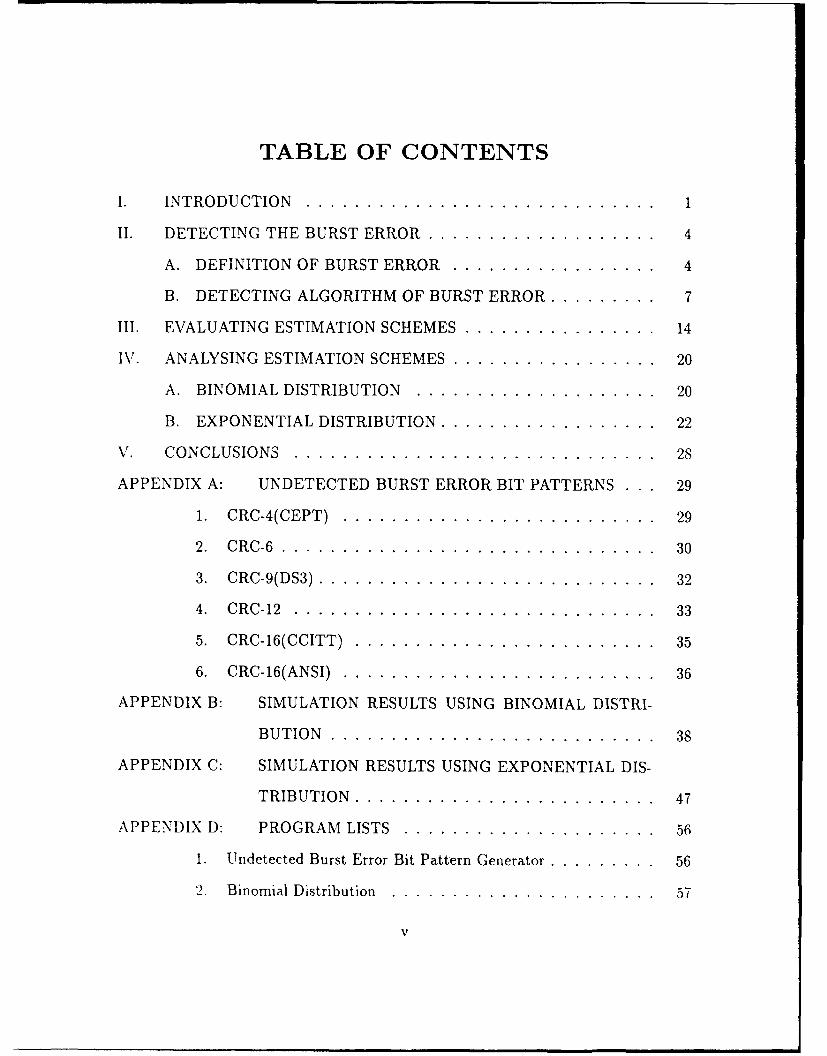
TABLE OF CONTENTS
1. INTRODUCTION.................................... 1
11. DETECTING THE BURST ERROR.........................4
A. DEFINITION OF BURST ERROR.......................4
B. DETECTING ALGORITHM OF BURST ERROR............ 7
Ill. EVALUATING ESTIMATION SCHEMES.................... 14
IV. ANALYSING ESTIMATION SCHEMES..................... 20
A. BINOMIAL DISTRIBUTION......................... 20
B. EXPONENTIAL DISTRIBUTION...................... 22
V.CONCLUSIONS.....................................28
APPENDIX A: UNDETECTED BURST ERROR BIT PATTERNS ... 29
1. CRC-4(CEPT)................................ 29
2. CRC-6..................................... 30
3. CRC-9(D53).................................. 32
4. CRC-12.................................... 33
5. CRC-16(CCITT)...............................35
6. CRC-16(ANSI)................................ 36
APPENDIX B: SIMULATION RESULTS USING BINOMIAL DISTRI-
BUTION................................. 38
APPENDIX C: SIMULATION RESULTS USING EXPONENTIAL DIS-
TRIBUTION...............................47
APPENDIX D: PROGRAM LISTS..........................56
I. Undetected Burst Error Bit Pattern Generator........... 56
2. Binomial Distribution.......................... 5
v

3. Exponential Distribution. .. .. .. ... ... ... ... .... 61
REFERENCES .. .. .. .. ... ... ... .... ... ... ... ... .... 65
INITIAL DISTRIBUTION LIST. .. .. .. ... .... ... ... ... .... 66

LIST OF TABLES
2.1 EXTENDED SUPERFRAME FORMAT ................ 9
2.2 CRC CODES . .. .... ..... .. .. .. ... .. .. .. .. .. 11
2.3 UNDETECTED BURST ERROR PATTERN FOR CRC-6 CODE. . 13
3.1 MEANS, SD, F(6), AND MODE FOR CRC-6 CODE ........... 16
3.2 MEAN BURST ERROR LENGTH WITH BER ............ 18
4.1 SIMULATION RESULTS OF CRC-6 USING BINOMIAL DISTRI-
B U T IO N . . . . . . . . . . . . . . . . . . . . . . . . . . . . . . . . . . 21
4.2 SIMULATION RESULTS OF CRC-6 USING EXPONENTIAL DIS-
TRIBUTION ............................... 25
B.1 SIMULATION RESULTS OF CRC-4(2048 BITS) USING BINOMIAL
DISTRIBUTION ............................. 39
B.2 SIMULATION RESULTS OF CRC-9(14280 BITS) USING BINOMIAL
DISTRIBUTION ............................. 40
B.3 SIMULATION RESULTS OF CRC-12(1880 BITS) USING BINOMIAL
DISTRIBUTION ............................. 41
B.4 SIMULATION RESULTS OF CRC-16(256 BITS) USING BINOMIAL
DISTRIBUTION ............................. 42
B.5 SIMULATION RESULTS OF CRC-16(1024 BITS) USING BINOMIAL
DISTRIBUTION ............................. 43
C.1 SIMULATION RESULTS OF CRC-4(2048 BITS) USING EXPONEN-
TIAL DISTRIBUTION .......................... 48
C.2 SIMULATION RESULTS OF CRC-9(14280 BITS) USING EXPO-
NENTIAL DISTRIBUTION ....................... 49
vii

C.3 SIMULATION RESULTS OF CRC-12(1880 BITS) USING EXPO-
NENTIAL DISTRIBUTION ....................... 50
C.4 SIMULATION RESULTS OF CRC-16(256 BITS) USING EXPONEN-
TIAL DISTRIBUTION .......................... 51
C.5 SIMULATION RESULTS OF CRC-16(1024 BITS) USING EXPO-
NENTIAL DISTRIBUTION ....................... 52
viii
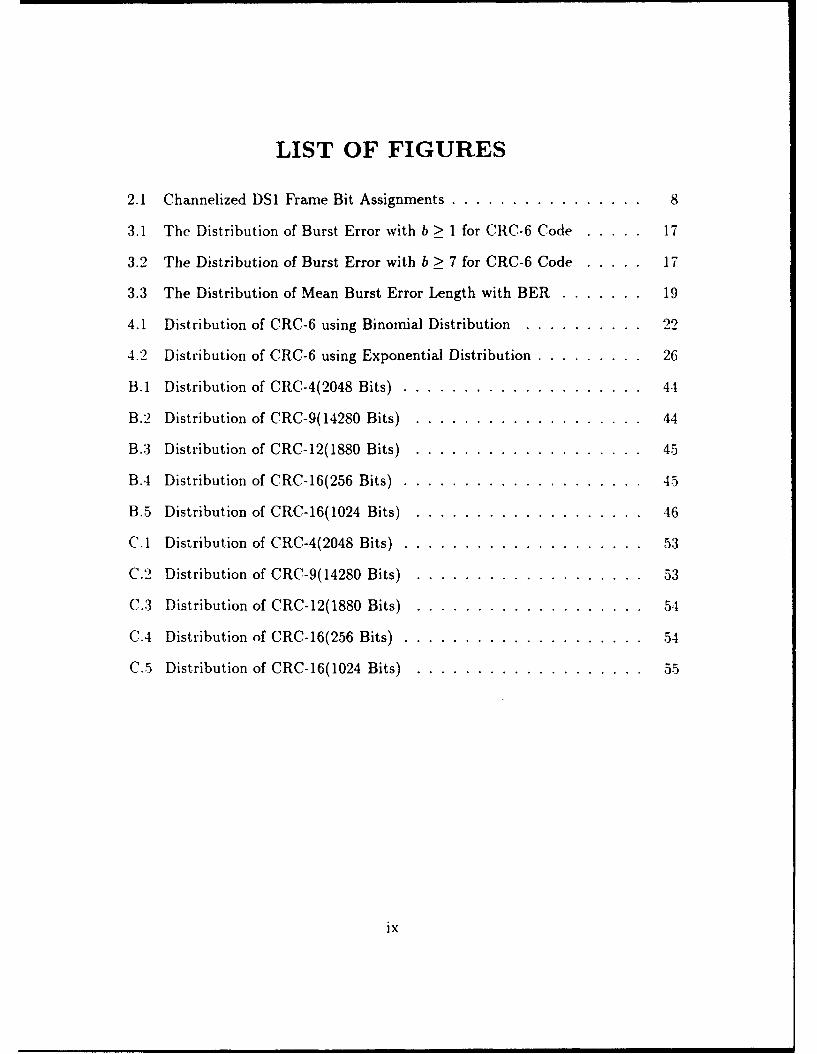
LIST OF FIGURES
2.1 Channelized DS1 Frame Bit Assignments. .. .. .. .. ... ... ... 8
3.1 The Distribution of Burst Error with b > 1 for CRC-6 Code .. .. ... 17
3.2 The Distribution of Burst Error with b > 7 for CRC-6 Code .. .. ... 17
3.3 The Distribution of Mean Burst Error Length with BER .. .. .. ... 19
4.1 Distribution of CRC-6 using Binomial Distribution. .. .. .. ..... 2
4.2 Distribution of CRC-6 using Exponential Distribution .. .. .. .. ... 26
B. 1 Distribution of CRC-4(2048 Bits) .. .. .. .. ... ... .... .... 44
B.2 Distribution of CRC-9(14280 Bits). .. .. .. .... ... ... .... 44
B.:3 Distribution of CRC-12(1880 Bits)..... ...... .. .. .. .. ... 5
BA4 Distribution of CRC-16(256 Bits).. .. .. .. ... ... .... .... 4.5
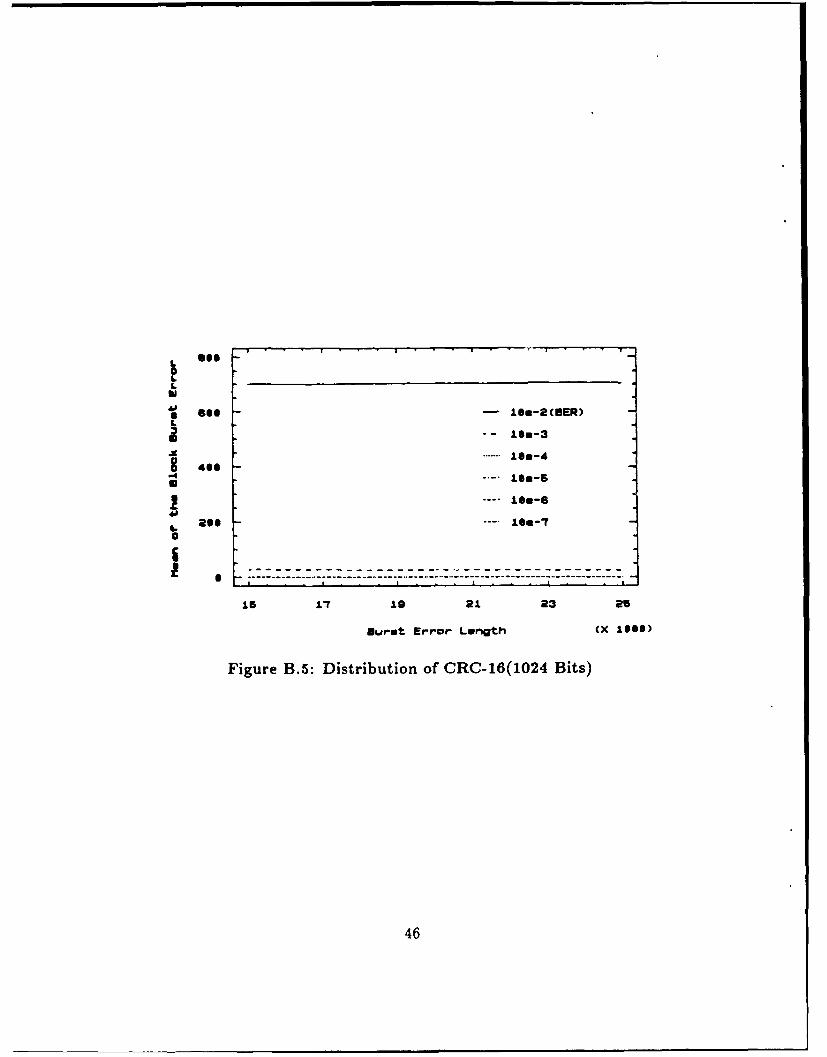
B. 5 Distribution of CRC-16(1024 Bits). .. .. .. .... ... ... .... 46
C.1I Distribution of CRC-4(2048 Bits) .. .. .. .. ... ... ... ..... 53
C.2 Distribution of CRC-9(14280 Bits). .. .. .. .... ... ... .... 53
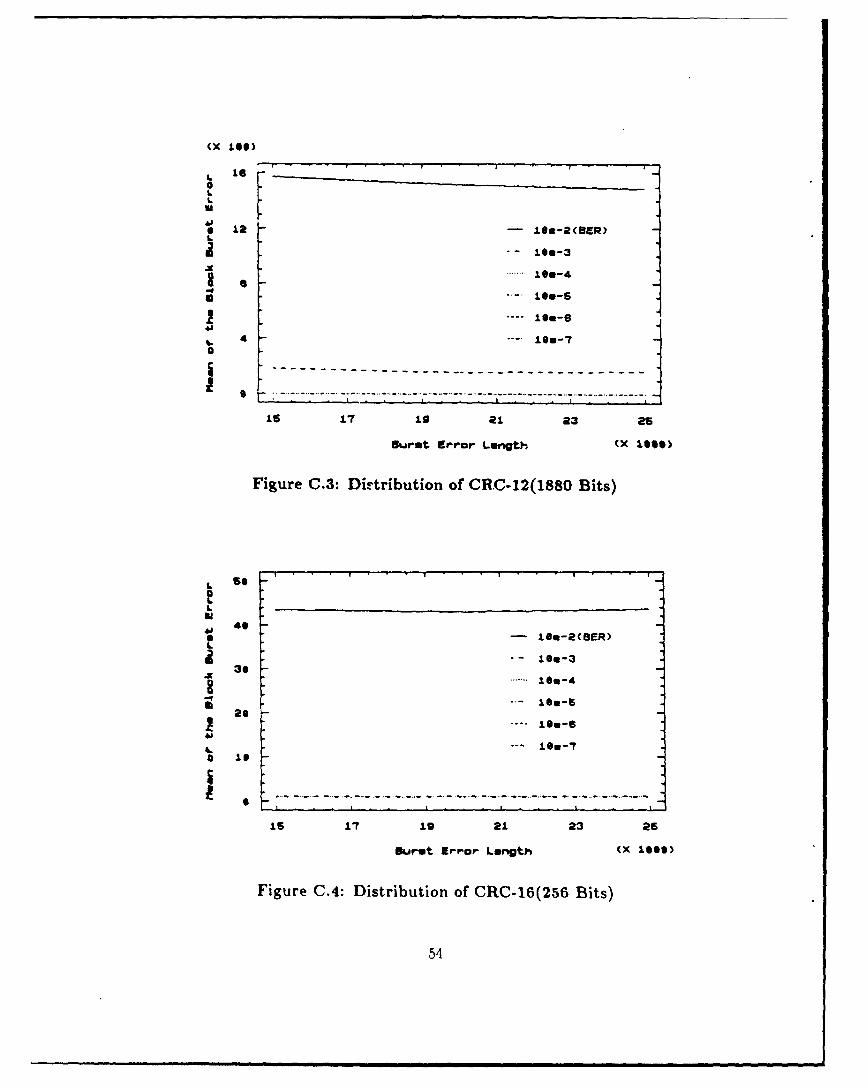
C.3 Distribution of CRC-12(1880 Bits). .. .. .. .... ... ... .... 54
CA4 Distribution of CRC-16(256 Bits) .. .. .. .. ... ... ... ..... 54
C..5 Distribution of CRC-16(1024 Bits).... .. .. .. .. .. .. .. ..... 5
ix

ACKNOWLEDGMENT
I would like to thank the Korean Navy for the opportunity to study at the Naval
Postgraduate School. I wish to thank Dr. Chyan Yang for his patient guidance,
continuous assistance and very helpful criticism throughout this work. I am very
grateful to Dr. Tri T. Ha whose comments and recommendations contributed to the
successful completion of this thesis. Throughout this thesis preparation, Dr. Jai Eu
has helped in confirming my understanding of the subject, revising my approach to
the simulation, and best of all giving me the confidence of doing useful research work
that is of industrial interest. Finally, I am grateful to my mother and also grateful to
my wife. Kyung Hee for her support and patience.
x

I. INTRODUCTION
The integrated services digital network (ISDN) is a planned worldwide public
telecommunication network that will serve a wide variety of user needs. Error-free
transmission is a necessity in any telecommunication network. The analysis and
evaluation of errors that occur during the transmission have therefore received much
attention in the digital communications industry.
Bit errors may be caused by distortion, thermal noise, timing jitter, hardware
malfunction, software bugs, environment and man-made interferences, and other fac-
tors These errors are present in the live traffic data bit stream. When the bit
error rates exceed 106, the bit error perturbations become noticeable in voice grade
services and bccome unacceptable at 10 - [Ref. 1][Ref. 9].
Many digital signal 1 (DS1) systems are characterized as having a combination
of random errors and burst errors. Random error analysis forms the basis of most
digital network maintenance and action limits. However, burst conditions, where high
error rates occur for short durations, can impact services. It is important that such
burst conditions be detected and corrected quickly to provide quality digital networks
as digital services become an integral part of the user's operations.
The burst error is generated in digital networks by various unpredictable con-
ditions. In addition, burst error patterns are always complicated by the pattern of
the bit streams that are being transmitted. Although Dr. J. Eu has investigated the
random error problem in [Ref. 11, the burst error has not been studied yet. Therefore,
under the memoryless binary symmetric channel (MBSC) assumptions, the perfor-
mance evaluation or estimation schemes of burst errors for DS1 transmission systems
carrying live traffic is an interesting and important problem. The symmetric binary
1

channel is memoryless; a sequence of indepedent errors produces the noise digits.
Each bit has the same probability of having an error occur.
To completely describe a burst error, one must know the bit pattern. This is
impossible in practice on working systems, and consequently a burst error is charac-
terized by a chosen set of independent parameters. Two commonly used parameters
are bit error ratio (BER) and the length of the burst.
If one makes a vigorous examination of the number of burst errors and assumes
that all error patterns are considered equally alike, the fraction of undetected burst
errors tends to be upper-bounded by 1/ 2b for a burst error length b [Ref. 1][Ref. 10].
The b is defined as any pattern of errors in a CRC block for which the number of bits
between the first and last errors is inclusive.
In this study, Gilbert's model [Ref. 3] of a burst noise channel, which is a binary
symmetric channel determined by a Markov chain, was used to derive the definition
of burst error under the MBSC assumptions. A Markov chain with two states can
be used to generate the burst errors. The two states will be called G (for Good) and
B (for Bad or Burst). In state G the noise digits are always 0, meaning no noise.
The Markov chain can be thought of as a Bernoulli trial of tossing a coin. In state
B a coin is tossed to decide whether the noise digit will be 0 or 1. If the coin is
fair the bit error ratio is 0.5. The exact probability depends on the bit error ratio.
The coin-tossing feature is included because actual burst errors contain good digits
interspersed with the errors. One may also use the mathematical model to derive the
definition of burst error. An error burst can be defined as a string of bits with at
least the first and the last bits in error for a bit stream of length b.
A detailed explanation of both methods to derive the definition of burst error
will be discussed in Section II. In Section II Elliott's model [Ref. 61 is introduced
for estimating the error rates for each code on burst noise channels. The efficient
2
detecting algorithms of the burst error is discussed for various cyclic redundancy
check (CRC) codes, and show the undetected burst error patterns for each CRC
code.
Analysis and evaluation of the estimation schemes based on the extended su-
perframe (ESF) format using the probability density function (pdf) is discussed in
Section III. The pdf of burst error of length b is proposed for each CRC block. The
statistics of the mode, mean, variance, and standard deviation(SD) of each CRC code
are also discussed in Section III.
In Section IV, the relationship between burst errors and block burst errors, and
plots for each CRC code are discussed. Two different methods of simulating the burst
error statistics, using binomial and exponential distribution, are investigated as well.
Finally, concluding remarks are given in Section V.
3

II. DETECTING THE BURST ERROR
This chapter gives the definition of burst error, the algorithm of CRC error
detection, and the pattern generated for the undetected burst errors.
A. DEFINITION OF BURST ERROR
Models have been used in the past to define burst error. The models most com-
monly used for this purpose are Gilbert's [Ref. 31 and Elliott's [Ref. 61. An overview
of both these models is presented, followed by the mathematical representation of a
burst error.
Gilbert's model is based on a Markov chain. Gilbert used the burst noise model
to define the burst error: the symmetric binary channel generates a sequence of binary
noise digits. The burst noise channel consists of a two-state Markov chain which can
be used to generate the burst error. The two states are G (for Good) and B (for Bad
or Burst). In general, the channel state with the lower error probability is the good
state. In order to complete the model one needs to specify the transition probabilities
Q and q. Q is the conditional probability that the channel remains in the good state
G for the next time interval, given that it is in state G at the present time interval.
The q is the conditional probability that the channel remains in the bad state [Ref.
5].
To simulate the burst noise, the transition probabilities P = Prob(G -+ B) and
p = Prob(B -- G) will be small while Q and q are relatively larger. Runs of G will
alternate with runs of B. The run lengths have geometric distributions with mean 1/P
for the G-runs and mean 1ip for the B-runs. The geometric distribution of G-runs
seems reasonable. If the various clicks, pops, and crashes, which might cause errors
4

on a real channel, are not related to one another, the times between such events will
have a geometric distribution. Only mathematical simplicity justifies the geometric
distribution of B-runs. The fraction of time spent in state B is P(B) = P/(p + P).
Since errors occur only in state B, and then just with probability 1 - h, the error
probability is
P(1) = (1 - h)P(B) = (1 - h)p p (2.1)
where h stands for making no error in state B.
As expected, long runs of good digits separate the burst errors. Therefore, we
define a burst error as any contiguous sequence of transmission intervals during which
the channel remains in the burst state. Basically, the burst error is merely a period
of higher than average error probability.
Elliott's model is slightly different from Gilbert's model, in which an error bit
can occur only when the channel is in the bad state. In the Elliott model, however, an
error bit can occur in either the good or the bad state but with different probabilities.
Transition between the good and bad states is the same as in the Gilbert model.
Elliott's model uses the probabilities P(m, n) to provide a means for estimating error
rates for binary block codes in more general circumstances. P(m, n) is the probability
that rn bit errors occur in a transmitted block of n bits. Elliott's model uses four
different parameters (P, p, h, k) for computing the P(m, n) where k is the probability
of correct reception of a bit when the channel is in the good state and other parameters
are the same as in the Gilbert model. Since an error bit can occur either in the good
or the bad states, Elliott uses two different probabilities, G(m, n) and B(m, n), where
G(m, n) = Prob(m errors in a block of length n - the channel is in the good state
at the first bit) and B(m, n) = Prob(m errors in a block of length n - the channel
5

is in the bad state at the first bit). Then
P(mn)G(m,n) + PB(m,n) (2.2)Pn)-p +~~n±p~Bmn
and G(m, n) and B(m, n) are given in [Ref. 6].
In a mathematical sense, a digital burst error can be defined as a string of bits
with at least the first and the last bits in error over a length b [Ref. 4]. Traditionally
one may express a bit stream by a polynomial [Ref. 71.
In the following discussion, one assumes that the burst error signal is E(x).
Then
E(x) = E(i,b,x) (2.3)
where i determines how far from the right-hand end of the received frame the burst
error is started and b is the burst error length. Such a polynomial is said to be of
degree b- 1. For example. a burst error of 100101 can be represented by a polynomial
E(x) = x.(x 5 + x2 + 1) with b = 6. From expression (2.3), it becomes
E(x) = x'(1 + aix1 + a2x? + ... + ab2x b-2 + xb- 1) (2.4)
where the first bit and the last bit are always 1 and other terms are either 0(Good)
or I(Error). Therefore the burst error signal can be rewritten as
b-2E(x) = xi(xb- + E aj x + 1) (2.5)
j=1
where a. E [0, 1].
Using Equation 2.5 one can simulate the burst error behavior and evaluate its
performance by examining the probability of burst error detection. For example, if
the degree of E(x) is less than the degree of CRC-n terms, the remainder can never
be zero: hence the burst error is always detected. To be undetected, the burst error
length b must be greater than n [Ref. 1][Ref. 7].
6

Among the three burst error models, the mathematical model is used in this
thesis since in the evaluation of Chapter II and IV only the burst error length and
CRC codes are the concerns. In this thesis, BER(c) is used for generating the burst
error and CRC codes for computing the probability of undetected burst error. That
is,p P
p+ k' + hl (2.6)P+P p+P
where k' = 1 - k and h' = 1 - h' in Elliott's model. Since only E is used in this study,
the values of P, p, h, and k are irrelevant, and the mathematical model is sufficient
for the study in the rest of the thesis.
B. DETECTING ALGORITHM OF BURST ERROR
The CRC is a method of detecting the existence of errors in the transmission
of digital signals. In communication systems using CRC codes, the digital signal
to be transmitted is partitioned into CRC blocks of equal length. The bits of each
block can be used to represent coefficients of terms in a polynomial, which are then
divided by a standard divisor polynomial. The remainder of the division is then
appended to the data block, and the resultant block is sent to the receiving end. The
receiver performs the identical division on the data block as received and generates
its own remainder. The receiver then compares its locally calculated remainder to the
remainder transmitted with the block. A difference between the remainders indicates
that the received block of the digital signal contained an error. Because each CRC
code has its own generator polynomial, it is natural to think that the burst error
pattern of each CRC code should be different. Before continuing the development of
the detecting algorithm, the DS1 ESF format and CRC codes are discussed.
A DS1 signal has a nominal line rate of 1.544Mbps. A DS1 frame consists a set
of 193 contiguous time slots (bits). The first bit in a DS1 frame is the framing bit. or
7

1 Frame125 ps, 193 Bits II I
Time,o- 1 2 . Slot# 24 b
F11 2 3 4 5 6 7 8 1 2 3 4 5 6 7 81 it i 1 2 3 4 5 6 7 8
Frame FrameBit 0 BIt 192
Note: Frame bit 0 is transmitted first.
Figure 2.1: Channelized DS1 Frame Bit Assignments
"F-bit." The remaining 192 bits of a DS1 frame are labeled "information" bits and
are collectively referred to as the DS1 "payload." These 192 bits may form a single
1536Kbps channel, or they may be divided into a variety of partitions, including the
common 24 8-bit words corresponding to 24 separate voice grade channels. Collec-
tively these are often referred to as "channelized" applications. Figure 2.1 illustrates
this configuration of a DS1 frame [Ref. 2].
One ESF format is composed of 24 consecutive DS1 frames. Each frame is
an ordered sequence of 193 bits. Therefore, the 24 DS1 frames represent 4632 bits,
and the time duration of the ESF is 3ms. The first bit of each frame (framing
bit) is designated for frame synchronization, data communication, and CRC-6 error
detection. The ESF format is shown in TABLE 2.1 [Ref. 21. The sequence of F-bits
in contiguous frames forms an 8-kb/s channel, and the fixed frame pattern sequence
(FPS) is 001011, which appears in the first bits of frames 4, 8, 12, 16, 20, and 24 of
the superframe. Each ESF has the six CRC bit positions which appear in frames 2,
6, 10, 14, 18, and 22.
8

TABLE I: EXTE DED SUPERFRAME kORMATFrame No. F Bit
Bit No. FPS CRC DL1 0 - X2 193 - Cl -
3 386 - X4 579 0 -
5 772 - X
6 965 - C2 -
7 1158 - - X8 1351 0 -
9 1544 - - X10 1737 - C3 -
11 1930 - - X12 2123 1 -
13 2316 - - X14 2509 - C4 -
15 2702 - - X16 2895 0 - -
17 3088 - - X18 3281 - C5 -19 3474 - - X20 3667 1 -
21 3860 - - X22 4053 - C6 -
23 4246 - X24 4439 1 - -
In ESF, the block of data over which a CRC is calculated is one ESF. The
standard divisor used is the sixth order polynomial: x' + x + 1. This divisor results
in a 6-bit remainder sometimes referred to as the "CRC-6 code." It is this remainder
that is carried in the six check bits, Cl through C6, of the CRC channel. The CRC-6
code calculated for a particular ESF is always carried in the CRC channel of the
subsequent ESF [Ref. 2].
The following is a detailed description of the steps required to compute the
9

CRC-6 code [Ref. 2][Ref. 7]:
1. For the purpose of calculating the CRC-6 code of an extended superframe,
the 24 F-bits of that ESF shall temporarily be set to the binary value "1." For
transmission, the true value of the F-bits is restored.
2. The resulting 4632 bits of the ESF are used in order of occurence to construct
a polynomial in x such that bit number 0 is the coefficient of the term x4 1 , and bit
number 4631 is the coefficient of the term x° .
3. This polynomial is multiplied by the factor x6, and the result is divided
by the generator polynomial x6 + x + 1. The binary coefficients of the remainder
polynomial are used in order of occurence as bits C1 through C6 of the CRC channel
in the subsequent ESF. The ordering is such that the coefficient of the term x in the
remainder polynomial is bit C1, and the coefficient of the term x° in the remainder
polynomial is bit C6.
4. The bits C1 through C6 contained in an ESF shall always be those associated
with the content of the ESF immediately preceeding ESF. Bits C1-C6 may be assigned
any value.
The CRC method of DS1 described here is capable of detecting all the ESFs with
six or fewer errors. The probability of all ESFs containing more than six transmission
errors is 63/64(98.4%). The CRC method does not indicate the number of bit errors
in an ESF, but only indicates that there was at least one. The current usage of CRC
codes for error performance monitoring are illustrated in TABLE 2.2 [Ref. 7][Ref.
10]. This table contains the block size in bits and the generator polynomial for each
CRC code. The CRC-12 system is used for transmission of streams of 6-bit characters
and generates a 12-bit frame check sequence (FCS). Both CRC-16 ANSI and CRC-16
CCITT are popular for 8-bit characters, in the United States and Europe respectively,
and both result in a 16-bit FCS [Ref. 8].
10

TA RC CODESCRC codes Block size Generator polynomial
CEPT1 CRC-4 2048 x4 + x + 1DSl CRC-6 4614 x6 +x-1DS3 CRC-9 14280 x9 + x 4 + 1
CRC-12 1880 x 12 + x 1 1 + x3 + x 2 + x + 1
CRC-16 ANSI 256, 1024 x16 + x 15 + x 2 + 1
CRC-16 CCITT 256, 1024 x1 6 + x12 + x5 + 1
It is interesting to derive the sequence of the undetected burst error pattern
and why the probability of an undetected burst error is always 1/ 2b-2. Using the
generator polynomial G(x) (see TABLE 2.2) and Equation 2.5, for an undetected
burst error, E(x) = 0 mod G(x), i.e., E(x) will be divisible by G(X). Suppose
E(x)/G(x) = Q(x) for the undetected burst error polynomial E(x). Then, one can
derive E(x) by G(x)Q(x) for various Q(x). If E(x) is of degree j (the burst error
length j + 1) and the G(x) degree is r for a given CRC-r code, then Q(x) should
have a degree of j - r when E(x) is undetected. Thus, for any undetected burst error
length, one can construct E(x) from Q(x)G(x) for given all possible Q(x) with given
burst error lengths.
Example: For Q(x) of degree 3, there are 4 possible patterns, 1001, 1011, 1101, and
1111. All E(x) of degree 9 (burst error length 10) therefore are generated, which
means that there are 4 undetected burst errors with length 10 for the CRC-6 code.
The degree of E(x) is (the degree of Q(x)) + (the degree of G(x)). For the ratio of
the portion of each burst error length n, the undetected burst error is always 1/64.
However, n = 7 is a special case due to CRC-6. In other words, the probability of
detected burst error for any number of burst error lengths and each CRC code is
always 63/64(98.4%).
11
The bit patterns of the undetected burst errors for the CRC-6 code are shown
in TABLE 2.3. In TABLE 2.3, the leftmost bit is the most significant bit (MSB) and
the rightmost bit is the least significant bit (LSB). If one examines TABLE 2.3, the
number of undetected burst errors is 4 for the burst error length 10. Since we have
210-2 possible E(x) where the number 2 is the first and last bit position and always 1,
the probability of undetected burst error is 4/28 = 1/64 = 0.015625. The probability
of detected burst error is 1 - 0.015625 = 0.9844(98.44%). Therefore the probability
of detected burst error for any burst error length is always 63/64(98.4%). The bit
pattern of undetected burst errors for other burst error lengths and various CRC
codes are shown in APPENDIX A. It can be proven that the detection probability
for any burst error length and each CRC code is always 1 - 1/2' where n is the CRC
degree.
In TABLE 2.2, the generator polynomials of CRC-12, CRC-16 CCITT, and
CRC-16 ANSI contain (x + 1) as a factor, and this ensures that all odd-weight burst
errors will be detected [Ref. 10][Ref. 11]. By computing the weight of the undetected
burst error patterns which are shown in APPENDIX A, one knows that all the burst
errors which have odd-weight in these three CRC codes are detected.
12

TABLE 2.3: UNDETECTED BURST ERROR PATTERN FOR CRC-6CODE _ _ _ _ _ _ _ _
Burst Error Undetected Error PatternLength ____________
7 1 00001 18 1 1000 10 19 101001111
11100100110 110 1010111
10010 110111011011101
_______111 101000111 10101111111
111011001111100110101110001110011110111011011001111010110111111001
_______11111100001
13
III. EVALUATING ESTIMATION SCHEMES
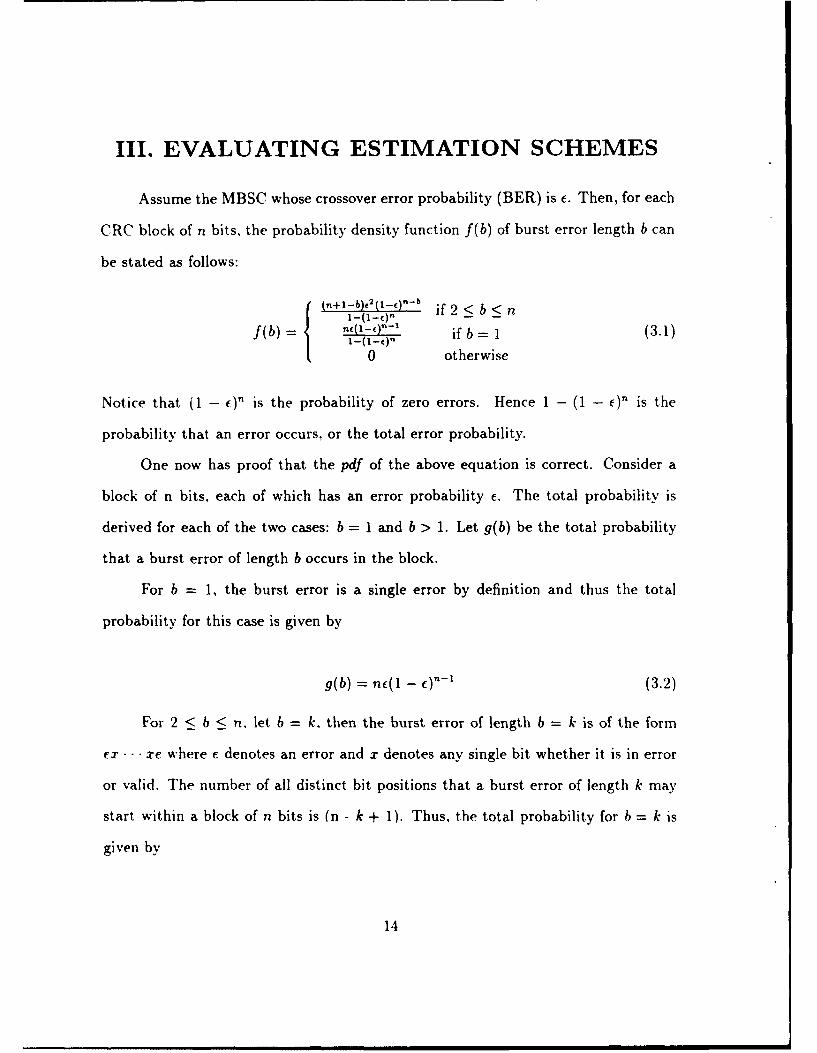
Assume the MBSC whose crossover error probability (BER) is C. Then, for each
CRC block of n bits, the probability density function f(b) of burst error length b can
be stated as follows:
(n+1-,b)2(I-()'b if 2 < b < n
f (b) b b- (3.1)1-(1-,)- i
0 otherwise
Notice that (1 - )n is the probability of zero errors. Hence 1 - (1 - f)n is the
probability that an error occurs., or the total error probability.
One now has proof that the pdf of the above equation is correct. Consider a
block of n bits, each of which has an error probability E. The total probability is
derived for each of the two cases: b = 1 and b > 1. Let g(b) be the total probability
that a burst error of length b occurs in the block.
For b = 1, the burst error is a single error by definition and thus the total
probability for this case is given by
g(b) = nf(1 - )"- (3.2)
For 2 < b < n. let b = k, then the burst error of length b = k is of the form
ex ... xe where c denotes an error and x denotes any single bit whether it is in error
or valid. The number of all distinct bit positions that a burst error of length k may
start within a block of n bits is (n - k + 1). Thus, the total probability for b = k is
given by
14

g(k) = (n + 1 - k)E2 (1 - )nl-k (3.3)
To complete the proof, we need to show that the sum of all the total probabili-
ties is I - (1 - E)n. Noting that
n-1
-i(I - = C-2[1 - n(l - c)-' + (n - 1)(1 - (3.4)i=i
and rearranging the indices, we now have
n n-1
y:g(k) =2E i(1 -E I = 1 -n(1-)n- +(n- 1)(1- ')n . (3.5)k=2 i=1
Since
n
S(k) =I I )(3.6)k=1
we get
n
yZ f(k) = 1. (3.7)k=1
This completes the proof.
From Equation 3.1, one can compute the mean, SD, F(6) and two types of
modes for CRC-6 code which are summarized in TABLE 3.1. In TABLE 3.1, the
F(6) depends only on the BER and is given by
6
F(6)= Zf(k), (3.8)k1
15

TABLE 3.1: MEANS, SD, F(6), AND MODE FOR CRC-6 CODEBER Mean SD F(6) Mode(b > 7) Mode(b > 1)10- 8 1.036 9.047 1.0000 7 110- 7 1.355 28.61 0.9998 7 110-6 4.548 90.43 0.9977 7 110-' 36.48 284.6 0.9772 7 110- 4 354.6 850.3 0.7874 7 110- 3 2708 1202 0.0464 3615 361510- 2 4416 140.7 0.0000 4515 451510-1 4596 13.42 0.0000
where the value 6 is the degree of G(x) in CRC-6, and the mode means that the value
of k is P(b = k) maximized. The distribution of burst error between the burst error
lengths, and f(b) is depicted in Figure 3.1 with b > 1 and in Figure 3.2 with b > 7.
The mean of the burst error length for BER = 10- 8 is much smaller than for BER
= 10- 1 . This means that the detected burst error length depends only on the BER.
When the BER is less than 10-6 for CRC-6 codes, the mean burst error lengths are
4.548, 1.355, and 1.036. They are most likely detected by the generator polynomial
G(x) because their lengths are less than 6. By thc definition of mode, the burst error
lengths I and 7 occur more frequently for a BER less than 10- 4 for b > I and b > 7.
It is very interesting to note that as seen in TABLE 3.1, in the vicinity of BER 10-
the SD of the burst error length seems to achieve the maximum value. One suspects
that the SD will be at maximum in the vicinity of 1/4614 for the CRC-6 code since
1/4614 is close to 10- . Similar observations are obtained for other CRC blocks.
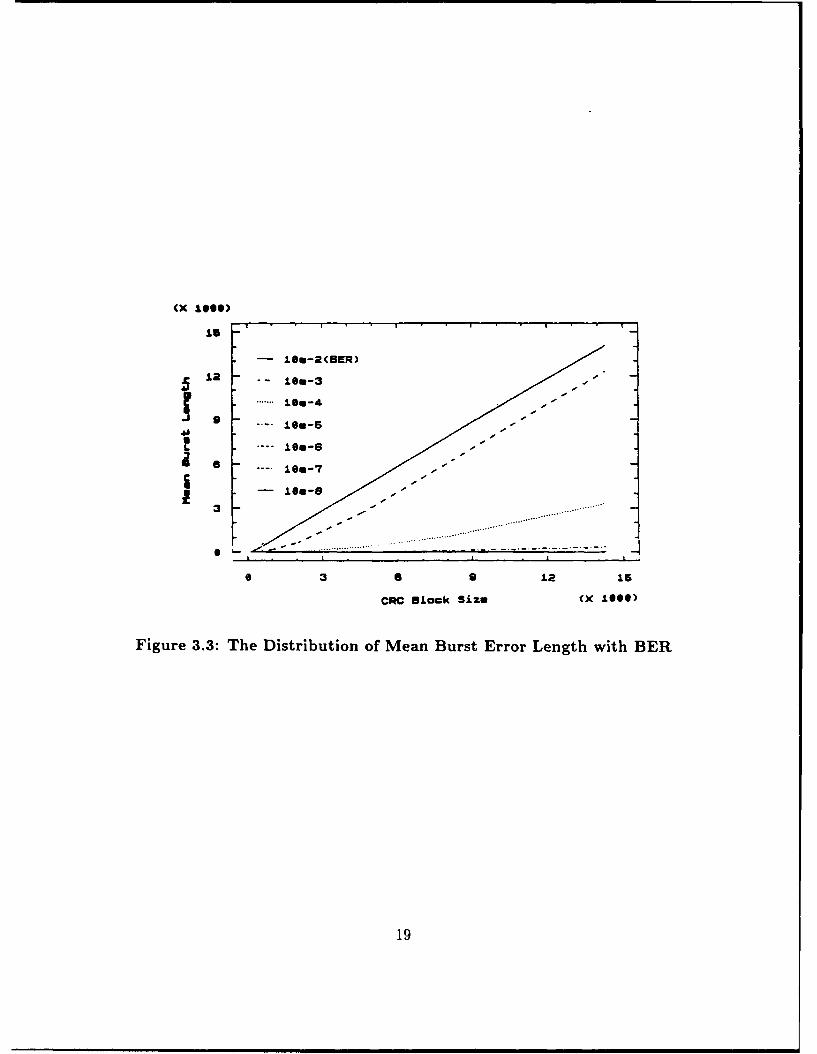
It seems worthwhile to investigate the relationship between the mean burst
error length and CRC block size with BER. The computation result is summarized in
TABLE 3.2, and the corresponding plot is depicted in Figure 3.3. The X-axis stands
16

j V)
+
S .4- *4
2 2
I Ig41441*I*I41I444444444-441Btg IIII 4I4114
S I 2 3
kIo I
Figure 3.1: The Distribution of Burst Error with b > 1 for CRC-6 Code
4 I- 4
- AF
f I
-4- *144
-- IO-7 ,
IllI
Figure 3.2: The Distribution of Burst Error with b > 7 for CRC-6 Code
17

T3LE 3.2: MEAN BURST ERROR LENGTH WITH BERBER CRC Block Size
CRC16 CRC16 CRC16 CRC4 CRC6 CRC9128 256 512 1024 2048 4614 8192 14280
10-8 1.000 1.000 1.000 1.000 1.007 1.036 1.112 1.34010- 7 1.000 1.001 1.004 1.017 1.070 1.355 2.118 4.39910- 6 1.003 1.011 1.044 1.175 1.699 4.548 12.18 34.99
10- 5 1.027 1.109 1.437 2.748 7.990 36.48 112.8 340.810- 4 1.273 2.092 5.369 18.47 70.86 354.6 1107 3290
10- 3 3.731 11.92 44.52 172.9 655.9 2708 6199 12282
10-2 27.71 100.3 320.0 826.1 1850 4416 7994 14082
for the CRC block size in bits (128 through 15,000) and the Y-axis stands for the
mean burst error length in bits (0 through 15,000). It is clear that the mean burst
error length is dependent only on the CRC block size, not on the bit position where
the burst error occurs. When BER is less than 10', the mean burst error length is
almost independent of CRC block size as compared with the higher BER (i.e., BER
is greater than 10-"). The detection probability is completely dependent on the CRC
block size, regardless of the CRC generator polynomial.
18
(X lose)
- le-2CBER)
12 -left-3
is l~m-4
46
* 3 6 9 £2 Is
CRC Black Size (X 1000)
Figure 3.3: The Distribution of Mean Burst Error Length with BER
19

IV. ANALYSING ESTIMATION SCHEMES
This chapter gives the simulation results of the burst error for each CRC block
and CRC code using binomial and exponential distribution for generating the random
number.
A. BINOMIAL DISTRIBUTION
Let X be a binomial random variable. Then X is the sum of the Bernoulli
random variable associated with each of the n independent trials, where n is the
length of the burst error. The error occurrences in different bits axe independent of
each other.
Using this fact, one can simulate the burst error for different CRC blocks and
different types of CRC codes. First, the random number is generated, bit by bit, then
the bit is checked to see whether an error has occurred or not. Second, the burst error
length is divided into each CRC block and we generate the block burst error length
using the definition of burst error. The block burst error is a burst error contained
in specified block such as the CRC-6 block (4614 bits). Lastly, the statistical results
are computed for the block burst error length. This process continues for a sufficient
number of randomly generated burst errors.
The results of the block burst error for CRC-6 using the binomial distribution
are shown in TABLE 4.1. The relationship between the total burst error length and
the block burst errors with various BERs for CRC-6 is shown in TABLE 4.1. The SD
of the block burst error length has a maximum value in the vicinity of BER 10- ' for
the different total burst error lengths. This means that the SD will be at a maximum
in the vicinity of 1/4614 for CRC-6. This phenomenon occurs with other CRC codes
20

TABLE 4.1: SIMULATION RESULTS OF CRC-6 USING BINOMIALDISTRIBUTION
Total BERBurst 10- 2 10-3 10-4 10- 5 10- 6 10-7
Length StatisticalMean 3448 1250 14.12 1.149 1.001 1.000
15000 SD 140.7 859.7 64.45 2.830 0.042 0.000Mode(b > 0) 3409 1 1 1 1 1Mode(b > 6) 3409 686 7 7 7 0
Mean 3693 1410 18.16 1.048 1.001 1.00020000 SD 140.7 914.6 79.37 1.106 0.063 0.030
Mode(b > 0) 3625 1 1 1 1 1Mode(b > 6) 3625 1027 7 7 7 7
Mean 3863 1534 14.70 1.080 1.004 1.00025000 SD 140.7 954.7 68.30 1.868 0.249 0.000
Mode(b > 0) 3825 1 1 1 1 1Mode(b > 6) 3825 947 7 7 7 7
Mean 4250 1779 15.42 1.024 1.000 1.000300000 SD 140.7 1027 79.71 1.080 0.021 0.000
Mode(b > 0) 4360 1 1 1 1 1Mode(b > 6) 4360 2298 7 7 7 7
as well. The higher BER has a longer length of mean block burst error than the lower
BER. This indicates that the probability of detected block burst error for a lower
BER is higher than the higher BER which is consistent with intuitive reasoning.
It is also intersesting to note that when the BER gets larger, then the value of
the mode is larger for both cases, i.e., b > 0 and b > 6. This means that one cannot
predict which block burst error lengths are expected for each CRC block. But when
the BER gets lower, the value of the mode is small. Thus one can guess that the block
burst error is a single bit and can expect that the probability of detected block burst
error is 63/64(98.4%). In other words, a mode of large value such as 3409 makes the
prediction of burst error length more difficult since the uncertainity is higher than
the case of a mode value of 1.
21

cx ie00s
L
- I6n-2(BER)3
" - 10-3
1s-4
10 -
- --------- - - - - - - -,, - - - - - - -
is is- 21 23 2
Burst Error Length (X lose)
Figure 4.1: Distribution of CRC-6 using Binomial Distribution
The relationship between the burst errors and block burst errors for each CRC
code is depicted in Figure 4.1. The X-axis stands for the total burst error length in
bits and the Y-axis stands for the mean of the block burst errors in bits. The mean
block burst error depends on the BER and has a very small value as the BER gets
lower, as depicted in Figure 4.1. The simulation results for the different CRC codes
that are listed in TABLE 2.2 using binomial distribution are shown in APPENDIX
B.
B. EXPONENTIAL DISTRIBUTION
The relationship between the binomial distribution and exponential distribution
will now be explained for this study. The Poisson random variable arises in situations
where the burst errors occur "completely at random" in one ESF for each type of
CRC block. The pdf for the Poisson random variable is given by
22

k
P[N = k] =-C' k = 0,1,2,... (4.1)
where a is the average number of the burst error occurence in an ESF for each type
of CRC block.
One of the applications of the Poisson probabilities in Equation 4.1 is to ap-
proximate the binomial probabilities. If n is large and p is small, then for a = np
k )pk( _ p)nk --. e- - for k = 0,1,2,. (4.2)
where n is the total burst error length and p is the BER. Thus the Poisson pdf is the
limiting form of the binomial pdf when the number of Bernoulli trials n is made very
large and the probability of success is kept small, so that a = np [Ref. 12].
For one ESF (4614 bits) for the CRC-6 code, the interval T bits has been divided
into n bits. Each bit can be viewed as a Bernoulli trial if the following conditions hold:
(1) At most one error can occur in a bit, (2) the outcomes in different subintervals
are independent, and (3) the probability of an error occurrence in a bit is given by
p = a/n, where a is the average number of errors observed in a T bit interval. As
n - , the occurrence of the first error approaches an exponential random variable
with parameter A = a/T.
Therefore, the exponential random variable is obtained as a limiting form of the
geometric random variable. This means that, for a Poisson random variable, the time
between errors is an exponentially distributed random variable with parameter A =
a/T. The exponential random variable satisfies the memoryless property. One can
implement the exponential random variable using the inverse transformation method
for the burst error [Ref. 13]. This method is generally used for distributions whose
23

cumulative distribution function (cdf) can be obtained in closed form.
The pdf of the exponential distribution with parameter A is given by
{ Ae- - ifX>O, A>O0 otherwise (4.3)
and the cdf of f(x) is
F(x) 0 if x < 0(44)1-e - X ifx> 0
Next, a random number r is generated and F(x) = r is set for solving the x.
This gives
1 - e- AX =r. (4.5)
Rearranging to
e- '\ = 1 - r (4.6)
and taking the natural logarithm of both sides, we have
- Ax = ln(1 - r). (4.7)
Finally, solving for x gives the solution
x = -ln(1 - r). (4.8)
To simplify the computations, we can replace (1 -r) by r in Equation 4.8. Since
r is a random number, (1 - r) will also be a random number. This means that nothing
has changed except the way we are writing the U(0, 1) random number. Thus the
process generator for the exponential distribution will now be
1x = -1 In r. (4.9)A
From Equation 4.9, A =, and =np, then
T1
x = -- lnr (4.10)P
24

TABLE 4.2: SIMULATION RESULTS OF CRC-6 USING EXPONEN-TIAL DISTRIBUTION
Total BERBurst 10- 2 10-3 10-4 10-5 10- 6 10- 7
Length Statistical IMean 3446 1198 15.71 1.184 1.000 1.000
15000 SD 140.7 840.0 69.32 3.392 0.000 0.000Mode(b > 0) 3320 1 1 1 1 1Mode(b > 6) 3320 494 7 7 0 0
Mean 3705 1334 16.77 1.067 1.000 1.00020000 SD 140.7 892.1 72.95 1.618 0.000 0.000
Mode(b > 0) 3667 1 1 1 1 1Mode(b > 6) 3667 1069 7 7 0 0
Mean 3870 1492 18.21 1.083 1.000 1.00025000 SD 140.7 941.5 80.35 1.782 0.004 0.000
Mode(b > 0) 3949 1 1 1 1 1Mode(b > 6) 3949 1150 7 7 7 0
Mean 4246 1760 15.38 1.029 1.000 1.000300000 SD 140.7 1022 79.63 1.235 0.023 0.000
Mode(b > 0) 4334 1 1 1 1 1Mode(b > 6) 4334 2190 7 7 7 7
where p is the BER.
From Equation 4.10, one can simulate the burst error for the exponential distri-
bution. The method of simulation is much like the binomial case except for the burst
error generation. The results of the block burst error for CRC-6 using exponential
distributions are shown in TABLE 4.2 and are depicted in Figure 4.2. It is very
interesting to note that all the simulation results of the exponential distribution are
similar to those of the binomial distribution. The simulation results for the different
CRC codes that are listed in TABLE 2.2 using exponential distribution are shown in
APPENDIX C.
Recall that TABLE 2.1 shows various CRCs and their block lengths for a fixed
length CRC. The detectability (r) should be the ratio of block length and the length
25

(X 110)
L 4L
L
a 3 1e-2(BER)t.
W- - -3... 18 -4
02-I. 108-5
IS -
- --- 7 7--7 7-7 1- -- 7 - ------
is 17 19 21 23 26
Burst Error Length (X less)
Figure 4.2: Distribution of CRC-6 using Exponential Distribution
of checkword. Note that the CRC-9 block length is too large compared with other
CRCs: each bit in CRC-9 checkword must check 1587.67 bits, that is more than ten
times higher than the CRC-12 scheme. This can be seen from the simulation result
that even for a lower bit error rate, the error burst length of CRC-9 is longer than
the CRC-12. For example, the mean burst error length of CRC-9 with BER 10- 5 is
6.488, but the mean burst error length of CRC-12 with BER 10- 4 is 1.706.
It should be noted that the SD of the block burst error length has a maximum
value in the vicinity of BER 10 . 3 for the different burst error lengths and CRC codes
except the CRC-16 (APPENDIX C). This means that the SD will be at a maximum
in the vicinity of 1/(CRC block size) for any CRC codes with the exception of CRC-
16. In fact, this observation can apply to CRC-16, since 1/256 is in the BER 10-2
that is shown in APPENDIX C.
If one examines all the simulation results of both the binomial and exponential
26

cases, the mean block burst error depends only on the BER for a given CRC code.
When the BER is less than 10- 3 , the value of the mean burst length is very small
as compared with the higher BER for any CRC codes. For this reason, the mean
block burst error is independent of the CRC generator polynomial. Hence, when the
burst error length gets longer and BER gets lower, the mean block burst error tends
to approach the pattern of the burst error which the random bit errors generate.
Because the burst error occurs randomly or is positionally independent, the detection
probability is completely dependent on the CRC block size, regardless of the CRC
generator polynomial.
27

V. CONCLUSIONS
As the undetected burst error bit patterns are generated, it can be proven that
the detection probability for any burst error length and each CRC code is always
1 - 1/2'. The mean, SD, F(6), and two types of modes for CRC-n codes are computed
using the probability density function.
The relationship between the mean burst error length and CRC block size with
BER was investigated, and it was found that the mean burst error length is dependent
only on the CRC block size, not on the bit position where the burst error occurs. The
detection probability is completely dependent on the CRC block size, regardless of
the CRC generator polynomial.
The burst errors for different CRC blocks and different types of CRC codes
are simulated through the use of computer simulation within the CRC block size.
The CRC block burst error for CRC-n using binomial and exponential distribution
was evaluated. The simulation results show that the SD of the block burst error
length has a maximum value in the vicinity of BER 10- for the different total burst
error lengths and CRC codes except CRC-16. This means that the SD will be at a
maximum in the vicinity of 1/(CRC block size) for any CRC codes.
Finally, the mean block burst error is independent of the CRC generator poly-
nomial and depends only on the BER for a given CRC code. Hence, when the bu.st
error length gets longer and the BER gets lower, the mean block burst error tends
to approach the pattern of the burst error which the random bit errors generate.
Because the burst error occurs randomly or is positionlly independent, the detection
probability is completely dependent on the CRC block size, regardless of the CRC
generator polynomial.
28

APPENDIX A: UNDETECTED BURSTERROR BIT PATTERNS
The following lists are patterns of the undetected burst error. The leftmost bit
is the most significant bit (MSB) and the rightmost bit is the least significant, bit
(LSB) for each CRC code. In each case the undetected burst error bit pattern is gen-
erated by computer and the burst error length is greater than the degree of generator
polynomial G(x). When the burst error length is smaller than the degree of G(x).
aii\ burst error can be detected by G(x). The source code for the undetected burst
error bit pattern generator is shown in APPENDIX D. 1.
1. CRC-4(CEPT)
G(x) = x4 + x + 1
burst lenth 5 : 10011
burst lenth 6 : 110101
burst lenth 7 : 10 11111
1111001
burst lenth 8 : 11000 111
10001011
10101101
11100001
burst lenth 9 : 101101111
111110111
110111011
29

100100011
110011101
100000101
101001001
111010001
burst lenth 10 : 1 0 0 0 1 1 1 1 1 1
1100001111
1110010111
1010100111
1111011011
1011101011
1001110011
1101000011
1111111101
1011001101
1001010101
1101100101
1000011001
1100101001
1110110001
1010000001
2. CRC-6
G(x) = x 6 + x + 1
burst lenth 7 1 0 0 0 0 1 1
30

burst lenth 8 11000101
burst lenth 9 : 101001111
111001001
burst lenth 10 :1 1 0 1 0 1 0 1 1 1
1001011011
1011011101
1111010001
burst lenth0 10 1 1 1 1 1 1
11101100111
11001101011
10001110311
11011101101
10011110101
10111111001
11111100001
burst lenth 12 : 1 1 0 1 0 0 0 1 1 111
100100101111
101100110111
111100000111
101000111011
111000001011
110000010011
100000100011
101010111101
111010001101
110010010101
31

100010 100101
110110011001
100110101001
101110110001
111110000001
3. CRC-9(DS3)
G(x) = x9 + x4 + 1
burst lenth 0 0 000 1 0 0 0 1
burst lenth 11 1 0 0 1 1 0 0 11
burst lenth 12 1 11 0 0 1 1 1 0 111
101001010101
burst lenth 13 1 1 1 1 0 1 1 1 1 1 11
1011010111011
1101011011101
1001010011001
burst lenth 14 1 1 1 1 1 1 1 1 1 1 1 1 1
10111101100111
11011110101011
10011100100011
11101111001101
10101101000101
11001110001001
10001100000001
burst lenth 15 1 0 1 1 1 0 0 1 1 0 1 1 1 11
32
100110001010111
110110 10 1000 111
101010010011011
1110 10 11000 10 11
100010000010011
110010100000011
101100011111101
111100111101101
100100001110101
110100101100101
101000010111001
111000110101001
100000000110001
110000100100001
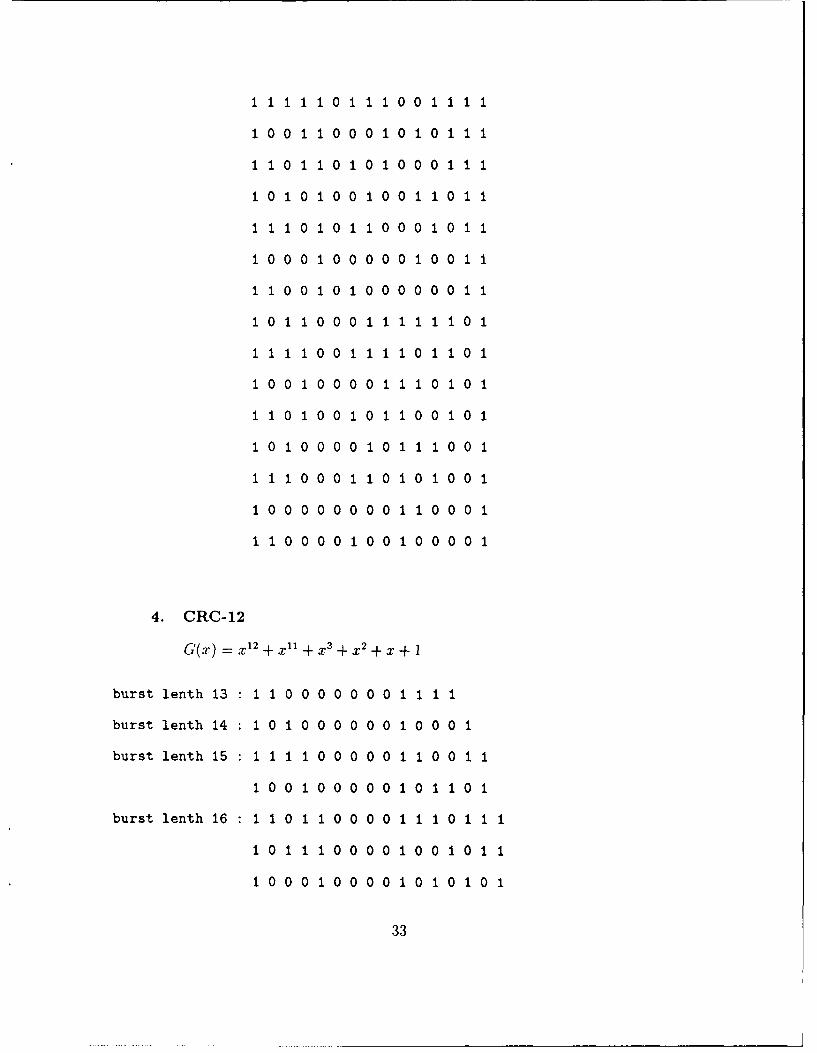
4. CRC-12
G(x) = x12 + x"1 - x3 + x2 + x +- 1
burst lenth 13 1 1100 00 00 01 11 1
burst lenth 14 0 0 0 0 0 0 0 1 0 0 0 1
burst lenth 15 1 1 1 1 0 0 0 0 0 011 0 0 1 1
100 100000 101101
burst lenth 16 1 1 0 1 10 0 0 1 1 1 0 1 1
1011100001001011
1000100001010101
33

1110 100001101001
burst lenth 17 1 1 0 0 1 1 0 0 0 1 1 1 1 1 1 1 1
10101100010000111
10011100010111011
11111100011000011
11100100011011101
10000100010100101
10110100010011001
11010100011100001
burst lenth 18 0 1 0 1 1 0 0 0 1 0 0 0 1 1 11
110001100111101111
111101100110010111
100101100101100111
100011100101011011
111011100110101011
110111100111010011
101111100100100011
101100100100111101
110100100111001101
111000100110110101
100000100101000101
100110100101111001
111110100110001001
110010100111110001
101010100100000001
34

5. CRC-16(CCITT)
G(x) = x'16 + x12 + X5 + 1
burst lenth 17 1 0 0 0 1 0 0 0 0 0 0 1 0 0 0 0 1
burst lenth 18 1 1 0 0 1 1 0 0 0 0 0 1 1 0 0 0 1 1
burst lenth 19 1 1 1 0 1 1 1 0 0 0 0 1 1 1 0 0 1 1 1
1010101000010100101
burst lenth 20 1 1 1 1 1 1 1 1 0 0 0 1 1 1 1 0 1 1 1 1
1011 10 1 1000 10 1 10 10 1 1
11011101000110101101
10011001000100101001
burst lenth 21 1 1 1 1 0 1 1 1 1 0 0 1 1 1 1 1 1 1 1 1 1
101100111001011110111
110101011001101111011
100100011001001110011
111001101001110111101
101000101001010110101
110001001001100 111001
10000000 1001000110001
burst lenth 22 1 1 1 1 0 0 1 1 1 1 0 1 1 1 1 1 0 1 1 1 1 1
1011011111010111001111
1101000111011011010111
1001010111010011000111
1110001011011101011011
1010011011010101001011
1100000011011001010011
35

10000100110 1000 1000011
1111101101011110011101
1011111101010110001101
1101100101011010010101
1001110101010010000101
1110101001011100011001
1010111001010100001001
1100100001011000010001
1000110001010000000001
6. CRC-16(ANSI)
G(x) = x1 6 + x1 5 + x2 + 1
burst lenth 17 1 1 0 00 00 00 00 0 00 1 0 1
burst lenth 18 1 1 0 00 0 0 0 00 00 1 1 1 1
burst lenth 19 : 1 0 0 1 0 0 0 0 0 0 0 0 0 0 1 1 0 1 1
1111000000000010001
burst lenth 20 1 1 1 0 1 0 0 0 0 0 0 0 0 0 1 0 0 1 1 1
10001000000000110011
11011000000000101101
10111000000000111001
burst lenth 21 1 1 0 1 0 1 0 0 0 0 0 0 0 0 01 0 1 1 11 1
101101000000001110111
111001000000001001011
100001000000001100011
101011000000001111101
36

11001100000000 1010101
10011100000000l101001
111111000000001000001
burst lenth 22 1 0 1 0 1 0 1 0 0 0 0 0 0 0 1 1 1 1 1 1 1 1
1100101000000010101111
1001101000000011010111
1111101000000010000111
1101001000000010111011
1011001000000011101011
1110001000000010010011
1000001000000011000011
1001011000000011011101
1111011000000010001101
1010011000000011110101
1100011000000010100101
1110111000000010011001
1000111000000011001001
1101111000000010110001
1011111000000011100001
37
APPENDIX B: SIMULATION RESULTSUSING BINOMIAL DISTRIBUTION
The following tables and figures are the simulation results for each CRC code
using a binomial distribution random number generator. Each CRC code is listed in
TABLE 2.2. Each table and figure shows the relationship between the burst error and
block burst error for each CRC code. The source code for computing the simulation
results is shown in APPENDIX D. 2.
38

TABLE B.1: SIMULATION RESULTS OF CRC-4(2048 BITS) USINGBINOM IAL STRIBUTI N
Total BERBurst 10- 2 10-3 10-4 10-5 10- 6 10- 7
Length StatisticalMean 1572 203.9 1.811 1.006 1.000 1.000
15000 SD 140.7 284.3 7.610 0.271 0.003 0.000Mode(b > 0) 1562 1 1 1 1 1Mode(b > 4) 1562 5 5 5 5 0
Mean 1697 232.2 2.424 1.003 1.000 1.00020000 SD 140.7 311.9 11.93 0.127 0.009 0.001
Mode(b > 0) 1734 1 1 1 1 1Mode(b > 4) 1734 5 5 5 5 0
Mean 1629 213.0 1.741 1.003 1.000 1.00025000 SD 140.7 295.0 7.713 0.173 0.015 0.000
Mode(b > 0) 1633 1 1 1 1 1Mode(b > 4) 1633 5 5 5 5 0
Mean 1745 226.7 1.655 1.001 1.000 1.000300000 SD 140.7 311.6 7.921 0.101 0.003 0.000
Mode(b > 0) 1826 1 1 1 1 1Mode(b > 4) 1826 19 5 5 5 5
39

TABLE B.2: SIMULATION RESULTS OF CRC-9(14280 BITS) USINGBINOMAAL _ ISTRIBUTI N
Total BERBurst 10-2 10-3 10-4 10- 5 10- 6 10-7
Length StatisticalMean 7185 4796 306.2 6.488 1.020 1.000
15000 SD 140.7 1360 664.0 42.98 0.594 0.000Mode(b > 0) 7337 1 1 1 1 1Mode(b > 9) 7337 4385 10 10 10 0
Mean 9693 7094 431.1 4.627 1.117 1.00820000 SD 140.7 1403 853.9 28.75 2.530 0.551
Mode(b > 0) 9837 1 1 1 1 1Mode(b > 9) 9837 6006 10 10 10 10
Mean 12195 9527 660.3 7.822 1.149 1.00025000 SD 140.7 1412 1185 54.73 4.052 0.000
Mode(b > 0) 12337 1 1 1 1 1Mode(b > 9) 12337 7909 10 10 10 10
Mean 13339 10691 696.2 2.832 1.008 1.000300000 SD 140.7 1413 1369 27.58 0.641 0.025
Mode(b > 0) 13428 10975 1 1 1 1Mode(b > 9) 13428 10975 10 10 10 10
40

TABLE B.3: SIMULATION RESULTS OF CRC-12(1880 BITS) USINGBINOMIAL EISTRIBUTIN
Total BERBurst 10-2 10-3 10-4 10- 5 10-6 10-7
Length StatisticalMean 1580 191.7 1.706 1.006 1.000 1.000
15000 SD 140.7 273.9 7.012 0.271 0.006 0.000Mode(b > 0) 1591 1 1 1 1 1
Mode(b > 12) 1591 13 13 13 13 0Mean 1518 168.3 1.886 1.001 1.000 1.000
20000 SD 140.7 250.8 8.391 0.070 0.007 0.003Mode(b > 0) 1530 1 1 1 1 1Mode(b > 12) 1530 13 13 13 13 13
ivlean 1489 166.2 1.516 1.002 1.000 1.00025000 SD 140.7 249.4 5.850 0.125 0.015 0.000
Mode(b > 0) 1523 1 1 1 1 1Mode(b > 12) 1523 13 13 13 13 0
Mean 1577 176.1 1.483 1.001 1.000 1.000300000 SD 140.7 262.6 6.276 0.081 0.002 0.000
Mode(b > 0) 1659 1 1 1 1 1Mode(b > 12) 1659 13 13 13 13 0
41

TABLE B.4: SIMULATION RESULTS OF CRC-16(256 BITS) USINGBIN OMIAL ISTRIBUT N_
Total BERBurst 10-2 10-3 10- 4 10-5 10- 6 10- 7
Length StatisticalMean 42.81 1.169 1.004 1.000 1.000 1.000
15000 SD 46.39 1.596 0.025 0.001 0.000 0.000Mode(b > 0) 1 1 1 1 1 1
Mode(b > 16) 32 17 0 0 0 0Mean 42.58 1.171 1.000 1.000 1.000 1.000
20000 SD 46.27 1.615 0.027 0.000 0.000 0.000Mode(b > 0) 1 1 1 1 1 1
Mode(b > 16) 43 17 0 0 0 0Mean 44.17 1.174 1.000 1.000 1.000 1.000
25000 SD 47.38 1.646 0.021 0.001 0.000 0.000Mode(b > 0) 1 1 1 1 1 1Mode(b > 16) 33 17 0 0 0 0
Mean 44.42 1.155 1.000 1.000 1.000 0.000300000 SD 47.61 1.532 0.021 0.000 0.000 0.000
Mode(b > 0) 1 1 1 1 1 1Mode(b > 16) 60 17 0 0 0 0
42

TABLE B.5: SIMULATION RESULTS OF CRC-16(1024 BITS) USINGBINOMIAL PISTRIBUTI N
Total BERBurst 10- 2 10- 3 10- 4 10- 5 10- 6 10- 7
Length StatisticalMean 700.1 27.08 1.058 1.000 1.000 1.000
15000 SD 139.7 66.95 1.072 0.035 0.001 0.000Mode(b > 0) 721 1 1 1 1 1
Mode(b > 16) 721 17 17 17 17 0Mean 702.8 25.89 1.092 1.000 1.000 1.000
20000 SD 139.8 64.98 1.530 0.017 0.001 0.000Mode(b > 0) 741 ! 1 1 1 1
Mode(b > 16) 741 17 17 17 17 17Mean 706.2 26.22 1.055 1.000 1.000 1.000
25000 SD 139.8 65.76 1.095 0.032 0.002 0.000Mode(b > 0) 739 1 1 1 1 1
Mode(b > 16) 739 17 17 17 17 0Mean 727.7 25.73 1.045 1.000 1.000 1.000
300000 SD 139.9 65.78 1.073 0.013 0.000 0.000Mode(b > 0) 813 1 1 1 1 1
Mode(b > 16) 813 17 17 0 0 0
43

(X is*)
L
Lu 15 1-2(BER)
a. 12 m-* 1g.-4
- 1g-6
* 196-61S5-71
is 17 1921 23 25
Burst Error Length (X lse)
Figure B.1: Distribution of CRC-4(2048 Bits)
(K 15
LL
I9-
69-
3 - 1m-7
is 117 19 21 23 25
Burst Error Length (X lose)
Figure B.2: Distribution of CRC9(14280 Bits)
44

(X 166)
S.0
I 12 - 16-2(BER)
Sl - - 190-3
.. . -4o 0
.4 I -
--------- .......................
Is 17 19 21 2 3 25
Burst Error Length (X loe)
Figure B.3: Distribution of CRC-12(1880 Bits)44
3-
20
0
a
1 17 19 21 23 25
Burst Error Length (X les)
Figure B,4: Distribution of CRC-16(256 Bits)
45
aL 8o* JS*-2(BER)L-
400-
0
6~46

APPENDIX C: SIMULATION RESULTSUSING EXPONENTIAL DISTRIBUTION
The following tables and figures are the simulation results for each CRC code
using a exponential distribution random number generator. Each CRC code is listed
in TABLE 2.2. Each table and figure shows the relationship between the burst er-
ror and block burst error for each CRC code. The source code for computing the
simulation results is shown in APPENDIX D. 3.
47

TABLE C.1: SIMULATION RESULTS OF CRC-4(2048 BITS) USINGEXPO ENTL kL DISTR T N_
Total BERBurst 10-2 10-3 10-4 10- 5 10- 6 10-7
Length StatisticalMean 1578 188.6 1.966 1.011 1.000 1.000
15000 SD 140.7 269.7 8.877 0.421 0.000 0.000Mode(b > 0) 1533 1 1 1 1 1Mode(b > 4) 1533 5 5 5 0 0
Mean 1698 214.2 1.917 1.005 1.000 1.00020000 SD 140.7 296.1 9.235 0.210 0.000 0.001
Mode(b > 0) 1695 1 1 1 1 1Mode(b > 4) 1695 5 5 5 0 0
Mean 1622 207.8 1.898 1.004 1.000 1.00025000 SD 140.7 290.1 8.916 0.019 0.001 0.000
Mode(b > 0) 1645 1 1 1 1 1Mode(b > 4) 1645 5 5 5 5 0
Mean 1743 222.4 1.676 1.001 1.000 1.000300000 SD 140.7 307.6 8.108 0.111 0.003 0.000
Mode(b > 0) 1822 1 1 1 1 1Mode(b > 4) 1822 33 5 5 5 5
48

TABLE C.2: SIMULATION RESULTS OF CRC-9(14280 BITS) USINGEXPOENTI ALDISTRIB flQN
Total BERBurst 10-2 10-3 10-4 10- 5 10- 6 10-7
Length StatisticalMean 7209 4732 286.0 10.10 1.000 1.000
15000 SD 140.7 1354 623.3 66.76 0.000 0.000Mode(b > 0) 7338 1 1 1 1 1Mode(b > 9) 7338 2203 10 10 0 0
Mean 9709 6922 416.4 4.425 1.000 1.00020000 SD 140.7 1400 852.1 30.05 0.000 0.000
Mode(b > 0) 9838 1 1 1 1 1Mode(b > 9) 9838 5194 10 10 0 0
Mean 12211 9494 616.9 8.400 1.014 1.00025000 SD 140.7 1412 1129 52.31 0.446 0.000
Mode(b > 0) 12338 1 1 1 1 1Mode(b > 9) 12338 8151 10 10 10 0
Mean 13334 10644 722.8 3.207 1.007 1.000300000 SD 140.7 1413 1407 32.15 0.546 0.014
Mode(b > 0) 13443 11045 1 1 1 1Mode(b > 9) 13443 11045 10 10 10 10
49

TABLE C.3: SIMULATION RESULTS OF CRC-12(1880 BITS) USINGEXPOET kL DISTRIBUTO
Total BERBurst 10- 1 10- 3 10- 4 10- 5 10- 6 10- 7
Length Statistical
Mean 1573 183.6 1.926 1.007 1.000 1.00015000 SD 140.7 264.5 8.767 0.292 0.000 0.000
Mode(b > 0) 1565 1 1 1 1 1Mode(b > 12) 1565 13 13 13 0 0
Mean 1518 157.1 1.694 1.004 1.000 1.00020000 SD 140.7 239.6 7.268 0.188 0.000 0.000
Mode(b > 0) 1538 1 1 1 1 1Mode(b > 12) 1538 13 13 13 0 0
Mean 1489 163.3 1.671 1.003 1.000 1.00025000 SD 140.7 246.2 7.068 0.140 0.001 0.000
Mode(b > 0) 1502 1 1 1 1 1Mode(b > 12) 1502 13 13 13 13 0
Mean 1578 172.6 1.491 1.001 1.000 1.000300000 SD 140.7 259.0 6.379 0.087 0.002 0.000
Mode(b > 0) 1656 1 1 1 1 1Mode(b > 12) 1656 13 13 13 13 0
50

TABLE C.4: SIMULATION RESULTS OF CRC-16(256 BITS) USINGEXP N1NIJL DISTRIB TON
Total BERBurst 10-2 10- 3 10- 4 10- 5 10- 6 10- 7
Length StatisticalMean 43.60 1.164 1.004 1.000 1.000 1.000
15000 SD 46.96 1.554 0.026 0.001 0.000 0.000Mode(b > 0) 1 1 1 1 1 1
Mode(b > 16) 35 17 0 0 0 0Mean 42.92 1.155 1.000 1.000 1.000 1.000
20000 SD 46.49 1.500 0.025 0.001 0.000 0.000Mode(b > 0) 1 1 1 1 1 1
Mode(b > 16) 39 17 0 0 0 0Meai 43.52 1.155 1.000 1.000 1.000 1.000
25000 SD 46.92 1.508 0.023 0.001 0.000 0.000Mode(b > 0) 1 1 1 1 1 1Mode(b > 16) 45 17 0 0 0 0
Mean 43.86 1.155 1.000 1.000 1.000 0.000300000 SD 47.23 1.530 0.021 0.000 0.000 0.000
Mode(b > 0) 1 1 1 1 1 1Mode(b > 16) 59 17 0 0 0 0
51

TABLE C.5: SIMULATION RESULTS OF CRC-16(1024 BITS) USINGEXPCNENI AL DISTRIB_
Total BERBurst 10-2 10-3 10-4 10-5 10-6 10-7
Length StatisticalMean 701.5 25.32 1.079 1.001 1.000 1.000
15000 SD 139.7 63.42 1.360 0.050 0.001 0.000Mode(b > 0) 1 1 1 1 1 1
Mode(b > 16) 661 17 17 17 0 0Mean 701.2 23.45 1.067 1.000 1.000 1.000
20000 SD 139.7 60.28 1.266 0.024 0.000 0.000Mode(b > 0) 733 1 1 1 1 1
Mode(b > 16) 733 17 17 17 0 0Mean 699.8 24.22 1.065 1.000 1.000 1.000
25000 SD 139.7 61.79 1.234 0.026 0.001 0.000Mode(b > 0) 745 1 1 1 1 1Mode(b > 16) 745 17 17 17 17 0
Mean 725.4 25.18 1.048 1.000 1.000 1.000300000 SD 140.0 64.73 1.110 0.015 0.000 0.000
Mode(b > 0) 812 1 1 1 1 1Mode(b > 16) 812 17 17 11 0 0
52

(X 190)
L - ±6.-2(BER)
a4j 12 I6.-3
.... 6w-4
410-
v0Brt ro
15s-
Legh3 60
Figure- --- --- --1 Ditibto of CR-(2 8 Bits)--- ----
Is 12 s 232
L0
L 12
L
-e-
- 180-7
Is 17 19 21 23 25
Burst Error Length (X lo60)
Figure C.2: Distribution of CRG-9(14280 Bits)
53
(X L0)
L. 16 r - "o .-LL I
la1.2 "- 10.-2'(BER)
"I - - 10a-3
.1 ISe-3S....... 10e-4
U .... 68-5
4 .... 108-7
15 1 10 21 23 25
Burst Error Length (X 10**)
Figure C.3: Dirtribution of CRC-12(1880 Bits)
L SO
ml46 - 10.-2(SER)
I - - leu-3
30....... lSe-4
20
.... 10.-7
o is
15 17 19 21 23 25
Burst Error Length (X 100$)
Figure C.4: Distribution of CRC-16(256 Bits)
54

see l~u-2(SER)
-10w-3
400 .168-4
196-6
206 -- 10u-7
Is 17 19 21 23 25
Burst Error Length (X lo60)
Figure C.5: Distribution of CRC-16(1024 Bits)
... ......

APPENDIX D: PROGRAM LISTS
1. Undetected Burst Error Bit Pattern Generator
* Source : pattern.c *
* Author Yoon, Bee Byung ** Date AUG 19 1990 *
* Update : NOV 24 1990 *
* Description : To find out the undetected burst error bit ** patterns for each CRC codes. *
#include <stdio.h>
int rn[20);int keep[20];int restore[20];int Gx[7] ={1,0,0,0,0,1,1};
maino){int an,i;int L;printf("\nBit Pattern for the undetected burst error (CRC-6)\n");
printf("G(x) = x6 + x + l\n\n");/* for burst error 7 to 10
for burst len 7: generate length S sequence 00000 to 11111
8 6 000000 to 1111119 7 0000000 to 111111110 8 00000000 to 11111111
etc.
for(L=S; L<= 11; L++) {printf("\nburst lenth %d \n", L+2);rn[O= rn[L+1]=1;generate(L, L);
generate(l, L)int 1, L;{
int i;
56

for(i0O; i<=L+l; i++) restore~ilrn[i];
divide CL+2);for~i=O; i<=L+1; i++) rn~ilrestore[i];
rn[1l=O;
for~i=O; i<=L+1; i++) restore[ilrn~i);
divide(L+2);for(i=O; i<=L+l; i++) rn~ilrestore~ij;
return;
rn[l1:1
generate(1-1, L);
rn[13=O;
generate(1-1. L);
divide(burstlen)int burstien;fint i, j, k, current;
for(i0O; i<=burstlen-1; i++) keep~ikrn~i];
/* divide */
for(i=O; i<=burstlen-7;){curreft~i
for(jcurrent; j< current+7; j++) mu] ( rn[j] Gx~j-current])? 0: 1;
while (rn~current++]==0);
i = current -1;
if(current > burstien){
for(i0O; i<=burstlen-1; i++) printf("Yd ",keep[i]);
printfQ"\n");
2. Binomial Distribution
Source :bcrc.c

" Auther Yoon, Hee Byung*" Date OCT 6 1990*" Update OCT 27 1990*" Description To find out the result(mean, mode, SD) for the
* binomial distribution randon number with BER.*
#include <stdio.h>#include <math.h>
#define Ntimes 100#define MAX..BUF 25000#define Bur-.Len 2048#define Blocks 13#define Deg.Gx 4#define SEED 12345
double e;double ber[6] { 0.01, 0.001, 0.0001, 0.00001, 0.000001, 0.0000001};mnt rn[MAX-.BUFJ;
main(argc, argv)mnt argc;char **argv;
fmnt i,j,m,n,k,l;int cntl,cnt2,cnt3;mnt bur-len,new-.len;mnt ie, ntimes,max.buf;int model,mode3;double r,x,xl,y,error;double mean[200J ,meanl,mean2,mean3;double var [2001 ,sd [200) ,sdl,sd2;double mode2 ,mode4;
void randnumo;
for(ie=0; ie<=S; ie++) {e = ber~ie];meani =mean3 =sdl = sd2 = 0.0;
error = e;max-buf = MAX-.BUF;
ntimes =Ntimes;model = mode3 = 0;mode2 = mode4 =0.0;
/* cntl: for detecting 1st bit error positioncnt2: last bit positioncnt3: computing average burst length
for (k=1; k <= Ntimes; k++){randnumo;
cntl =cnt2 =cnt3 = 0;
58

new-len bur..len =0;
mean2 = x= x = y 0.0;
mean~k] = var~k] = sd~k] = 0.0;
for (n1l; n <= Blocks; n++){
cnt2=cnti0O;
if (nu= Blocks){
for (m=(n-l)*BurLen; m <= MAX-.BUF-l; m++){
if Cru~m] 1
cntl;break;}
else cntl++;
I
f or (m=MAX-.BUF-l; m >= (n-l)*Bur-Len; in--){
if (rn~m] ==1){cut 2++;break;}
else cnt2++;
new-.len =MAX..BUF-(n-l)*Bur-.Len - cuti - cnt2 + 2;
else { /* not the last block *f or Cin0; mn <= n*Bur-.Len-1; mn++){
cntl1cnt2=0;if (ru~nm] =1{
break;)
else cntl++;
for (mn*Bur-.Len-l; in >= Bur..Len*(n-l); M--){if (rn[in) ==){cnt2++;break;}
else cut2++;
new-.len = Bur-.Len - cuti - cnt2 + 2;
bur-.len =bur-len +new-.len;cut 3++;
bur-len = bur-len/cnt3;
printfC"\n total bur-len =%d\n",burjlen);
/* Compute mean and standard deviation with burst length *x = Xl = y = 0.0;
59

xl = (bur-len*e*pow(l-e,double)(bur-len-1)))/(l-pow(l-e, (double)bur-len));
for(i=2; i<=bur-len; i++){r = 0.0;
r = ((bur..len+l-i)*pow(e, Cdouble)2)*
pow(l-e, (double) (bur-len-i)))/(l-pow(l-e, (double) bur-len));
x = x(~)
y = y+pov((double)i,Cdouble)2)*r;if (i > Deg-.Gx){
if (mode4 < r){mode4 = r;
mode3 = i
if (mode2 < r){mode2 = r;
model = i
if (mode2 < xl){
mode2 = xl;
model = 1;
mean~k] = x+xl;
meani = meani + mean Ek];mean2 = pow((double) (mean[k)),(double)2);var~k] = (xl~y)-meaxi2;
sd~k) = sqrt(var~k));sdl =sdl +sd[k];,meanl~k] sd~k] var~k] = 0.0;
mean3 = meanl/Ntimes;sd2 = sdl/Ntimes;printf(Q\nTotal CRC Block Size =%d\n,max-.buf);printf('\nBit Error Ratio =%e\n",ber~ie));
printf("\nNew Mean (%d times simulation) = %e\n",ntimes,mean3);
printf('\nlev SD (%/d times simulation) = %e\n",ntimes,sd2);
printf("\nWhen Ber-.Len >= 1~ Mode = %d\n",model);printf("\nWhen Ber..Len >= %d ~>Mode = %d\n",Deg-.Gx,mode3);
void randnum()
int j;float RN,RNl;
60
for (j1l; j<=MAX-BUF-2; j-"){RN =raxido;RN1 =RN/2147483648.O;
if (RNI <= e)rn~j] = 1;
.1lsern~j] = 0;
rn[OJ 1;
rn[MAX-BUF-1J = 1;return;
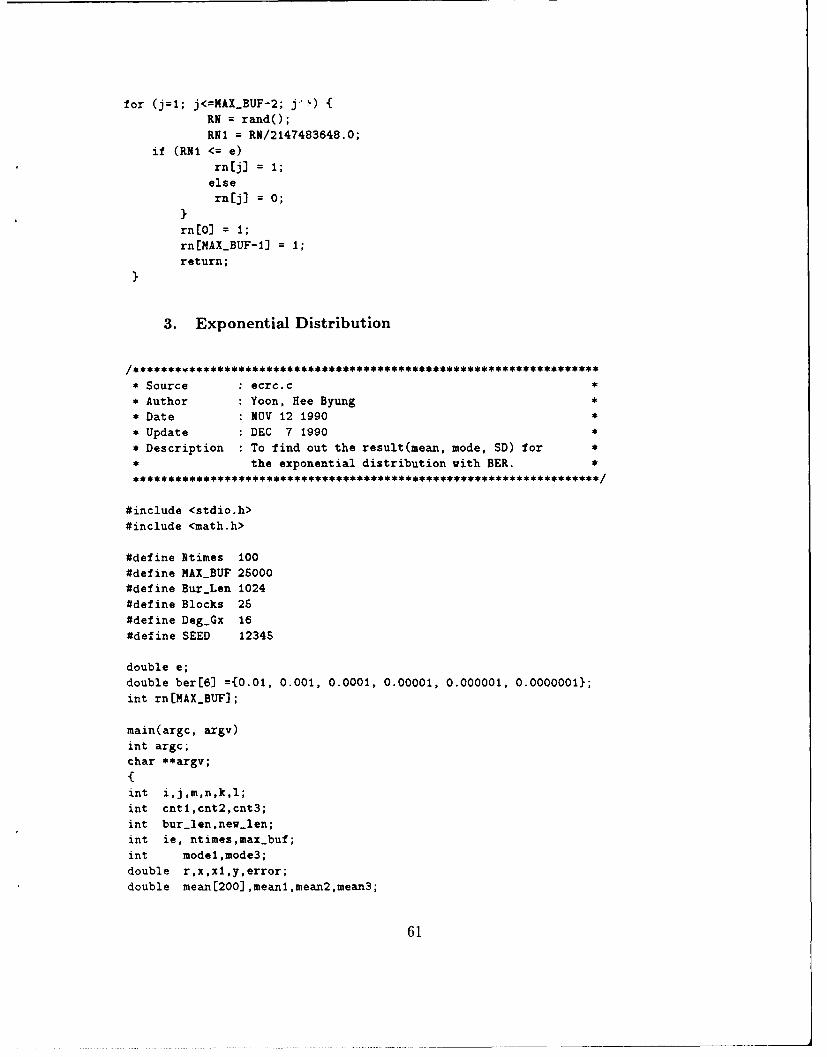
3. Exponential Distribution
Source ecrc.c
Author Yoon, Hee Byuxig
" Date NOV 12 1990*
" Update DEC 7 1990*
" Description To find out the result~mean, mode, SD) for*
* the exponential distribution with BER.
#include <stdio .h>#include (math.h>
#define Rtimes 100#define MAXBUF 25000#define Bur-.Len 1024
#define Blocks 25#define Deg..Gx 16
#define SEED 12345
double e;double ber[6] =(0.01, 0.001, 0.0001, 0.00001, 0.000001, 0.0000001};mnt rn [NAX-.BUF];
main(argc, argv)
int argc;char **argv;
int i,j,m,n,k,l;mnt cntl,cnt2,cnt3;int bur~.len ,new-.len;int ie, ntimes,max-.buf;int model,mode3;double r,x,xI,y,error;
double mean[200) ,meanl,mean2,meai3;
61

double var[200] ,sd[200) ,sdl~sd2;double mode2 ,mode4;
void randnuxno;
for(ie=0; ie<=S; ie++) {e = ber~is];meanl mean3 =sdl = sd2 = 0.0;
error = e;
max-.but = MAX_.BUF;ntimes =Itimes;model = mode3 = 0;mode2 = mode4 = 0.0;
/* cnti: for detecting 1st bit error positioncnt2: last bit positioncnt3: computing average burst length
for (k1l; k <= Ntimes; k++){randnumo;cntl =cnt2 = cnt3 =0;new-len =bur-len = 0;
mean2 =xl =x =y =0.0;mean~k] = var~k] =sd~k] =0.0;
for Cn1l; n <= Blocks; n++){cnt2=cntl=0;
if (n == Blocks) ffor Cm=Cn-l)*Bur-.Len; m <= MAXB.UF-1; m++){
if (rn~m] =1
cntl++;break;}
else cntl++;
I
for (m=MAX.BUF-1; m >= (n-l)*Bur-.Len; mn--){if (rn~m] ==I){cnt2++;break;}
else cnt2++;
new-.len- MAX-.BUF-(n-)*BurLen - cntl - cnt2 + 2;
else { /* not the last block *f or (mO; in <= n*Bur-.Len-1; mn++){
cntlcnt2=0;if (rn~m) )
cntl++;break;}
else cntl++;
62

for (m=n*Bur..Len-l; m >= Buz..Len*Cn-l); mn--){if Crn[m] ==l){
cnt2++;break;}
else cnt2++;
new-len =Bur-Len - cntl - cnt2 + 2;
bur-.len = bur..len +new-len;cnt3++;
I
bur-len =bur-.len/cnt3;printf('\n total bur-.len = d\n,bur-.len);
/* Compute mean and standard deviation with burst length *x= X1 = y = 0.0;
xl =(bur-.len*e*pow(l-e,(double)(bur-len-l)))/
Cl-pow(l-e, Cdouble)bur-len));
for(i=2; i<=bur.len; i++){
r =0.0;
r =(Cbur-.len+l-i)*pow(e, (double)2)*
pow(l-e, Cdouble)(bur-len-i)))/(1-pow(1-e,(double) bur-len));
x = x(~)
y =y+powC(double)i,(double)2)*r;
if Ci > Deg-.Gx){
if (mode4 < r){mode4 =r;mode3 = i
if (mode2 < r){mode2 = r;
model =i
if (mode2 < xl){mode2 = xl;model = 1;
Imean~k] = x+xl;meani = meani + mean Ek);mean2 = pow((double) (mean~k ) ,Cdouble)2);var[k] = (xl+y)-mean2;
sd~k] sqrt~var~k]);sdl sdl +sd~k);
63

inean[k] =sd(kJ = var~k] = 0.0;
mean3 = meanl/Ntimes;sd2 = sdi/Ntimes;printf("\nTotal CRC Block Size = %d~n",max.bul);printfC'\nBit Error Ratio = %e~n",ber~ie));
printfQ"\nNew Mean (%d times simulation) = %e\n",ntimes,mean3);printfC'\nNew SD (%d times simulation) = %e\n",ntimes,sd2);printf('\nWhen Ber-Len >= I Mode = %dn",modei);printf("\nWhen Ber..Len >= %d >Mode = %d\n",Deg-Gx,mode3);
void randnumo(
int i,j,x;float RN,RN1;
for Ci=O; i<=MAX-BUF-1; i++){
rn[i] = 0;
Ifor (j1l; j<=MAX-.BUF-2;){
RN rando;RNI RN/2147483648.0;
x =ceil(-(I.0/e)*(log(RNI)));
j = + Xif (j <= MAX-BUF-2){
rn~j) 1x =0;
else{
break;
rn[0J 1rn[MAX-.BUF-i)11;
return;
64

REFERENCES
1. Jai H. EU, "An Evaluation of Error Performance Estimation Schemes for DS1Transmission Systems Carrying Live Traffic," IEEE Trans. on Communica-tions. Vol. 30, No. 3, pp. 384-391, March 1990
2. "Extended Superframe Format(ESF) Interface Specification," Bell Commun.Res., TR-TSY-000194, Issue 1, December 1987
3. E. N. Gilbert, "Capacity of a Burst-Noise Channel," Bell Syst. Tech. J., Vol.39, PT. 2, pp. 1253-1265, September 1960
4. R. E. Mallon and S. Ravikumar, "Detection of Burst Error Conditions ThroughAnalysis of Performance Information," GLOBECOM Rcc., Vol. 3, pp. 2020-2024, 1987
5. C. B. Schlegel and M. A. Herro, "A Burst-Error-Correcting Viterbi Algorithm,"IEEE Trans. on Communications, Vol. 38, No. 3, pp. 285-291, March 1990
6. E. 0. Elliott, "Estimates of Error Rates for Codes on Burst-Noise Channels,"Bell Syst. Tech. J., pp. 1977-1997, September 1963
7. Andrew S. Tanenbaum, Computer Networks, pp. 204-212, Prentice-Hall, NewJersey, 1988
8. W. Stallings, Data and Computer Communications, pp. 107-112, Macmillan,New York, 1988
9. W. W. Rollins. "Error-Second Measurements as Performance Indicators for Dig-ital Transmission Systems," Telecommunication, pp. 80. 82. 132, September1980
10. K. A. Witzke and C. Leung, "A Comparison of Some Error Detecting CRCCode Standards," IEEE Trans. on Communications, Vol. COM-33, pp. 996-998, September 1985
11. Shu Lin and D. J. Costello, Jr., Error Control Coding Fundamentals and Ap-plications, pp. 111-116, Prentice-Hall, New Jersey, 1983
12. Alberto Leon-Garcia, Probability and Random Processes for Electrical Engineer-ing, pp. 109-131, Addison-Wesley, 1989
13. Averill M. Law and W. David Kelton, Simulation Modeling and Analysis, pp.242-247, McGraw-Hill, New York, 1982
65

INITIAL DISTRIBUTION LIST
No. of Copies
1. Defense Technical Information Center 2Cameron StationAlexandria, VA 22304-6145
2. Library, Code 52 2Naval Postgraduate SchoolMonterey, CA 93943-5002
3. Chairman, Code ECDepartment of Electrical and Computer EngineeringNaval Postgraduate SchoolMonterey, CA 93943-5002
4. Prof. Chyan Yang, Code EC/Ya 2Department of Electrical and Computer EngineeringNaval Postgraduate SchoolMonterey, CA 93943-5002
5. Prof. Tri T. Ha, Code EC/HaDepartment of Electrical and Computer EngineeringNaval Postgraduate SchoolMonterey, CA 93943-5002
6. Dr. Jai H. Eu 2812 Thatcher WayRaleigh, NC 27615
7. Library of the Naval AcedemyAngok dong, Jinhae city, Gyungnam 602-00Republic of Korea
8. Yoon, Hee Byung 432-7 Weulgae 1 dong, Nowon ku, SeoulRepublic of Korea
66