navigating the tides (of data): research and training
TRANSCRIPT

Navigating the Tides (of Data):
Research and Training Opportunities
with the CLSA
Susan Kirkland, PhD, Dalhousie University
Istvan Molnar-Szakacs, PhD, McGill University
Lauren Griffith, PhD, McMaster University
Tim Krahn, MSc, Dalhousie University
CAG Workshop
Moncton, NB
Oct 26, 2019

Navigating the Tides (of Data):
Research and Training Opportunities
with the CLSA
Overview of the CLSA
Susan Kirkland, PhD
Professor and CLSA Co-Investigator
Dalhousie University
CAG Symposium
Moncton, NB
Oct 26, 2019
The Canadian Longitudinal Study on Aging (CLSA)
• Strategic initiative of the Canadian Institutes for Health Research (CIHR); on Canadian research agenda since 2001
• Team of 3 principal investigators, more than 160 co-investigators from 26 institutions
• Aim is to provide infrastructure and build capacity for state-of-the-art, interdisciplinary, population based research and evidenced-based decision making
• Largest study of its kind to date in Canada for breadth and depth

Participants aged 45 to 85
at baseline (51,338)
Active follow-up every 3 years
CLSA Research Platform
2015 –2018
2010 - 2015TIME
20 Years
Baseline FU-1 FU-2 FU-3 FU-4 FU-5 FU-6
50,000 women and men aged 45 - 85 at baseline
TRACKINGTarget: 20,000Actual: 21,241
Randomly selected withinprovinces
COMPREHENSIVETarget: 30,000 Actual: 30,097
Randomly selected within 25-50 km of 11 sites
Questionnaire• By telephone (CATI)
Questionnaire• In person, in home (CAPI)
Clinical/physical testsBlood, urine
@ Data Collection Site

Inclusion Criteria at Recruitment
• Residing in a Canadian province
• Not living on reserve or federal lands
• Not a full time member of the Canadian Armed Forces
• Able to complete interviews in English or French
• Community dwelling
• Cognitively competent

CLSA Participants
in every province
Winnipeg
VancouverVictoriaSurrey
Calgary
Hamilton
Ottawa
MontrealSherbrooke
Halifax
St. John’s
Home Interviews & Data Collection Site Visits
Recruitment & follow-up
Telephone InterviewsRecruitment & follow-up

Participants Consent to
Participate in CLSA
Participants Provide Questionnaire Data
(n=50,000)
Pre-recruits Sent Study Information
Questionnaire data processing
Biological Data Processing-Blood- Urine
n=30,000DATA COLLECTION SITE VISIT
Physical/Neuropsychological Data
Stored at Biorepository and
Bioanalysis Centre
Stored at Statistical
Analysis Centre
TelephoneInterview
Home Interview
Innovative Electronic Data Capture
n=20,000
Data dissemination to researchers

CLSA Questionnaire Modules at Baseline
51,338 participantsD
emo
grap
hic
/Lif
esty
le
• Age
• Gender
• Education
• Marital status
• Sexual orientation
• Language
• Ethnicity
• Wealth/income
• Veteran Identifier
• Smoking, alcohol
• Nutritional risk
• Physical activity
• Health care utilization
• Medication use
• Supplement use
Hea
lth
• General health
• Women’s health
• Chronic conditions
• Disease symptoms
• Sleep
• Oral health
• Injuries, falls
• Mobility
• Pain, discomfort
• Functional status
• ADL, IADL
• Cognition
• Depression
• PTSD
• Life Satisfaction
Soci
al
•Social
•networks
•support
•participation
• inequality
•Online communication
•Care receiving
•Care giving
•Retirement status
•Labour force participation
•Retirement planning
•Transportation
•Mobility, Migration
•Built environments
•Home ownership
8

CLSA Data Collection30,000 visit a Data Collection Site
Cognitive Assessments: Neuropsychological Battery
Memory Executive function Reaction time
Biospecimen Collection: Blood Urine
Physical Assessments: Height, Weight, BMI Bone Density, Body Composition, Aortic Calcification Blood Pressure ECG Carotid Intimal-Medial Thickness Pulmonary Function Vision & Hearing Performance testing

3 Tablespoons of blood =
42 aliquots per participant
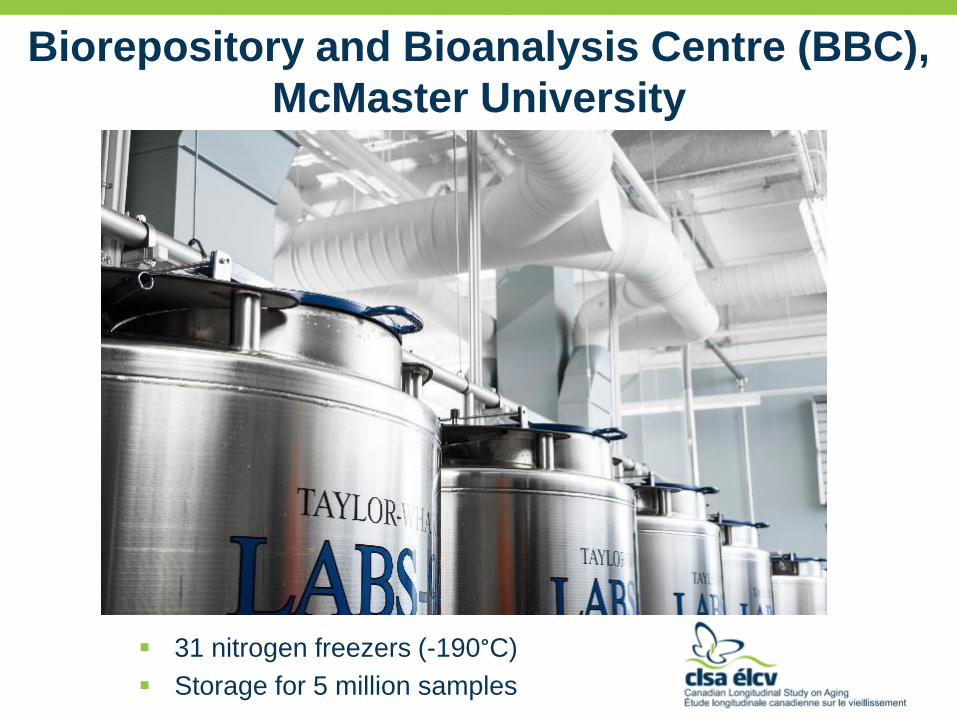
Biorepository and Bioanalysis Centre (BBC),
McMaster University
31 nitrogen freezers (-190°C)
Storage for 5 million samples
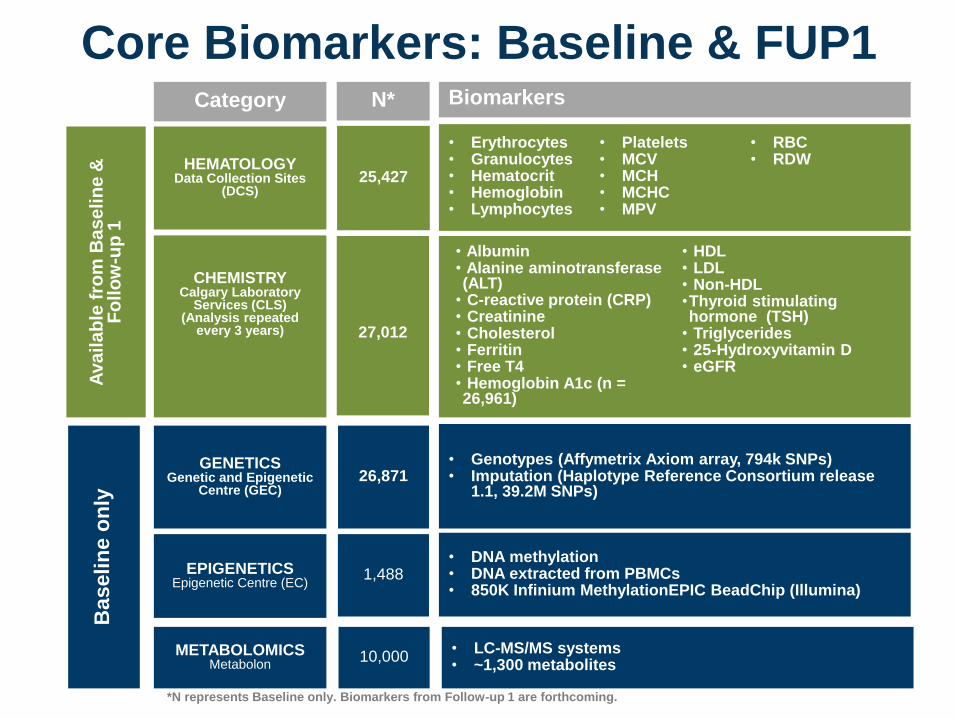
Core Biomarkers: Baseline & FUP1
CHEMISTRYCalgary Laboratory
Services (CLS)(Analysis repeated
every 3 years)
EPIGENETICSEpigenetic Centre (EC)
• Albumin• Alanine aminotransferase (ALT)
• C-reactive protein (CRP)• Creatinine• Cholesterol• Ferritin• Free T4• Hemoglobin A1c (n = 26,961)
• HDL • LDL • Non-HDL•Thyroid stimulating hormone (TSH)
• Triglycerides• 25-Hydroxyvitamin D• eGFR
• DNA methylation • DNA extracted from PBMCs• 850K Infinium MethylationEPIC BeadChip (Illumina)
27,012
GENETICSGenetic and Epigenetic
Centre (GEC)
• Genotypes (Affymetrix Axiom array, 794k SNPs)• Imputation (Haplotype Reference Consortium release
1.1, 39.2M SNPs)26,871
1,488
HEMATOLOGYData Collection Sites
(DCS)
• Erythrocytes• Granulocytes• Hematocrit• Hemoglobin• Lymphocytes
• Platelets• MCV• MCH• MCHC• MPV
• RBC• RDW
25,427
Ava
ila
ble
fro
m B
as
eli
ne
&
Fo
llo
w-u
p 1
Baselin
e o
nly
Category N* Biomarkers
METABOLOMICSMetabolon
10,000• LC-MS/MS systems• ~1,300 metabolites
*N represents Baseline only. Biomarkers from Follow-up 1 are forthcoming.

Linkage with CANUE and Health Canada datasets
Air Quality Nighttime Light Greenness
Weather & ClimateCan-ALE DataSocial & Material
Deprivation Indices

CLSA as a Platform for Research:
Data and Biospecimen Access
Fundamental tenets:
The rights, privacy and consent of
participants must be protected and
respected at all times
The confidentiality and security of data
and biospecimens must be
safeguarded at all times
Available to researchers and trainees at
public institutions
Must have approval from the CLSA
Data Sample and Access Committee,
and an accredited Research Ethics
Board

Istvan Molnar-Szakacs, PhDCLSA Data Access OfficerMcGill University
Navigating the Tides (of Data)
Research & Training
Opportunities with the CLSA:
Data Availability: Data
Preview Portal
Lauren GriffithDept. of Health Research Methods, Evidence and Impact, McMaster University
on behalf of the CLSA Research Team
Navigating the Tides (of Data)
Research & Training
Opportunities with the CLSA:
Data Access: Magnolia

Why do we use sampling weights?
We want to generalize from the sample to the population, but thesample is almost never fully representative. Let’s assume:
Population
50% 50%
Sample
60% 40%

Sample Weights
Sample weights are used to make statisticscomputed from the data more representative ofthe population.
It is a standard practice in surveys to usesampling weights.
Each participant in the study is assigned asample weight constructed based on theinclusion probability.
Sample weights are always positive and non-zero.

N=100
N=100N=18 N=12
Each female in the sample represents
100/18 =5.56
Each male in the sample represents 100/12 =8.33
Respondent in under-represented group gets higher weight; respondent in over-represented group gets lower weight.
SAMPLE WEIGHTS

CLSA Sample
Sample was obtained via four sources:
Canadian Community Health Survey-Healthy Aging (CCHS-HA): only for Tracking
Provincial Health Registries (HR)o HR1-initial Health Registry mail-outso HR2-Health Registry mail-outs targeting low-education
(LowED) areas
Telephone Sampling (TS)o Random Digit Dialing (RDD)-done by Legero Random Telephone Sampling-conducted by CLSA CATI in
targeted LowED areas.
Quebec Longitudinal Study on Nutrition and Aging (NuAge): only for Comprehensive

Strata
10 provinces o 10 provinces in Tracking cohorto 7 provinces in Comprehensive cohort
Age groupso 45-54o 55-64o 65-74o 75-85
Sex Geographic areas
o DCSo Non-DCS
Tracking cohort: 136 Strata
Comprehensive cohort:56 (DCS only) Strata
In QC, ON, and BC, there wasmore than one DCS, so theDCS area consisted of non-contiguous areas.
In provinces with one or moreDCSs there were 16 strata; inNB, PE, SK, there was No DCSand thus there were 8 strata.

Strata
Early analyses showed we under-representation of peoplewith lower SES (education, income)
This under-representation could potentially lead to lowstatistical power
Thus, to increase heterogeneity in SES, we chose to over-sample people from dissemination areas with higher aproportion of people with lower levels of education (based oncensus data)
This adjustment to the sampling added another stratificationvariable: Low-Ed Non Low-Ed

Types of Weights: Inflation Weights
The CLSA Tracking and Comprehensive Cohort inflation weightswere constructedo to account for
• sample mispresentation resulting from unequal samplingprobabilities,
• frame coverage error,• non-response,
o to improve the precision of estimates through the use of auxilaryinformation.
First, basic design weights were computed proportional to thereciprocals of the individual inclusion probabilities; they were thenre-calibrated to the sum of the targeted (eligible) Canadianpopulation.

Types of Weights: Inflation Weights
Re-calibration requires the use of auxiliary information about thepopulation and may take a number of different variables intoaccount.
CLSA used the CCHS-HA sample of 20,087. Sampling weights ofthe 20,087 CCHS-HA participants were grouped by the 136 stratamentioned above. For each sampling frame, the weights werecalibrated within stratum (to stratum totals).
After weights were calibrated for each sample separately, theweights were combined within strata using the general addition ruleof probability.
In some cases the values of weights were extremely large. In asmall number of cases, the weights with highest values weretrimmed, or set equal to second highest values within theirprovinces, and calibration was repeated.

Types of Weights: Analytic Weights
Analytic weights are proportional to the inflationweights but rescaled to sum to the sample sizewithin each province, so that their mean value is1 within each province.

Available Sample Weights in CLSA Data
Inflation Weights WGHTS_TRIMMED_TRM
WGHTS_TRIMMED_COM
WGHTS_TRIMMED_CLSAM
Analytic Weights WGHTS_ANALYTIC_TRM
WGHTS_ANALYTIC_COM
WGHTS_ANALYTIC_CLSAM
Primary Sampling Unit and Sampling Strata Variables
• The use of complex survey software is recommended for analyses, so that the sampling design can be accounted for.
• This will require specification of the appropriate weights variable and characteristics of the sampling design, namely strata and primary sampling units (PSU).

Primary Sampling Unit and Sampling Strata Variables
A stratified sampling design involves dividing the population into mutually exclusive strata, and sample is taken from every stratum. o Within strata, indviduals may be selected directly (single
stage sampling) o Alternatively, the sampling may be done in multiple stages
within geographic strata The samples from the HR and TS fram are effectively single
stage, and we take the CCHS-HA design to be single stage.

Primary Sampling Unit and Sampling Strata Variables
Primary Sampling Unit (PSU) is the first unit that is sampled in the design. In CLSA, PSU is individual, as represented by the unique ‘entity_ID’.
For the strata variable to be specified in complex survey software, we recommend using the geographic strata variables:
o WGHTS_GEOSTRAT_TRM (10 provinces crossed with DCS/non-DCS with LowED/not LowED) for Tracking Cohort
o WGHTS_GEOSTRAT_COM (7 provinces within DCS crossed with LowED/not LowED) for Comprehensive Cohort
o WGHTS_GEOSTRAT_CLSAM (10 provinces crossed with DCS/non-DCS with LowED/not LowED) Pooled Data

When and How to Use the Weights
Inflation weights: For the estimation of a descriptive parameter of the finite study population, the inflation weights should be used.
Analytic weights:
o For analyses that examine relationships between variables at the national or provincial level, analytic weights should be used.
o For analyses of relationships in smaller sub-groups, the analytic weights are likely to be appropriate.
• The weighting variables (sex, age) should be included as covariates in the analyses.

Example 1. Prevalence of Cancer in Canada, Comprehensive cohort – SAS code
SAS code: Estimates prevalence of cancer with 95% CI
proc surveyfreq data=CLSA_comprehensive;tables CCC_CANC_COM/ cl;strata WGHTS_GEOSTRAT_COM;weight WGHTS_TRIMMED_COM;
run;
CCC_CANC_COM
CCC_CANC_COM Frequency
Weighted Std Err of
Percent
Std Err of 95% Confidence Limits
Frequency Wgt Freq Percent for Percent
1: Yes 4637 466027 8093 12.4699 0.2195 12.0398 12.9001
2: No 25367 3271190 15365 87.5301 0.2195 87.0999 87.9602
Total 30004 3737217 13368 100
Frequency Missing = 93
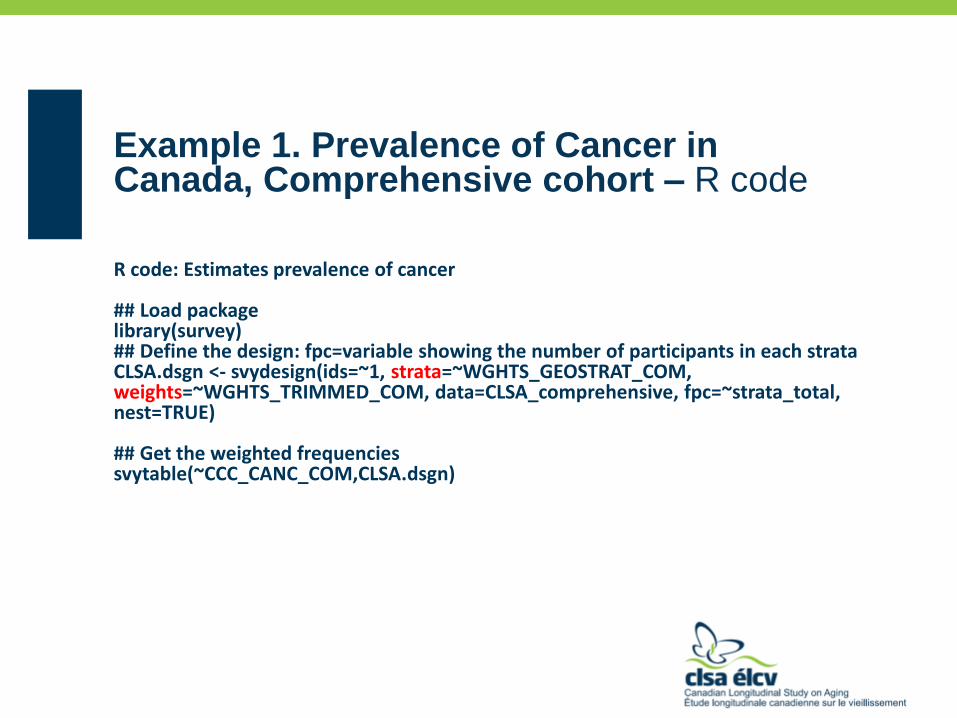
Example 1. Prevalence of Cancer in Canada, Comprehensive cohort – R code
R code: Estimates prevalence of cancer
## Load packagelibrary(survey)## Define the design: fpc=variable showing the number of participants in each strataCLSA.dsgn <- svydesign(ids=~1, strata=~WGHTS_GEOSTRAT_COM, weights=~WGHTS_TRIMMED_COM, data=CLSA_comprehensive, fpc=~strata_total,nest=TRUE)
## Get the weighted frequenciessvytable(~CCC_CANC_COM,CLSA.dsgn)

Example 2. Odds ratios of having fair/poor health in Canada, Comprehensive cohort –SAS code
SAS code: Adjusted model with 95% CI
proc surveylogistic data=CLSA_comprehensive;class DIA_DIAB_COM (ref=first) CCC_CANC_COM (ref=first) AGE_GRP_COM (ref=first) SEX_ASK_COM (ref=first)/param=ref;model GEN_HLTH_COM (event='1')=DIA_DIAB_COM CCC_CANC_COM DEP_CESD10_COM AGE_GRP_COM SEX_ASK_COM/clodds ;strata WGHTS_GEOSTRAT_COM; weight WGHTS_ANALYTIC_COM; run;
Odds Ratio Estimates and t Confidence Intervals
Effect Unit Estimate 95% Confidence Limits
DIA_DIAB_COM Yes vs No 1 0.381 0.301 0.483
CCC_CANC_COM Yes vs No 1 0.598 0.458 0.781
DEP_CESD10_COM 1 0.839 0.826 0.851
AGE_GRP_COM 55-64 vs 45-54 1 0.898 0.68 1.185
AGE_GRP_COM 65-74 vs 45-54 1 0.872 0.645 1.18
AGE_GRP_COM 75+ vs 45-54 1 1.004 0.708 1.424
SEX_ASK_COM M vs F 1 0.771 0.617 0.965

Example 2. Odds ratios of having fair/poor health in Canada, Comprehensive cohort –R code
R code: Adjusted model with 95% CI
## Load packagelibrary(survey)## Define the design: fpc=variable showing the number of participants in each strataCLSA.dsgn <- svydesign(ids=~1,strata=~WGHTS_GEOSTRAT_COM, weights=~WGHTS_ANALYTIC_COM, data=CLSA_comprehensive, fpc=~strata_total,nest=TRUE)
## Get the logistic regression resultssvyglm(GEN_HLTH_COM ~ DIA_DIAB_COM+CCC_CANC_COM+DEP_CESD10_COM+AGE_GRP_COM+SEX_ASK_COM, design=CLSA.dsgn, family=quasibinomial())

Example 3. Weighted mean value of age, Comprehensive cohort – SAS code
SAS code: mean value of age
proc surveymeans data=CLSA_comprehensive ;var AGE_NMBR_COM;weight WGHTS_TRIMMED_COM;strata WGHTS_GEOSTRAT_COM ;run;
Statistics
Variable Label N Mean Std Error of Mean 95% CL for Mean
AGE_NMBR_COM AGE_NMBR_COM 30097 59.49043 0.069189 59.35481 59.62604

Example 3. Weighted mean value of age, Comprehensive cohort – R code
R code: mean value of age
## Load packagelibrary(survey)
## Define the design: fpc=variable showing the number of participants in each strataCLSA.dsgn <- svydesign(ids=~1,strata=~WGHTS_GEOSTRAT_COM, weights=~WGHTS_TRIMMED_COM, data=CLSA_comprehensive, fpc=~strata_total,nest=TRUE)
## Get the means values of agesvymean(~AGE_NMBR_COM, CLSA.dsgn )
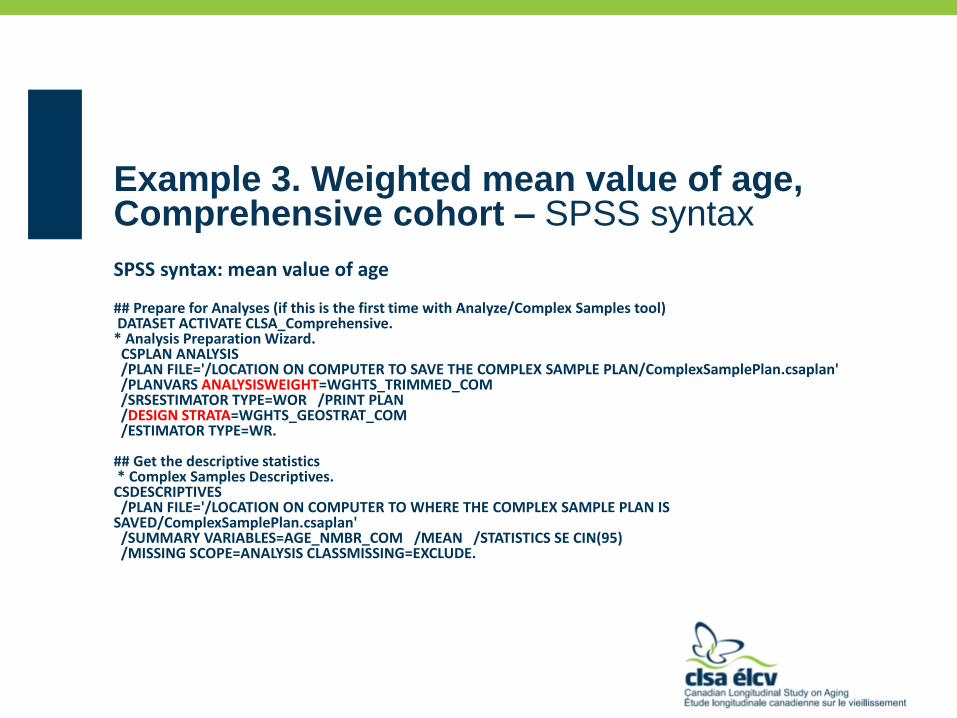
Example 3. Weighted mean value of age, Comprehensive cohort – SPSS syntax
SPSS syntax: mean value of age
## Prepare for Analyses (if this is the first time with Analyze/Complex Samples tool)DATASET ACTIVATE CLSA_Comprehensive.
* Analysis Preparation Wizard. CSPLAN ANALYSIS /PLAN FILE='/LOCATION ON COMPUTER TO SAVE THE COMPLEX SAMPLE PLAN/ComplexSamplePlan.csaplan' /PLANVARS ANALYSISWEIGHT=WGHTS_TRIMMED_COM /SRSESTIMATOR TYPE=WOR /PRINT PLAN /DESIGN STRATA=WGHTS_GEOSTRAT_COM /ESTIMATOR TYPE=WR.
## Get the descriptive statistics* Complex Samples Descriptives.
CSDESCRIPTIVES /PLAN FILE='/LOCATION ON COMPUTER TO WHERE THE COMPLEX SAMPLE PLAN IS
SAVED/ComplexSamplePlan.csaplan'/SUMMARY VARIABLES=AGE_NMBR_COM /MEAN /STATISTICS SE CIN(95) /MISSING SCOPE=ANALYSIS CLASSMISSING=EXCLUDE.
What’s Next
Examining other references (census) to calibrate weights to make them more accurate
Creating longitudinal weights

Acknowledgement
Dr. Mary Thompson, Dr. Changbao Wu, Dr. Harry Shannon (Development of CLSA weights)
Nazmul Sohel, Urun Erbas Oz, Hon Yiu (Henry) So (CLSAStatisticians)

Istvan Molnar-Szakacs, PhD
CLSA Data Access Officer
McGill University
Navigating the Tides (of Data)
Research & Training
Opportunities with the CLSA:
Data Access: Magnolia

Timothy Krahn
CLSA Training Co-Ordinator
Dalhousie Dept. of Community Health
& Epidemiology
Navigating the Tides (of Data)
Research & Training
Opportunities with the CLSA:
Data Access: Magnolia
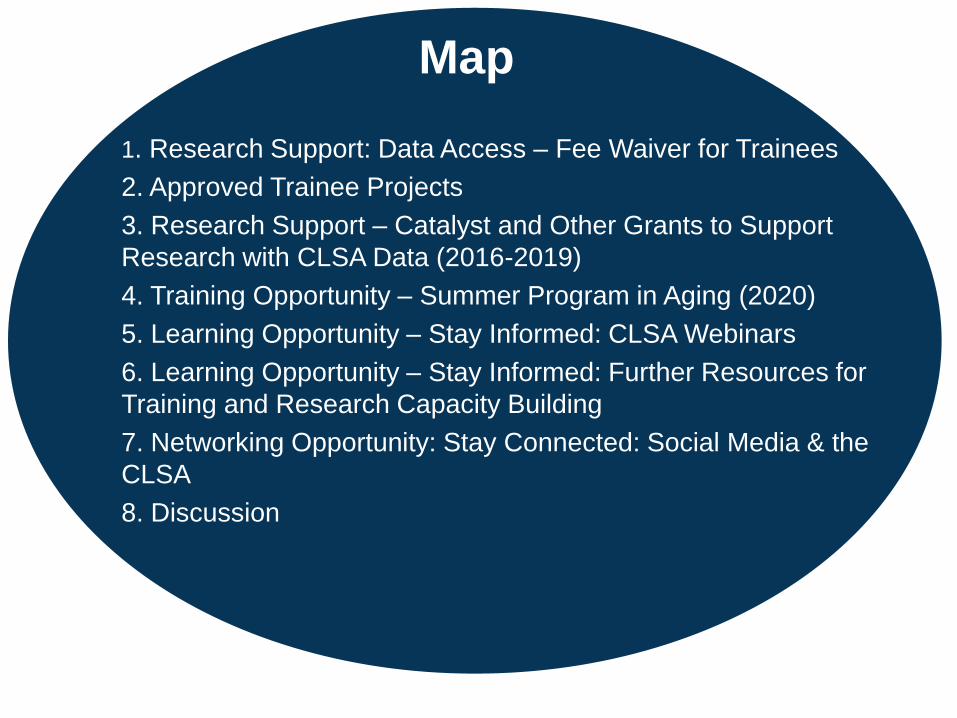
1. Research Support: Data Access – Fee Waiver for Trainees
2. Approved Trainee Projects
3. Research Support – Catalyst and Other Grants to Support
Research with CLSA Data (2016-2019)
4. Training Opportunity – Summer Program in Aging (2020)
5. Learning Opportunity – Stay Informed: CLSA Webinars
6. Learning Opportunity – Stay Informed: Further Resources for
Training and Research Capacity Building
7. Networking Opportunity: Stay Connected: Social Media & the
CLSA
8. Discussion
Map

Data AccessFees
This is our current fee schedule, which is under revision. Please check the CLSA website for updates. Any changes would also be communicated via our newsletter, CLSA Update.
The charge for an approved application is $3000 for researchers based in Canada, and $5000 for researchers based in institutions outside of Canada. Additional fees of $1000 apply for access to image files, raw data, and data sets that require more complex customization.
The CLSA charges researchers fees using a partial cost-recovery model. The fees incorporated partial recovery of administrative costs, data processing, data retrieval, and delivery costs incurred by the CLSA as part of the data and biospecimen access process.
1.1
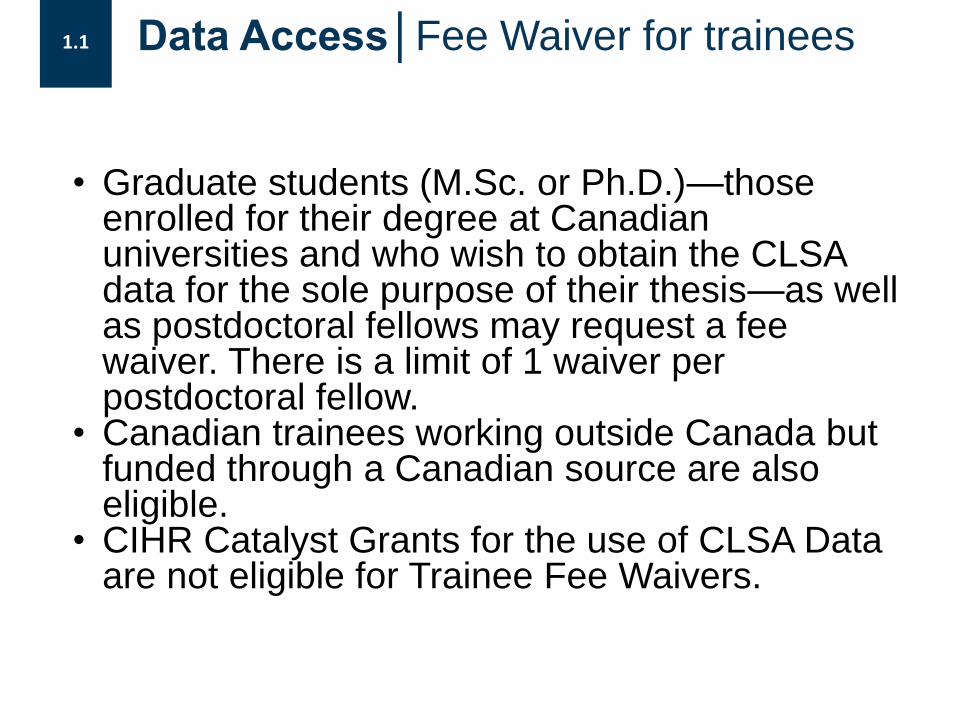
1.1 Data AccessFee Waiver for trainees
• Graduate students (M.Sc. or Ph.D.)—those enrolled for their degree at Canadian universities and who wish to obtain the CLSA data for the sole purpose of their thesis—as well as postdoctoral fellows may request a fee waiver. There is a limit of 1 waiver per postdoctoral fellow.
• Canadian trainees working outside Canada but funded through a Canadian source are also eligible.
• CIHR Catalyst Grants for the use of CLSA Data are not eligible for Trainee Fee Waivers.

2.0 ResearchersApproved Project Summaries
As of September 2019, of the projects approved for use of CLSA data, 78 of 228 (34.2%) were for trainees conducting research.Here are some examples found under the “Researchers” tab, and “Approved Project Summaries” drop-down menu

2.1 Examples of Approved Trainee Projects
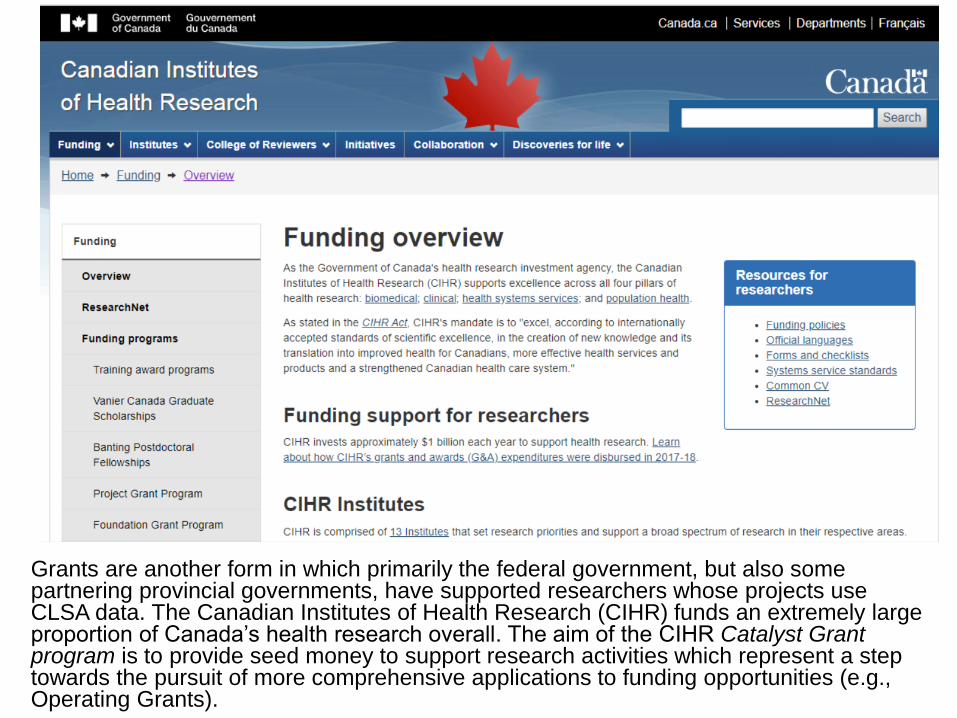
Grants are another form in which primarily the federal government, but also some partnering provincial governments, have supported researchers whose projects use CLSA data. The Canadian Institutes of Health Research (CIHR) funds an extremely large proportion of Canada’s health research overall. The aim of the CIHR Catalyst Grant program is to provide seed money to support research activities which represent a step towards the pursuit of more comprehensive applications to funding opportunities (e.g., Operating Grants).

Stay InformedTraining Opportunities
Let’s look at how the Catalyst program has supported research with CLSA data
3.0

3.1
News of the 2016 granting competition
Stay InformedPast Training Opportunities Announcements
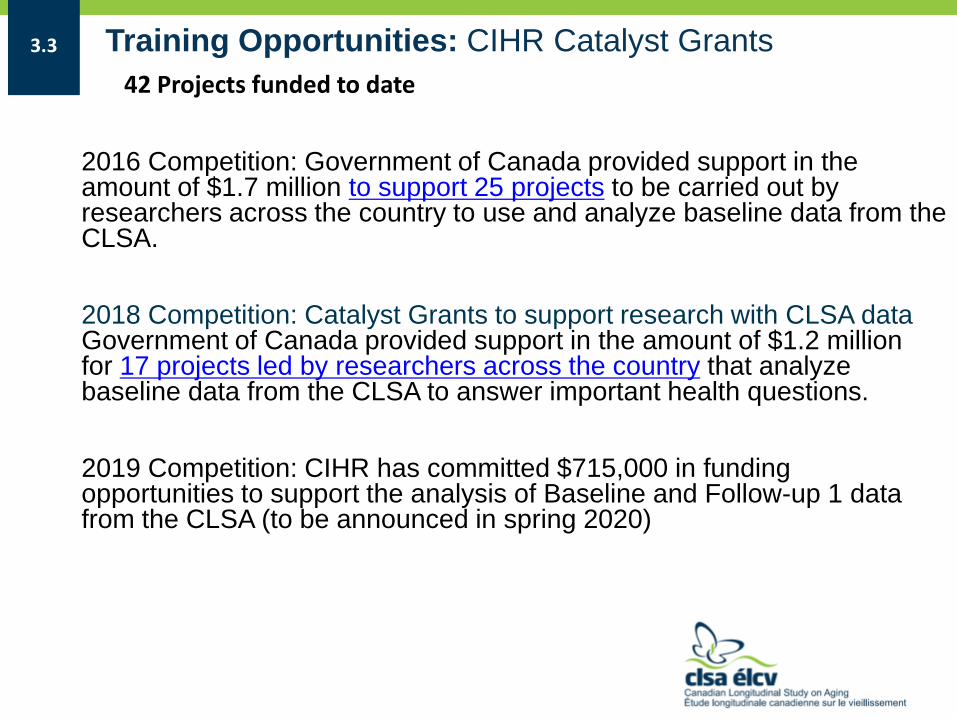
2016 Competition: Government of Canada provided support in the amount of $1.7 million to support 25 projects to be carried out by researchers across the country to use and analyze baseline data from the CLSA.
2018 Competition: Catalyst Grants to support research with CLSA dataGovernment of Canada provided support in the amount of $1.2 million for 17 projects led by researchers across the country that analyze baseline data from the CLSA to answer important health questions.
2019 Competition: CIHR has committed $715,000 in funding opportunities to support the analysis of Baseline and Follow-up 1 data from the CLSA (to be announced in spring 2020)
3.3 Training Opportunities: CIHR Catalyst Grants
42 Projects funded to date

July 29, 2019: CIHR announced up to $1,975,000 in funding opportunities to support research that uses existing cohort data, administrative datasets and data platforms that link to or allow access to datasets from multiple sources, including the CLSA.
As such, the CIHR Data Analysis Using Existing Databases and Cohorts funding opportunity is providing a one-year operating grant for successful applicants within three streams of research:• Cancer prevention and control (10 grants up to $100,000 each)• Healthy cities intervention research (7 grants up to $75,000
each)• Reproductive, maternal, child and youth health (6 grants up to
$75,000)
Researchers applied through ResearchNet. Application deadline was Oct 10, 2019, with funding expected to begin
March 2020.
Training Opportunities 2019 Grants to support research with cohort data
3.5

Summer Program in Aging: Interactive Training Opportunity
CIHR in partnership with Dr. Parminder Raina,
CLSA Lead PI: Summer Program in Aging
• 5-day program• Hockley Valley resort in Mono,
ON (1hr North of TO)• 7-12 June 2020• focussed on longitudinal
studies in aging (generally)• up to 40 spots• apply to CIHR through
Research.net• application launch: January
2020• travel support grants• hospitality supports
provided
• “…provid[ing] graduate students and post-doctoral fellows interested inlongitudinal studies in aging an advanced training program that crossesdisciplines, institutions and geographical boundaries. …Trainees who areconducting, or who have an interest in learning about research in the area oflongitudinal studies on aging are encouraged to apply to this program.”
4.0

5.0 Learning Opportunity for Trainees
The CLSA webinar series features online lectures from new, mid-career, and established health researchers who are interested in aging.

5.1
All webinars are recorded & posted for
viewing.
Stay InformedCLSA Webinar Videos – Sign up

6.0
Stay InformedNew at the CLSA
Read News and keep up to date with the accomplishment of the CLSA. Learn about upcoming webinars, public events, as well as …

6.1 Stay Informed Further resources for training and research
Learn more about the CLSA and the research it’s making possible by consulting:
• Publications
• Presentations
• Videos

6.2
Stay InformedTrainee Spotlight story

7.0
Stay ConnectedSocial Media
For the latest updates about CLSA as well as information and news about health and aging in general, follow us on Facebook, Twitter and YouTube.

7.1Canadian Longitudinal Study on Aging
Etude Longitudinale Canadienne Sur Le Vieillissement

7.2
@clsa_elcv

7.3
instagram.com/clsa_elcv

CLSA is funded by the Government of Canada through CIHR and CFI, and provincial governments and universities
Contact:Data inquiries: [email protected] inquiries: [email protected]
8.0

What would you like to see for
training opportunities in the
CLSA?

CLSA Research Team
Operations Committee and Scientific Leads

120M+ investment 2009-2020 from
CLSA Funders and Partners

Transforming Everyday Lifeinto Extraordinary Ideas

CLSA funded by the Government of Canada
through CIHR and CFI, and provincial governments
and universities