navios maritime containers inc. · navios maritime containers inc. (1) based on total fleet...
TRANSCRIPT

Color
Scheme
255,255,255
51,51,153
221,242,250
0,153,153
128,128,128
153,204,0
255,255,255
0,0,0
Navios Maritime Containers Inc.
Navios Maritime Containers Inc.
Q4 2017 Earnings Presentation
January 29, 2018

Color
Scheme
255,255,255
51,51,153
221,242,250
0,153,153
128,128,128
153,204,0
255,255,255
0,0,0
Navios Maritime Containers Inc.
Forward Looking Statements
2
This presentation contains forward-looking statements concerning future events, including future contracted revenues and
rates, EBITDA, future available days, future financial performance of the fleet, timing of vessel deliveries, and Navios
Containers' growth strategy and measures to implement such strategy; including future vessel acquisitions and the ability to
secure or refinance related financing, the further growth of our containership fleet, and entering into further time charters.
Words such as “may,” “expects,” “intends,” “plans,” “believes,” “anticipates,” “hopes,” “estimates,” and variations of such
words and similar expressions are intended to identify forward-looking statements. These forward-looking statements are
based on the information available to, and the expectations and assumptions deemed reasonable by Navios Containers at
the time these statements were made. Although Navios Containers believes that the expectations reflected in such forward-
looking statements are reasonable, no assurance can be given that such expectations will prove to have been correct.
These statements involve known and unknown risks and are based upon a number of assumptions and estimates which are
inherently subject to significant uncertainties and contingencies, many of which are beyond the control of Navios Containers.
Actual results may differ materially from those expressed or implied by such forward-looking statements. Factors that could
cause actual results to differ materially include, but are not limited to, risks relating to the future vessel acquisitions, the
quality of the fleet and the market for the fleet vessels, the uncertainty relating to global trade, including prices of seaborne
commodities and continuing issues related to seaborne volume and ton miles, our continued ability to enter into long-term
time charters, our ability to maximize the use of our vessels, expected demand in the container shipping sector in general,
fluctuations in charter rates for container carrier vessels, the aging of our fleet and resultant increases in operations costs,
the loss of any customer or charter or vessel, the financial condition of our customers, changes in the availability and costs
of funding due to conditions in the bank market, capital markets and other factors, increases in costs and expenses,
including but not limited to: crew wages, insurance, provisions, port expenses, lube oil, bunkers, repairs, maintenance, and
general and administrative expenses, the expected cost of, and our ability to comply with, governmental regulations and
maritime self-regulatory organization standards, as well as standard regulations imposed by our charterers applicable to our
business, general domestic and international political conditions, competitive factors in the market in which Navios
Containers operates, and risks associated with global operations. Navios Containers expressly disclaims any obligations or
undertaking to release publicly any updates or revisions to any forward-looking statements contained herein to reflect any
change in Navios Containers' expectations with respect thereto or any change in events, conditions or circumstances on
which any statement is based. Navios Containers makes no prediction or statement about the performance of its common
stock.

Color
Scheme
255,255,255
51,51,153
221,242,250
0,153,153
128,128,128
153,204,0
255,255,255
0,0,0
Navios Maritime Containers Inc.
Global brand, industry relationships
and reputation
Economies of scale of ~ 200 vessel
fleet owned/managed
Ship management within the public
company – cost center vs profit
center
Track record of value creation
through the cycle
Access to deal flow
Professional management team
Alignment of interests
Fixed OpEx
NMCI Within the Navios Group
Why important for NMCI?
Scale, experience and relationships
3
Navios Maritime
Holdings Inc.
(NYSE: NM) 64 dry bulk vessels: 38 owned, 26 chartered-in
Navios Maritime
Containers Inc.
(N-OTC:NMCI)
21 containerships
Navios Maritime
Partners L.P.
(NYSE: NMM)
38 vessels: 13 Capes, 15
Panamaxes, 3 Ultra-Handymaxes, 7 containerships
Navios South American
Logistics Inc. Port Terminal facilities,
barging & cabotage Special Purpose Vehicles Navios
Europe I & II 24 vessels:
12 containerships, 5 Panamax, 2 Handymax,
5 Product Tankers
Navios Maritime
Midstream Partners L.P.
(NYSE: NAP)
6 VLCCs
Navios Maritime
Acquisition Corporation (NYSE: NNA)
36 vessels - 26 product
tankers, 8 VLCCs, 2 chemical tankers

Color
Scheme
255,255,255
51,51,153
221,242,250
0,153,153
128,128,128
153,204,0
255,255,255
0,0,0
Navios Maritime Containers Inc.
Ownership Structure
37.1% Interest 62.9% Interest
100% Interest
Navios Maritime
Containers Inc.
(OSLO N-OTC: NMCI)
Common Shareholders
Navios Group (33.7% NMM / 3.4% NM)
21 Containerships
4

Color
Scheme
255,255,255
51,51,153
221,242,250
0,153,153
128,128,128
153,204,0
255,255,255
0,0,0
Navios Maritime Containers Inc.
NMCI: Company Highlights
5
Navios Group’s Containership Vehicle – Right of First Refusal for all Containerships
New Growth Vehicle
Focused on the
Containership Sector
New growth vehicle with attractive entry point and clean, low-cost structure
Attractive opportunities to buy containerships toward bottom of the cycle
Access to distressed deals from banks / operators - available only to select
managers
Leverage Existing
Operating Platform
Leverage an established large operating platform
Economies of scale = ~ 5% lower operating expenditures than the industry (1)
Charterers prefer to deal with large, safe and reliable owners
Well Positioned to
Grow in Container
Market Recovery
Sector poised for recovery: trade growth + high scrapping + lack of new orders
Focus on containerships with attractive deployment opportunities in higher
growth trades
Acquisitions provide free cash flow in current market with significant capital
appreciation and yield improvement as market recovers
Strong Sponsor with
Seasoned
Management
Strong & strategic relationships with banks and other key industry players
Management team has average industry experience of 20+ years per person
Demonstrated access of Navios Group to debt and equity capital markets
Long track record of financial reporting, compliance and investor accountability
(1) Drewry Shipping Consultants – Annual Report 2016/2017. Drewry only identifies opex and drydock amortizations, but does not include commercial
management or other costs. Based on the 2016 average for vessel operating costs for containership sizes between 3,000 and 6,000 TEU.

Color
Scheme
255,255,255
51,51,153
221,242,250
0,153,153
128,128,128
153,204,0
255,255,255
0,0,0
Navios Maritime Containers Inc.
Platform to Capitalize on Attractive Containership Opportunities
3 ships from Banks 14 ships from RMT
Note: Contracted EBITDA at the time of acquisition assumes $6,100 Opex for the vessels in the fleet
G&A assumed to be $685 per vessel per day. Based on 360 operating days and 365 cost days.
14 vessels / 57,100 TEU
11 x 4,250 TEU
3 x 3,450 TEU
Avg age: 10 years
Contracted EBITDA ~ $45m
Five vessels on TC with
staggered expirations ending
in Q1 2019
Price: $118.0m
3 vessels / 12,860 TEU
2 x 4,250 TEU
1 x 4,360 TEU
Avg age: 8 years
Price: $31.2m
Attractive Return Profile Through Scrap + Contracted EBITDA, with Significant Potential Upside
Vessels
in F
leet
Co
ntr
acte
d
Cash
Flo
w
4 ships from German Owner
4 vessels / 18,920 TEU
4 x 4,730 TEU
Avg age: 9.5 years
Contracted EBITDA ~ $70m
4 vessels on TC to
CMA/APL through Q2 2020
Price: $96.8m
6
NMCI continues to build critical mass

Color
Scheme
255,255,255
51,51,153
221,242,250
0,153,153
128,128,128
153,204,0
255,255,255
0,0,0
Navios Maritime Containers Inc.
Recent Developments
7
Navios Maritime Containers Inc.
Seven vessels purchased for a total of $128.0 million - All vessels delivered in Q4 2017
$96.8 million acquisition of four 4,730 TEU containerships - average age of 9.5 years
• All vessels chartered out at a net rate of $27,156 per day through Q2 2020
• $70.0 million expected contracted EBITDA ~ 72% of price
$19.75 million acquisition of two 2009-built 4,250 TEU containerships
$11.45 million acquisition of one 2010-built 4,360 TEU containership
$50.0 million equity issuance
Follow-on private placement November 2017 at $5.50 per share issuance price (10% increase compared
to the previous issuance)
$74.0 million debt financing
$50.0 million add-on loan, for acquisition of the four 4,730 TEU vessels
• Interest: L + 3.85%; $5.6 million quarterly amortization; maturing in November 2019
$24.0 million new loan for acquisition of up to four vessels
• $18.0 million already drawn for three vessels
• Interest: L + 3.00%; 7-year profile; maturing in December 2022
Extended maturity of existing $40.0 million and $21.0 million facilities to end of 2019
$121.0 million refinancing of existing $102.7 million facilities
Advanced discussions(1) for a new facility maturing 2023 to refinance existing facilities maturing in Q4
2019
Refinancing is expected to reduce debt service requirements for 2018 by 58%
(1) No assurances can be provided that the Company will successfully refinance these credit facilities

Color
Scheme
255,255,255
51,51,153
221,242,250
0,153,153
128,128,128
153,204,0
255,255,255
0,0,0
Navios Maritime Containers Inc.
$5,069 $8,086
$20,202
2018 Breakeven per open day Current Rates 15 Year Average Rates
Expected Free Cash Flow Generation FY 2018
Cash Flow Analysis 2018E
($ Thousands) Current Rates 15 Year Average Rates
Contracted Revenues 87,344 87,344
Total Expenses (Opex, G&A and debt service) (103,523) (103,523)
Net cash from contracted revenue (16,179) (16,179)
Revenue from open days* 25,811 64,485
Free cash generation 9,632 48,306
Open Days 3,192 3,192
Breakeven per open day $5,069 $5,069
15-year average charter rates are expected to provide $48.3 million Free Cash Flow in 2018
8
Note: Current rate based on Clarksons Platou SIN December 2017 rates of $8,000 per day for 4,250 TEU vessels and $8,500 per day for 3,450 TEU vessels;
15 year average rates; 4,250 TEU $20,759; 3,450 TEU: $17,525 per day. Cash flow generation assumes normal operational performance of current fleet.
Rates shown in above tables are weighted to reflect vessel sizes for open days.
$9.6 million
$48.3 million
60%
150%

Color
Scheme
255,255,255
51,51,153
221,242,250
0,153,153
128,128,128
153,204,0
255,255,255
0,0,0
Navios Maritime Containers Inc.
(1) Based on total fleet lightweight tons of 353,801 and an assumed scrap price @ $500 per lwt (2) Appraised value of 21 vessel fleet as of December 2017
Asset Coverage NMCI Debt
1.47x of facility covered by collateral vessel scrap value
2.8x coverage by collateral vessel value + contracted EBITDA
Strong Asset Coverage
$120.7 $176.9
$336.1
Total Debt Outstanding 12/31/2017 Scrap Value Market Value+ Contracted EBITDA
($ million)
1.47 x 2.8 x
(1) (2)
9
Color
Scheme
255,255,255
51,51,153
221,242,250
0,153,153
128,128,128
153,204,0
255,255,255
0,0,0
Navios Maritime Containers Inc.
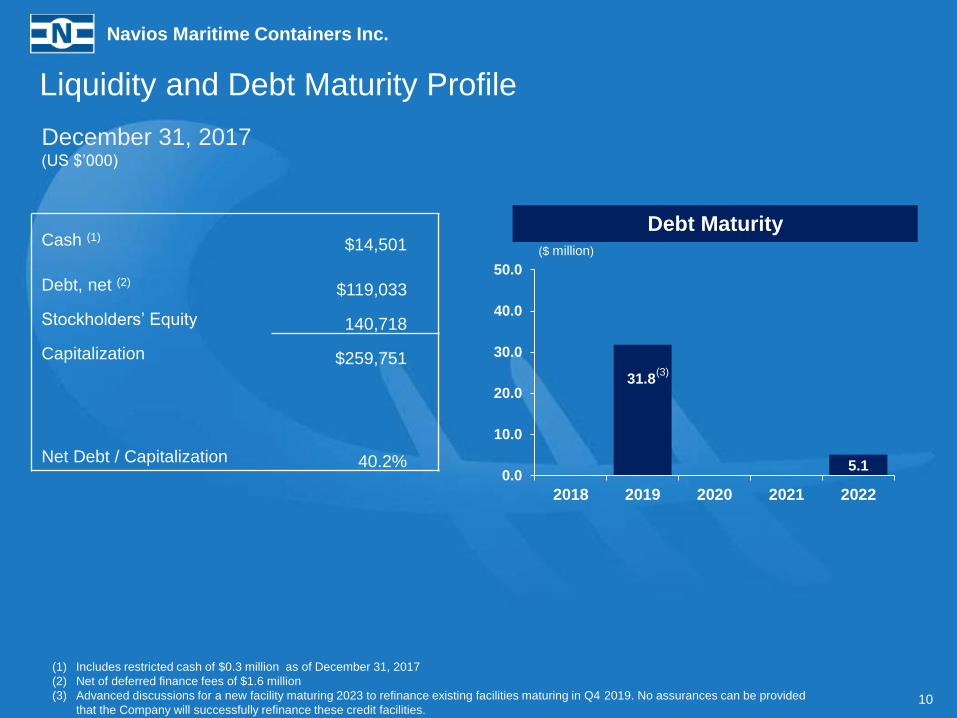
Liquidity and Debt Maturity Profile
December 31, 2017
(US $’000)
Cash (1) $14,501
Debt, net (2) $119,033
Stockholders’ Equity 140,718
Capitalization $259,751
Net Debt / Capitalization 40.2%
Debt Maturity
31.8
5.1 0.0
10.0
20.0
30.0
40.0
50.0
2018 2019 2020 2021 2022
($ million)
10
(1) Includes restricted cash of $0.3 million as of December 31, 2017
(2) Net of deferred finance fees of $1.6 million
(3) Advanced discussions for a new facility maturing 2023 to refinance existing facilities maturing in Q4 2019. No assurances can be provided
that the Company will successfully refinance these credit facilities.
(3)

Color
Scheme
255,255,255
51,51,153
221,242,250
0,153,153
128,128,128
153,204,0
255,255,255
0,0,0
Navios Maritime Containers Inc.
Summary of Containership Fleet
11
21 Vessels (89K TEU) Average age of combined fleet(1): 9.8 years
21 Container Vessels
4 Vessels
4,730 TEU
14 Vessels
4,250 TEU
3 Vessels
3,450 TEU
18,920 TEU 59,610 TEU 10,350 TEU
(1) Navios Containers average age based on a dwt basis

Color
Scheme
255,255,255
51,51,153
221,242,250
0,153,153
128,128,128
153,204,0
255,255,255
0,0,0
Navios Maritime Containers Inc.
58.4%
Fixed days
Open days
Jan-18 Feb-18 Apr-18 Jun-18 Aug-18 Oct-18 Dec-18 Feb-19 Apr-19 Jun-19 Aug-19 Oct-19 Dec-19 Jan-20 Mar-20 May-20 Jul-20
APL Atlanta
APL Denver
APL L.A
APL Oakland
MOL Devotion
MOL Destiny
Navios Spring
Navios Indigo
MOL Delight
MOL Dedication
Navios Amaranth
Navios Lapis
Navios Verano
Navios Amarillo
Navios Felicitas
MOL Dominance
Navios Tempo
Navios Azure
Navios Summer
Navios Vermillion
Navios Verde
$26,850 April 2018
$26,850 July 2018
$26,850 September 2018
$26,850 November 2018
$26,850 February 2019
(1) Daily charter-out rate net of commissions, where applicable. See fleet appendix for further detail.
Fleet and Employment Summary
$8,010 March 2018
12
Charter Coverage FY2018
$7,093 July 2018
$8,006 February 2018
$8,133 October 2018
$8,037 February 2018
$9,144 May 2018
$8,444 November 2018
41.6%
$7,604 June 2018
$7,411 April 2018
$8,106 March 2018
$7,575 May 2018
$7,431 May 2018
$27,156 May 2020
$27,156 April 2020
$27,156 March 2020
$27,156 June 2020
Color
Scheme
255,255,255
51,51,153
221,242,250
0,153,153
128,128,128
153,204,0
255,255,255
0,0,0
Navios Maritime Containers Inc.
13
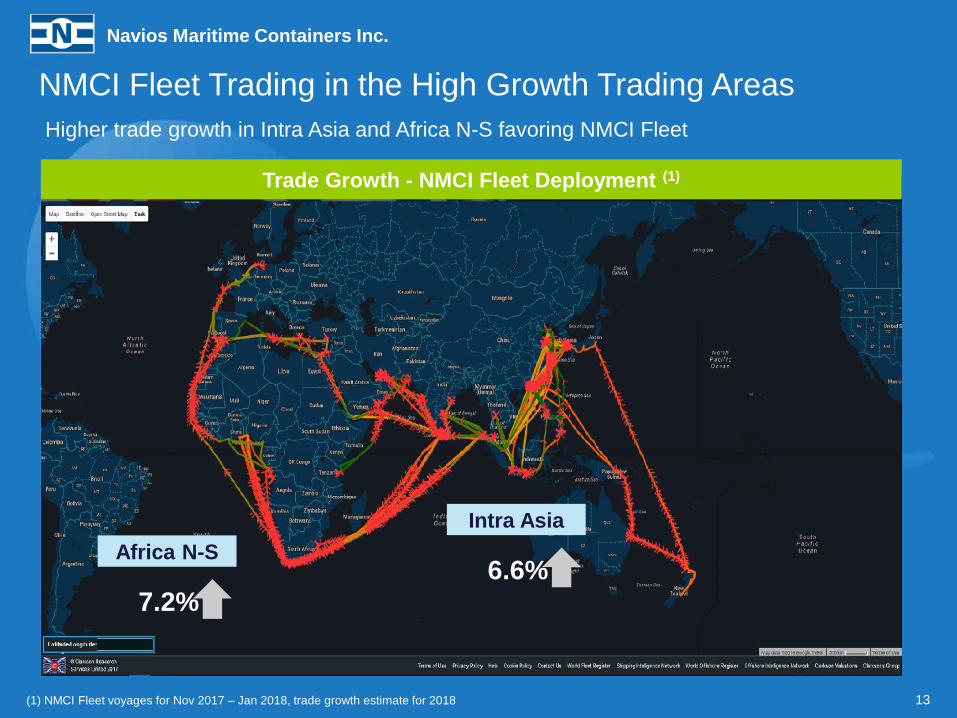
NMCI Fleet Trading in the High Growth Trading Areas
Higher trade growth in Intra Asia and Africa N-S favoring NMCI Fleet
Trade Growth - NMCI Fleet Deployment (1)
Intra Asia
6.6%
(1) NMCI Fleet voyages for Nov 2017 – Jan 2018, trade growth estimate for 2018
Africa N-S
7.2%

Color
Scheme
255,255,255
51,51,153
221,242,250
0,153,153
128,128,128
153,204,0
255,255,255
0,0,0
Navios Maritime Containers Inc.
Navios Holdings generates economies of scale from a ~ 200 vessel diverse
fleet under management.
Economies of Scale
(1) Drewry Shipping Consultants – Annual Report 2016/2017. Drewry only identifies opex and drydock amortizations, but does not include commercial
management or other costs. Based on the 2016 average for vessel operating costs for containership sizes between 3,000 and 6,000 TEU. 14
Navios Holdings agreed to provide Navios Containers the following:
Commercial and Technical Management
10-year agreement
Opex - initial rates ~ 5% below the industry average (1)
• $6,100 per day for 4,250 TEU containerships, fixed for two years
• $6,100 per day for 3,450 TEU containerships, fixed for two years
Administrative Services
Reimbursement of allocated G&A costs
No other fees and expenses
NO additional technical or commercial management fees
NO commissions charged for commercial management
NO commissions or fees charged for any sale or purchase transaction
NO commissions or fees charged for originating any loan or other financing transactions

Color
Scheme
255,255,255
51,51,153
221,242,250
0,153,153
128,128,128
153,204,0
255,255,255
0,0,0
Navios Maritime Containers Inc.
NMCI Q4 2017 Earnings Highlights
15
Earnings Highlights
Figures in $’000, except active vessels,
TCE and available days Three Months Ended
December 31, 2017
Period from April 28, 2017
(date of inception) to
December 31, 2017
Time charter revenue 21,329 39,188
EBITDA 9,917 18,709
Adjusted EBITDA (1) 9,917 19,156 (1)
Net Income 1,673 2,638
Adjusted Net Income (1) 1,673 3,085 (1)
EPS 0.07 0.14
Adjusted EPS (1) 0.07 0.17 (1)
Active Vessels at period end 21 21
Available Days 1,434 2,411
TCE $14,232 $15,730
(1) Adjusted EBITDA, Adjusted Net Income and Adjusted Earnings per Share for the period from April 28, 2017 (date of inception) to
December 31, 2017 exclude $0.4 million relating to the reactivation costs of four laid-up vessels.

Color
Scheme
255,255,255
51,51,153
221,242,250
0,153,153
128,128,128
153,204,0
255,255,255
0,0,0
Navios Maritime Containers Inc.
Balance Sheet
16
Selected Balance Sheet Data (in $’000)
December 31, 2017
Cash & cash equivalents (1) $14,501
Other current assets 6,870
Vessels, net 177,597
Total Assets $266,811
Other current liabilities $7,060
Current portion of long term debt, net 42,499
Long term debt, net of current portion and discount 76,534
Stockholders’ equity 140,718
Total Liabilities & Stockholders’ Equity $266,811
Net Debt / Book Capitalization 40.2%
(1) Includes restricted cash of $0.3 million as of December 31, 2017

Color
Scheme
255,255,255
51,51,153
221,242,250
0,153,153
128,128,128
153,204,0
255,255,255
0,0,0
Navios Maritime Containers Inc.
Industry Overview

Color
Scheme
255,255,255
51,51,153
221,242,250
0,153,153
128,128,128
153,204,0
255,255,255
0,0,0
Navios Maritime Containers Inc.
5.3%
2.2%
4.1%
5.0% 5.0%
-10%
-5%
0%
5%
10%
15%
20%
25%
0
20
40
60
80
100
120
140
160
180
200
220
199
6
199
7
199
8
199
9
200
0
200
1
200
2
200
3
200
4
200
5
200
6
200
7
200
8
200
9
201
0
201
1
201
2
201
3
201
4
201
5
201
6
201
7 (
e)
201
8 (
f)
growth m TEU
Source : Clarkson Research Services, IMF Oct 2017
Trade Growth % World GDP Growth % (RHS)
1996 – 2017 CAGR = 6.9%
World Container Trade 1996-2018
World trade growth
2015 2.2%
2016 4.1%
2017 e 5.0%
2018 F 5.0%
18

Color
Scheme
255,255,255
51,51,153
221,242,250
0,153,153
128,128,128
153,204,0
255,255,255
0,0,0
Navios Maritime Containers Inc.
904
1,147
1,686 1,667
1,070
538
0
200
400
600
800
1,000
1,200
1,400
1,600
1,800
2,000
As of Jan 1, 2017 As of Jan 1, 2018
Orderbook by year of delivery: Actual # vessels delivered: 2014 = 205; 2015 = 213; 2016 = 131; 2017 = 148
‘000 TEU
2016 2017 2018 2017 2018 2019
Before non-delivery
Before non-delivery
Actual non-
delivery
538,000
TEU
Actual
non-
delivery
437,000
TEU
Deliveries
2017 1.15 million TEU delivered; 1.69 million projected (32% non deliveries by TEU); 148 vessels delivered
2016 0.90 million TEU delivered; 1.34 million projected (33% non deliveries by TEU); 131 vessels delivered
2015 1.68 million TEU delivered; 1.89 million projected (11% non deliveries by TEU); 213 vessels delivered
2014 1.49 million TEU delivered; 1.62 million projected ( 8% non deliveries by TEU); 205 vessels delivered
2013 1.35 million TEU delivered; 1.84 million projected (27% non deliveries by TEU); 206 vessels delivered
2012 1.26 million TEU delivered; 1.58 million projected (20% non-deliveries by TEU); 212 vessels delivered
2011 1.21 million TEU delivered; 1.65 million projected (27% non-deliveries by TEU); 193 vessels delivered
2010 1.39 million TEU delivered; 2.24 million projected (38% non-deliveries by TEU); 267 vessels delivered
2018 orderbook = 1.7 million TEU
(before non deliveries)
2018 estimated deliveries:
1.2 million TEU assuming 30%
non delivery rate
0.4 million TEU estimated 2018
scrapping
Expected 2018 Net fleet
growth ~ 3.7%
Containership Sector Orderbook
Source: Clarksons 19

Color
Scheme
255,255,255
51,51,153
221,242,250
0,153,153
128,128,128
153,204,0
255,255,255
0,0,0
Navios Maritime Containers Inc.
1.1%
3.6%
9.7%
0.0%
5.0%
10.0%
15.0%
20.0%
Fleet Age Profile (% TEU)
25+ yrs 20-24 yrs 15-19 yrs
Source: Clarksons; Unless noted, all data in TEU; YTD through 12/31/17
Containership Net Fleet, Age Profile + Historical Scrapping
Demolition
Year Total Demolition (‘000 TEU) % of Fleet 2000 15.5 0.35%
2001 36.2 0.73%
2002 68.1 1.23%
2003 25.7 0.42%
2004 8.0 0.12%
2005 2.3 0.03%
2006 23.8 0.29%
2007 20.9 0.22%
2008 101.2 0.93%
2009 378.4 3.07%
2010 132.6 1.02%
2011 77.9 0.55%
2012 334.7 2.17%
2013 444.2 2.72%
2014 372.6 2.16%
2015 193.3 1.05%
2016 654.4 3.30%
2017 397.9 1.98%
Deliveries Scrapping Net Fleet Growth
Year Actual Projected % Non-
Delivery Year TEU
% of
Fleet Year TEU % of Fleet
Fleet Period
End
2017 1,147 K 1,686 K 32% 2017 398 K 2.0% 2017(1) 747 K 3.7% 20,808 K
2016 906 K 1,341 K 32% 2016 654 K 3.3% 2016 246 K 1.2% 20,061 K
2015 1,658 K 1,889 K 12% 2015 193 K 1.1% 2015 1,460 K 8.0% 19,815 K
2014 1,513 K 1,624 K 7% 2014 373 K 2.2% 2014 1,138 K 6.6% 18,355 K
2013 1,346 K 1,840 K 27% 2013 444 K 2.7% 2013 888 K 5.4% 17,216 K
2012 1,263 K 1,578 K 20% 2012 335 K 2.2% 2012 914 K 5.9% 16,328 K
2011 1,224 K 1,652 K 26% 2011 78 K 0.5% 2011 1,129 K 7.9% 15,414 K
2010 1,381 K 2,242 K 38% 2010 133 K 1.0% 2010 1,232 K 9.4% 14,284 K
0.40 M = 141 Vessels Scrapped in 2017
2017 Net Fleet Growth 0.75 M =
1.15 M Delivered – 0.40 M Scrapped
Total Containership Fleet: 5,164
2018 Deliveries: 12 ships, 119K TEU to 1/18/18
3.00 M TEU
20 (1) Net Fleet Growth YTD reflects deliveries and scrapping through 12/31/17
For the whole fleet that is: 1.15M TEU delivered – 0.40M TEU scrapped

Color
Scheme
255,255,255
51,51,153
221,242,250
0,153,153
128,128,128
153,204,0
255,255,255
0,0,0
Navios Maritime Containers Inc.
Improving Fundamentals 2,000-5,100 TEU Sizes

Color
Scheme
255,255,255
51,51,153
221,242,250
0,153,153
128,128,128
153,204,0
255,255,255
0,0,0
Navios Maritime Containers Inc.
22
Deployment 4,000 – 5,100 TEU Containerships: Depends on Specifications
Pre Panama Canal expansion, main trading route was Far East – US (through old Panama Canal locks)
Post Canal expansion, deployment in Far East – US East Coast declined by 81%: vessels redeployed to
different trades after being replaced by wider and larger vessels
Redeployment limited due to port restrictions in high growth trading areas (Africa and Intra Asia)
~260/270 LOA, Draft 12.5 m, Beam 32m
~290 LOA, Draft 13.5m, Max Beam 32m
Not all Panamaxes Are the Same
Shorter vessels with shallower draft found new
deployment in Africa and Intra Asia where limitations
in port infrastructure eliminate larger and deeper
vessels
Less deployment options for longer and deeper draft
vessels led to increased scrapping and idle capacity
Baby Panamax
Panamax Max
88% of the 4-5,100 TEU vessels scrapped
since 2015 were Panamax Maxes
(94 out of 107 ships) 13
94
0
20
40
60
80
100
Baby panamax Panamax Max
54,465 TEU
430,895 TEU
# of vessels
Vessels Scrapped
Source: Clarksons

Color
Scheme
255,255,255
51,51,153
221,242,250
0,153,153
128,128,128
153,204,0
255,255,255
0,0,0
Navios Maritime Containers Inc.
20
30
40
50
60
70
80
90
96 97 98 99 00 01 02 03 04 05 06 07 08 09 10 11 12 13 14 15 16 17
3.6-3.8K TEU NB, nominal Avg 1996-2017, nominal
3.6-3.8K, infl adj Avg 1996-2017, infl adj
$ M
illi
on
s
0
5
10
15
20
25
30
35
NB 5 10 15 20 25
Scrap value NB parity 3.6-3.8K TEU Discount to NB parity
57%
59%
61%
$ M
illi
on
s
Discount to Newbuild Price Parity
23
Historical NB Price ($mm) Discount to NB Parity
Significant discount to NB parity, even with today`s NB prices around historically low levels
Source: Clarksons Platou Securities AS, Shipping Intelligence Network
Scrap value
Avg. ~$55.6m
Avg. ~$44.4m

Color
Scheme
255,255,255
51,51,153
221,242,250
0,153,153
128,128,128
153,204,0
255,255,255
0,0,0
Navios Maritime Containers Inc.
6%
16%
10%
0% 1% 0%
19%
44%
13%
0%
10%
20%
30%
40%
50%
3% 3%
6%
5%
3%
2% 2%
7%
6%
8%
5%
3%
0%
2%
4%
6%
8%
10% 2017 2016
Strong Value Potential in Sub-Panamax Segment Orderbook-to-Fleet Ratio by Segment Scrapping in % of Fleet by Segment
Baby Panamaxes are versatile and found in numerous main trades
No orderbook
for 4,000-5,099
TEU segment
Source: Clarksons Platou Securities AS, Shipping Intelligence Network, Clarksons Research Services, Alphaliner
New Panama Canal in 2016 led to:
• Wide beam Panamax replacing Old Panamax vessels
• High scrapping incentivized by low TC-rates and high costs due to new
IMO regulations
• Cascading effect from larger modern tonnage, all the way down to
Panamax segment
• Baby Panamaxes have migrated to other trade routes
Domino Effect Through Cascading A Panamax is Not a Panamax Old Panamax vessels:
• Baby Panamax (LOA 260/270, Draft 12.5m, Beam 32m)
• Versatile ships found in numerous trade routes
• Panamax Max (LOA 290, Draft 13.5m, Beam 32m)
• Overpowered and single purpose built
Neo Panamax (wide beam) vessels:
• New Panamax (LOA 360, Draft 15m, Beam 49m)
24

Color
Scheme
255,255,255
51,51,153
221,242,250
0,153,153
128,128,128
153,204,0
255,255,255
0,0,0
Navios Maritime Containers Inc.
2,000 to 5,100 TEU Trade: Intra-Asia Outpaces World
2-5,100 TEU Intra-Asia Deployment
Source: Clarksons Research
0%
1%
2%
3%
4%
5%
6%
7%
8%
0
10
20
30
40
50
60
70
2013 2014 2015 2016 2017e 2018f
Intra-Asia (M TEU LHS) Intra-Asia (% growth RHS)
Global Trade (% growth RHS)
Intra-Asia Trade Growth 2013 to 2018
Intra-Asia trade lane has been one of the fastest growing, outpacing world container trade growth
every year since 2013
Currently accounts for 29% of total container trade
2,000 to 5,100 TEU vessels saw an increase of 89% since 2013 in deployment on the Intra-Asia
trade lane
168
317
0
50
100
150
200
250
300
350
Jan 2013 Jan 2018
# of vessels
89%
25

Color
Scheme
255,255,255
51,51,153
221,242,250
0,153,153
128,128,128
153,204,0
255,255,255
0,0,0
Navios Maritime Containers Inc.
Growing cargo volumes and capacity expansions boosts demand for 4,000 – 5,100 TEU vessels
Line operators in order to increase market share are starting new strings to service their customers
Line operators new services creates demand for additional ~40 vessels
New Services Boost Demand for 4,000 - 5,100 TEU Vessels
Partners Trade Starting date North Europe East Med Cosco, Evergreen, Yang Ming
China Indonesia Cosco
Korea, China South East Asia Cheng Lie, APL
Nov 2017
Dec 2017
China LatAm PIL
Nov 2017
Jan 2018
~40
Vessels China West India WHL, Cosco Jan 2018
China East India WHL, Cosco, IAL, OOCL, SeaCon Jan 2018
China Pakistan APL, OOCL Dec 2017
North Europe USEC Cosco, CMA CGM, Evergreen, OOCL Apr 2018
Source: Alphaliner 26
Color
Scheme
255,255,255
51,51,153
221,242,250
0,153,153
128,128,128
153,204,0
255,255,255
0,0,0
Navios Maritime Containers Inc.
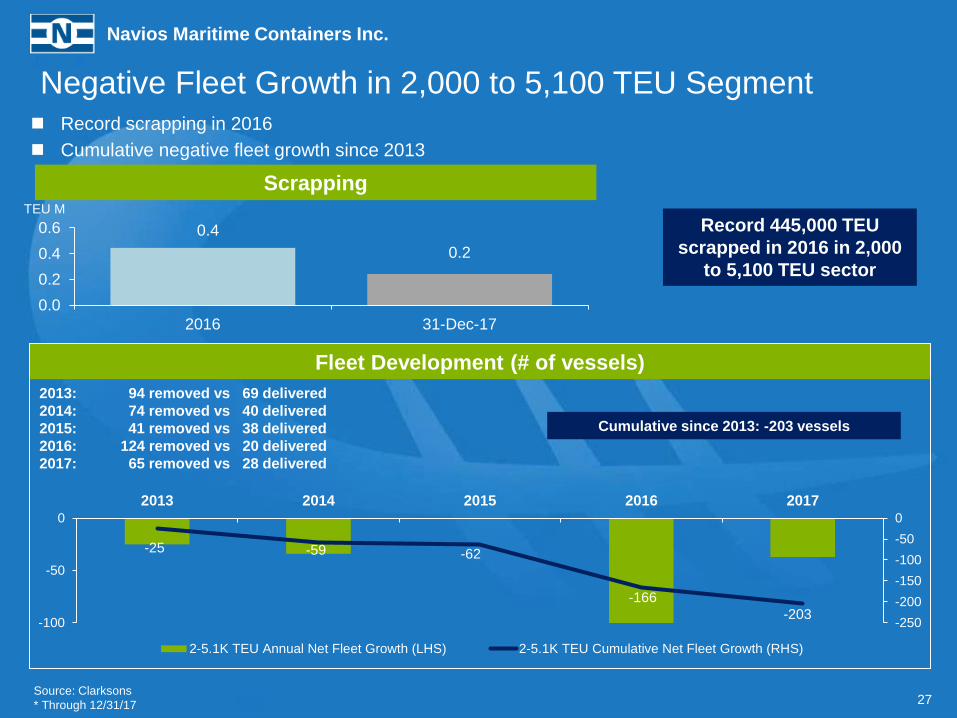
Fleet Development (# of vessels)
2013: 94 removed vs 69 delivered
2014: 74 removed vs 40 delivered
2015: 41 removed vs 38 delivered
2016: 124 removed vs 20 delivered
2017: 65 removed vs 28 delivered
Source: Clarksons
* Through 12/31/17
Negative Fleet Growth in 2,000 to 5,100 TEU Segment
Record 445,000 TEU
scrapped in 2016 in 2,000
to 5,100 TEU sector
27
Record scrapping in 2016
Cumulative negative fleet growth since 2013
0.4
0.2
0.0
0.2
0.4
0.6
2016 31-Dec-17
-25 -59 -62
-166
-203 -250
-200
-150
-100
-50
0
-100
-50
0
2013 2014 2015 2016 2017
2-5.1K TEU Annual Net Fleet Growth (LHS) 2-5.1K TEU Cumulative Net Fleet Growth (RHS)
Cumulative since 2013: -203 vessels
Scrapping TEU M

Color
Scheme
255,255,255
51,51,153
221,242,250
0,153,153
128,128,128
153,204,0
255,255,255
0,0,0
Navios Maritime Containers Inc.
-
100,000
200,000
300,000
400,000
500,000
600,000
Jan 2017 Jan 2018
28
Improving Fundamentals for 2,000 to 5,100 TEU Fleet
Idle Capacity Fleet Deployment Fleet Size
95%
4,200
4,600
5,000
5,400
Jan 2017 Oct 2017 4,000
4,200
4,400
4,600
4,800
5,000
5,200
5,400
5,600
5,800
Jan 2017 Jan 2018
3.1%
6.6%
Negative fleet growth YTD 2017 for 2,000 to 5,100 TEU Segment
‒ Fleet decreased 11.4% since 2013
Increase in Intra-Asia trade lifts deployment
‒ Overall deployment increased by 6.6% since January 2017
Idle capacity decreased by 95% since January 2017
Source: Clarksons
TEU ‘000 TEU ‘000 TEU

Color
Scheme
255,255,255
51,51,153
221,242,250
0,153,153
128,128,128
153,204,0
255,255,255
0,0,0
Navios Maritime Containers Inc.
Appendix

Color
Scheme
255,255,255
51,51,153
221,242,250
0,153,153
128,128,128
153,204,0
255,255,255
0,0,0
Navios Maritime Containers Inc.
Navios Containers Fleet
30 (1) Daily charter-out rate net of commissions, where applicable.
Owned Vessels
Vessel Name TEU Built Expiration Date Charter Rate (1)
Navios Verano 3,450 2006 May-2018 $9,144
Navios Summer 3,450 2006 Mar-2018 $8,010
Navios Spring 3,450 2007 Nov-2018 $8,444
Navios Vermillion 4,250 2007 Feb-2018 $8,037
Navios Indigo 4,250 2007 Oct-2018 $8,133
Navios Amaranth 4,250 2007 Jul-2018 $7,093
Navios Amarillo 4,250 2007 May-2018 $7,575
Navios Verde 4,250 2007 Feb-2018 $8,006
Navios Azure 4,250 2007 Mar-2018 $8,106
MOL Dominance 4,250 2008 Apr-2018 $26,850
MOL Dedication 4,250 2008 Jul-2018 $26,850
MOL Delight 4,250 2008 Sep-2018 $26,850
MOL Destiny 4,250 2009 Nov-2018 $26,850
MOL Devotion 4,250 2009 Feb-2019 $26,850
Navios Lapis 4,250 2009 Jun-2018 $7,604
Navios Tempo 4,250 2009 Apr-2018 $7,411
Navios Felicitas 4,360 2010 May-2018 $7,431
APL Oakland 4,730 2008 Mar-2020 $27,156
APL Los Angeles 4,730 2008 Apr-2020 $27,156
APL Denver 4,730 2008 May-2020 $27,156
APL Atlanta 4,730 2008 June-2020 $27,156
Total – 21 vessels 88,880
Color
Scheme
255,255,255
51,51,153
221,242,250
0,153,153
128,128,128
153,204,0
255,255,255
0,0,0
Navios Maritime Containers Inc.
www.navios-containers.com