navsari, gujarat - pmksydip for navsari: irrigation for agricultural growth 6 | p a g e source of...
TRANSCRIPT

Pradhan Mantri Krishi Sinchayee Yojana (PMKSY)
District Irrigation Plan (2016-2020)NAVSARI, GUJARAT
NAVSARI

Pradhan Mantri Krishi Sinchayee Yojana (PMKSY)
District Irrigation Plan (2016-2020)NAVSARI, GUJARAT
NAVSARI

DIP for NAVSARI: Irrigation for Agricultural Growth
1 | P a g e
Acronyms BCM: Billion Cubic Metre CAD : Command Area Development CCA : Cultural Command Area cm : Centimeter cu m : Cubic Metre CWC : Central Water Commission CUI : Coverage under Irrigation ERM : Extension, Renovation & Modernization Project FF : Flood Forecasting FRL : Full Reservoir Level GIA : Gross Irrigated Area GSA : Gross Sown Area GWH: Giga Watt Hours GWRDC: Gujarat Water Resource Development Corporation GGRC: Gujarat Green Revolution Comapny HFL : Highest Flood Level IPC: Irrigation Potential Created IPU: Irrigation Potential Utilised IWDP : Integrated Watershed Development Project KM : Kilometre KWH : Kilo Watt Hours Lakh Ha : Lakh Hectare M : Metre MCM : Million Cubic Metre mm : Millimetre Mha: Million Hectare MW: Mega Watt NCIWRD: National Commission on Integrated Water Resources Development NIA : Net Irrigated Area NRDWP : National Rural Drinking Water Programme NSA : Net Sown Area PL : Pond Level sq km : Square Kilometre TCA: Total Cultivable Area TMcum : Thousand Million Cubic Metre UIP : Ultimate Irrigation Potential UT : Union Territory
DIP for NAVSARI: Irrigation for Agricultural Growth
2 | P a g e
INDEX
List of Tables .......................................................................................................................... 4
EXECUTIVE SUMMARY ........................................................................................................... 5
INTRODUCTION.................................................................................................................................... 8
1.1 Background ................................................................................................................... 8
1.2 Programme Components of PMKSY ........................................................................ 9
1. Accelerated Irrigation Benefit Programme (AIBP) .................................................................... 9
2. PMKSY (Har Khet ko Pani) .......................................................................................................... 9
3. PMKSY (Per Drop More Crop) ..................................................................................................... 9
4. PMKSY (Watershed Development) ........................................................................................... 10
1.3 Objective of PMKSY ................................................................................................... 10
1.2 Approach and Methodology to prepare DIP ......................................................... 11
1.2.1 The rationale of DIP: ............................................................................................................... 12
1.2.3 Briefly, Approach to prepare the DIP ................................................................................... 13
1.2.4 Vision ........................................................................................................................ 13
1.2.5 Strategy/approach .................................................................................................. 14
1.6 Methodology ............................................................................................................... 14
Chapter 1 General Information of the District ............................................................................ 16
1.1 Brief Description of Irrigation and Agriculture Situation in Gujarat .............. 16
1.4 Unique Agri-Development ........................................................................................................ 18
Micro Irrigation Scheme ................................................................................................ 18
1.5 District Profile ............................................................................................................ 18
1.5.1 History ....................................................................................................................................... 18
1.5.3 Administrative setup of Navsari............................................................................................ 19
1.5.4 Demography ............................................................................................................ 21
1.5.6 Livestock Development ........................................................................................ 24
Livestock Population........................................................................................................................ 24
1.5.8 Production and Availability of livestock products .............................................................. 26
1.5.9 Agro-Ecology, Climate, Hydrology and Topography........................................ 27
1.5.10 Climate and Rainfall ............................................................................................ 28
1.5.11 Temperature & Rainfall ........................................................................................................ 28
1.5.12 Humidity ................................................................................................................................. 30

DIP for NAVSARI: Irrigation for Agricultural Growth
3 | P a g e
1.5.13 Cloudiness& Winds ............................................................................................................... 30
1.5.14 Special Weather Phenomena ............................................................................................... 31
1.5.15 Flora and Fauna ..................................................................................................................... 31
1.7 Soil Profile ................................................................................................................... 31
1.7.1 SOIL HEALTH ......................................................................................................................... 33
1.8 Land Use Pattern ....................................................................................................... 34
Chapter 2 District Water Profile ....................................................................................................... 36
2.1 Area Wise, Crop Wise irrigation Status ................................................................. 36
2.2 Production and Productivity of Major Crops ....................................................... 37
2.3 Irrigation based classification ................................................................................ 40
Chapter 3 Water Availability ........................................................................................................... 43
3.1: Status of Water Availability: Crop season wise sources of irrigation ............. 43
3.2: Status of Ground Water Availability .................................................................... 45
3.3: Status of Command Area: Village wise information of canal command ....... 45
3.4: Existing Type of Irrigation ..................................................................................... 47
Chapter 4 Water Requirement /Demand .................................................................................... 48
4.1: Domestic Water Demand ........................................................................................ 48
4.2 Crop Water Demand ................................................................................................. 48
4.4: Industrial Water Demand ...................................................................................... 51
4.7 Water Budget .............................................................................................................. 53
Chapter 5 Strategic Action Plan for Irrigation in District under PMKSY .................................................. 54
5.1 Strategic Plan for irrigation in PMKSY.................................................................. 54
5.2 Components................................................................................................................ 57
5.3 Anticipated Outputs and outcomes ........................................................................ 57
Output and anticipated impact ...................................................................................... 58

DIP for NAVSARI: Irrigation for Agricultural Growth
4 | P a g e
List of Tables
Table 1.1: Reservoirs & Sources of Irrigation in the state ................................................................... 17 Table 1.2: Geographical area of Talukas ..................................................................................................... 19 Table 1.3: District location .......................................................................................................................... 19 Table 1.4: Taluka details ............................................................................................................................. 21 Table 1.5: Taluka Wise No. of Towns and Villages ...................................................................................... 21 Table 1.6: Demographic Features of the District as per 2011 census ........................................................ 22 Table 1.7: Cattle population across the Talukas (18th Livestock Census) .................................................. 24 Table 1.8: Taluka wise area under Fodder crop .......................................................................................... 26 Table 1.9: Livestock Production .................................................................................................................. 26 Table 1.10: Taluka wise Data on weather parameters ............................................................................... 28 Table 1.11: Taluka wise Max. and Min. temperature ................................................................................. 28 Table 1.12: Taluka wise monthly rainfall data ............................................................................................ 29 Table 1.13: Taluka wise Ground water sources in ha.m (2009) .................................................................. 29 Table 1.14: Taluka wise Humidity ............................................................................................................... 30 Table 1.15: Soil types in Talukas ................................................................................................................. 32 Table 1.16: Taluka wise Land Utilization (preceding 3 years average, area in hectare) ............................. 34 Table 1.17: Land Capability Classification (Area in hectares) ..................................................................... 34 Table 2.1: Area under cultivation under major crops of the district (Year 2010-11) ................................. 38 Table 2.2: Area under cultivation under major crops of the district (Year 2014-15) ................................. 38 Table 2.3: Area Prod of Fruits and Vegetables Crops for the Year 2014-15 ............................................... 38 Table 2.4: Area Prod of Fruits and Vegetables Crops for the Year 2014-15 ............................................... 39 Table 2.5: Area Prod of Fruits and Vegetables Crops for the Year 2014-15 ............................................... 39 Table 2.6: Area Prod of Fruits and Vegetables Crops for the Year 2014-15 ............................................... 40 Table 2.7: Sources of Irrigation in Navsari .................................................................................................. 41 Table 2.8: Area under Irrigation .................................................................................................................. 42 Table 3.1: Source wise Water availability (in mcm) .................................................................................... 43 Table 3.2: Source wise irrigation in Talukas (Latest data) (Area in hectares) ............................................. 44 Table 3.3: Taluka-wise information on drip/sprinkler ................................................................................ 44 Table 3.4: Available of water across crop seasons (in mcm) ...................................................................... 44 Table 3.5: Ground water availability in Talukas .......................................................................................... 45 Table 3.6: Canal command area developed and underdeveloped ............................................................. 46 Table 3.7: Existing Type of irrigation in Talukas .......................................................................................... 47 Table 4.1: Domestic demand for water in Navsari ..................................................................................... 48 Table 4.2: Non-Horticultural Crops demand for water (MCM) .................................................................. 49 Table 4.3: Horticultural Crops demand for water ....................................................................................... 49 Table 4.4: Total Crops demand for water ................................................................................................... 50 Table 4.5: Water demand from livestock ................................................................................................... 51 Table 4.6: Industries in the Talukas ............................................................................................................ 51 Table 4.7: Industrial Water demand in Talukas .......................................................................................... 52 Table 4.8: Water demand from all segments ............................................................................................. 52 Table 4.9: Water budget (Demand-Supply Gap) ......................................................................................... 53 Table 5.1: Final Table presenting Plan outlays proposed across departments .......................................... 54 Table 5.2: Component Wise Plan Estimated cost in Rs. Lakh ..................................................................... 55 Table 5.3: Year Wise Break up of Plan estimate cost in Rs. Lakh ................................................................ 55

DIP for NAVSARI: Irrigation for Agricultural Growth
5 | P a g e
EXECUTIVE SUMMARY
District Irrigation Plan (DIP) is the cornerstone for planning and implementation of
PMKSY. DIPs is prepared to identify the gaps in irrigation infrastructure after taking
into consideration the District Agriculture Plan (DAP) already prepared for Rashtriya
Krishi Vikas Yojana (RKVY). Further, PLP report of Navsari district prepared by
NABARD and district report of Central Ground Water Board have been referred.
Attempts have been made to present holistic irrigation development perspective of the
district Navsari. The DIP has been prepared by integrating three components: water
sources, distribution network and water use applications incorporating all usage of
water like drinking & domestic use, irrigation and industry.
The DIP is prepared with active participation of concerned departments. Following
departments were consulted for the preparation of DIP.
Components under PMKSY Consulted Departments
Har Khet Ko Pani Water Resource Department, GLDC, GWRDC
AIBP WRD
More crop per drop GGRC
Watershed Development GSWMA
Capacity Building ATMA
Forest Development Forest Department
Apart from above, the inputs of Agriculture, Horticulture, District Statistical
departments were also taken into consideration. The prescribed DIP format provided
under PMKSY has been used to compile data from both secondary and primary sources.
Mostly, data from agriculture department and CDAP have served as the basic data
source for agriculture related statistics.
Brief Irrigation related hints on the district
The climate of the district is tropical. In winter, there is much less rainfall than in
summer. This climate is considered to be Aw according to the Köppen-Geiger climate
classification. In Navsari, the average annual temperature is 27.1 °C. The rainfall here
averages 1555 mm.
Out of 147588 hectares of cultivated land, 72462 ha (49.10%) area is under irrigation. The
remaining land i.e. 67637(50.9%) is un-irrigated one (C-DAP, Navsari). Looking to taluka
Navsari has 81.35% irrigated area, followed by Jalalpore(65.00%), Gandevi (60.76%),
Chikhali (38.73%) and Vansdada(21.89%). For Navsari, Jalalpore and Gandevi canal is main

DIP for NAVSARI: Irrigation for Agricultural Growth
6 | P a g e
source of irrigated in Navsari 54% , in Jalalpore 64% and in Gandevi 51% area covered under
canal irrigation. While in Chikhali 77% ara irrigated through open/before well. In Vansdada
taluka 40% area under open/bore well and 38% area under canal irrigation.
Water available in the district mostly sourced from canal and lift irrigation, the grounds
water availability for agriculture is insignificant. Grossly, 767.79 mcm water is available
in the district for growing crops in three crop seasons. During 2014, the district received
1439 mm rainfall. There are benefits of five main rivers in the District – Mindhoda,
Poorna, Kaveri, Kharera and Ambika. Four large and medium irrigation projects -
Kakrapar, Ukai, Jooj and Kelia dams have their Command Areas in the District.
In Navsari district Govt. canal based irrigation is the dominate source contributing
79269 ha. of land. Irrigation from tanks/Ponds/Reservoirs from community ponds
including small is 219 Ha. and from govt. Reservoir/dam is 836 ha.
Water demand in Navsari
Overall demand for water in Navsari district. As per the estimation, total water demand
in Navsari district is 1370.46 MCM. Out of the total demand crop (Agriculture) sector‟s
demand is 1291 MCM (94.24%). in the district the present gap for water demand is
more than the supply by 217.48 MCM.
Plan estimates under PMKSY
A strategic plan for four years has been prepared starting from 2016-17 to 2019-20. The
demand and supply gaps for water demand has been considered to prepare the
generation of additional water supply for fulfilling the objectives of PMKSY. As per plan
estimate under PMKSY, for the district Navsari total fund requirement is: Rs.
318212.74Lakhs (i.e. 3182.13 Crores). With this proposed planned cost under PMKSY an
additional area of 24914 ha. will be irrigated in the district. Of the total planned cost
estimates WRD share is around 95.4%.For Additional area under irrigation the average
cost is around Rs. 2.45 lakh per Ha.
Department wise Plan estimates are as follows:
Department Concerned Ministry Proposed plan
estimate in Rs. Lakh
Additional Area
irrigated in Ha.
Water Resource
Department. GoG*
MoWR, GoI 301310.00 15135
Gujarat State Land
Development
Corporation Ltd
Agriculture & Co-operation 1635.00 3215
GWRDC MoWR, GoI 940.00 268
GSWMA, GoG DoLR, MoRD, GoI 5521.99 2604
GGRC, GoG** MOA & FW-DAC & FW 5932.00 3692
ATMA, GoG Agriculture & Co-operation 630.00 0
Forest Department -- 2243.75 0

DIP for NAVSARI: Irrigation for Agricultural Growth
7 | P a g e
Total 318212.74 24914
Outcome and anticipated impact of PMKSY in Navsari:
Apart from contributing significantly to water and soil conservation, implementation of
PMKSY in Navsari is likely to impact production, productivity, cropping intensity, crop
diversification, enhancement of farmers‟ income, etc. the followings present an
approximate gains from PMKSY implementation in Navsari.
As per 70th NSSO round Key Indicators of Situation of Agricultural Households in
India, Average monthly receipts (Rs.) for crop production per agricultural household for
Gujarat during agricultural year July 2012 – June 2013 was Rs. 5773. Hence, annual
framer‟s household income in the state is Rs. 69276.00. Assuming this state figure as
proxy for the district Navsari, in the post irrigation stage, it is anticipated that
agriculture growth rate will be around 10-11 percent. Hence, the rise in farmer‟s
household income is assumed to grow by10 percent per annum. The average income per
farmer per annum is likely to be Rs. 6900.00. Further, taking an average landholding of
2.2 ha. per farmer, with the irrigation of additional area 24914 ha, around 11324 farmers
will be benefitted. An additional income of Rs. 7.8 crore likely to accrue to the farmers
with the irrigation of 24914 ha. land in the district.
Key Output Direct Anticipated impact
Additional area irrigated- 24914
Ha., Soil Conservation and coastal
area Development
1. Enhanced Agri-productivity of 24914 Ha. by
120% (Estimated from Converting Rain into
Grain: Opportunities for Realizing the Potential
of Rain-fed Agriculture in India, www.iwmi.org
2. Changes in cropping pattern and crop
diversification (Double cropping in an additional
area of 24,914 Ha, thereby increase in cropping
intensity by 150 percent
3. Increase in farmer‟s income for around 11324
farmers from present Rs. 69000 to Rs. 75900 per
annum. Hence total gain in terms of income to be
accrued to framers approximately is Rs. 7.8 Crore
per annum.
3. Around 34 crore man-days will be created after
full implementation of planned activities.

DIP for NAVSARI: Irrigation for Agricultural Growth
8 | P a g e
INTRODUCTION
1.1 Background
Agriculture growth has remained stagnant since a long time and several studies have
pointed out that inadequate irrigation facilities is the most important cause for poor
agricultural growth. Since the inception of third five year Plans concerted efforts have
been made to develop agriculture sector by implementing several schemes to increase
area under irrigation. So far45 percent of total net sown area in the country is irrigated,
balance area for cultivation depends on rainfall. Agriculture dependence on uncertain
rainfall is not only impacting agricultural productivity, but also impeding input use and
investment in agriculture.Increase in area under irrigation not only benefits the farmers,
also helps to increase the employment opportunities and wage rate of the
agriculturallandless labourers, both of which are essential to reduce the poverty among
the landless labour households. Most of the cases Farmers follow flood method of
irrigation, which results in wastage of waterdue to substantial conveyance and
distribution losses. The effective and efficient use of water can also lead to increase in
area under cultivation. Management of water resources holds the key for ensuring
irrigations to 100 percent net sown area.
In this backdrop, Government of India has launched the ambitious scheme Pradhan
Mantri Krishi Sinchayee Yojana (PMKSY)PMKSY by amalgamating ongoing schemes
viz. Accelerated Irrigation Benefit Programme (AIBP) of the Ministry of Water
Resources, River Development & Ganga Rejuvenation (MoWR,RD&GR), Integrated
Watershed Management Programme (IWMP) of Department of Land Resources (DoLR)
and the On Farm Water Management (OFWM) of Department of Agriculture and
Cooperation (DAC).
PMKSY has been approved with an indicative outlay of Rs. 50000 crore over a period of
five years from 2015-16 to 2019-20. The programme is an amalgamation of on-going
schemes of Ministry of Water Resources, River Development and Ganga Rejuvenation,
Ministry of Agriculture & Cooperation and Ministry of Rural Development. The existing
schemes AIBP, CADWM, MI, SWMA, Watershed & Convergence with MGNREGA were
brought together under the umbrella program of PMKSY. Further the scheme seeks
convergence with scheme likeMahatma Gandhi National Rural Employment Guarantee
Scheme (MGNRES), Rashtriya Krishi Vikas Yojana (RKVY), Jawaharlal Nehru National
Solar Mission and Rural Electrification programmes (JLNNSM&REP), Rural
Infrastructure Development Fund (RIDF), Members of Parliament Local Area
Development Scheme (MPLAD), Members of Legislative Assembly Local Area
Development Fund (MLALAD), Local Body Funds (LBF), Working Plan of State Forest
Department (WPSFD) etc. The PMKSY will be implemented in an area development
mode only by adopting a decentralized state level planning and projectised execution
structure that will allow the state to draw up their own irrigation development plans

DIP for NAVSARI: Irrigation for Agricultural Growth
9 | P a g e
based on DIPs and SIPs with a horizon of 5-7 years. The program will be implemented
as part of Rashtriya Krishi Vikas Yojana (RKVY) with state agriculture department
acting as the State Nodal Agency. However, the implementing departments for the four
components like AIBP, PMKSY (Har Khet Ko Pani), PMKSY (Per drop more crop) and
PMKSY (watershed development) will be decided by the respective program
ministry/department.
1.2 Programme Components of PMKSY
1. Accelerated Irrigation Benefit Programme (AIBP)
To focus on faster completion of ongoing Major and Medium Irrigation including
National Projects.
2. PMKSY (Har Khet ko Pani)
This component focuses on-
a) Creation of new water sources through Minor Irrigation (both surface and ground
water)
b) Repair, restoration and renovation of water bodies; strengthening carrying
capacity of traditional water sources, construction rain water harvesting
structures (Jal Sanchay);
c) Command area development, strengthening and creation of distribution network
from source to the farm;
d) Ground water development in the areas where it is abundant, so that sink is
created to store runoff/ flood water during peak rainy season.
e) Improvement in water management and distribution system for water bodies to
take advantage of the available source which is not tapped to its fullest capacity
(deriving benefits from low hanging fruits). At least 10% of the command area to
be covered under micro/precision irrigation.
f) Diversion of water from source of different location where it is plenty to nearby
water scarce areas, lift irrigation from water bodies/rivers at lower elevation to
supplement requirements beyond IWMP and MGNREGS irrespective of
irrigation command.
g) Creating and rejuvenating traditional water storage systems like Khatri, Kuhl etc.
at feasible locations.
3. PMKSY (Per Drop More Crop)
a) Programme management, preparation of State/District Irrigation Plan, approval
of annual action plan, Monitoring etc.
b) Promoting efficient water conveyance and precision water application devices
like drips, sprinklers, pivots, rain-guns in the farm (Jal Sinchan);
c) Topping up of input cost particularly under civil construction beyond permissible
limit (40%), under MGNREGS for activities like lining inlet, outlet, silt traps,
distribution system etc.

DIP for NAVSARI: Irrigation for Agricultural Growth
10 | P a g e
d) Construction of micro irrigation structures to supplement source creation
activities including tube wells and dug wells (in areas where ground water is
available and not under semi critical/ critical/ over exploited category of
development) which are not supported under AIBP, PMKSY (Har Khet Ko Pani),
PMKSY (Watershed) and MGNREGS as per block/district irrigation plan.
e) Secondary storage structures at tail end of canal system to store water when
available in abundance (rainy season) or from perennial sources like streams for
use during dry periods through effective on-farm water management;
f) Water lifting devices like diesel/ electric/ solar pumpsets including water carriage
pipes, underground piping system.
g) Extension activities for promotion of scientific moisture conservation and
agronomic measures including cropping alignment to maximise use of available
water including rainfall and minimise irrigation requirement (Jal Sarankchan);
h) Capacity building, training and awareness campaign including low cost
publications, use of pico projectors and low cost films for encouraging potential
use water source through technological, agronomic and management practices
including community irrigation.
i) The extension workers will be empowered to disseminate relevant technologies
under PMKSY only after requisite training is provided to them especially in the
area of promotion of scientific moisture conservation and agronomic measures,
improved/ innovative distribution system like pipe and box outlet system, etc.
Appropriate Domain Experts will act as Master Trainers.
j) Information Communication Technology (ICT) interventions through NeGP-A to
be made use in the field of water use efficiency, precision irrigation technologies,
on farm water management, crop alignment etc. and also to do intensive
monitoring of the Scheme.
4. PMKSY (Watershed Development)
a) Effective management of runoff water and improved soil & moisture conservation
activities such as ridge area treatment, drainage line treatment, rain water
harvesting, in-situ moisture conservation and other allied activities on watershed
basis.
b) Converging with MGNREGS for creation of water source to full potential in
identified backward rainfed blocks including renovation of traditional water
bodies
1.3 Objective of PMKSY
a) To achieve convergence of investments in irrigation at the field level (preparation
of district level and, if required, sub district level water use plans).
b) To enhance the physical access of water on the farm and expand cultivable area
under assured irrigation (Har Khet Ko Pani),

DIP for NAVSARI: Irrigation for Agricultural Growth
11 | P a g e
c) Integration of water source, distribution and its efficient use, to make best use of
water through appropriate technologies and practices.
d) Improve on-farm water use efficiency to reduce wastage and increase availability
both in duration and extent,
e) Enhance the adoption of precision-irrigation and other water saving technologies
(More crop per drop).
f) Enhance recharge of aquifers and introduce sustainable water conservation
practices
g) Ensure the integrated development of rainfed areas using the watershed
approach towards soil and water conservation, regeneration of ground water,
arresting runoff, providing livelihood options and other NRM activities.
h) Promote extension activities relating to water harvesting, water management and
crop alignment for farmers and grass root level field functionaries.
i) Explore the feasibility of reusing treated municipal waste water for peri-urban
agriculture, and
j) Attract greater private investments in irrigation.
The financial assistance provided to the state governments from this centrally sponsored
scheme is subject to fulfillment of certain conditions. Firstly, a state will become eligible
to access PMKSY fund only if it has prepared the District Irrigation Plans (DIP) and
State Irrigation Plan (SIP), excepting for the initial year, and the expenditure in water
resource development for agriculture sector in the year under consideration is not less
than the baseline expenditure, which is defined as the average of the expenditure in
irrigation sector irrespective of the department in the state plan in three years prior to
the year under consideration. Secondly, States will be given additional weightage for
levying charges on water and electricity for irrigation purposes, so as to ensure
sustainability of the programme. Thirdly, interstate allocation of PMKSY fund will be
decided based on
Share of percentage of unirrigated area in the state vis-à-vis national average
including prominence of areas classified under Desert Development Programme
(DDP) and Drought Prone Area Development Programme (DPAP)
Increase in percentage share of expenditure on water resource development for
agriculture sector in State Plan expenditure in the previous year over three years.
1.2 Approach and Methodology to prepare DIP
The major objective of PMKSY is to achieve convergence of investments in irrigation at
the field level, expand cultivable area under assured irrigation, improve on-farm water
use efficiency to reduce wastage of water, enhance the adoption of precision-irrigation
and other water saving technologies (More crop per drop), enhance recharge of aquifers
and introduce sustainable water conservation practices by exploring the feasibility of

DIP for NAVSARI: Irrigation for Agricultural Growth
12 | P a g e
reusing treated municipal waste water for peri-urban agriculture and attract greater
private investment in precision irrigation system. The approach under PMKSY is to
consider district as the ideal unit for planning as the convergences of schemes as well as
micro-level homogeneity can be the best at this level. However, district planning further
has to be developed from block-wise aggregation of gaps of demand-supply of water
resources, required investment across department/schemes on the basis of strategic
inputs like cropping pattern, geomorphological structure, population, industrial
development, livestock.
District irrigation plan is an ambitious exercise among others to make the Goals of „Har
Khte Ko Pani‟ a reality. Planning at the district level for achieving 100 percent irrigation
facility with fulfilling the water requirements of various segments requires many
strategic inputs. To determine the availability and accessibility, which in turn
determines affordability, and the sustainability of water resources in a district/blocks,
where there is limited documented information on surface water and groundwater
resource is challenging. Government offices generally have some data and information
on surface water and groundwater resources. However, it is often scattered, so,
systematizing data on surface water and groundwater resources, aquifers and geo-
morphological data, was the critical part of the DIP preparation exercise.
District Irrigation Plans (DIPs) are the cornerstone for planning and implementation of
PMKSY. DIPs is prepared to identify the gaps in irrigation infrastructure after taking
into consideration the District Agriculture Plans (DAPs) already prepared for Rashtriya
Krishi Vikas Yojana (RKVY) vis -à-vis irrigation infrastructure, currently available and
resources. Attempts have been made to present holistic irrigation development
perspective of the district Navsari. The DIP has outlined medium to long term
development plans by integrating three components: water sources, distribution
network and water use applications incorporating all usage of water like drinking &
domestic use, irrigation and industry.
The DIP is prepared with active participation of concerned departments. At the first
stage block wise irrigation plan was prepared based on basis of available and potential
water resources and water requirements and other location specific factors. In the later
stage the block plan were aggregated to prepare the compendium of all existing and
proposed water resource network system in the district.
1.2.1 The rationale of DIP:
The major objective of PMKSY is to achieve convergence of investments in irrigation at
the field level, expand cultivable area under assured irrigation, improve on-farm water
use efficiency to reduce wastage of water, enhance the adoption of precision-irrigation
and other water saving technologies (More crop per drop), enhance recharge of aquifers

DIP for NAVSARI: Irrigation for Agricultural Growth
13 | P a g e
and introduce sustainable water conservation practices by exploring the feasibility of
reusing treated municipal waste water for peri-urban agriculture and attract greater
private investment in precision irrigation system. The approach under PMKSY is to
consider district as the ideal unit for planning as the convergences of schemes as well as
micro-level homogeneity can be the best at this level. However, district planning further
has to be developed from block-wise aggregation of gaps of demand-supply of water
resources, required investment across department/schemes on the basis of strategic
inputs like cropping pattern, geomorphological structure, population, industrial
development, livestock.
1.2.3 Briefly, Approach to prepare the DIP
District Irrigation Plans (DIPs) are the cornerstone for planning and implementation of
PMKSY. DIPs is prepared to identify the gaps in irrigation infrastructure after taking
into consideration the District Agriculture Plans (DAPs) already prepared for Rashtriya
Krishi Vikas Yojana (RKVY) vis -à-vis irrigation infrastructure, currently available and
resources. Attempts have been made to present holistic irrigation development
perspective of the district Navsari.
What is DIP?
The DIP is an outline of medium to long term development plans, which integrates three
components: water sources, distribution network and water use applications
incorporating all usage of water like drinking & domestic use, irrigation and industry.
The DIP is prepared with active participation of concerned departments. At the first
stage block wise irrigation plan was prepared based on basis of available and potential
water resources and water requirements and other location specific factors. In the later
stage the block plan were aggregated to prepare the compendium of all existing and
proposed water resource network system in the district.
District irrigation plan is an ambitious exercise among others to make the Goals of „Har
Khte Ko Pani‟ a reality. Planning at the district level for achieving 100 percent irrigation
facility with fulfilling the water requirements of various segments requires many
strategic inputs. To determine the availability and accessibility, which in turn
determines affordability, and the sustainability of water resources in a district/blocks,
where there is limited documented information on surface water and groundwater
resource is challenging. Government offices generally have some data and information
on surface water and groundwater resources. However, it is often scattered, so,
systematizing data on surface water and groundwater resources, aquifers and geo-
morphological data, was the critical part of the DIP preparation exercise.
1.2.4 Vision
In line with the vision of the PMKSY, the District Irrigation plan adopts that 50-60
percent of rain-fed are ( i.e. water to each agricultural plot) will have irrigation facilities

DIP for NAVSARI: Irrigation for Agricultural Growth
14 | P a g e
and care for each drop of water for a sustainable development.
1.2.5 Strategy/approach
To achieve these objectives of PMKSY the DIP of Navsari district has adopted strategies
that include
a) Demand –Supply Assessments for the creation of new water sources; repair,
restoration and renovation of defunct water sources; construction of water
harvesting structures, secondary & micro storage, groundwater development,
enhancing potentials of traditional water bodies at village level.
b) Based on the developed and under-developed anslysis suggest for action plan to
Develop/augment distribution network where irrigation sources (both assured
and protective) are available or created.
c) To identify the scope for promotion of scientific moisture conservation and run
off control measures to improve ground water recharge so as to create
opportunities for farmers to access recharged water through shallow tube/dug
wells;
d) Promoting efficient water conveyance and field application devices within the
farm viz, underground piping system, Drip & Sprinklers, pivots, rain-guns and
other application devices etc.;
e) Encouraging community irrigation through registered user groups/farmer
producers‟ organisations/ NGOs; and capacity building: Farmer oriented
activities like capacity building, training and exposure visits, demonstrations,
farm schools, skill development in efficient water and crop management practices
(crop alignment) including large scale awareness on more crop per drop of water
through mass media campaign, exhibitions, field days, and extension activities
through short animation films etc.
1.6 Methodology
Prior to commence the preparatory work for DIP for Navsari, review of secondary
information available in the DAP, PLPs and State economic survey, district Handbook,
etc. was done, so that the discussions with stakeholders could be result oriented and
strategic.
Following to secondary data scanning, an irrigation experts‟ team visited Navsari district
to collect data and have interaction with all the stakeholders. Methodology adopted to
prepare DIP is outlined in brief as under:
a) Collection of primary and secondary data from field from various sources
including published documents and websites.
b) Various meetings were held to obtain ground level realities and data from key
personnel/stakeholders through structured, unstructured interviews, focused
group discussions etc.
c) Meetings with various State Government departments and related institutions
were held
d) Meeting through VC was also held with State Level authorities.

DIP for NAVSARI: Irrigation for Agricultural Growth
15 | P a g e
e) GIS maps of the area‟s/clusters were studied to understand the land
morphology, topography of the district.
f) Focused group discussions and interaction with of agriculture officers,
horticulture officers, soil conservation officers, extension officers, rural
development department, animal husbandry department, irrigation officers
both at blocks and district level for identifying the key issues and focus areas of
the region.
g) Discussions with NABARD officer and other local bodies, etc. in the
district were also held during the visit.
h) Team members also participated in the State Level workshop and held
active discussions with GoI officers, State Level officers and scientists of
various institutions
i) In the district at Panchayat level schemes were identified as per the need
and potential and resolutions were passed by the Panchayat to include the
schemes in PMKSY. The Panchayat resolutions were then consolidated and put
up in the Block Development Committee and a block plan was put up in the
Zila Parishad along with the programme of other line departments
participating in implementation of PMKSY. Besides IWMP prepared by District
Water Development agency was also proposed and approved by the Zila
Parishad Solan in its meeting.
The following departments have consulted in a focus manner to prepare the DIP plan
estimates.
Components under
PMKSY
Departments
Har Khet Ko Pani Water Resource Department, Gujarat State Land
Development Corporation Ltd., GWRDC
AIBP Water Resource Department, Gujarat State Land
Development Corporation Ltd., GWRDC
Others: Coastal area
development & Soil
conservation
Water Resource Department, Gujarat State Land
Development Corporation Ltd., GWRDC
More crop per drop GGRC
Watershed Development GSWMA
Capacity Building ATMA
Forest Development Forest Department
On the basis of detailed discussion and analysis of data, the team arrived at the
projections of various components of PMKSY and Department wise plan for four years
from 2016-17 to 2019-20 as detailed in the plan.

DIP for NAVSARI: Irrigation for Agricultural Growth
16 | P a g e
CHAPTER 1 GENERAL INFORMATION OF THE DISTRICT 1.1 Brief Description of Irrigation and Agriculture Situation in Gujarat
Gujarat agricultural economy has seen a growth rate of 10-11 percent in recent year.
Moreover, the State agriculture economy has witnessed a shift towards high value crops
like cotton, groundnuts, fruits and vegetables and condiments and spices from low value
cereals and other crops. Further, The Per Capita Income at current prices is Rs. 124358
in 2014-15 as against Rs. 113061 in 2013-14, showing an increase of 10.0 percent during
the year. The tendency for Public –Private partnership for ensuring irrigation to 100
percent cultivation land is higher in the state.
Several innovative initiatives
starting from soil card to
farmers to Krishi Mahostav are
undertaken by the state govt.
for making agriculture a
vibrant sector in the state. The
state has adopted
decentralised planning for
Agriculture development by
empowering the state farmers
through the programme
“Aapno Taluko, Vibrant Taluko” (ATVT) that extended benefits to the right person
which is unique in the country. Agriculture contributes around 1/5th of the state
domestic product.
1.2 Conducive environment for Agriculture:
The state is divided into 7 sub agro-climatic zones based on the characteristics of
agriculture and climate. Output of agricultural sector in Gujarat State has been largely
dependent on south-west monsoon. The State frequently experiences erratic behaviour
of the southwest monsoon. kharif cultivation is 85.52 lakh hectares. Normally, the state
receives first shower of rain in the second fortnight of June and sowing starts
accordingly. Area covered under Rabi crops till 30th November, 2015 is 12.68 lakh
hectare as against 16.78 lakh hectare recorded during last year. Area under major crops
sown during rabi season, are Wheat 2.98 lakh hectare, Gram 0.58 lakh hectare, Cumin
1.28 lakh hectare, Sugarcane 0.56 lakh hectare and Rapeseeds and Mustard 1.67 lakh
hectare.
Production of food grains during 2015-16 is estimated at 61.92 lakh tonnes compared to
77.95 lakh tonnes last year. During the year 2014-15, the production of cotton bales each
of 170 kg. was 96.24 lakh bales which decrease to kh bales which decrease to 88.01 lakh
bales during the year 2015-16. The production of oil seeds is estimated at 46.05 lakh

DIP for NAVSARI: Irrigation for Agricultural Growth
17 | P a g e
tonnes during the year 2015-16 against the production of 48.82 lakh tonnes during the
year 2014-15. At present, Horticultural crops contribute to about 20% to total
Agricultural economy. The major vegetables grown in Gujarat are Onion, Potato,
Brinjal, Tomato, Okra and Cucurbits. The state also produces spices viz. Cumin, Fennel
and Garlic. The state is leading in productivity of onion, tomato, banana, potato and
pomegranate at national level.
1.3 Reservoirs & Sources of Irrigation in the state:
Out of total 202 dams with total storage capacity of 15763.76 million cubic metres, 45
dams (having storage capacity of 12905.15 million cubic metres) are in Gujarat region
that includes south, north and central Gujarat area, 20 dams (having storage capacity o
of 332.02 million cubic metres) are in Kachchh region and 137 dams (having storage
capacity of 2526.59 million cubic metres) are in Saurashtra region.
Table 1.1: Reservoirs & Sources of Irrigation in the state
Sources Ultimate
potential
Potential
created
Potential
used
Surface water 47.66 40.14 25.05
Major & Medium Irrigation Schemes
including indirect benefits of Sujalam
Suphalam Spreading Canal, Bandharas
of Kachh district Big Check Dams of
Surendrangar Dist.
17.89 16.74 13.18
Sardar Sarovar Project 17.92 11.67 2.09
Minor Irrigation Scheme & Indirect
Benefits through Minor irrigation works
such as percolation
tanks, safe stage etc.
5.04 4.82 2.97
Indirect benefits through
Check Dams
6.81 6.81 6.81
Ground Water 20.01 20.01 20.01
Government Tube Wells 20.01 20.01 20.01
Total surface+ground 67.67 60.15 45.06
“Gujarat Water Users Participatory Irrigation Management Act-2007: Under this
scheme 518124 ha. and 1713 Water Users Associations have been covered at the end of
March-2015 During the year 2015-16, 6569 ha. more area and 17 Water Users
Associationshave been covered under this scheme.

DIP for NAVSARI: Irrigation for Agricultural Growth
18 | P a g e
1.4 Unique Agri-Development
Krushi Mahotsav - Lab to Land Programme : The Krushi Mahotsav has covered all
villages so far.'Krushi Raths' (vans) reaching to farmers with Researchers and technical
supports.
Soil Health Card: Gujarat is a first state who has started Soil Health Card Programme.
Based on soil health card information farmer can use fertilizers in balanced and
integrated way.
Sagarkhedu Sarvangee Vikas Yojana : During the year 2015-16 (up to December-
2015), following works were done under this scheme. (1) The work of 48 Bandharas
completed (2) The work of 21 Recharge Tanks Completed (3)163 ponds have been
deepened (4) The work of 22 spreading channels completed (5) 30 anti- sea erosion
works completed (6) 227 Large check dams are completed and (7) 5923 small check
dams completed.
Micro Irrigation Scheme
The Micro Irrigation Scheme in Gujarat is being implemented, in a uniform mode, by
the Gujarat Green Revolution Company (GGRC), Jal Sanchay Abhiyan (Drive for
Storage of Water) where in Gujarat Green Revolution Co. Ltd. is an integral part of the
Programme
1.5 District Profile
Navsari district come in existence by bifurcation of Valsad district on 2nd October 1997,
Navsari city is very old and have a strong historic background. Navsari city is 2000 years
old. Navsari covers 1.14% of total area of Gujarat State. Density (Population per sq. km)
of Navsari district is the 5th highest and is 592 and 5th lowest populated district in the
State Navsari district has the 5th highest literacy rate of 83.88 % and 3rd highest female
literacy rate of 78.83% in the State. The economy of the district is basically dependent
on agricultural activities as 53.97% workers are engaged in agricultural work. Other
focus industrial sectors are textiles, Drugs & Pharmaceuticals, Mineral based and
Marine based industries.
Decadal Population growth rate is 8.1.
1.5.1 History
Navsari was the Headquarters of Navsari prant/sub-division of erstwhile Vadodara state
prior to independence. Navsari was included in Surat district from 1st May 1949. At that
time Gujarat region was included in Mumbai State. Mumbai State was bifurcated into
Gujarat state and Maharashtra state on 1st May 1960. When Gujarat state was formed on
1st May 1960, existing Valsad and Navsari districts were parts of Surat district. The
Government of Gujarat bifurcated Surat district into Surat and Valsad districts with
effect from 1st June 1964. The Government of Gujarat further bifurcated Valsad district
into Valsad and Navsari districts with effect from 2nd October 1997 (Gandhi Jayanti
day). Navsari district consisted of five talukas. Among them, Navsari, Gandevi, Chikhli

DIP for NAVSARI: Irrigation for Agricultural Growth
19 | P a g e
and Vansda talukas have been separated from Valsad district and new Jalalpore taluka
has been formed from Navsari taluka.
Table 1.2: Geographical area of Talukas
Sl. No. Taluka Geographical Area in Sq. Km 1 Chikhli 574.61 2 Gandevi 294.75 3 Jalalpore 492.82 4 Navsari 249.45 5 Vansda 599.34 5 Total 2210.87 Note: Khergam newly formed Taluka details are not available
Gandevi and Nabvsari talukas are the smallest talukas in the district. Further, Khergam
another taluka has been formed by bifurcating Chikhli taluka. Vansda is the largest
Taluka.
1.5.2 Location
The Navsari district situated between 200 45‟-210 00‟ N latitude and 720 45‟ – 730 15‟
E longitude is consisting of five talukas viz., Navsari, Jalalpore, Gandevi, Chikhali and
Vansdada. It is flanked by Arabian sea in the West, Surat district in the North and
Valsad district in the South. It has an average elevation of 9m (29') above sea level. The
geographical area of district is 2196 km2.
Table 1.3: District location S. No. Name of the District District Code Latitude Longitude
1 Navsari 490 20°32’ & 21°05’ N 72°42’ & 73°30’ E
1.5.3 Administrative setup of Navsari
The district in Gujarat is divived in to Talukas (Tehsils) and the community
development block as unit of administration is same as the Taluka. Navsari district has
5 (06) talukas with 4 cities, 389 villages. Out of this 367 independent village panchayat
and 4 municipality (Nagar Panchayat).

DIP for NAVSARI: Irrigation for Agricultural Growth
20 | P a g e
The Panchayati Raj institutions are fairly strong and most of the development works
have been transferred to the District Panchayats and its subordinate bodies. The District
Panchayat has an elected President and District Development Officer appointed by the
Government works as its Secretary and looks after day-to-day work related to the
development.
The following chart shows the organization structure of Navsari district Panchayat

DIP for NAVSARI: Irrigation for Agricultural Growth
21 | P a g e
Table 1.4: Taluka details
No. of Talukas 06 (Navsari, Gandevi, Chikhli, Vansda , Jalalpore and Kher gram) Statutory & Census Towns
Navsari, Kabilpor, Chhapra, Vijalpor, Mahuvar, Gandevi, Bilimora, Devsar, Bilimora (Talodh), Antyaliya, Chikli, Vnsada,
No. of Panchayats 367 No. of Villages 389 Source: District Census Handbook, 2011, Census of India
Table 1.5: Taluka Wise No. of Towns and Villages
Sl. No. Taluka No. of Towns No. of Villages (Habited) 1 Chikhli 1 87 2 Gandevi 5 55 3 Jalalpore 2 71 4 Navsari 4 65 5 Vansda 1 94 5 Total 13 372
1.5.4 Demography
Navsari district with a total population of 13.29 lakh has density of 592 persons/km2
(2011 Census). Talukawise population density ranges from as high as 771 persons/km2
in Gandevi taluka to as low as 290 persons/km2 in Vansdada taluka. Sex ratio of the
district 961 and higher than the state average (929). Rural population of the district is
around 69 percent. Total households of the district is around 2.4 percent of total
households of the state. Average household size in the district is --. BPL households in
the district is 14.10 percent. Literacy rate of the district (83.88%) is higher than the state
average (78.03).
Chart 1: Demography of Navsari

DIP for NAVSARI: Irrigation for Agricultural Growth
22 | P a g e
Table 1.6: Demographic Features of the District as per 2011 census
Sl. No. Parameter State District 1 No. of HHs 12,193,328 293,761 2 Population 60,439,692 1,329,672 3 Gender ratio 919 961 4 Rural population in % 57.40 69.23 Source: District census Handbook, 2011
Rural Infrastructure and Basic Amenities in the District
100 percent villages Electrified
All villages have agricultural power supply
All Villages are connected with all –weather approach road
Out of 372 villages, 230 are having potable water supply
With respect to land holding, about 78 per cent farmers have less than 2 ha land and the
remaining 22 per cent hold between2-4 ha of land. It is surprising to note that there are
no medium (4+10 ha) and large (>10 ha) farmers in Navsari district.

DIP for NAVSARI: Irrigation for Agricultural Growth
23 | P a g e
Demographic details as per table 1.2 of the DIP template Demography Format under PMKSY Population SC ST General Total
Name of the Blocks Code
of
blocks
M F CH* (1-14 yrs) Total Population
2015
No.
of HH
No. of
Member
No. of
HH
No. of
Member
No. of
HH
No. of
Member
No. of
HH
No. of
Member
Navsari 0201 Total 76736 73561 15659 150297 201398 1,379 5752 17,036 72847 15,623 71698 34038 150297
Rural 55940 53752 11686 109692 146987 994 4155 14,389 61586 9,383 43951 24766 109692
Urban 20796 19809 3973 40605 54411 385 1597 2,647 11261 6,240 27747 9272 40605
Jalalpore 0202 Total 75048 71772 13481 146820 196739 1,027 3960 7,904 32628 25,078 110232 34009 146820
Rural 69486 66585 12375 136071 182335 900 3431 7,509 30884 23,196 101756 31605 136071
Urban 5562 5187 1106 10749 14404 127 529 395 1744 1,882 8476 2404 10749
Gandevi 0203 Total 90729 88521 16555 179250 240195 984 3748 14,756 62760 25,211 112742 40951 179250
Rural 78000 76764 14097 154764 207384 865 3268 13,434 57057 21,266 94439 35565 154764
Urban 12729 11757 2458 24486 32811 119 480 1,322 5703 3,945 18303 5386 24486
Chikhli 0204 Total 156516 153361 30533 309877 415235 1,411 5732 48,712 220170 18,138 83975 68261 309877
Rural 152960 149892 29902 302852 405822 1,394 5658 48,417 218860 16,908 78334 66719 302852
Urban 3556 3469 631 7025 9414 17 74 295 1310 1,230 5641 1542 7025
Vansda 0205 Total 115529 115699 25883 231228 309846 227 981 42,947 209474 4,456 20773 47630 231228
Rural 108363 108793 24406 217156 290989 193 836 41,665 203425 2,784 12895 44642 217156
Urban 7166 6906 1477 14072 18856 34 145 1,282 6049 1,672 7878 2988 14072

DIP for NAVSARI: Irrigation for Agricultural Growth
24 | P a g e
1.5.6 Livestock Development
Livestock Population
As per the 19th Livestock census 2012, the population of cattle was 190,838 of which,
cross-bred cattle and indigenous were 163,510 and 27,328 respectively. There has been a
growth of cattle (Cross-breed and indigenous) by around 22.33 percent. The following
table show the details of livestock in Navsari district. In the rural part district per 1000
household number of cattle, buffalos, Goat, sheep in the district are 935, 458, 8 and 328
respectively. In the district 2758 Ha. area is under fodder cultivation. The distribution of
cattle across different talukas is uneven. Chikhali and Vansda talukas are having higher
number of cattle, this strategic input is quite relevant from water use point of view. The
estimation for water demand arising from livestock for the DIP has used 19th Livestock,
however from an analytical perspective, the distribution data have been used from 18th
Livestock census.
Table 1.7: Cattle population across the Talukas (18th Livestock Census)
Taluka Cross breed Indigenous Total
Navsari 7341 4149 11490
Jalalpor 6336 4887 11223
Gandevi 11168 3629 14797
Chikhali 44020 18372 62392
Vansdada 26729 29688 56417
Source: 18th Livestock census
The major livestock breeds of cattle are Holstein friesion and Jersey cross as crossbred
cattle and Dangi, Kankrej and Gir breeds of indigenous cattle. Major buffalo breeds in
the district are Surti, Mehsani, Jaffarabadi and Banni breeds.
Chart 1.2: Cattle population

DIP for NAVSARI: Irrigation for Agricultural Growth
25 | P a g e
Chart 1.2A: No. of Animals per 1000 Households
As per the 19th Livestock census 2012, the District had a population of 8,74,174 birds.
There are about 23 layer farms in the organized sub-sector in the District. The estimated
production of eggs and meat was more than 525.00 lakh and 15.70 lakh kg. respectively
during 2014-15. About 85% of this production is transported to nearby big cities while
the balance is consumed locally. The maximum concentration of layer farms is around
Vesma while some others are operational at Eru, Kadakaccha, Maroli, Chikhli and
Bilimora. There are about 88 broiler farms with aggregate capacity of about 2.40 lakh
birds (Hubb/Cobb/Hubbard) and producing about 1,50,000 broilers every month. The
maximum concentration of broiler farms is also around Vesma with more farms
operational at Eru, Arak Pardi, Gandevi, Bilimora and Undach. The scope for poultry
exists on account of good demand for eggs and meat in the urban areas and in the
industrial areas of the district.
Sheep and goats serve as a source of subsidiary income to a large number of people
living in rural areas. The income comes from sale of wool, meat, manure and skin of the
dead animals. Farmers can take up Goat rearing in villages and in private wastelands
which can improve their financial position substantially. It also creates gainful
employment for unskilled youths. The district has potential for production and market
for meat. There exists a very low potential for sheep rearing for wool development in the
district. The sheep and goat population of the district as per livestock census 2012 is
2138 sheep (Marwadi, Patanwadi) and 84519 goats (Gohilwadi, Mehsani, Surti,
Zalawad).
The sheep rearing activity in the district is very negligible. The agro climatic conditions
of the district are reported to be not favourable for wool production. However, due to
implementation of SGSY, it is being done in some villages in the hilly parts of the
district.

DIP for NAVSARI: Irrigation for Agricultural Growth
26 | P a g e
1.5.7 Fodder availability
Livestock development depends on fodder availability. In the district total 2758 ha. land
is under fodder cultivation. As number of livestock animals are more in Vansda and
Chikli Taluka, Fodder areas are also higher in these 02 talukas.
Table 1.8: Taluka wise area under Fodder crop
Taluka Area (ha) under fodder crop
Navsari 137
Jalalpor 297
Gandevi 182
Chikhli 946
Vansda 1196
Total 2758
Source: District PLP report, NABARD
Insufficient management has been the major problem for livestock development in the
district. Next to this, Feed availability is the important factor for losses to the livestock
development in the district.
1.5.8 Production and Availability of livestock products
Dairy farming is the most popular income generating activity in the District after Agri-
horticulture. The establishment of the Valsad District Cooperative Milk Producers
UnionLtd., “Vasudhara Dairy”, at Alipore in the District in 1972 has been the principal
source of development ofdairy in the District. It covers Navsari, Valsad and Dangs
districts. Organized dairy is being promotedby theVasudhara Dairy in the District
through milk collecting societies.
In Navsari District,the affiliated Societies (489) together channeled around 75356 MT
milk during the year2014-15. Of the total milk produced/processed, 52% was sold within
the State while the balance was sentto Mumbai, Nagpur and Raipur. It was also used in
the Ice Cream Plants at Boisar and Nagpur, owned andrun by the Vasudhara Dairy
itself, for manufacturing ice-creams as well as tetra-pack milk. The VasudharaDairy has
now an installed capacity for processing of 3 lakh litres of milk per day. As such, the
District isself-sufficient in milk production. The estimated production of eggs and meat
was more than 525.00 lakh and 15.70 lakh kg. respectively during 2014-15.
Table 1.9: Livestock Production
Sl. Livestock products Production unit Production Per-capita availability
Fish MT 20158 39 gm/day
Egg Lakh No. 522 47 no. per head
Milk 000’ MT 219 405 gm/day
Meat MT 3283 NA

DIP for NAVSARI: Irrigation for Agricultural Growth
27 | P a g e
Source: District PLP report, NABARD
Table 1.3 of PMKSY Format Name of the
Blocks
Small Animals Large Animal
Poultry
(No.)
Ducks
(No.)
Pigs (Nos.) Goats
(Nos.)
Sheep
(Nos.)
Indigenou
s Cow
(Nos.)
Hybrid
Cow
(Nos.)
In
Descrip
tive
Buffalo
(Nos.)
Hybrid
Buffalo
(Nos.)
Navsari 0 0 0 8210 49 3267 6114 11758
Jalalpore 0 0 0 5959 416 2829 4726 20827
Chikhli 0 0 0 13644 145 11422 37537 46087
Gandevi 0 0 0 8797 350 2527 9809 13145
Vansda 0 0 0 9402 12 11724 21760 38757
Total 0 0 0 46012 972 31769 79946 130574
1.5.9 Agro-Ecology, Climate, Hydrology and Topography
Navsari district is located in the Agro-climatic zone : Gujarat Plain& Hills region –
Southern Hills. The climate of this district is Semi-Arid to Dry-Sub-Humid. Climatically
the Gandevi and Chikhali talukas are categorized as humid and the Navsari/Jalalpore
and Vansda talukas as subhumid (dry/moist). Relatively higher rainfall of 2197 mm is
received in Gandevi taluka while minimum of 1493 mm rainfall is received in
Navsari/Jalalpore taluka. The potential evapo-transpiration ranges from 1538 mm in
Chikhali to 1637 in Vansda taluka.
Agro-Climatic Zone: Navsari Gujarat Plain & Hills region – Southern Hills
Climate Semi-arid to Dry Sub-Humid
Source: Central Ground water board, Ministry of water resources, GoI
The drainage in the district is controlled by the topography and the lineaments. The
major rivers draining the district are Purna, Ambika, Kaveri and Khapar and their
tributaries. The rivers are ephemeral toward hilly area toward east and gradually tend to
become perennial toward west. All the river basin are east-westward stretching basins
The River originates from Sahayadri hills and flow toward west.
The drainage Pattern is mainly detritic and drainage density is fine. Radial pattern are
locally developed around the hills. In piedmonts drainage density is courser and sub-
parallel and are characterised by broad stream course. In alluvial terrain the drainage
density is characteristically course and sub-parallel to parallel.
Hydrology
Major Water Bearing Formation- Basalt & Sand layers.
Pre-monsoon depth to water level (may 2012) 2.74 mbgl (at Chinam)
to25.80mbgl (Navsari )
Post- monsoon depth to water level (November 2012) 1.05 mbgl (at Khedgam)
to21.69 mbgl ( Navsari) 18.65 mbgl at Navsari

DIP for NAVSARI: Irrigation for Agricultural Growth
28 | P a g e
Long term water level trend in 10 yrs premonsoon (may 2003-may 2012)Rise
(0.0023m/yr at Dandi to 0.129 m/yr at Amrama.) and decline 0.059m/yr
atAnklas to 0.1.040 m/yr at Hanumanbari.)
Long term water level trend in 10 yrs post monsoon (Nov./2003-Nov./2012) Rise
range 0.0049m/yr at Ubrat to 0.2831 m/yr at Kantavel. Fall range to 0.123
m/yrat Gandevi to 0.459m/yr at Anklas.
1.5.10 Climate and Rainfall
The climate of the district is tropical. In winter, there is much less rainfall than in
summer. This climate is considered to be Aw according to the Köppen-Geiger climate
classification. In Navsari, the average annual temperature is 27.1 °C. The rainfall here
averages 1555 mm. The driest month is January, with 0 mm of rain. Most precipitation
falls in July, with an average of 629 mm. District receive rainfall mainly from Southwest
monsoon. The rainfall is confined between June to October months. Surat IMD station
is more representative of climatological conditions for the Navsari district.
Table 1.10: Taluka wise Data on weather parameters
Taluka No. of weather station
Rainfall
No. of rainy days Average rainfall (mm)
Navsari 2 78 1746 Jalalpor 2 84 1573 Gandevi 2 71 1786 Chikhli 2 75 1809 Vansda 2 64 2126 Total/average 10
Source: www.timeanddate.com/weather/India/Navsari 2
1.5.11Temperature&Rainfall
General climate of the district is sub-tropical and is characterized by three well-defined
seasons, i.e. summer - from April to June, monsoon - from July to September, and
winter - from October to March. Mean maximum daily temperatures range from 30° to
37°C and mean minimum daily temperatures from 14 to 26 °C. April and May are the
hottest months when the temperatures may exceed 44°C. The winters are generally
pleasant with minimum temperatures around 09°C., Mean maximum and minimum
temperature of the district is 35°C and 26°C respectively. Maximum temperature
remains more than 300 across all the talukas.
Table 1.11: Taluka wise Max. and Min. temperature
Taluka Temperature
Min. 0C Max. 0C
Navsari 27 31
Jalalpor 29 35

DIP for NAVSARI: Irrigation for Agricultural Growth
29 | P a g e
Gandevi 28 32
Chikhli 28 34
Vansda 26 34
Source: Central Ground water board, Ministry of water resources, GoI Table 1.12: Taluka wise monthly rainfall data
Taluka June July Aug Sept Oct Nov / Dec
Navsari 70 578 946 315 0 0
Jalalpor 68 482 717 323 0 0
Gandevi 75 744 1541 261 0 0
Chikhli 72 623 1904 242 0 0
Vansda 97 740 1072 307 0 0
Total/average 382 3167 6180 1448 0 0
Source: DAO, Navsari
Table No. 1.4 of PMKSY Format
Name of
the Block:
Sl Agro
Ecological
Zone Type
Type of Terrain Block Area
(Ha)
Normal
Annual
Rainfall
(mm)
Average
Monthly
Rainfall
(mm)
No of
Rainy
Days
Navsari 1 AES III levelled-fine texture 34169 1746 146 78
Jalalpore 2 AES III Levelled-fine texture 40030 1573 131 84
Gandevi 3 AES II Level fine textured
Deep and medium
depth
28454 1705 142 71
Chikhli 4 AES II Level fine textured
Deep and medium
depth
57452 1809 151 75
Vansda 5 AES I Undulating fine textured
shallow to medium
depth
59972 2126 177 64
Name of
the Block:
Average Weekly Temperature (0C)
Period
Summer (Apr-May) Winter (Oct- Mar) Rainy (Jun-Sep)
Min Max Mean Min Max Mean Min Max Mean
Navsari 23.5 36.7 30.3 15.3 31 23.1 24.3 31.5 27.6
Jalalpore
Gandevi
Chikhli
Vansda
Table 1.13: Taluka wise Ground water sources in ha.m (2009)
Taluka Annual
Ground
water
recharge
Net Ground
water
availability
Annual Ground water
Draft
Projected Demand-2025
Nov / Dec
Monsoon
& Non-
monsoon
Irrigation Domestic
and
Industrial
Domestic
and
Industrial
Water
availability
for
agriculture
Navsari 9767.75 9279.37 4918.80 497.00 697.00 3663.57
Jalalpor 9203.08 8742.92 4052.40 398.00 558.00 4132.92
Gandevi 8879.44 8435.47 4262.40 435.00 609.00 3564.07
Chikhli 13149.02 12491.57 7423.00 530.00 743.00 4325.57
DIP for NAVSARI: Irrigation for Agricultural Growth
30 | P a g e
Vansda 5894.20 5599.49 2839.50 364.00 510.00 2249.99
Total 46893.49 44548.82 23495.70 2224.00 3117.00 17936.12
Source: Report on Estimation of ground water resources & irrigation potential in Gujarat
(GWRDC)
Strategic insights: Talukas like Chikhli, Jalalpore and Navsari have high potentials for
groundwater based irrigation for agriculture.
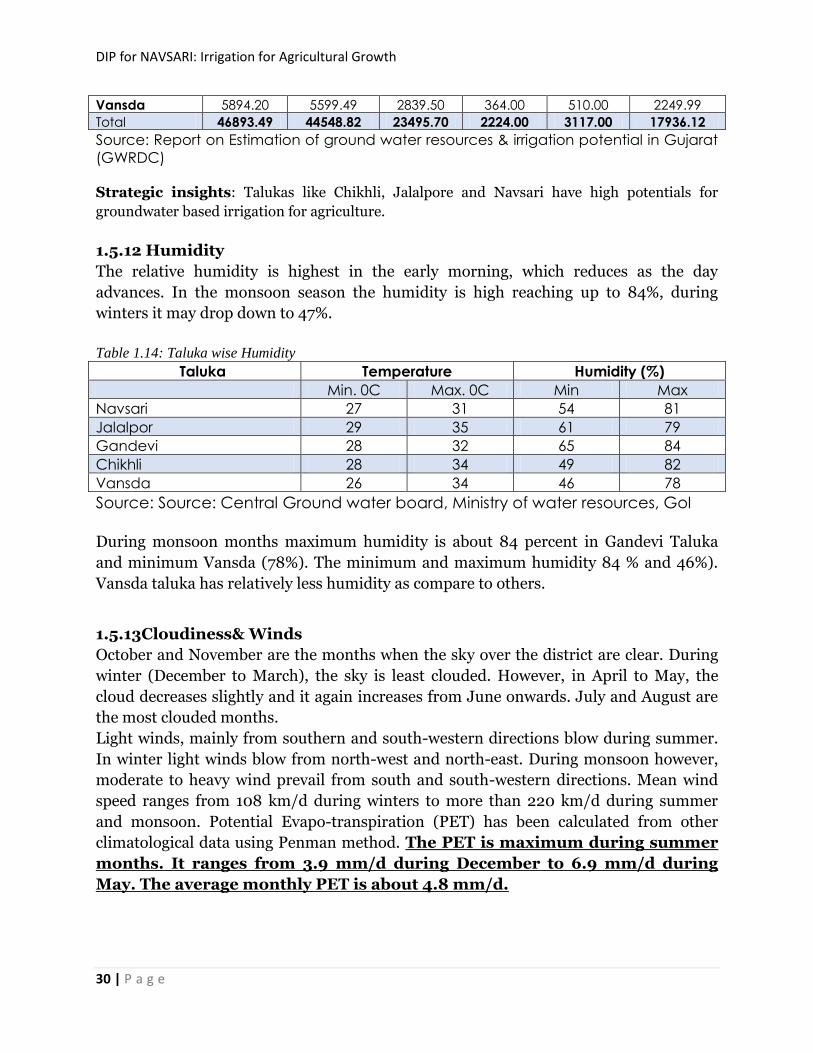
1.5.12 Humidity
The relative humidity is highest in the early morning, which reduces as the day
advances. In the monsoon season the humidity is high reaching up to 84%, during
winters it may drop down to 47%.
Table 1.14: Taluka wise Humidity
Taluka Temperature Humidity (%)
Min. 0C Max. 0C Min Max
Navsari 27 31 54 81
Jalalpor 29 35 61 79
Gandevi 28 32 65 84
Chikhli 28 34 49 82
Vansda 26 34 46 78
Source: Source: Central Ground water board, Ministry of water resources, GoI
During monsoon months maximum humidity is about 84 percent in Gandevi Taluka
and minimum Vansda (78%). The minimum and maximum humidity 84 % and 46%).
Vansda taluka has relatively less humidity as compare to others.
1.5.13Cloudiness& Winds
October and November are the months when the sky over the district are clear. During
winter (December to March), the sky is least clouded. However, in April to May, the
cloud decreases slightly and it again increases from June onwards. July and August are
the most clouded months.
Light winds, mainly from southern and south-western directions blow during summer.
In winter light winds blow from north-west and north-east. During monsoon however,
moderate to heavy wind prevail from south and south-western directions. Mean wind
speed ranges from 108 km/d during winters to more than 220 km/d during summer
and monsoon. Potential Evapo-transpiration (PET) has been calculated from other
climatological data using Penman method. The PET is maximum during summer
months. It ranges from 3.9 mm/d during December to 6.9 mm/d during
May. The average monthly PET is about 4.8 mm/d.

DIP for NAVSARI: Irrigation for Agricultural Growth
31 | P a g e
1.5.14 Special Weather Phenomena
The rainfall round the year is erratic and chances of flood or crop damage are there. The
CV of rain fall across 10 years seems to be very high.
1.5.15 Flora and Fauna
Vansda National Park is a beautiful place, located in the Navsari district of the state of
Gujarat. The Park is extremely dense and harbors a wide variety of flora and fauna. The
Park has mainly moist deciduous and dry deciduous forest and bamboos, tall teak trees,
orchids, mango groves and gigantic creepers are the predominant trees of the forest. It
contains 440 species of plants, which include 110 species of trees, 43 species of shrubs,
63 species of climbers, 199 species of herbs and 25 species of grass.
Dominant flora: Teak, Sadad, Bamboo, Dudhkod, kakad, khakhro, Timru, Humb,
kalam, Modad, Haldu, Sisam, Chopadi Bondaro, kusum, Tanach, Asan, Mahudo, Behda,
Umaro, Shimlo, Ambla etc.
Dominant fauna: Mammals – Leopard, Rhesus macaque, Giant squirrel, Wild boar,
Hanuman langur, Common palm civet, Small Indian civet, Indian porcupine, Four-
horned antelope, Barking deer, Hyena, Jungle cat, Flying squirrel etc. Reptiles – Python,
Russel‟s viper, Venomous snakes, Cobras, Kraits etc.
Birds – Indian great black woodpecker, Yellow back sunbird, Pompadour pigeon,
Malabar trogon, Common grey hornbill, Jungle babbler, Forest spotted owlet, Yellow-
backed Sunbird, Grey Hornbill, Forest Wagtail, Shama, Paradise flycatcher, Leaf birds,
Thrushes, Malabar trogon, Pea fowls etc.
1.6 Fishery
Fisheries sector may be broadly divided into three sub sectors viz. fresh water, marine
and brackish water.Marine fisheries can be further classified into Inshore, Offshore and
Deep Sea fishing depending on thedepth. Aqua culture can be classified into inland
aquaculture and coastal aquaculture, which may coverinshore and sea ward side of
brackish water and marine culture activities.The District has the Arabian Sea coastline
of 53 kms along the boundaries of Jalalpore and Gandevi Blockswith 12 Marine Fishery
Centres. Ambika, Kaveri, Mindhoda, Kharera and Poorna are the main rivers
that,together, have 20 Inland Fishery Centres.
1.7 Soil Profile
Land is one of the main natural resources enabling life on the planet. Human civilisation
irrespective of whatever high level of development of science and technologies, cannot
exist without land and water resources. Top 12 inch of the land is very important for
food security of all the life in the planet. Thus, health of the soil is quite significant for
improved agriculture. The land development has significant role in agriculture.

DIP for NAVSARI: Irrigation for Agricultural Growth
32 | P a g e
The district is agro-climatically sub-divided into three categories - forest and
hilly/undulated tracts with rocky and denuded expanse of South Eastern Part (Vansda),
Saline Soil of the coastal Western Part (Jalalpore and Gandevi) and fertile ranges with
medium black/black soil of the Central part (Navsari, Chikhli and inland Gandevi).
Table 1.15: Soil types in Talukas
Taluka Predominant Soil Types
Navsari Deep Black Clayey soil
Jalalpor Deep Black Clayey soil
Gandevi Deep Black Clayey soil
Chikhli Deep Black Clayey soil
Vansda Deep Black Clayey soil
However, in some regions other types of soils are: Black, Medium Black, Stony, Shallow
Sandy Loam Soil Black, Medium Black, Stony, Shallow Sandy Loam
Soil texture is an important soil characteristic that could influence water retention
capacity, aeration, drainage, and susceptibility to erosion which drives crop production
and management. The textual class of soil is determined by the percentage of sand, silt
and clay. Soils can be classified into one of four major textural classes including sands,
silts, loams and clays. Broadly speaking, three textural classes are identified in the state.
Clayey and loamy types are predominant in the state under fine and medium textured
soils.
Leveled, fine
textured, deep, salt
affected, low rainfall,
irrigated-paddy,
sugarcane-sorghum
zone
Cereals (35.7%)
S’cane(17%)
Grasses (26.5)
Vege, Fruits &
Flowers
(15.5%)
1. Frequent flooding of fields during rainy
season.
2. Coastal area. 3. Injudicious use of fertilizer,
pesticides and Irrigation water
4. Inadequate availability of labours during
peak periods
5. Heavy infestations of weeds
6. Poor quality of ground water
Coastal part
of Navsari,
Jalalpore
and Gandevi
Table No. 1.5 of PMKSY Format
Name of
the
Block:
Soil Type Area (Ha) Land Slope
Black
Soil
Red Soil 0-3%
(Ha)
3-8%
(ha)
8-25%
(ha)
>25%
(ha)
Navsari 34169 0
Jalalpore 40030 0
Gandevi 28454 0
Chikhli 57452 0
Vansda 0 59972

DIP for NAVSARI: Irrigation for Agricultural Growth
33 | P a g e
1.7.1 SOIL HEALTH
Soil is an important component of the earth‟s system, functioning not only for the
production of food, fodder and fibre but also in the maintenance of local and regional
environmental quality (Pathak 2010). Soil health in the context of agriculture refers to
its ability to sustain productivity. Healthy soil would ensure proper retention of water
and nutrients, promote sustain growth, maintain the soil biotic habitat and respond to
management and resist degradation. The fact of soil being an important source of
supplying plant nutrients has been is known since the dawn of agriculture. Improper
fertiliser application and decline in soil organic matter can cause imbalance in soil
nutrients (macro and micro). Therefore, it is important to monitor the nutrient
supplying capacity of soils and ensure the sustainability of agriculture.
Soil Health in Navsari District
Nutrient Index Navsari N Class P Class K Class
2.92 H 1.43 L 2.66 H

DIP for NAVSARI: Irrigation for Agricultural Growth
34 | P a g e
1.8 Land Use Pattern
Of the total Geographical area 220077 hectares of land, net sown area is around 51
percent. Land under the category the current fallow land is relatively higher i.e. 34
percent.
Area wise Vansda is the largest Taluka and the forest area in this taluka is dominant.
Table 1.16: Taluka wise Land Utilization (preceding 3 years average, area in hectare)
Taluka
Geographic
al area
Forest
Area
Land
Under Non-
agri.Use
Cultivabl
e waste
Permanent
pastures
Current
Fallows
Other
Fallows
1 2 3 4 5 6 8 9
Navsari 34169 0 4125 2046 703 28 4630
Jalalpor 40030 3358 1887 4730 790 37 4349
Gandevi 28454 187 4658 0 598 0 4042
Chikhli 57452 1309 845 0 1039 236 3630
Vansda 59972 23809 602 0 2216 80 2555
Total 220077 28663 12117 6776 5346 381 19206
Source : ZREAC Report, DAO, District Panchyat, Navsari.
Table 1.17: Land Capability Classification (Area in hectares)
Taluka
Very good cultivable
land Class - I (0-1)
Good cultivable land Class- II (1-3)
Modera tely good cultivab le land
Class- III (3-8)
Fairly good land, suited for occasio nal cultivati on Class- IV
Nearly level land not suitable for cultivation because of stoniness, wetness, etc.
Class- V
Steep slopes, highly erosion prone with shallow soils Class- VI
Navsari 12400 8100 657 624 856 - Jalalpor 8000 12000 1931 1951 996 - Gandevi 15000 4000 381 - - - Chikhli 20000 24000 3101 2880 - - Vansda 10000 15000 2460 1850 800 800
Source. BISAG, Gandhinagar
Availability of Good quality land is higher in Chilhli taluka and Gandevi taluka. Good
quality class II land is the highest percent in the total cultivable land.

DIP for NAVSARI: Irrigation for Agricultural Growth
35 | P a g e
Table No. 1.7 As per PMKSY Format
Name of
the Block:
No. of
GP
No.
of
Vill
Total
Geograp
hical
Area
Area under Agriculture Area
under
forest
Area
under
wastel
and
Area
under
other
uses
Gross
Croppe
d Area
(1)
Net
Sown
Area (2)
Sown
more than
once (1-2)
CI
(%)
Navsari 62 70 34169 NA 22637 NA 0 4125 4630
Jalalpore 65 72 40030 NA 24879 NA 3358 1887 4349
Gandevi 65 66 28454 NA 19381 NA 187 4658 3630
Chikhli 89 90 57452 NA 49981 NA 1309 845 4042
Vansda 86 95 59972 NA 30710 NA 23809 602 2555
District
Total
367 393 220077 162116 147588 14528 109 28663 12117 19206

DIP for NAVSARI: Irrigation for Agricultural Growth
36 | P a g e
CHAPTER 2 DISTRICT WATER PROFILE
2.1 Area Wise, Crop Wise irrigation Status
The actual net irrigated area in the district was 89799 hectares or about 68.5% of the
total cultivated area. The district has about 50% perennial irrigation so intensive crop
cultivation practice are adopted. There is a constraint of soil fertility decline by means of
accumulation of salt and less proportion of organic carbon. These properties leads to
low yielding in agricultural crops like sugarcane, paddy and others .T
Chart 2.1 Area irrigated & Chart 2.2 Source wise irrigation

DIP for NAVSARI: Irrigation for Agricultural Growth
37 | P a g e
Out of147588 hectares of cultivated land, 72462 ha (49.10%) area is under irrigation. The
remaining land i.e. 67637(50.9%) is un-irrigated one. Looking to taluka Navsari has 81.35%
irrigated area, followed by Jalalpore(65.00%), Gandevi (60.76%), Chikhali (38.73%) and
Vansdada(21.89%). For Navsari, Jalalpore and Gandevi canal ismain source of irrigated in
Navsari 54% , in Jalalpore 64% and in Gandevi 51% area covered under canal irrigation.
While in Chikhali 77% ara irrigated through open/before well. In Vansdada taluka 40% area
under open/bore well and 38% area under canal irrigation.
Source wise irrigation in the district reveals that 47700 Ha. (57%) land irrigation is sourced
from Govt. canal, Tube-wells contributes 14 percent of net area under irrigation and share of
other wells in the total irrigation facility is 19%. The above chart depicts the details of source
wise irrigation in Navsari.
Crop wise irrigation status has been primarily analysed across of 04 crop groups. Food grains
(Cereals & Pulses) share in the total land under irrigation is 55%. In terms of absolute figures,
around 52800 ha. of land under food crops are grown with irrigation facilities. Sugarcane, a
important crop in this district is cultivated on 58200 ha. of irrigated land (share in total
irrigated gross crop area is 19%).
Chart 2.3 Crop category wise Irrigation
In the district around 249,00 ha. land under fruits cultivation are irrigate. This
constitutes around 26 percent of gross irrigated area.
2.2 Production and Productivity of Major Crops
The district covers 1,47,588 hectares cultivated area. The major crops are (1) Cereals:
Paddy, Sorghum, Ragi, (2) Horticulture: Mango, Sapota, Banana, Vegetables and
Flowers. (3)Pulses: Tur, Green Gram (4) Oilseeds: Soyabean, Niger. The cropping
pattern of the district is heavily titled in favor of cash crops like sugarcane, and Paddy.

DIP for NAVSARI: Irrigation for Agricultural Growth
38 | P a g e
Navsari is considered the Horticulture Hub of Gujarat. Mango, sapota, papaya and
banana are the major fruit crops while the main vegetables grown are brinjal, tomatoes,
okra, etc. Under floriculture rose, spider lily, white lily, gladiolus, deshi gerbera, etc. is
also being grown.
Across the years the productivity of major crops Paddy and sugarcane has increased.
The tables below presents the details production, area and productivity of major crops
across three point of time.
Table 2.1: Area under cultivation under major crops of the district (Year 2010-11)
SR.
NO
CROP AREA (HA) PRODUCTION (00.T) PRODUCTIVITY
(KG /HA)
FIELD CROPS
1. PADDY (KHARIF) 62600 1613 2577
2. PADDY (SUMMER) 24900 753 3030
3. SORGHUM 2200 25 1136
4. RAGI 200 1 694
5. GREEN GRAM 1800 9 500
6. GRAM 1800 26 1380
7. PIGEON PEA 4800 48 985
8. BLACK GRAM 5300 33 623
9. SUGARCANE 21250 15300 72000
Source: CDAP, Department of Agriculture, GoG Table 2.2: Area under cultivation under major crops of the district (Year 2014-15)
Crop Year: 2014-15 Avg. Yield (Kg./Ha.)
Area (Ha.) Production (MT)
Paddy 67869 257563 3823
Sugarcane 17495 1348304 77535
Jowar 1480 2239 1480
Tur 1005 995 996
Groundnut 44 49 1157
Mango 29025 252523 8792
Chikoo 7660 92235 12041
Source: District PLP Report, NABARD
Table 2.3: Area Prod of Fruits and Vegetables Crops for the Year 2014-15
Fruits NavsaRI Gandevi Chikhali
Area Produ. Area Produ. Area Produ.
Mango 5204 47356.4 8165 74301.5 7814 71107.4
Chiku 1957 24756.1 4303 54433 517 6540.05
Citrus 0 0 0 0 4 40
Ber 0 0 0 0 0 0
Banana 910 46774 685 35209 364 18709.6
Guava 0 0 2 25 0 0
Pomegranate 0 0 2 18 0 0

DIP for NAVSARI: Irrigation for Agricultural Growth
39 | P a g e
Dates 0 0 0 0
Papaya 122 7679.9 66 4154.7 68 4280.6
Custard Apple 0 0 0 0 0 0
Aonla 0 0 0 0 0
Cashew 0 0 0 0 0 0
Cocount 0 0 552 4647.84 0 0
Others 47 359.55 32 244.8 23 175.95
Total 8240 126926 13807 173034 8790 100854
Source: Department of horticulture, GoG
Table 2.4: Area Prod of Fruits and Vegetables Crops for the Year 2014-15
Jalalpor Vasda Total Pdvty
Fruits Area Produ. Area Produ. Area Produ.
Mango 4592 41787.2 2950 26845 28725 261398 9.1
Chiku 754 9538.1 130 1644.5 7661 96911.7 12.65
Citrus 0 0 3 30 7 70 10
Ber 5 43 0 0 5 43 8.6
Banana 234 12027.6 567 29143.8 2760 141864 51.4
Guava 0 0 0 0 2 25 12.5
Pomegranate 0 0 0 0 2 18 9
Dates 0 0 0 0 0 0 0
Papaya 41 2580.95 31 1951.45 328 20647.6 62.95
Custard
Apple
0 0 0 0 0 0 0
Aonla 0 0 0 0 0 0 0
Cashew 0 0 324 1202.04 324 1202.04 3.71
Cocount 0 0 0 0 552 4647.84 8.42
Others 18 137.7 19 145.35 139 1063.35 7.65
Total 5644 66114.6 4024 60962.1 40505 527890
Source: Department of horticulture, GoG
Table 2.5: Area Prod of Fruits and Vegetables Crops for the Year 2014-15
Fruits NavsaRI Gandevi Chikhali
Area Produ. Area Produ. Area Produ.
Potato 0 0 0 0 0 0
Onion 0 0 0 0 90 1570.5
Brinjal 62 1215.82 443 8687.23 823 16139
Cabbage 14 321.3 14 321.3 34 780.3
Okra 841 10638.7 65 822.25 2340 29601
Tomato 12 277.2 12 277.2 34 785.4
Cauliflower 0 0 0 0 78 1525.68

DIP for NAVSARI: Irrigation for Agricultural Growth
40 | P a g e
Guwar 50 491.5 46 452.18 295 2899.85
Gowpea 45 360 54 432 237 1896
Cucurbits 164 2876.56 190 3332.6 5078 89068.1
Other 29 383.09 45 594.45 209 2760.89
Total 1217 16564.1 869 14919.2 9128 145456
Source: Department of horticulture, GoG
Table 2.6: Area Prod of Fruits and Vegetables Crops for the Year 2014-15
Fruits Jalalpor Vasda Total Pdvty
Area Produ. Area Produ. Area Produ.
Potato 0 0 0 0 0 0 0
Onion 0 110 1919.5 200 3490 17.45
Brinjal 67 1313.87 1371 26885.31 2766 54241.26 19.61
Cabbage 12 275.4 120 2754 194 4452.3 22.95
Okra 358 4528.7 2088 26413.2 5692 72003.8 12.65
Tomato 12 277.2 56 1293.6 126 2910.6 23.1
Cauliflower 0 0 60 1173.6 138 2699.28 19.56
Guwar 21 206.43 253 2486.99 665 6536.95 9.83
Gowpea 45 360 409 3272 790 6320 8
Cucurbits 50 877 3480 61039.2 8962 157193.5 17.54
Other 76 1003.96 326 4306.46 685 9048.85 13.21
Total 641 8842.56 8163 129624.4 20018 315406.5
Source: Department of horticulture, GoG
2.3 Irrigation based classification
Irrigation is considered as one of the major factor contributing to the agriculture
production and it has been reckoned that better the irrigation management, better the
agricultural production and productivity. The climate of the district is sub-humid and its
geological structures are both of hard rocks and alluvial formations. The eastern part
(Vansda Block) consists of hard rocks where water is tapped through dug wells/dug-
cum-bore wells while alluvial formations, as river fills, occupy the south-central,
northern and western parts (other 4 Blocks) where the groundwater occurs under
confined/semi-confined conditions and is exploited through dug wells/dug-cum-bore
wells for confined aquifers and through shallow tube wells for semi-confined aquifers.
The quality of ground water is suitable for irrigation throughout the District, except
along the coastal Jalalpore and Gandevi Blocks where it is saline at some places. During
2014, the district received 1439 mm rainfall. There are benefits of five main rivers in the
District – Mindhoda, Poorna, Kaveri, Kharera and Ambika. Four large and medium

DIP for NAVSARI: Irrigation for Agricultural Growth
41 | P a g e
irrigation projects - Kakrapar, Ukai, Jooj and Kelia dams have their Command Areas in
the District. All the 6 Blocks in the District are classified as “White” with stage of ground
water development being less than 70%.
Table 2.7: Sources of Irrigation in Navsari
Sl. No. Irrigation Parameter In Ha.
1 Total area available for Irrigation (NIA+) 131096
3 Net Irrigated 89799
4 Area Irrigated by Canals/channels 59300
5 Area Irrigated by Wells 28274
6 Area irrigated by Tanks 2005
7 Area irrigated by other sources 220
8 Irrigation Potentials utilized (Gross Irrigated) 89799
Source: District PLP Report, NABARD
Overall District Situation:
The net irrigated area in the District is 89799 ha. or about 68.5% of the total cultivated
area. This compares well with the State average of about 32%. Canals are the pre-
dominant irrigation sources (59300 hectares), followed by wells (28274 hectares) and
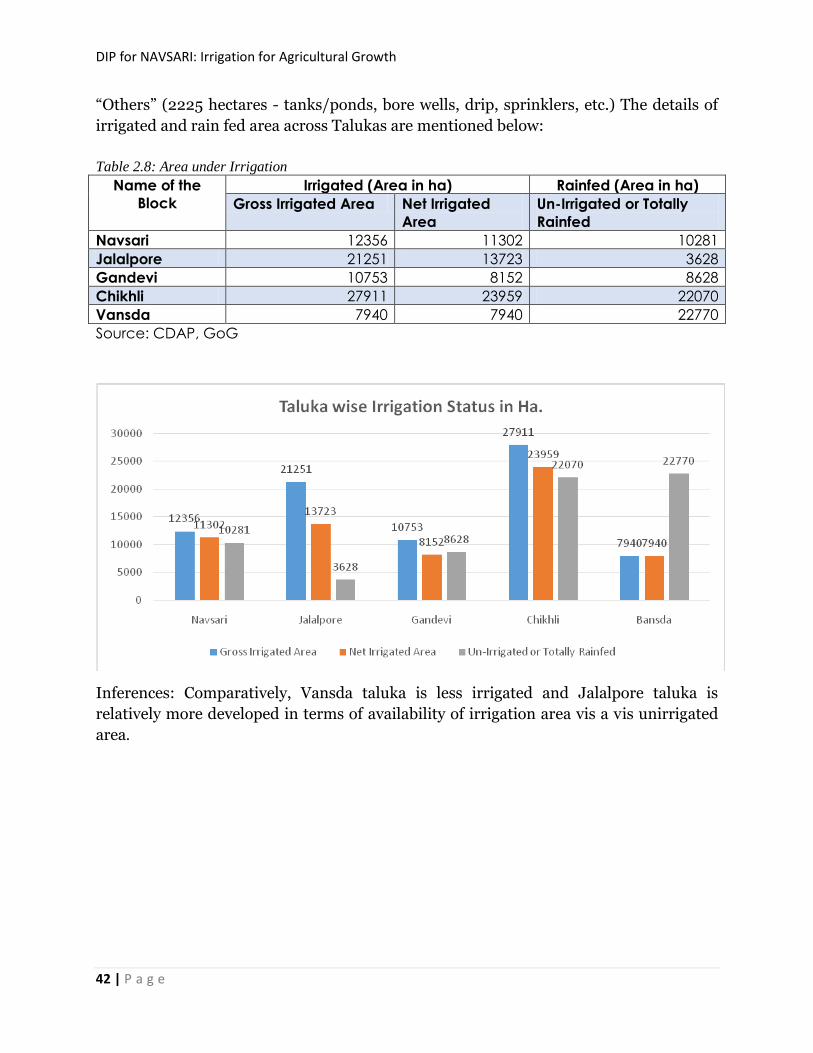
DIP for NAVSARI: Irrigation for Agricultural Growth
42 | P a g e
“Others” (2225 hectares - tanks/ponds, bore wells, drip, sprinklers, etc.) The details of
irrigated and rain fed area across Talukas are mentioned below:
Table 2.8: Area under Irrigation
Name of the
Block
Irrigated (Area in ha) Rainfed (Area in ha)
Gross Irrigated Area Net Irrigated
Area
Un-Irrigated or Totally
Rainfed
Navsari 12356 11302 10281
Jalalpore 21251 13723 3628
Gandevi 10753 8152 8628
Chikhli 27911 23959 22070
Vansda 7940 7940 22770
Source: CDAP, GoG
Inferences: Comparatively, Vansda taluka is less irrigated and Jalalpore taluka is
relatively more developed in terms of availability of irrigation area vis a vis unirrigated
area.

DIP for NAVSARI: Irrigation for Agricultural Growth
43 | P a g e
CHAPTER 3 WATER AVAILABILITY
3.1: Status of Water Availability: Crop season wise sources of
irrigation
Water available in the district mostly sourced from canal and lift irrigation, the grounds
water availability for agriculture is insignificant. In the district as per the secondary
departmental data, canal irrigation from major and medium sources constitutes 758.76
mcm across all crops under Kaharif, Rabi and summer. Water available from Lift
irrigation for all seasonal crops is 9.03 mcm. Hence, grossly, 767.79 mcm water is
available in the district for growing crops in three crop seasons. At the out-set it is
stated that depending on the year of reporting data across different government sources,
variations data pertaining to area irrigated is observed. However, the tables indicated in
green colour is the final one, which is consider to prepare the DIP strategic plan.
Table 3.1: Source wise Water availability (in mcm)
Sources Kharif Rabi Summer Total
Surface Irrigation
Canal (Major &
Medium
Irrigation)
284.14 235.5 195.09 714.73
Navsari 68.01 61.83 52.8 182.64
Jalalpor 65.12 35.06 29.78 129.96
Gandevi 33.78 23.93 20.27 77.98
Chikhli 85.75 124.61 100.18 310.54
Vansda 4.07 20.33 33.24 57.64
Total 256.73 265.76 236.27 758.76
Lift Irrigation/ Diversion
Chikhli 0.25 0.58 0.4 1.23
Vansda 1.5 2.97 1.22 5.69
Khergam 0.4 0.96 0.75 2.11
Total 2.15 4.51 2.37 9.03
Source: CDAP, GoG
The glance at the intra-district variations reveals that Chikhly taluka has the highest
water availability (310.54 mcm). Area under irrigation also the highest in Chikhali
taluka. The Least water for crops is available in Vansda taluka and area wise the least
area (6721 ha) is only irrigated.
Per drop more crop component focuses on micro-irrigation. In the district 9196 farmers
are practicing drip irrigation on 8524 ha. of land. Extent of drip irrigation is more again
in Chikhali taluka. Hence, available of water is directly proportional to area under

DIP for NAVSARI: Irrigation for Agricultural Growth
44 | P a g e
micro-irrigation. Sprinklers are used by less number of farmers 406 and land under
sprinkler is also only 440 ha. Micro-irrigation is more prevalent in Chikhali and Vansda
(A low irrigated taluka). The following tables provide information on source wise
irrigation and Micro–Irrigation status of talukas in Navsari.
Table 3.2: Source wise irrigation in Talukas (Latest data) (Area in hectares)
Block Canal Pond Well Other Total
Navsari 11302 0 1231 - 12533
Jalalpor 13723 600 1557 20 15900
Gandevi 8152 378 8661 - 17181
Chikhali 23959 520 4546 8084 37109
Khergam 231 - - - 231
Vansdada 7940 67 60 - 8067
Total 65307 1565 16045 8104 91021 Source: Agriculture department, GoG
Table 3.3: Taluka-wise information on drip/sprinkler
Taluka Drip irrigation Sprinkler irrigation
No. of farmers Area (ha) No. of farmers Area (ha)
Navsari 1042 1023 32 40
Jalalpor 1253 1299 107 89
Gandevi 3201 388 - -
Chikhali 2148 3666 188 208
Vansdada 1552 2146 79 103
Total 9196 8524 406 440
Source: GGRC Report (2011)
Table 3.4: Available of water across crop seasons (in mcm)
Kharif Rabi Summer Total
Sources: Surface Irrigation
Canal (Major & Medium
Irrigation)
284.14 235.5 195.09 714.73
Navsari 68.01 61.83 52.8 182.64
Jalalpor 65.12 35.06 29.78 129.96
Gandevi 33.78 23.93 20.27 77.98
Chikhli 85.75 124.61 100.18 310.54
Vansda 4.07 20.33 33.24 57.64
Total 256.73 265.76 236.27 758.76
Lift Irrigation 2.15 4.51 2.37 9.03
Chikhli 0.25 0.58 0.4 1.23
Vansda 1.5 2.97 1.22 5.69
Khergam 0.4 0.96 0.75 2.11
Grand Total 258.88 270.27 238.64 767.79

DIP for NAVSARI: Irrigation for Agricultural Growth
45 | P a g e
Source: WRD, GoG
3.2: Status of Ground Water Availability
Ground Water Recharge
The annual ground water recharge varies from 5894.20 ha m. in Vansda Taluka to
13149.02 ha m. in Gandevi Taluka and total gross recharge for the district is 46893.49
ha m. The net available recharge, after leaving natural discharge for non –monsoon
period varies from 5599.49 (Vansda) to 12491.70 ha m. (Gandevi), the recharge for
district is 44548.82 ha m. The following table provides the details of Draft and recharge
and gaps across the Talukas of Navsari district.
Table 3.5: Ground water availability in Talukas
Name of
the
Block:
Status of Block as per Central
Ground Water Board Notification
Ground Water (BCM)
Critical Semi-Critical Safe Draft Recharge Gap
Vansda - - Safe 0.03398 0.0545519 0.0205719
Chikhli - - Safe 0.044895 0.0802268 0.0353318
Gandevi - - Safe 0.04762 0.0903491 0.0427291
Navsari - - Safe 0.053864 0.082313 0.028449
Jalalpor* - - Safe 0.05316 0.0927224 0.0395624
The level of Ground Water Development varies from 50.90% ( Navsari Taluka) to
63.67% ( Gandevi Taluka) and overall Level of Development for the district is 57.73%.
And, therefore, these have been categorized as “Safe”. The overall category of the district
is also “Safe.”
3.3: Status of Command Area: Village wise information of canal command
Canal command in villages of Navsari Taluka
The details village wise canal command area in Ha. are given in the annexure. However,
a consolidated table on canal command area in different talukas of Navsari district are
mentioned below.

DIP for NAVSARI: Irrigation for Agricultural Growth
46 | P a g e
Table 3.6: Canal command area developed and underdeveloped
No. of
Villages
Canal
Command
Information in the
other Services
Command
Total Area Dev.+No
n-Dev
Taluka Developed
Area
Develo
ped
Area
Undevel
oped
Area
Develope
d Area
Undevelope
d Area
Total
Navsari 59 12356 0 106 12356 106 12462
Jalalpore 71 21251 6 147 21257 147 21404
Gandevi 45 10753 73 10753 73 10826
Chikhli 81 27911 575 413 28486 413 28899
Khergam 4 231 98 203 329 203 532
Vansda 51 7940 163 242 8103 242 8345
Total 311 80442 842 0 81284 1184 82468
In Navsari Taluka there are 59 villages under canal command area and total
developed canal command area is 12356.00 ha. and 106 ha. area in these villages
are under-developed and lies in the other command service area. Total command
area is 12492 ha.
In Jalalporei Taluka there are 71 villages under canal command area and total
developed canal command area is 21251.00 ha. and 147 ha. area and 06 ha in
these villages are under-developed and developed command area respectively lies
in the other command service area. Total command area is 21404 ha.
In Gandevi Taluka there are 45 villages under canal command area and total
developed canal command area is 10753.00 ha. and 73 ha. area and 73 ha in these
villages are under-developed and developed command area respectively lies in
the other command service area. Total command area is 10826 ha.
In Chikhli Taluka there are 81 villages under canal command area and total
developed canal command area is 27911.00 ha. and 413 ha. area and 575 ha in
these villages are under-developed and developed command area respectively lies
in the other command service area. Total command area is 28899 ha.
In Khergam Taluka there are 04 villages under canal command area and total
developed canal command area is 231.00 ha. and 203 ha. area and 98 ha in these
villages are under-developed and developed command area respectively lies in
the other command service area. Total command area is 532 ha.
In Vansda Taluka there are 51 villages under canal command area and total
developed canal command area is 7940.00 ha. and 242 ha. area and 163 ha in
these villages are under-developed and developed command area respectively lies
in the other command service area. Total command area is 8345 ha.
The details village- wise canal command area in Ha. are given as annexure.

DIP for NAVSARI: Irrigation for Agricultural Growth
47 | P a g e
3.4: Existing Type of Irrigation
In Navsari district Govt. canal based irrigation is the dominate source contributing
79269 ha. of land. Irrigation from tanks/Ponds/Reservoirs from community ponds
including small is 219 Ha. and from govt. Reservoir/dam is 836 ha. Ground water
irrigation is very less in Navsari, only 80 ha. are irrigated through bore –wells and
confined to 03 Talukas such as Chikhli, Khergam and Vansda. Further 1073 Ha. land is
irrigated by electric pumps (Lift). Total irrigation from different sources is 80504 ha.
Table 3.7: Existing Type of irrigation in Talukas
Source of
Irrigation
Surfac
e
Irrigati
on (1)
Groun
d
Water
(2)
Treated
effluent
discharge
d from STP
Water
extractio
n devices
/ Lift
Total
Canal
Based
Tanks/Ponds/Reservoirs Bore
well
Electricity
pump (4)
Irrigatio
n
Sources
(1+2+3)
Govt.
Canal
Communit
y Ponds
Including
Small
Govt.
Reservoir
/ Dams
Govt.
No 55 130 4 13
Command
Area (ha)
79369 219 836 80 0 1073 80504
Navsari 12356 0 0 0 0 0 12356
Jalalpor 21251 0 0 0 0 0 21251
Gandevi 10753 0 0 0 0 0 10753
Chikhli 27765 35 575 40 0 146 28415
Khergam 22 7 98 20 0 209 147
Vansda 7222 177 163 20 0 718 7582
Total 79369 219 836 80 0 1073 80504

DIP for NAVSARI: Irrigation for Agricultural Growth
48 | P a g e
CHAPTER 4 WATER REQUIREMENT /DEMAND 4.1: Domestic Water Demand
Population growth has the requirement for additional demand for water for domestic
use. Accordingly, the present population demand for water for domestic use has been
taken the supply at the present scenario. The segment demand for water in Navsari
district is 51.66 MCM at present and likely to increase to 73.61 mcm by the year 2020.
The population projection for the year 2020 has been done on the basis of population
growth in the district during 2001 and 2011 census. Another, key assumption per-capita
water consumption has been taken as an average across rural-urban as 125 litre/day.The
details of water demand for domestic use across Talukas and across rural and urban
area are given in the following table:
Table 4.1: Domestic demand for water in Navsari
Blocks Population
in 2015
Projected
Population in
2020
Gross Water
Demand
(MCM)- 2015
Present Water
demand in mcm
Gross Water
Demand
(MCM)-2020
Navsari 201398 286992 8.14542249 8.14542249 11.60722705
Rural 146987 209457 5.36503572 5.36503572 7.645175901
Urban 54411 77535 2.78038677 2.78038677 3.962051147
Jalalpore 196739 280353 7.391259636 7.391259636 10.53254498
Rural 182335 259828 6.65523261 6.65523261 9.483706469
Urban 14404 20525 0.736027026 0.736027026 1.048838512
Gandevi 240195 342278 9.246161604 9.246161604 13.17578029
Rural 207384 295522 7.56950724 7.56950724 10.78654782
Urban 32811 46756 1.676654364 1.676654364 2.389232469
Chikhli 415235 591710 15.29352117 15.29352117 21.79326767
Rural 405822 578296 14.81249132 14.81249132 21.10780013
Urban 9414 13414 0.48102985 0.48102985 0.685467536
Vansda 309846 441530 11.58466609 11.58466609 16.50814918
Rural 290989 414659 10.62109996 10.62109996 15.13506744
Urban 18856 26870 0.963566128 0.963566128 1.373081732
Total 51.661030988 51.661030988 73.616969158
4.2 Crop Water Demand
As per the water policy, drinking water demand is given priority over any other demand.
But, the DIP is mostly focusing on Har Khet ko pani, accordingly, determination of crop
water demand is crucial for DIP.
This DIP report has the following assumptions for estimating water demand for crops
(Irrigation)

DIP for NAVSARI: Irrigation for Agricultural Growth
49 | P a g e
Assumptions:
Per Hectare, the study has taken the norms for demand for water across different
crop types as provided by authentic sources.
Area under all types of crops are considered for demand estimation
For Horticultural crops, 90 percent assured irrigation is considered for fruits and
100 percent assured irrigation is considered for spices, vegetables and flowers.
The water demand for crops across the Talukas of Navsari are mentioned in the
following table:
Table 4.2: Non-Horticultural Crops demand for water (MCM)
Block Crops Area
sown (Ha)
Irrigated
area (ha)
Crop
Water
Demand
Water
Potential
Required
Existing
Water
Potential
Water
Potential
to be
created
Navsari All types 22637 12356 43.7439 43.7439 43.7016 0.042301
Jalalpore All types 24879 21251 68.89252 68.89252 68.00467 0.88785
Gandevi All types 19381 10753 23.79387 23.79387 23.5809 0.212972
Chikhli All types 49981 27911 149.8363 149.8363 137.4216 12.414628
Vansda All types 30710 7940 182.3218 182.3218 60.97092 121.35091
Total 147588 80211 468.5884 649.3872 333.6797 134.9087
From the above table, it is clear that to provide access to irrigation to total net-sown area
under agricultural crops of 147588 ha. in the district, the demand for water will be
468.59MCM. However, as per existing irrigation facilities, the district has been able to
create water supply for agriculture to a tune of 333.679 MCM. Hence, Gap for
agricultural crop water requirement is 134.9 MCM for net sown area only.
Table 4.3: Horticultural Crops demand for water Block Horticultu
re Area sown (Ha)
Irrigated area (ha)
Crop Water Demand (MCM)
Water Potential Required (MCM)
Existing Water Potential (MCM)
Water Potential to be created (MCM)
Navsari All types 10145 139.454 139.454 127.094 12.36 Jalalpore All types 6652 92.774 92.774 84.308 8.466 Gandevi All types 15332 220.271 220.271 199.5605 20.7105 Chikhli All types 18616 205.079 205.079 191.894 13.185 Vansda All types 16902.87 165.3948 165.3948 159.3588 6.036 Total 67647.8
7 822.972
8 822.972
8 762.2153 60.7575
From the above table, it is clear that to provide access to irrigation to total area under
horticultural crops of 67647 ha. in the district, the demand for water will be 822.97
MCM. However, as per existing irrigation facilities, the district has been able to create

DIP for NAVSARI: Irrigation for Agricultural Growth
50 | P a g e
water supply for agriculture to a tune of 762.21 MCM. Hence, Gap for agricultural crop
water requirement is 60.75 MCM for net horticultural area only.
Table 4.4: Total Crops demand for water
Block Crop Water
Demand (MCM)
Existing Water
Potential (MCM)
Water Potential to
be created (MCM)
Navsari 183.2 170.8 12.4
Jalalpore 161.7 152.3 9.4
Gandevi 244.1 223.1 20.9
Chikhli 354.9 329.3 25.6
Vansda 347.7 220.3 127.4
Total 1291.6 1095.9 195.7
From the above table, it is clear that to provide access to irrigation to total net-sown area
under both agricultural and horticultural crops of 215232.87 ha. in the district, the
demand for water will be 1291 MCM. However, as per existing irrigation facilities, the
district has been able to create water supply for agriculture to a tune of 1095.9 MCM.
Hence, Gap for agricultural crop water requirement is 195.7 MCM.
4.3: Livestock Water Demand:
For the estimation of demand for water for livestock sector, 19th census data on livestock
in India has been used. The growth rate to project the demand for water in 2020,
livestock growth rate between 18th and 19th Livestock censuses have been considered.
Based on the availability of livestock resources in Navsari District an average
consumption water per animal @ 35 litres per day has been considered to estimate the
demand. The following table presents the demand for water coming from the livestock
segment for the year 2015-16 and 2020.

DIP for NAVSARI: Irrigation for Agricultural Growth
51 | P a g e
As per the estimation of demand for water for livestock, the livestock at present
consuming 0.001043143 BCM and it is likely to increase to 0.001356085 BCM.
Table 4.5: Water demand from livestock
Block Total
number
of
livestock
Present
water
demand
(BCM)
Water
Demand in
2020 (BCM)
Existing
water
potential
(BCM)
Water
potential to
be created
(BCM)
Present
water
demand
(MCM)
Navsari 29398 0.000375559 0.000488227 0.0003756 0.000112668 0.375559
Jalalpore 34757 0.000444021 0.000577227 0.000444 0.000133206 0.444021
Gandevi 108835 0.001390367 0.001807477 0.00139 0.00041711 1.390367
Chikhli 34628 0.000442373 0.000575085 0.000442 0.000132712 0.442373
Vansda 81655 0.001043143 0.001356085 0.001043 0.000312943 1.043143
4.4: Industrial Water Demand
In order to determine the present demand for water from industrial segments, major
industries located across the Talukas are considered. Further, to estimate the projected
value state indusrial growth rate was taken as proxy for extrapolation. In the district
Navsari at present the following industries are there:
Table 4.6: Industries in the Talukas
Block Name of the industry
Navsari Navasari Nagarpalika,Navasari (Rajiv Gandhi Madhur Jal Yojana ) (dudhia
Talav)
Navsari Navasari Nagarpalika,Navasari (Rajiv Gandhi Madhur Jal Yojana ) (Desai
Talav)Ward No.1,10&11
Total
Jalalpore Mafatlal Denim Limited, Navsari
Jalalpore Vansi Borsi W.S.Scheme
Jalalpore Dandi Samapor Juth - W.S.S.Navsari
Jalalpore Mangrol Dalaki W.S.Scheme
Jalalpore Hansapor water supply scheme
Jalalpore Sulatanpur Onjal W.S.Scheme
Total
Gandevi Sahakari Khand Udyog Mandal Ltd., Gandevi
Total
Chikhli Valsad Dist. Co.Op.Milk Society, Alipore
Total
Vansda Jhuj juth Water Supply Scheme
Vansda Kelia juth Water Supply Scheme

DIP for NAVSARI: Irrigation for Agricultural Growth
52 | P a g e
The table given below mentions the estimated present and projected water demand
arising from the Industrial segment in MCM. The present industrial water use demand
is 19.003 MCM, whereas the existing potentials water demand is 12.164 MCM. As per
projection, the industrial sector in Navsari district will require 38.12 mcm water in
2020, hence, the water potential to be created to meet the future water demand by 2020
is 25.957.
Table 4.7: Industrial Water demand in Talukas
Water
demand
(MCM)
Water demand
in 2020 (MCM)
Existing Water
potential (MCM)
Water potential to be
created (MCM)
Navsari 11.850 23.700 9.716 13.984
Jalalpore 4.510 9.019 2.076 6.944
Gandevi 0.135 0.270 0.160 0.110
Chikhli 0.166 0.332 0.212 0.120
Vansda 2.342 4.800 0.000 4.800
Total 19.003 38.121 12.164 25.957
4.5: Water Demand for Power Generation: There is no power generation project
in the district.
4.6: Total Water Demand of the District for Various sectors:
Following section presents the overall demand for water in Navsari district. As per the
estimation, total water demand in Navsari district is 1370.46 MCM. Out of the total
demand crop (Agriculture) sector‟s demand is 1291 MCM (94.24%).
Table 4.8: Water demand from all segments
S.No. Block Components Total,
MCM Domestic Crop Livestock Indusrial Power
generation
1 Navsari 8.145 183.198 0.633 11.850 0.000 203.826
2 Jalalpor 7.391 161.667 0.829 4.510 0.000 174.397
3 Gandevi 9.246 244.065 0.806 0.135 0.000 254.252
4 Chikhli 15.294 354.915 3.069 0.166 0.000 373.443
5 Khergam 0.000 0.000 0.000 0.000 0.000 0.000
6 Vansda 11.585 347.717 2.899 2.342 0.000 364.542
51.661 1291.561 8.235 19.003 0.000 1370.460

DIP for NAVSARI: Irrigation for Agricultural Growth
53 | P a g e
Next to agriculture, it is the Domestic sector which needs 51.66 mcm water. For the
livestock and industrial sectors demand for water is 8.24 mcm and 19.003 mcm only.
4.7 Water Budget
The water budget provides an overall picture of supply and demand gap across different
talukas. Both, surface and ground water sources are important to maintain the supply
and demand of water for various sectors. As per the existing water supply infra, in the
district, there is supply of 1152.98 MCM water in the district, whereas the present
demand taking all segments into account is 1370.46 MCM.
Hence, in the district the present gap for water demand is more than the supply by
217.48 MCM. This indicates the district as such has a deficit of water supply. The
projected gap is positive. In Talukas like Navsari, Jalalpore and Chikhli of the district
supply of water exceeds the demand. In Vansdaand Gandevi talukas only in view of
future demand, there is shortage of water supply.
Table 4.9: Water budget (Demand-Supply Gap) Name of
Blocks
Existing water
availability
Total
(MCM)
Water Demand (MCM) Water Gap (MCM)
Surface
Water
Ground
Water
Present Projected
(2020)
Present Projected
(2020)
Navsari 182.64 86.02 268.66 203.83 219.33 -64.834 -49.33
Jalalpore 129.96 87.15 217.11 174.40 182.30 -42.713 -34.81
Gandevi 77.98 77.28 155.26 254.25 258.56 98.9919 103.30
Chikhli 311.77 82.31 394.08 373.44 381.03 -20.637 -13.05
Khergam 2.11 0 0 0.00 0.00 0.00000 0.00
Vansda 63.33 52.43 115.76 364.54 372.79 248.782 257.03
Total 767.79 385.19 1152.98 1370.46 1414.01 217.48 261.03

DIP for NAVSARI: Irrigation for Agricultural Growth
54 | P a g e
CHAPTER 5 STRATEGIC ACTION PLAN FOR
IRRIGATION IN DISTRICT UNDER PMKSY
5.1 Strategic Plan for irrigation in PMKSY
A strategic plan for four years has been prepared starting from 2016-17 to 2019-20. The
demand and supply gaps for water demand has been considered to prepare the
generation of additional water supply for fulfilling the objectives of PMKSY. As per plan
estimate under PMKSY, for the district Navsari total fund requirement is: Rs.
318212.74Lakhs (i.e. 3182.13 Crores). With this proposed planned cost under PMKSY an
additional area of 21222 ha. will be irrigated in the district. Of the total planned cost
estimates WRD share is around 95.4%.
Across the departments and across the components the plan outlays under PMKSY are
mentioned as follows:
Table 5.1: Final Table presenting Plan outlays proposed across departments
Department Concerned Ministry Proposed plan
estimate in Rs. Lakh
Additional
Area irrigated
in Ha.
WRD GoG* MoWR, GoI 301310.00 15135
GLDC Agriculture & Co-
operation
1635.00 3215
GWRDC MoWR, GoI 940.00 268
GSWMA, GoG DoLR, MoRD, GoI 5521.99 2604
GGRC, GoG** MOA & FW-DAC & FW 5932.00
ATMA, GoG Agriculture & Co-
operation
630.00 0
Forest Department -- 2243.75 0
Total 318212.74 21222
* The plan estimates includes costs for coastal area development programme and soil
conservation activities, hence the additional area to be irrigated has been 15,135 ha.
** Additional area is considered as 20% of total command area to be covered under
Micro-irrigation -scheme, as it will lead to saving of water.

DIP for NAVSARI: Irrigation for Agricultural Growth
55 | P a g e
Table 5.2: Component Wise Plan Estimated cost in Rs. Lakh Component Department Plan Estimate in
Rs. Lakh Additional Area irrigated in Ha
Man-days (Estimated)
Har Khet Ko Pani
WRD 8270.00 5023 1102666 GLDC 1635.00 3215.808 220000 GWRDC 940.00 268 4000
Total HKKP 10845.00 8506.80 AIBP WRD 71080 10112 10344000
Per Drop more crop
GGRC 5932.00 3692 391933
Watershed GSWMA 5521.99 3656.66 393783 Capacity Building
ATMA 630.00 0 -
Others WRD 221960 0 22196000 Forest Development (Check dam, Van talavadi, Nalabanding & teres talavadi)
Forest Department
2243.75
The plan estimates under Others by WRD includes costs for coastal area development
programme and soil conservation activities.
Table 5.3: Year Wise Break up of Plan estimate cost in Rs. Lakh
Year GGRC WRD GLDC GWRDC GSWMA ATMA Forest
2016-17 1825.304 75327.5 408.75 235.00 3231.66 150.00 560.93
2017-18 1368.978 75327.5 408.75 235.00 1527.727 155.00 560.93
2018-19 1368.978 75327.5 408.75 235.00 556.98 160.00 560.93
2019-20 1368.978 75327.5 408.75 235.00 206.08 165.00 560.93
Total 5932.237 301310.00 1635.0 940.00 5521.99 630.0 2243.75

DIP for NAVSARI: Irrigation for Agricultural Growth
56 | P a g e
Component wise Plan estimates
Activities under Har Khet Ko Pani (HKP) component are proposed by three
departments such as () Water Resource department, Gujarat state Land Development
corporation and GWRDC.
Activities under AIBP are proposed by one department WRD. Over all water resource
department has sought for 95.45% of total plan estimates.

DIP for NAVSARI: Irrigation for Agricultural Growth
57 | P a g e
5.2 Components
A1.1 Under AIBP Fund requirement is Rs. 71080 lakhs (710.80 Crore)
A1.2 Under Har khet ko pani fund requirement is Rs. 10845.00 lakh (i.e. 108.45 Crore)
A1.3 Under Others type of irrigation activities by WRD is Rs.221960 lakh (i.e. 2219.60
crore)
B. Under PMKSY-Watershed Component [DoLR, Ministry of Rural Development, GoI),
GSWMA fund requirement is Rs. 5521.99 lakh (i.e. 55.22 Crore)
C. under per Drop More Crop, MOA & FW-DAC & FW, GoI, GGRC fund requirement is
Rs. 5932.00 lakh (i.e. 59.32 crore)
D. Capacity Building under PMKSY, Agriculture & Co-operation fund requirement by
ATMA: Rs. 630.00 Lakh (i.e. 6.30 Crore)
E. Forest Development activities involves the plan estimated expenditure Rs. 2243.75
lakh (Rs. 22.437 Crores)
Total Plan outlay for the district proposed under PMKSY is Rs. Lakh318212.74(Around
Rs. 3182.13 Crores)
5.3 Anticipated Outputs and outcomes
Department: Water Resource
AIBP Activities: ERM
Major Irrigation: Extension, Renovation, Modernization & Automation of Branch
canal & Structures including road and side gutter etc.
Medium Irrigation: Extension, Renovation, Modernization & Automation of
Distributor canal & Structures including road and side gutter etc.
Surface Minor Irrigation: Extension, Renovation, & Modernization of Minor
canal & Structures including road and side gutter etc.
Extension, Renovation & Modernization of Link Channels for tanks incl. Inlets,
Outlet channels & Structures etc.
Activities under Hark khet ko pani
Lined Field Channels: Extension, Renovation & Modernization of Field
Channels & Structures etc.
Under Har Khet ko Pani activities of Gujarat State Land Development Corporation Ltd.
are construction and development of Firm Pond, Sim Pond and WHS
GSWMA has proposed several developmental activities and new as well as
renovation of old watershed structures.
New Watershed development: Check dam, Causeway cum check dam,Earthen
Bund/Dam, Village/Community ponds, Veri Vikas, Pond inlet, Pond oulet.
Activities under Renovation of watershed: Renovation/Desilting of Check dam,
Repair check dam, Repair Earthen Dam/Bund, Deepening/Desilting of ponds,

DIP for NAVSARI: Irrigation for Agricultural Growth
58 | P a g e
Deepening/Desilting Percolation Tank,Desilting Farm ponds, Well repairing/recharge,
etc.
Several sub-activities under Agriculture activities, AGRO PROCESSING ACTIVITIES,
Animal Husbandry, Local traditional handicraft, Non-conventional Energy Sources, etc.
are proposed by GSWMA.
Under Entry point activities the plan has included Land development activities and soil
& moisture conservation activities. Further, this segment has included Projection wall,
gully plug, Field outlet, Gutter lines, underground water tank, etc.
GGRC has proposed DRIP irrigation facilities to farmers and ATMA has proposed to
undertake capacity building activities of farmers and other stakeholders.
Output and anticipated impact
As the consequences of implementation of PMKSY in Navsari district, an additional
24914 ha. of land will be irrigated. In view of existing rain-fed area in the district, it is
expected that the district with the creation of above additional irrigated area will have
total 115935 ha. area under irrigation facilities and balance rainfed area will be around
25000-30000 ha.With the proposed investment in irrigation sector, it is anticipated
that 34658190 (around 34.66 crore) man-days will be created through the process of
implementation of irrigation activities. Horticultural crops dominate the agriculture
sector in Navsari, with the implementation of Drip irrigation programmes, the farmers‟
income will increase in the range of 10-20 percent. Per ha. Additional area under
irrigation the average cost is around Rs. 2.45 lakh under certain assumptions that 100
percent fund utilization would lead to generation of additional area under irrigation.
As per 70th NSSO round Key Indicators of Situation of Agricultural Households in
India, Average monthly receipts (Rs.) for crop production per agricultural household for
Gujarat during agricultural year July 2012 – June 2013 was Rs. 5773. Hence, annual
framer‟s household income in the state is Rs. 69276.00. Assuming this state figure as
proxy for the district Navsari, in the post irrigation stage, it is anticipated that
agriculture growth rate will be around 10-11 percent. Hence, the rise in farmer‟s
household income is assumed to grow by10 percent per annum. The average income per
farmer per annum is likely to be Rs. 6900.00. Further, taking an average landholding of
2.2 ha. per farmer, with the irrigation of additional area 24914 ha, around 11324 farmers
will be benefitted. An additional income of Rs. 7.8 crore likely to accrue to the farmers
with the irrigation of 24914 ha. land in the district.

DIP for NAVSARI: Irrigation for Agricultural Growth
59 | P a g e
Key Output Direct Anticipated impact Additional area irrigated- 24914 Ha., Soil Conservation and coastal area Development
1. Enhanced Agri-productivityof 24914 Ha. by 120% (Estimated from Converting Rain into Grain: Opportunities for Realizing the Potential of Rain-fed Agriculture in India, www.iwmi.org 2. Changes in cropping pattern and crop diversification (Double cropping in an additional area of 24,914 Ha, thereby increase in cropping intensity by 150 percent 3. Increase in farmer‟s income for around 11324 farmers from present Rs. 69000 to Rs. 75900 per annum. Hence total gain in terms of income to be accrued to framers approximately is Rs. 7.8 Crore per annum. 3. Around 34 crore man-days will be created after full implementation of planned activities.

DIP for NAVSARI: Irrigation for Agricultural Growth
60 | P a g e
Annexure-I
Department wise plan estimates across the Talukas
A
IBP
Co
mp
on
en
t
ER
M A
ctiv
ity
Mo
WR
, Go
I
WD
R
No. of Units Plan Estimate in Rs. Lakh Additional area irrigated in Ha.
Taluka
Navsari 6 19800 1282
Jalalpore 6 18900 1224
Gandevi 5 7400 479
Chikhli 7 24100 1560
Vansda 5 3870 251
Khergam 3 3510 227
Total 32 77580 5023
Taluka H
ar K
he
t Ko
Pa
ni
Line
d F
ield
Ch
an
ne
l
Mo
WR
WD
R
Unit Plan Estimate in Rs. Lakh Additional area irrigated in Ha.
Navsari 3 1780 2176
Jalalpore 3 1360 1308
Gandevi 3 1070 1308
Chikhli 3 2410 2947
Vansda 2 1090 1333
Khergam 2 560 685
Total 16 8270 10112
Department: WRD, Ministry of Water Resources
Other Works: Coastal Area Development and soil conservation, Drought Proofing
through check, Dams/Water Harvesting Structures, Secondary Storage Structures
(Tank) & others
Taluka Navsari Jalalpore Gandevi Chikhli Vansda Khergam Total
Units 7 9 9 5 5 4 39
Plan Estimates in
Rs. Lakh
39900 96200 22050 35330 22830 5650 221960
Additional Area
under in Ha.
0 0 0 0 0 0 0
Note: Mostly coastal area development.
Department: GLDC, Ministry: Agriculture & Cooperation

DIP for NAVSARI: Irrigation for Agricultural Growth
61 | P a g e
Taluka H
ar K
he
t Ko
Pa
ni
Activity Ag
ricu
lture
& C
oo
pe
ratio
n
GLD
C
No. of
Units
Plan Estimate in Rs.
Lakh
Additional area irrigated in
Ha.
Navsari Farm
Pond
115 128.8 165.6
Sim Pond 20 100 84
WHS 30 33.6 180
Total 165 262.4 429.6
Jalalpore Farm
Pond
100 112 144
Sim Pond 25 125 105
WHS 40 44.8 240
Total 165 281.8 489
Gandevi Farm
Pond
105 117.6 151.2
Sim Pond 25 125 105
WHS 40 44.8 240
Total 170 287.4 496.2
Chikhli Farm
Pond
90 100.8 129.6
Sim Pond 25 125 105
WHS 30 33.6 180
Total 145 259.4 414.6
Vansda Farm
Pond
105 117.6 151.2
Sim Pond 20 100 84
WHS 30 33.6 180
Total 155 251.2 415.2
Khergam Farm
Pond
110 123.2 177.408
Sim Pond 25 125 525
WHS 40 44.8 268.8
Total 175 293 971.208
Grand
Total
975 1635.2 3215.808
Department: GWRDC
Units Plan
estimate in
Rs. Lakh
Additional Area
under Irrigation
in Ha
Units Plan
estimate in
Rs. Lakh
Additional Area
under Irrigation
in Ha
Taluka/
Activity
Exploratory Well: Har Khet Ko pani
LIS: AIBP
Chikhli 2 15 4
Vansda 3 22.5 6 5 360.6 252
Total 6 37.5 10 5 360.6 252
Component: Per Drop More Crop
Department GGRC
Ministry: MOA & FW-DAC & FW

DIP for NAVSARI: Irrigation for Agricultural Growth
62 | P a g e
Year Area (in Ha) under Fund (in Rs. Lakh) under
Drip Irrigation Sprinkler Irrigation Total Drip Irrigation Sprinkler Irrigation Total
2016-17 2444.6 1629.74 4074.34 1642.77 182.53 1825.3
2017-18 1833.45 1222.3 3055.75 1232.08 136.9 1368.98
2018-19 1833.45 1222.3 3055.75 1232.08 136.9 1368.98
2019-20 1833.45 1222.3 3055.75 1232.08 136.9 1368.98
Total 7944.95 5296.64 13241.59 5339.01 593.23 5932.24
Component: Watershed
Department: GSWMA
Ministry: DoLR, MoRD, GoI
Head Activity Name Unit 2016-17 2017-18 2018-19 2019-20
Nos Cost No
s
Cost No
s
Cost No
s
Cost
Workphas
e
Afforestation Ha. 1 1.25 13 17.09 2 4.00
Cause way cum Chek dam No. 31 102.08 29 119.94 5 22.77
Check dam No. 99 351.44 42 150.00 4 12.00 16 47.01
Check wall No. 20 44.65 1 1.00
Countour Bunding Rmt
.
1206 1.14
Culvert No. 1 4.00 3 9.00
Deepening/Desiltation Of Pond No. 27 73.75 27 70.16 23 64.36 5 14.58
De-siltation of Checkdam No. 9 10.58
Drinking water facility No. 1 0.30
Earthern Dam No. 1 0.20
Farm Pond No. 35 19.34
Field Outlet No. 1897 393.66 420 98.00 72 14.42
Gabion structure No. 3 1.15
Gully plug No. 373 18.90 14 4.40
Gutter Line (RCC) No. 10 33.09 10 31.00
Injection Well No. 78 61.26 10 8.00
Land leveling Ha. 992.2
6
170.93 40 8.06 55 13.20 24 5.76
Pasture development Ha. 1 1.00
Percolation Tank No. 31 9.30
Pond Inlet No. 1 1.01 9 11.72 12 19.57 4 6.72
Pond Outlet No. 4 3.20 7 9.39 4 6.10 3 6.17
Protection Wall No. 140 322.70 66 131.53 36 67.52
Repairing of Checkdam No. 9 10.88 40 53.79
Sanitation facilities/Sewerage
line
No. 187 22.42
Stone bunding Rmt
.
3926 2.50 10 0.98
Stone Pitching No. 1 1.00
Underground Water Tank No. 14 8.12 17 16.60 23 23.63
Van Talavadi No. 1 0.16
Veri Vikas No. 15 18.85 22 16.40
Village/Community Pond No. 27 74.84 13 27.80 5 15.00
Water Absorb Trench No. 8 3.31 1 1.58
Well Repairing/Recharge No. 372 203.92 89 52.47 13 12.66
Total 1869.1 890.71 302.46 103.01

DIP for NAVSARI: Irrigation for Agricultural Growth
63 | P a g e
3
Livelihood AGRICULTURE ACTIVITIES No. 62240 602.05 926 140.19 704 76.42 88 21.71
AGRO PROCESSING ACTIVITIES No. 43 26.70 14 12.75 2 1.24 5 1.24
Animal Husbandry No. 1184 282.39 480 140.52 109 30.75 1 1.27
Establishing linkages No.
Local traditional handicraft No. 10 5.57 1 0.20
Minor Activities No. 159 123.37 84 36.02 42 22.27 42 27.88
Non-conventional Energy
Sources
No. 5 1.00 18 2.83
Total 1041.0
7
332.51 130.68 52.10
Others Capacity Buiding & M E 16.83 46.33 31.399
3
12.698
9
Administrative Expenses 151.17 117.71 54.76 19.23
Consolidated Fund 153.66 140.47 37.678
8
19.053
9
Total 321.66 304.51 123.84 50.98
3231.8
6
1527.7
3
556.98 206.09
Block 2016-17 2017-18 2018-19 2019-20
Chikli 1081.48 293.27 131.65 98.26 1604.66
Gandevi 13.68 47.28 68.64 56.85 186.45
Jalalpore 87.9 386.71 232.85 0 707.46
Khergam 505.79 0 0 0 505.79
Navsari 175.77 214.96 0 0 390.73
Vansda 1045.57 281 0 0 1326.57
Other Component 321.66 304.51 123.84 50.98 800.99
3231.85 1527.73 556.98 206.09 5522.65
Note: This is the final plan estimate cost, the table below given the Taluka wise
details, the taluka wise data may not tally with the district cost estimates.
Taluka Sub-Component Additional
Irrigation in Ha.
Plan Estimates in
Rs. Lakh
Man-
days
Navsar
i
EPA 0 103.23 11602
New Watershed Structure 260 154.28 17784
Renovation Watershed
Structure
39.33 32.318 3631
Sub-Activity 0 100.9
Total 299.33 390.728 33017
Jalalp
ore
EPA 0 321.457 36111
New Watershed Structure 297 128.37 14422
Renovation Watershed
Structure
177 54.8094 11466
Sub-Activity 0 191.52 0
Total 773.33 707.46 95016
Gande EPA 0 32.884 3694

DIP for NAVSARI: Irrigation for Agricultural Growth
64 | P a g e
vi New Watershed Structure 184 72.46 9187
Renovation Watershed
Structure
73 29.58 3323
Sub-Activity 0 51.23
Total 257 186.154 16204
Chikhli EPA 0 547.59 41012
New Watershed Structure 593 337.104 41350
Renovation Watershed
Structure
413 217.38 21913
Sub-Activity 0 590.18 0
Total 1006 1692.254 104275
Vansd
a
EPA 0 521.5792 58406
New Watershed Structure 525 170.8034 31440
Renovation Watershed
Structure
395 161.8269 20739
Sub-Activity 0 445.61 0
Total 920 1299.8195 110585
Kherga
m
EPA 0 118.18 13319
New Watershed Structure 198 87.45 6318
Renovation Watershed
Structure
203 117.77 15049
Sub-Activity 0 192.38 0
Total 401 515.78 34686
Grand Total 3656.66 5171.6199 393783
Component Capacity Building
Department: ATMA
Ministry: MoA, GoI
No. of Trainings No. of Farmers Plan Estimate in Rs. Lakh
366 21294 630.00 PROPOSAL OF ATMA PROJECT NAVSARI YEAR 2016-17
SR BLOCK ESTI. COST
1 Navsari 2591564
2 Jalalpore 2291564
3 Gandevi 2291564
4 Chikhli 2591564

DIP for NAVSARI: Irrigation for Agricultural Growth
65 | P a g e
5 Khergam 2154064
6 Vansda 2816814
TOTAL 14737134
+ Contigency 2% 294743
TOTAL 15031877.00
PROPOSAL OF ATMA PROJECT NAVSARI YEAR 2017-18
SR BLOCK ESTI. COST
1 Navsari 2670764
2 Jalalpore 2370764
3 Gandevi 2370764
4 Chikhli 2670764
5 Khergam 2233264
6 Vansda 2896014
TOTAL 15212334
+ Contigency 2% 304247
TOTAL 15516581
PROPOSAL OF ATMA PROJECT NAVSARI YEAR 2018-19
SR BLOCK ESTI. COST
1 Navsari 2753664
2 Jalalpore 2453664
3 Gandevi 2453664
4 Chikhli 2753664
5 Khergam 2316164
6 Vansda 2978914
TOTAL 15709734
+ Contigency 2% 314195
TOTAL 16023929
PROPOSAL OF ATMA PROJECT NAVSARI YEAR 2019-2020
SR BLOCK ESTI. COST
1 Navsari 2827164
2 Jalalpore 2527164
3 Gandevi 2527164
4 Chikhli 2827164
5 Khergam 2389664
6 Vansda 3052414
TOTAL 16150734
+ Contigency 2% 323015
TOTAL 16473749

DIP for NAVSARI: Irrigation for Agricultural Growth
66 | P a g e
Grand Total 63046136.00

DIP for NAVSARI: Irrigation for Agricultural Growth
67 | P a g e
Forest Department Plan Estimates S.
No. Name of the block/taluka
Range Activity Unit Total Requirement for 2016-17
Total Requirement for 2017-18
Total Requirement for 2018-19
Total Requirement for 2019-20
Phy Financial (in lack
Rs.)
Phy Financial (in lack
Rs.)
Phy Financial (in lack
Rs.)
Phy Financial (in lack
Rs.)
1 Vansda Vansda East Checkdam No. 20 100 20 100 20 100 20 100
Vansda West
No. 20 100 20 100 20 100 20 100
2 Vansda Vansda East Nalabanding
Q.m.
2000
3.4 2000
3.4 2000
3.4 2000
3.4
Vansda West
Q.m.
2000
3.4 2000
3.4 2000
3.4 2000
3.4
3 Vansda Vansda East Teres talavadi
(size 2 r.m.)
No. 25 0.013 25 0.013 25 0.013 25 0.013
Vansda West
No. 25 0.013 25 0.013 25 0.013 25 0.013
4 Vansda Vansda East Van talavadi
No. 10 10 10 10 10 10 10 10
Vansda West
Q.m.
10 10 10 10 10 10 10 10
Planning of Renovation
S. No.
Name of the block/taluka
Range Activity Unit Total Requirement for 2016-17
Total Requirement for 2017-18
Total Requirement for 2018-19
Total Requirement for 2019-20
Phy Financial (in lack
Rs.)
Phy Financial (in lack
Rs.)
Phy Financial (in lack
Rs.)
Phy Financial (in lack
Rs.)
1 Vansda Vansda East Checkdam (repairing)
No. 15 45 15 45 15 45 15 45
Vansda No. 15 45 15 45 15 45 15 45

DIP for NAVSARI: Irrigation for Agricultural Growth
68 | P a g e
West
2 Vansda Vansda East Deciltation checkdam
No. 10 50 10 50 10 50 10 50
Vansda West
No. 10 50 10 50 10 50 10 50
Annexure for proposed plan of GSWMA
Sl Activity Unit
Target for FY 2016-17
Unit Cost (In Lakhs)
Storage Volume (Cubic Meter)
Command Area/ Irrigation Potential
In (Ha.)
Person days/Mandays
Planned
Convergence Details
Unit Amount (In Lakhs)
Name of Schemes
1 Animal camp No. 0 0 0 0 0 0 0 0
2 Animal water trough (Havada) No. 0 0 0 0 0 0 0 0
3 Causeway on connecting roads No. 0 0 0 0 0 0 0 0
4 Check / Protection wall No. 0 0 0 0 0 0 0 0
5 Demonstration for Agricultural / Animal Husbandry Productivity Enhancement No. 0 0 0 0 0 0 0 0
6 Drainage line correction (To prevent flooding of Gamtal) rmt 0 0 0 0 0 0 0 0
7 Drinking water facility No. 0 0 0 0 0 0 0 0
8 Fencing for protection from wild animals rmt. 0 0 0 0 0 0 0 0
9 Grassland/Gauchar Development Ha. 0 0 0 0 0 0 0 0
10 Improvised and energy efficient smashan gruh (Cemetery ) No. 0 0 0 0 0 0 0 0
12 Panchayat Well Repair & Pump Room No. 0 0 0 0 0 0 0 0
13 Rain water harvesting system No. 0 0 0 0 0 0 0 0
14 Recharge / Repair of open wells No. 0 0 0 0 0 0 0 0
15 Repair / development of artificial water bodies No. 0 0 0 0 0 0 0 0
16 Revival of natural water bodies with recharge activities No. 0 0 0 0 0 0 0 0
17 Sanitation facilities/Sewerage line No. 187 22.419 0 0 2519 0 0 0
18 Use solar power for productive activities No. 0 0 0 0 0 0 0 0
19 Wind energy development No. 0 0 0 0 0 0 0 0
20 OTHERS (Specifiy activities ) 0 0 0 0 0 0 0 0
21 Aganwadi Shed No. 0 0 0 0 0 0 0 0
22 Computer training for Youth No. 0 0 0 0 0 0 0 0
23 Library book No. 0 0 0 0 0 0 0 0
24 Sport Kit No. 0 0 0 0 0 0 0 0
25 Causeway Repairing No. 0 0 0 0 0 0 0 0
26 RO Plant No. 0 0 0 0 0 0 0 0
27 Repairing of Drinking Water Facility No. 0 0 0 0 0 0 0 0
0 0 0 0 0 0 0 0

DIP for NAVSARI: Irrigation for Agricultural Growth
69 | P a g e
Land Development
0 0 0 0 0 0 0 0
1 Farm Bunding rmt. 0 0 0 0 0 0 0 0
2 Afforestation Ha. 1 1.25 0 0 140 0 0 0
3 Agriculture Demo No. 0 0 0 0 0 0 0 0
4 Agro Forestry Ha. 0 0 0 0 0 0 0 0
5 Horticulture Ha. 0 0 0 0 0 0 0 0
6 Land leveling Ha. 992.26 170.9316 0 0 19206.45 0 0 0
7 Pasture development Ha. 0 0 0 0 0 0 0 0
8 OTHERS (Specifiy activities ) 0 0 0 0 0 0 0 0
9
0 0 0 0 0 0 0 0
10
0 0 0 0 0 0 0 0
11
0 0 0 0 0 0 0 0
12
0 0 0 0 0 0 0 0
Soil & Moisture Conservation 0 0 0 0 0 0 0 0
1 Check wall No. 20 44.65173 0 0 5017 0 0 0
2 Earthen bund No. 0 0 0 0 0 0 0 0
3 Protection Wall No. 140 322.7029 0 0 36259 0 0 0
4 Waste weir No. 0 0 0 0 0 0 0 0
5 Bench Terracing cumec 0 0 0 0 0 0 0 0
6 Bori bandh No. 0 0 0 0 0 0 0 0
7 Brushwood Checks No. 0 0 0 0 0 0 0 0
8 Countour Bunding rmt. 1206 1.13913 0 0 128 0 0 0
9 Countour Trenches rmt. 0 0 0 0 0 0 0 0
10 Earthern Dam rmt. 1 0.2 0 0 23 0 0 0
11 Field Outlet No. 1897 393.6632 0 0 44232 0 0 0
12 Gabion structure No. 0 0 0 0 0 0 0 0
13 Graded Bunding rmt. 0 0 0 0 0 0 0 0
14 Gully plug No. 373 18.90016 0 0 2124 0 0 0
15 Loose boulder Checks No. 0 0 0 0 0 0 0 0
16 Nala Plug No. 0 0 0 0 0 0 0 0
17 Stone bunding rmt. 3926 2.49911 0 0 281 0 0 0
18 Straggred Contour trenching(Terrace Talavadi) 0 0 0 0 0 0 0 0
19 OTHERS (Specifiy activities ) 0 0 0 0 0 0 0 0
20 Gutter Line (RCC) No. 0 0 0 0 0 0 0 0
21 Stone Pitching No. 0 0 0 0 0 0 0 0
22 Water Absorb Trench No. 8 3.30513 0 0 372 0 0 0
23
13 6.62295 0 0 744 0 0 0
Water Harvesting Structure 0 0 0 0 0 0 0 0
1 Cause way cum Chek dam No. 27 86.07781 19656 148 8997 0 0 0
2 Check dam No. 97 343.4371 110452 640.5 35565 0 0 0
3 Village/Community Pond No. 33 98.84413 106084 214 21626 0 0 0
4 Farm Pond No. 35 19.34408 26137 136 4838 0 0 0
5 Percolation Tank No. 31 9.3 12740 217 2612 0 0 0
6 Pond Inlet No. 1 1.00649 468 4 114 0 0 0
7 Pond Outlet No. 4 3.2 1729 13 361 0 0 0

DIP for NAVSARI: Irrigation for Agricultural Growth
70 | P a g e
8 OTHERS (Specifiy activities ) No. 0 0 0 0 0 0 0 0
9 Cause way cum Chek dam repairing No. 0 0 0 0 0 0 0 0
10 Veri Vikas No. 15 18.84654 150 9 2117 0 0 0
11 Underground Water Tank No. 2 1.6579 1202 3 186 0 0 0
12
0 0 0 0 0 0 0 0
Existing/Old Water Harvesting Structure Maintance (Renovation & Repair) 0 0 0 0 0 0 0 0
1 Deepening/Desiltation Of Pond No. 27 73.74643 56494 188 10704 0 0 0
2 Deepening Of Percolation Tank No. 0 0 0 0 0 0 0 0
3 De-siltation of Checkdam No. 9 10.58 10186 59 1189 0 0 0
4 Repairing of Checkdam No. 9 10.882 9784 59 1336 0 0 0
Ground Water Recharging Structures 0 0 0 0 0 0 0 0
1 Dugwell Recharge No. 0 0 0 0 0 0 0 0
2 Farm Recharge Filter No. 0 0 0 0 0 0 0 0
3 Holiya in farm/Field No. 0 0 0 0 0 0 0 0
4 Pond Recharge structure No. 0 0 0 0 0 0 0 0
5 OTHERS (Specifiy activities ) 0 0 0 0 0 0 0 0
6 Injection Well No. 0 0 0 0 0 0 0 0
7 Well Repairing/Recharge No. 372 203.9235 3720 236 22913 0 0 0
8
0 0 0 0 0 0 0 0
9
0 0 0 0 0 0 0 0
Sno Sub Activity Name
0 0 0 0 0 0 0 0
1 AGRICULTURE ACTIVITIES No. 62240 602.0493 0 0 0 0 0 0
2 AGRO PROCESSING ACTIVITIES No. 43 26.7 0 0 0 0 0 0
3 Animal Husbandry No. 1184 282.3866 0 0 0 0 0 0
4 Establishing linkages No. 0 0 0 0 0 0 0 0
5 Local traditional handicraft No. 10 5.57 0 0 0 0 0 0
6 Minor Activities No. 159 123.3675 0 0 0 0 0 0
7 Non-conventional Energy Sources No. 5 1 0 0 0 0 0 0
Capacity Buiding & M E
16.826
Administrative Expenses
151.17
Consolidated Fund
153.66
3231.86
1926.5

DIP for NAVSARI: Irrigation for Agricultural Growth
71 | P a g e
Sl Activity Unit
Target for FY 2017-18
Unit Cost (In Lakhs)
Storage Volume (Cubic Meter)
Command Area/ Irrigation Potential
In (Ha.)
Person days/Mandays
Planned
Convergence Details
Unit Amount (In Lakhs)
Name of Schemes
1 Animal camp No. 0 0 0 0 0 0 0 0
2 Animal water trough (Havada) No. 0 0 0 0 0 0 0 0
3 Causeway on connecting roads No. 0 0 0 0 0 0 0 0
4 Check / Protection wall No. 0 0 0 0 0 0 0 0
5 Demonstration for Agricultural / Animal Husbandry Productivity Enhancement No. 0 0 0 0 0 0 0 0
6 Drainage line correction (To prevent flooding of Gamtal) rmt 0 0 0 0 0 0 0 0
7 Drinking water facility No. 0 0 0 0 0 0 0 0
8 Fencing for protection from wild animals rmt. 0 0 0 0 0 0 0 0
9 Grassland/Gauchar Development Ha. 0 0 0 0 0 0 0 0
10 Improvised and energy efficient smashan gruh (Cemetery ) No. 0 0 0 0 0 0 0 0
12 Panchayat Well Repair & Pump Room No. 0 0 0 0 0 0 0 0
13 Rain water harvesting system No. 0 0 0 0 0 0 0 0
14 Recharge / Repair of open wells No. 0 0 0 0 0 0 0 0
15 Repair / development of artificial water bodies No. 0 0 0 0 0 0 0 0
16 Revival of natural water bodies with recharge activities No. 0 0 0 0 0 0 0 0
17 Sanitation facilities/Sewerage line No. 0 0 0 0 0 0 0 0
18 Use solar power for productive activities No. 0 0 0 0 0 0 0 0
19 Wind energy development No. 0 0 0 0 0 0 0 0
20 OTHERS (Specifiy activities ) 0 0 0 0 0 0 0 0
21 Aganwadi Shed No. 0 0 0 0 0 0 0 0
22 Computer training for Youth No. 0 0 0 0 0 0 0 0
23 Library book No. 0 0 0 0 0 0 0 0
24 Sport Kit No. 0 0 0 0 0 0 0 0
25 Causeway Repairing No. 0 0 0 0 0 0 0 0
26 RO Plant No. 0 0 0 0 0 0 0 0
27 Repairing of Drinking Water Facility No. 0 0 0 0 0 0 0 0
0 0 0 0 0 0 0 0
Land Development
0 0 0 0 0 0 0 0
1 Farm Bunding rmt. 0 0 0 0 0 0 0 0
2 Afforestation Ha. 13 17.09 0 0 1920 0 0 0
3 Agriculture Demo No. 0 0 0 0 0 0 0 0
4 Agro Forestry Ha. 0 0 0 0 0 0 0 0
5 Horticulture Ha. 0 0 0 0 0 0 0 0
6 Land leveling Ha. 40 8.06 0 0 906 0 0 0
7 Pasture development Ha. 0 0 0 0 0 0 0 0
8 OTHERS (Specifiy activities ) 0 0 0 0 0 0 0 0
9
0 0 0 0 0 0 0 0

DIP for NAVSARI: Irrigation for Agricultural Growth
72 | P a g e
10
0 0 0 0 0 0 0 0
11
0 0 0 0 0 0 0 0
12
0 0 0 0 0 0 0 0
Soil & Moisture Conservation 0 0 0 0 0 0 0 0
1 Check wall No. 1 1 0 0 112 0 0 0
2 Earthen bund No. 0 0 0 0 0 0 0 0
3 Protection Wall No. 66 131.5274 0 0 14778 0 0 0
4 Waste weir No. 0 0 0 0 0 0 0 0
5 Bench Terracing cumec 0 0 0 0 0 0 0 0
6 Bori bandh No. 0 0 0 0 0 0 0 0
7 Brushwood Checks No. 0 0 0 0 0 0 0 0
8 Countour Bunding rmt. 0 0 0 0 0 0 0 0
9 Countour Trenches rmt. 0 0 0 0 0 0 0 0
10 Earthern Dam rmt. 0 0 0 0 0 0 0 0
11 Field Outlet No. 420 97.9975 0 0 11011 0 0 0
12 Gabion structure No. 3 1.15 0 0 129 0 0 0
13 Graded Bunding rmt. 0 0 0 0 0 0 0 0
14 Gully plug No. 14 4.4 0 0 495 0 0 0
15 Loose boulder Checks No. 0 0 0 0 0 0 0 0
16 Nala Plug No. 0 0 0 0 0 0 0 0
17 Stone bunding rmt. 10 0.98 0 0 110 0 0 0
18 Straggred Contour trenching(Terrace Talavadi) 0 0 0 0 0 0 0 0
19 OTHERS (Specifiy activities ) 0 0 0 0 0 0 0 0
20 Gutter Line (RCC) No. 10 33.08761 0 0 3713 0 0 0
21 Stone Pitching No. 0 0 0 0 0 0 0 0
22 Water Absorb Trench No. 1 1.58 0 0 177 0 0 0
23
17 16.6 0 0 1865 0 0 0
Water Harvesting Structure 0 1 4 0 0 449 0 0
1 Cause way cum Chek dam No. 17 67.49974 12376 94 7584 0 0 0
2 Check dam No. 39 153.9384 39300 244 17296 0 0 0
3 Village/Community Pond No. 18 66.3 46493 135 11501 0 0 0
4 Farm Pond No. 10 10 12821 72 2809 0 0 0
5 Percolation Tank No. 0 0 0 0 0 0 0 0
6 Pond Inlet No. 4 4.89 1432 15 550 0 0 0
7 Pond Outlet No. 9 11.71893 3217 33 1317 0 0 0
8 OTHERS (Specifiy activities ) No. 3 4.5 1071 11 506 0 0 0
9 Cause way cum Chek dam repairing No. 0 0 0 0 0 0 0 0
10 Veri Vikas No. 8 7.8 1350 5 1324 0 0 0
11 Underground Water Tank No. 14 8.6 140 14 966 0 0 0
12
0 0 0 0 0 0 0 0
Existing/Old Water Harvesting Structure Maintance (Renovation & Repair) 0 0 0 0 0 0 0 0
1 Deepening/Desiltation Of Pond No. 20 54.84353 42861 131 8188 0 0 0
2 Deepening Of Percolation Tank No. 7 15.32 19641 51 4303 0 0 0

DIP for NAVSARI: Irrigation for Agricultural Growth
73 | P a g e
3 De-siltation of Checkdam No. 0 0 0 0 0 0 0 0
4 Repairing of Checkdam No. 36 50.47438 40752 237 5739 0 0 0
Ground Water Recharging Structures 0 4 3.31943 4528 26 374 0 0
1 Dugwell Recharge No. 0 0 0 0 0 0 0 0
2 Farm Recharge Filter No. 0 0 0 0 0 0 0 0
3 Holiya in farm/Field No. 0 0 0 0 0 0 0 0
4 Pond Recharge structure No. 0 0 0 0 0 0 0 0
5 OTHERS (Specifiy activities ) 0 0 0 0 0 0 0 0
6 Injection Well No. 78 61.26 20300 103 6883 0 0 0
7 Well Repairing/Recharge No. 89 52.47092 890 77 5895 0 0 0
8
0 0 0 0 0 0 0 0
9
1 0.3 0 0 33 0 0 0
Sno Sub Activity Name
0 0 0 0 0 0 0 0
1 AGRICULTURE ACTIVITIES No. 926 140.1865 0 0 0 0 0 0
2 AGRO PROCESSING ACTIVITIES No. 14 12.75181 0 0 0 0 0 0
3 Animal Husbandry No. 480 140.5211 0 0 0 0 0 0
4 Establishing linkages No. 0 0 0 0 0 0 0 0
5 Local traditional handicraft No. 1 0.2 0 0 0 0 0 0
6 Minor Activities No. 84 36.02 0 0 0 0 0 0
7 Non-conventional Energy Sources No. 18 2.83 0 0 0 0 0 0
Capacity Buiding & M E
46.33
Administrative Expenses
117.71
Consolidated Fund
140.472
1527.729
1248
Sl Activity Unit
Target for FY 2018-19
Unit Cost (In Lakhs)
Storage Volume (Cubic Meter)
Command Area/ Irrigation Potential
In (Ha.)
Person days/Mandays
Planned
Convergence Details
Unit Amount (In Lakhs)
Name of Schemes
1 Animal camp No. 0 0 0 0 0 0 0 0
2 Animal water trough (Havada) No. 0 0 0 0 0 0 0 0
3 Causeway on connecting roads No. 0 0 0 0 0 0 0 0
4 Check / Protection wall No. 0 0 0 0 0 0 0 0
5 Demonstration for Agricultural / Animal Husbandry Productivity Enhancement No. 0 0 0 0 0 0 0 0
6 Drainage line correction (To prevent flooding of Gamtal) rmt 0 0 0 0 0 0 0 0
7 Drinking water facility No. 0 0 0 0 0 0 0 0
8 Fencing for protection from wild animals rmt. 0 0 0 0 0 0 0 0
9 Grassland/Gauchar Development Ha. 0 0 0 0 0 0 0 0
10 Improvised and energy efficient smashan gruh (Cemetery ) No. 0 0 0 0 0 0 0 0
12 Panchayat Well Repair & Pump Room No. 0 0 0 0 0 0 0 0
13 Rain water harvesting system No. 0 0 0 0 0 0 0 0
14 Recharge / Repair of open wells No. 0 0 0 0 0 0 0 0

DIP for NAVSARI: Irrigation for Agricultural Growth
74 | P a g e
15 Repair / development of artificial water bodies No. 0 0 0 0 0 0 0 0
16 Revival of natural water bodies with recharge activities No. 0 0 0 0 0 0 0 0
17 Sanitation facilities/Sewerage line No. 0 0 0 0 0 0 0 0
18 Use solar power for productive activities No. 0 0 0 0 0 0 0 0
19 Wind energy development No. 0 0 0 0 0 0 0 0
20 OTHERS (Specifiy activities ) 0 0 0 0 0 0 0 0
21 Aganwadi Shed No. 0 0 0 0 0 0 0 0
22 Computer training for Youth No. 0 0 0 0 0 0 0 0
23 Library book No. 0 0 0 0 0 0 0 0
24 Sport Kit No. 0 0 0 0 0 0 0 0
25 Causeway Repairing No. 0 0 0 0 0 0 0 0
26 RO Plant No. 0 0 0 0 0 0 0 0
27 Repairing of Drinking Water Facility No. 0 0 0 0 0 0 0 0
0 0 0 0 0 0 0 0
Land Development
0 0 0 0 0 0 0 0
1 Farm Bunding rmt. 0 0 0 0 0 0 0 0
2 Afforestation Ha. 2 4 0 0 450 0 0 0
3 Agriculture Demo No. 0 0 0 0 0 0 0 0
4 Agro Forestry Ha. 0 0 0 0 0 0 0 0
5 Horticulture Ha. 0 0 0 0 0 0 0 0
6 Land leveling Ha. 55 13.2 0 0 1483 0 0 0
7 Pasture development Ha. 1 1 0 0 112 0 0 0
8 OTHERS (Specifiy activities ) 0 0 0 0 0 0 0 0
9
0 0 0 0 0 0 0 0
10
0 0 0 0 0 0 0 0
11
0 0 0 0 0 0 0 0
12
0 0 0 0 0 0 0 0
Soil & Moisture Conservation 0 0 0 0 0 0 0 0
1 Check wall No. 0 0 0 0 0 0 0 0
2 Earthen bund No. 0 0 0 0 0 0 0 0
3 Protection Wall No. 36 67.51809 0 0 7586 0 0 0
4 Waste weir No. 0 0 0 0 0 0 0 0
5 Bench Terracing cumec 0 0 0 0 0 0 0 0
6 Bori bandh No. 0 0 0 0 0 0 0 0
7 Brushwood Checks No. 0 0 0 0 0 0 0 0
8 Countour Bunding rmt. 0 0 0 0 0 0 0 0
9 Countour Trenches rmt. 0 0 0 0 0 0 0 0
10 Earthern Dam rmt. 0 0 0 0 0 0 0 0
11 Field Outlet No. 72 14.42 0 0 1620 0 0 0
12 Gabion structure No. 0 0 0 0 0 0 0 0
13 Graded Bunding rmt. 0 0 0 0 0 0 0 0
14 Gully plug No. 0 0 0 0 0 0 0 0
15 Loose boulder Checks No. 0 0 0 0 0 0 0 0

DIP for NAVSARI: Irrigation for Agricultural Growth
75 | P a g e
16 Nala Plug No. 0 0 0 0 0 0 0 0
17 Stone bunding rmt. 0 0 0 0 0 0 0 0
18 Straggred Contour trenching(Terrace Talavadi) 0 0 0 0 0 0 0 0
19 OTHERS (Specifiy activities ) 0 0 0 0 0 0 0 0
20 Gutter Line (RCC) No. 10 30.99974 0 0 3483 0 0 0
21 Stone Pitching No. 1 1 0 0 112 0 0 0
22 Water Absorb Trench No. 0 0 0 0 0 0 0 0
23
19 17.60348 0 0 1978 0 0 0
Water Harvesting Structure 0 3 9 0 0 1011 0 0
1 Cause way cum Chek dam No. 0 0 0 0 0 0 0 0
2 Check dam No. 4 12 4528 26 1348 0 0 0
3 Village/Community Pond No. 3 9 11537.1 16 2529 0 0 0
4 Farm Pond No. 2 6 7692 13 1685 0 0 0
5 Percolation Tank No. 0 0 0 0 0 0 0 0
6 Pond Inlet No. 8 13.57 3639 28 1524 0 0 0
7 Pond Outlet No. 4 6 1432 23 674 0 0 0
8 OTHERS (Specifiy activities ) No. 4 6.1 1432 23 685 0 0 0
9 Cause way cum Chek dam repairing No. 0 0 0 0 0 0 0 0
10 Veri Vikas No. 0 0 0 0 0 0 0 0
11 Underground Water Tank No. 4 6.03 4000 4 678 0 0 0
12
0 0 0 0 0 0 0 0
Existing/Old Water Harvesting Structure Maintance (Renovation & Repair) 0 0 0 0 0 0 0 0
1 Deepening/Desiltation Of Pond No. 11 33.19 6384 76 1119 0 0 0
2 Deepening Of Percolation Tank No. 12 31.17 39962 88 6228.393 0 0 0
3 De-siltation of Checkdam No. 0 0 0 0 0 0 0 0
4 Repairing of Checkdam No. 0 0 0 0 0 0 0 0
Ground Water Recharging Structures 0 0 0 0 0 0 0 0
1 Dugwell Recharge No. 0 0 0 0 0 0 0 0
2 Farm Recharge Filter No. 0 0 0 0 0 0 0 0
3 Holiya in farm/Field No. 0 0 0 0 0 0 0 0
4 Pond Recharge structure No. 0 0 0 0 0 0 0 0
5 OTHERS (Specifiy activities ) 0 0 0 0 0 0 0 0
6 Injection Well No. 0 0 0 0 0 0 0 0
7 Well Repairing/Recharge No. 11 8.66 6010 31 973 0 0 0
8
12 12 120 18 1348 0 0 0
9
0 0 0 0 0 0 0 0
Sno Sub Activity Name
0 0 0 0 0 0 0 0
1 AGRICULTURE ACTIVITIES No. 704 76.418 0 0 0 0 0 0
2 AGRO PROCESSING ACTIVITIES No. 2 1.24 0 0 0 0 0 0
3 Animal Husbandry No. 109 30.751 0 0 0 0 0 0
4 Establishing linkages No. 0 0 0 0 0 0 0 0
5 Local traditional handicraft No. 0 0 0 0 0 0 0 0
6 Minor Activities No. 42 22.27 0 0 0 0 0 0

DIP for NAVSARI: Irrigation for Agricultural Growth
76 | P a g e
7 Non-conventional Energy Sources No. 0 0 0 0 0 0 0 0
Capacity Buiding & M E
31.3993
Administrative Expenses
54.76
Consolidated Fund
37.6788
556.9784
346
Sl Activity Unit
Target for FY 2019-20
Unit Cost (In Lakhs)
Storage Volume (Cubic Meter)
Command Area/ Irrigation Potential
In (Ha.)
Person days/Mandays
Planned
Convergence Details
Unit Amount (In Lakhs)
Name of Schemes
1 Animal camp No. 0 0 0 0 0 0 0 0
2 Animal water trough (Havada) No. 0 0 0 0 0 0 0 0
3 Causeway on connecting roads No. 0 0 0 0 0 0 0 0
4 Check / Protection wall No. 0 0 0 0 0 0 0 0
5 Demonstration for Agricultural / Animal Husbandry Productivity Enhancement No. 0 0 0 0 0 0 0 0
6 Drainage line correction (To prevent flooding of Gamtal) rmt 0 0 0 0 0 0 0 0
7 Drinking water facility No. 0 0 0 0 0 0 0 0
8 Fencing for protection from wild animals rmt. 0 0 0 0 0 0 0 0
9 Grassland/Gauchar Development Ha. 0 0 0 0 0 0 0 0
10 Improvised and energy efficient smashan gruh (Cemetery ) No. 0 0 0 0 0 0 0 0
12 Panchayat Well Repair & Pump Room No. 0 0 0 0 0 0 0 0
13 Rain water harvesting system No. 0 0 0 0 0 0 0 0
14 Recharge / Repair of open wells No. 0 0 0 0 0 0 0 0
15 Repair / development of artificial water bodies No. 0 0 0 0 0 0 0 0
16 Revival of natural water bodies with recharge activities No. 0 0 0 0 0 0 0 0
17 Sanitation facilities/Sewerage line No. 0 0 0 0 0 0 0 0
18 Use solar power for productive activities No. 0 0 0 0 0 0 0 0
19 Wind energy development No. 0 0 0 0 0 0 0 0
20 OTHERS (Specifiy activities ) 0 0 0 0 0 0 0 0
21 Aganwadi Shed No. 0 0 0 0 0 0 0 0
22 Computer training for Youth No. 0 0 0 0 0 0 0 0
23 Library book No. 0 0 0 0 0 0 0 0
24 Sport Kit No. 0 0 0 0 0 0 0 0
25 Causeway Repairing No. 0 0 0 0 0 0 0 0
26 RO Plant No. 0 0 0 0 0 0 0 0
27 Repairing of Drinking Water Facility No. 0 0 0 0 0 0 0 0
0 0 0 0 0 0 0 0
Land Development
0 0 0 0 0 0 0 0
1 Farm Bunding rmt. 0 0 0 0 0 0 0 0
2 Afforestation Ha. 0 0 0 0 0 0 0 0
3 Agriculture Demo No. 0 0 0 0 0 0 0 0

DIP for NAVSARI: Irrigation for Agricultural Growth
77 | P a g e
4 Agro Forestry Ha. 0 0 0 0 0 0 0 0
5 Horticulture Ha. 0 0 0 0 0 0 0 0
6 Land leveling Ha. 24 5.76 0 0 647 0 0 0
7 Pasture development Ha. 0 0 0 0 0 0 0 0
8 OTHERS (Specifiy activities ) 0 0 0 0 0 0 0 0
9
0 0 0 0 0 0 0 0
10
0 0 0 0 0 0 0 0
11
0 0 0 0 0 0 0 0
12
0 0 0 0 0 0 0 0
Soil & Moisture Conservation 0 0 0 0 0 0 0 0
1 Check wall No. 0 0 0 0 0 0 0 0
2 Earthen bund No. 0 0 0 0 0 0 0 0
3 Protection Wall No. 0 0 0 0 0 0 0 0
4 Waste weir No. 0 0 0 0 0 0 0 0
5 Bench Terracing cumec 0 0 0 0 0 0 0 0
6 Bori bandh No. 0 0 0 0 0 0 0 0
7 Brushwood Checks No. 0 0 0 0 0 0 0 0
8 Countour Bunding rmt. 0 0 0 0 0 0 0 0
9 Countour Trenches rmt. 0 0 0 0 0 0 0 0
10 Earthern Dam rmt. 0 0 0 0 0 0 0 0
11 Field Outlet No. 0 0 0 0 0 0 0 0
12 Gabion structure No. 0 0 0 0 0 0 0 0
13 Graded Bunding rmt. 0 0 0 0 0 0 0 0
14 Gully plug No. 0 0 0 0 0 0 0 0
15 Loose boulder Checks No. 0 0 0 0 0 0 0 0
16 Nala Plug No. 0 0 0 0 0 0 0 0
17 Stone bunding rmt. 0 0 0 0 0 0 0 0
18 Straggred Contour trenching(Terrace Talavadi) 0 0 0 0 0 0 0 0
19 OTHERS (Specifiy activities ) 0 0 0 0 0 0 0 0
20 Gutter Line (RCC) No. 0 0 0 0 0 0 0 0
21 Stone Pitching No. 0 0 0 0 0 0 0 0
22 Water Absorb Trench No. 0 0 0 0 0 0 0 0
23
0 0 0 0 0 0 0 0
Water Harvesting Structure 0 0 0 0 0 0 0 0
1 Cause way cum Chek dam No. 3 13.5 4784 16.5 1517 0 0 0
2 Check dam No. 18 56.28 52396 304 15031 0 0 0
3 Village/Community Pond No. 0 0 0 0 0 0 0 0
4 Farm Pond No. 0 0 0 0 0 0 0 0
5 Percolation Tank No. 0 0 0 0 0 0 0 0
6 Pond Inlet No. 0 0 0 0 0 0 0 0
7 Pond Outlet No. 4 6.72 1432 24 755 0 0 0
8 OTHERS (Specifiy activities ) No. 3 6.17 1074 16 694 0 0 0
9 Cause way cum Chek dam repairing No. 0 0 0 0 0 0 0 0
10 Veri Vikas No. 0 0 0 0 0 0 0 0

DIP for NAVSARI: Irrigation for Agricultural Growth
78 | P a g e
11 Underground Water Tank No. 0 0 0 0 0 0 0 0
12
0 0 0 0 0 0 0 0
Existing/Old Water Harvesting Structure Maintance (Renovation & Repair) 0 0 0 0 0 0 0 0
1 Deepening/Desiltation Of Pond No. 0 0 0 0 0 0 0 0
2 Deepening Of Percolation Tank No. 5 14.58 18692 37 1638.202 0 0 0
3 De-siltation of Checkdam No. 0 0 0 0 0 0 0 0
4 Repairing of Checkdam No. 0 0 0 0 0 0 0 0
Ground Water Recharging Structures 0 0 0 0 0 0 0 0
1 Dugwell Recharge No. 0 0 0 0 0 0 0 0
2 Farm Recharge Filter No. 0 0 0 0 0 0 0 0
3 Holiya in farm/Field No. 0 0 0 0 0 0 0 0
4 Pond Recharge structure No. 0 0 0 0 0 0 0 0
5 OTHERS (Specifiy activities ) 0 0 0 0 0 0 0 0
6 Injection Well No. 0 0 0 0 0 0 0 0
7 Well Repairing/Recharge No. 0 0 0 0 0 0 0 0
8
0 0 0 0 0 0 0 0
9
0 0 0 0 0 0 0 0
Sno Sub Activity Name
0 0 0 0 0 0 0 0
1 AGRICULTURE ACTIVITIES No. 88 21.706 0 0 0 0 0 0
2 AGRO PROCESSING ACTIVITIES No. 5 1.24 0 0 0 0 0 0
3 Animal Husbandry No. 1 1.27 0 0 0 0 0 0
4 Establishing linkages No. 0 0 0 0 0 0 0 0
5 Local traditional handicraft No. 0 0 0 0 0 0 0 0
6 Minor Activities No. 42 27.88 0 0 0 0 0 0
7 Non-conventional Energy Sources No. 0 0 0 0 0 0 0 0
Capacity Buiding & M E
12.6989
Administrative Expenses
19.23
Consolidated Fund
19.0539
206.0888
397.5

SUGARCANE
CHIKOO