nba
DESCRIPTION
A behind-the-numbers look at the history of the NBA draft lottery.TRANSCRIPT
NBA
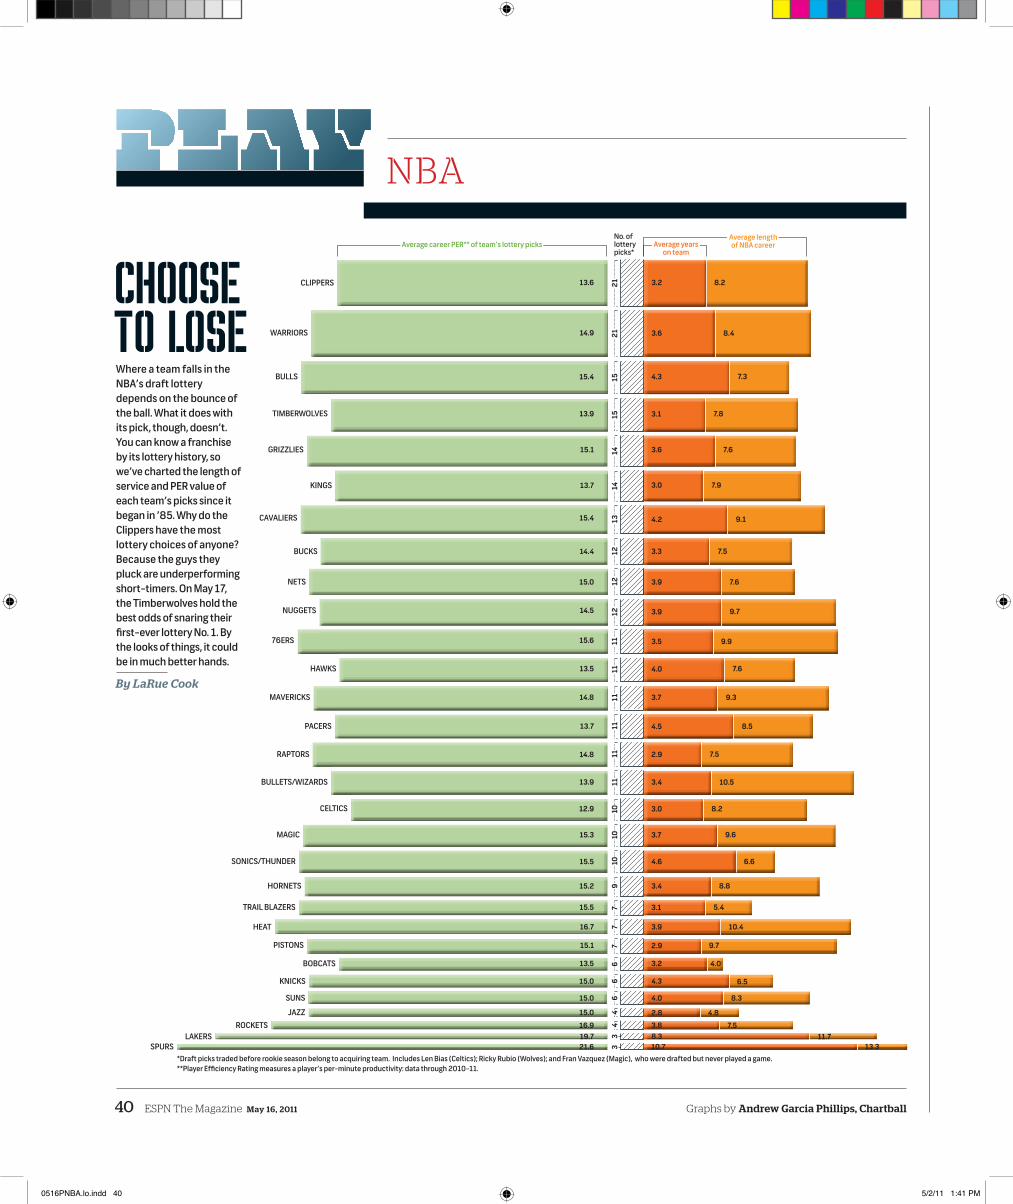
Where a team falls in the NBA’s draft lottery depends on the bounce of the ball. What it does with its pick, though, doesn’t. You can know a franchise by its lottery history, so we’ve charted the length of service and PER value of each team’s picks since it began in ’85. Why do the Clippers have the most lottery choices of anyone? Because the guys they pluck are underperforming short-timers. On May 17, the Timberwolves hold the best odds of snaring their first-ever lottery No. 1. By the looks of things, it could be in much better hands.
CHOOSE TO LOSE
ESPN The Magazine May 16, 2011 40
2121
1515
1414
1312
1212
1111
1111
1111
1010
109
77
76
66
44
33 10.7
8.33.8
2.8
4.0
4.3
3.2
2.9
3.9
3.1
3.4
4.6
3.7
3.0
3.4
2.9
4.5
3.7
4.0
3.5
3.9
3.9
3.3
4.2
3.0
3.6
3.1
4.3
3.6 8.4
7.3
7.8
7.6
7.9
9.1
7.5
7.6
9.7
9.9
7.6
9.3
8.5
7.5
10.5
8.2
9.6
6.6
8.8
5.4
10.4
9.7
4.0
6.5
8.3
4.8
7.511.7
3.213.6
14.9
15.4
13.9
15.1
13.7
15.4
14.4
15.0
14.5
15.6
13.5
14.8
13.7
14.8
13.9
12.9
15.3
15.5
15.2
15.5
16.7
15.1
13.5
15.0
15.0
15.0
16.919.721.6
8.2
13.3
By LaRue Cook
No. of lottery picks*
*Draft picks traded before rookie season belong to acquiring team. Includes Len Bias (Celtics); Ricky Rubio (Wolves); and Fran Vazquez (Magic), who were drafted but never played a game. **Player Efficiency Rating measures a player’s per-minute productivity: data through 2010-11.
CLIPPERS
WARRIORS
BULLS
TIMBERWOLVES
GRIZZLIES
KINGS
CAVALIERS
BUCKS
NETS
NUGGETS
76ERS
HAWKS
MAVERICKS
PACERS
RAPTORS
BULLETS/WIZARDS
CELTICS
MAGIC
SONICS/THUNDER
HORNETS
TRAIL BLAZERS
HEAT
PISTONS
BOBCATS
KNICKS
SUNS
JAZZROCKETS
LAKERSSPURS
Average career PER** of team’s lottery picks Average years on team
Average length of NBA career
Graphs by Andrew Garcia Phillips, Chartball
0516PNBA.lo.indd 40 5/2/11 1:41 PM