nber working paper series maternal employment … · nber working paper series maternal employment...
TRANSCRIPT
NBER WORKING PAPER SERIES
MATERNAL EMPLOYMENT AND OVERWEIGHT CHILDREN
Patricia M. AndersonKristin F. ButcherPhillip B. Levine
Working Paper 8770http://www.nber.org/papers/w8770
NATIONAL BUREAU OF ECONOMIC RESEARCH1050 Massachusetts Avenue
Cambridge, MA 02138February 2002
We would like to thank David Card, Anne Case, Jon Gruber, and Doug Staiger, for helpful discussions, aswell as seminar participants at Princeton, Harvard, Dartmouth, The University of Chicago, University ofIllinois-Chicago and University of Illinois at Urbana-Champaign, The Chicago Federal Reserve Bank, andthe National Bureau of Economic Research Health Economics summer meeting. We are also grateful to JoeHotz and Rebecca Kilburn for sharing their data on state childcare regulations. Rachel Roth providedresearch assistance through the Presidential Scholars program at Dartmouth College. The views expressedherein are those of the authors and not necessarily those of the National Bureau of Economic Research.
© 2002 by Patricia M. Anderson, Kristin F. Butcher and Phillip B. Levine. All rights reserved. Shortsections of text, not to exceed two paragraphs, may be quoted without explicit permission provided that fullcredit, including © notice, is given to the source.
Maternal Employment and Overweight ChildrenPatricia M. Anderson, Kristin F. Butcher and Phillip B. LevineNBER Working Paper No. 8770February 2002JEL No. J13, I12
ABSTRACT
This paper investigates whether children are more or less likely to be overweight if their mothers
work. The prevalence of both overweight children and working mothers has risen dramatically over the
past few decades, although these parallel trends may be coincidental. The goal of this paper is to help
determine whether a causal relationship exists between maternal employment and childhood overweight.
To accomplish this, we mainly utilize matched mother/child data from the National Longitudinal Survey
of Youth and employ three main econometric techniques, probit models, sibling difference models, and
instrumental variables models in this analysis. Our results indicate that a child is more likely to be
overweight if his/her mother worked more intensively (in the form of greater hours per week) over the
child’s life. This effect is particularly evident for children of white mothers, of mothers with more
education, and of mothers with a high income level. Applying our estimates to the trend towards greater
maternal employment indicates that the increased hours worked per week among mothers between 1975
and 1999 led to about a 0.4 to 0.7 percentage point increase in overweight children, which represents a
relatively small share of the overall increase.
Patricia M. Anderson Kristin F. Butcher Phillip B. LevineDepartment of Economics MacArthur Foundation Department of EconomicsDartmouth College Chicago, IL 60603 106 Central StreetHanover, NH 03755-3514 [email protected] Wellesley Collegeand NBER Wellesley, MA [email protected] and NBER

1
The increase in maternal employment and the rise in overweight children represent two of
the most notable trends in the American family over the past several decades. From 1970 to 1999,
the fraction of married women with children under six who participate in the labor force doubled,
rising from 30 percent to 62 percent. Married women with children ages 6 to 17 dramatically
increased their labor force participation as well, rising from 49 percent to 77 percent over this period
(U.S. Bureau of the Census, 2000). The prevalence of overweight children has also soared. Over
the 1963-1970 period 4 percent of children between the ages of 6 and 11 were defined to be
overweight; that level had more than tripled by 1999, reaching 13 percent (Centers for Disease
Control, 2001). Childhood overweight may be one of the most significant health issues facing
children today.1 Thus, a better understanding of its determinants is of critical importance.
The existence of upward trends in both maternal employment and overweight among
children could simply be a coincidence. In fact, the prevalence of overweight and obesity in adults
has increased as well. However, the incidence of overweight in children relative to adults has
increased. In the 1960’s the ratio of overweight among children to adults was about 0.3, but had
risen to almost 0.5 by 1999 (Centers for Disease Control, 2001). The purpose of this paper is to
explore whether the relationship between maternal employment and childhood overweight is causal.2
Using the National Longitudinal Survey of Youth (NLSY), supplemented with additional
information from the 1988-1994 National Health and Nutrition Examination Survey (NHANES III)
and the 1994-1996, 1998 Continuing Survey of Food Intakes by Individuals (CSFII), we first
document the extent to which a raw correlation exists between maternal employment and
1The Surgeon General has been quoted as saying, “This crisis is stealing youth, innocence, and health from our children, and yet as a nation we have been badly remiss in addressing it.” (Mashberg, 1999). 2We focus on the role that maternal employment, rather than parental employment more generally, may play in children’s overweight outcomes for three reasons. First, it is mothers’ labor supply that has changed dramatically over recent decades. Second, despite the dramatic increase in women’s paid market employment, they still bear the bulk of responsibility for child rearing. Third, data limitations in the analysis reported below only enable us to link the
2
overweight. The remainder of the paper attempts to identify whether these simple relationships are
causal, or whether they reflect a spurious correlation in which children whose mothers work full-
time would still be overweight even if their mothers did not work. Our results indicate that those
mothers who worked more intensively, in the form of greater hours per week, since their child’s
birth are indeed significantly more likely to have an overweight child. A mother who worked an
additional 10 hours per week is estimated to increase the likelihood of her child being overweight by
roughly one-half to one full percentage point. This effect is too small to explain a large fraction of
the time series trend in childhood obesity, however, indicating that other factors must have played a
larger role.
I. BACKGROUND
A. The Health Consequences of Childhood Overweight
Being overweight as a child has both immediate consequences and long-term implications for
individuals, as well as for society as a whole. For example, the increase in childhood overweight has
been accompanied by a marked increase in the number of children developing type II onset diabetes,
which has serious health risks (Thompson, 1998). In addition, studies have shown that overweight
children are much more likely to become overweight adults than normal weight children (Bouchard,
1997; and Dietz, 1997). Being overweight may have serious health consequences for adults
including diabetes, coronary heart disease, atherosclerosis, and colorectal cancer (Power, et al.,
1997). Furthermore, being overweight may have social and economic consequences. For example,
studies have shown that obesity is negatively related to education and earnings (Averett and
Korenman, 1996; Gortmaker, et al., 1993; and Cawley, 2000). Moreover, the health consequences
for individuals place additional pressure on the scarce resources of the nation’s health care system.
employment histories of mothers and children.
3
Thus, the importance of a better understanding of the effect of maternal employment on this aspect
of child health is clear.
B. Mechanical Causes of Childhood Overweight
At one level, the causes of overweight are well understood. Taking in more energy than one
expends leads to weight gain, while burning more energy than one takes in leads to weight loss. At
another level, however, the determinants of energy consumption and expenditures across individuals
are less clear. Genetics clearly play a role, but if overweight was only determined by genetics, it is
difficult to imagine that such dramatic and rapid changes in overweight children could have taken
place, as genetics are unlikely to have changed so significantly over the last 30 years. Thus, it is
important to also consider other causes of overweight, including the environmental factors that may
affect either the intake or expenditure of energy.
Looking first at the intake of calories, overweight individuals are more likely than those who
are not overweight to respond to external cues such as the sight of food, the time of day, or
emotional stresses such as anxiety, anger, fear, and sadness (Schachter ,1968; and Zakus, 1982).
Children whose mothers work and spend the day in institutionalized child-care settings, for instance,
with fixed snack and lunch times may learn to eat according to the clock rather than their stomach.
Alternatively, many researchers and public health advocates point to the calorie rich foods that are
readily available to children as causes of overweight (Bar-Or, et al., 1998). Maternal employment
could alter the types of food eaten if, for instance, child care providers are more likely to give
children food that is high in fat and calories. Further, working mothers may rely more heavily on
higher calorie prepared or fast foods, and unsupervised children may make poor nutritional choices
when preparing their own after-school snacks. The additional earnings from work, however, could
4
allow healthier foods to be chosen, and daycare may teach children about nutrition, suggesting that
maternal employment may actually reduce the consumption of such foods.
Energy expenditure is the other side of the overweight puzzle. Thus, any change in
sedentariness attributable to maternal employment provides a mechanism for an effect on childhood
obesity. Again, in theory the possible effect could be positive or negative. For example, one source
of after-school activity is organized sports, which may increase activity. Alternatively, unsupervised
children may spend a great deal of time indoors, perhaps due to safety concerns, watching television
or playing video games rather than engaging in more active pursuits.
C. An Economic Model of Childhood Overweight
Childhood overweight can be placed within the context of a standard economic model of
household production. This framework assumes that utility is generated through the consumption of
time-intensive and goods-intensive commodities, with a tradeoff existing between the two. Time
can be spent either in home production or in paid market work, leading to a family budget constraint.
Assuming that investing in their children brings utility to the family, then one of the decisions to be
made is the amount of that investment in terms of parental time and purchased goods and services.
The more time spent in market work, the less time is available for time-intensive household
investments in children. However, the more time spent in market work, the more money is available
for goods-intensive household investments in children. Paid child care, for example, is thus simply a
goods-intensive method of producing the investment in one’s child.
Within this framework, perfectly functioning markets would enable children’s outcomes to
be optimized regardless of whether investments in the children were provided directly by the parents
or purchased. If a mother chose to work, the optimal level of investment in her children’s nutrition
would be made through the use of paid services rather than the mother’s own care. It is important to
5
note in this regard that the “optimal” nutritional outcome for a child is the one that maximizes family
utility and does not preclude an overweight child.3
Market imperfections, however, may exist that lead to a positive relationship between
maternal employment and child overweight. For instance, information problems may hinder a
family in making an optimal decision. Families may be unaware of the potential long-term effects of
overweight. Identifying the quality of available child care may be difficult. Parents may not be
well-educated about the nutritional values of different food items. Overall, then, even if families are
rational decision-makers, maternal employment may have an effect on children’s overweight.
D. Past Evidence on Childhood Overweight
Although little research has directly examined the impact of maternal employment on
childhood overweight, past work on other determinants may help inform this issue. Many studies
have found a strong correlation between parent and child weight problems, (c.f. Vuille and Mellbin,
1979; Dietz, 1991), although such a correlation could be due to either genetic or behavioral factors.
As indicated above, though, while a genetic explanation for overweight is compelling, other factors
must play a role as well based on the dramatic trends in overweight in the United States over the last
few decades.
Thus, researchers have turned to environmental factors ( c.f. Locard, et al., 1992; Woolston,
1987; Bar-Or, et al., 1998). The evidence shows a positive correlation between television viewing
and overweight among children (c.f. Gortmaker, et al., 1996; and Dietz and Gortmaker, 1985).
Findings regarding the relationship between family structure, socioeconomic status, and childhood
overweight are more mixed. Sobal and Stunkard (1989) find a weak correlation between low
socioeconomic status and obesity for children, but Dietz (1991), Gerald, et al. (1994) and Wolfe, et
3It is also possible that parents receive utility directly from feeding their children. See Jain et. al. (2001) for information
6
al. (1994) find a stronger one. Similarly, studies have tended to find a relationship between family
structure and obesity, although results across studies are not always consistent (c.f. Dietz, 1991;
Wolfe, et al., 1994; and Gerald, et al., 1994). Researchers have also examined the influence of the
types of foods children eat, but the role of parental involvement in this regard is also mixed (c.f.
Klesges, et al., 1991; and Birch and Fisher, 1998). Finally, recent work on breastfeeding suggests
that infants who are breastfed may be less likely to be overweight later in life than those who are not
(von Kries, et al. 1999, Gilman, et al. 2001).
Research specifically examining the link between maternal employment and childhood
overweight is very limited. Takahashi, et al. (1999) finds a positive relationship between mothers’
employment and children’s probability of being overweight, but the data are only for 3-year-old
Japanese children. Additionally, Johnson, et al. (1992) study US children age 2-5 in 1987-88 and
find no significant effect of maternal employment on nutrient intake.
II. ECONOMETRIC APPROACH
A simple model of children’s overweight in the present context may be formally specified as
follows:
(1) Weighti = β0 + β1Energyi + β2Caloriesi + ui
(2) Energyi = γ0 + γ1Eim + γ2Xi
p + γ3Xic + vi.
(3) Caloriesi = δ0 + δ1Eim + δ2Xi
p + δ3Xic + ei.
In this model, weight (and hence the probability of overweight) is related to energy expenditure and
calorie intake. Each of these factors is affected by maternal employment, Em, and other
characteristics of the child and his/her parents (Xc and Xp, respectively), including things like
socioeconomic status, demographics, educational attainment and, importantly, measures of the
on how mothers of overweight children feel about feeding their children.
7
mother’s weight. The specific measures used are described in more detail below. A reduced form
version of this model, in terms of the probability of overweight, may be specified as:
(4) P(Weighti > C) = φ0 + φ1Eim + φ2Xi
p +φ3Xic + εi.
We report variants of equation (4), estimated as probit models on the probability of overweight,
below.
An important extension of this model is that it allows us to obtain some indication of the
dynamics of changes within the family on our outcomes of interest. For example, if a very young
child’s mother works, it may affect his/her nutritional status as an older child. We can allow for this
possibility by including maternal employment in, say, the child’s first few years of life in our model.
The estimates obtained from these models may be subject to bias, however, because those
mothers who are more likely to work may have other traits that also affect their children’s health
status. If these traits can be observed, they can be included as explanatory variables in the
regression models. If they cannot be observed, however, they may introduce omitted variable bias.
For example, if a mother suffers from depression, it may affect her ability to work and her ability to
properly oversee her child’s diet and level of exercise. As a result, we would find a spurious
negative relationship between maternal employment and childhood overweight. Alternatively,
consider a strongly achievement-oriented mother who strives to succeed in the world of work and
pays less attention to her child’s nutrition. Here we would find a positive relationship between
maternal employment and childhood overweight but, again, it would not be causal. If the mother
was not working she would be engaged in some other activity, like community service, that would
similarly distract her from her child’s nutritional needs.
We address the important statistical problem of unobservable heterogeneity using two
additional approaches. Both have weaknesses, but the advantage of using multiple approaches to
estimate our basic model is that if we obtain consistent findings across approaches, that will

8
considerably strengthen the reliability of our findings. The first technique estimates differences in
siblings’ weight status either at a particular point in time or at the same age as a function of
differences in maternal employment. A mother may continue working after the birth of one child,
for instance, but decide to remain home after the birth of another. Therefore, differences would exist
in maternal employment between siblings that may lead to differences in subsequent outcomes like
overweight as a young child. This sibling difference approach is useful because it eliminates the
influence of any characteristic of the siblings’ mother/family that is constant over time. This
approach can provide stronger evidence of a causal relationship between maternal employment and
children’s outcomes than the previous models, because fixed characteristics of mothers have been
controlled for even though they may not have been observed.
Models of sibling differences do have some limitations, however. Primarily, they are
identified based on changes that occur within the family between siblings and over time, and one
may question why those changes are taking place. A mother may quit her job because her child is
experiencing weight-related health problems, for instance, suggesting that such changes may be
endogenous and leading to biased estimates of the impact of maternal employment. Similarly, a
mother may experience a stressful divorce and be forced to enter the labor market, but it may be the
divorce and not her working per se, that leads her kids to overeat. In other words, this approach is
only properly identified to the extent that differences in exposure to maternal employment across
siblings are exogenous to the children’s development.
An instrumental variables (IV) model is the second approach we employ to try to eliminate
the bias due to the endogeneity of maternal employment. This approach requires the availability of
variables that are related to maternal employment, but not to those characteristics that are not
otherwise controlled for in the regression (i.e. the error term, εi). We use the variation between
states and over time in child care regulations, wages of child care workers, welfare benefit levels, the
9
status of welfare reform in the state, and the mean wage and education level of married men under
the age of 60.4 We use a number of different measures, since collectively they are likely to better
predict mother’s decisions. Because the residuals in a model of children’s overweight status are
unlikely to be related to these geographic variables, our model should be appropriately identified.
III. DESCRIPTION OF THE DATA
To conduct our analysis, we mainly use data from the NLSY, but supplement that with
additional data from the NHANES III, and the CSFII. The NLSY first surveyed 12,686 individuals,
6,283 of whom are women, between the ages of 14 and 22 in 1979 and has continued to survey them
annually through 1994 and biannually since then. Beginning in 1986, and every other year since
then, the children of those women have been surveyed as well. Through 1996, over 10,000 children
have been born to these mothers, representing about 80 percent of the children who are likely to be
born to them based on comparisons of this cohort to Vital Statistics birth data. At the time we began
this project, data were available through the 1996 survey year for mothers and children; we restrict
our analyses to these data.
Importantly, a large number of assessments have been conducted for those under age 15 to
measure the children’s development, including a child’s height and weight that is necessary to
calculate their Body Mass Index (BMI). BMI is defined as weight in kilograms divided by height in
meters squared (kg/m2) and is a commonly used measure to define obesity and overweight in adults.
According to guidelines in National Institutes of Health (1998), adults are considered underweight
if their BMI is less than 18.5, overweight if their BMI is 25 or more, and obese if their BMI is 30 or
more. Use of the BMI to assess children has been more controversial, although its use is fairly
4We have also experimented with using the state level unemployment rate as an instrument, but have chosen not to use it in the models we estimate and report. The unemployment rate may not be a valid instrument if, say, a recession causes stress within the family (economic or otherwise) that alters eating patterns. Nevertheless, the estimates obtained when we included the unemployment rate as an instrument were quite similar to those reported below.
10
widespread.5 The Centers for Disease Control (CDC) has just endorsed the use of BMI to assess
overweight in children, and has produced sex-specific growth charts for children aged 2 to 20 for
just this purpose.6 We use these growth charts to define overweight for children in our samples. For
children, the nomenclature is somewhat different than for adults. Children with a BMI above the
85th percentile of the BMI distribution for their sex-age group are defined as “at-risk of overweight;”
those with a BMI above the 95th percentile for this distribution are termed “overweight.” It is
important to note that these percentile cutoffs are based mainly on data from years before our survey
began, so that trends in overweight can be detected.7
The NLSY also provides ample data to measure the key explanatory variables required for
our analysis as well as a wide variety of other control variables.8 Regarding mother’s employment, a
virtually complete work history for each mother is available. In addition to contemporaneous
measures of mother’s employment, we can calculate total weeks worked and total hours worked
starting from the date of the child’s birth until the survey date in 1996.9 In this way we can compute
lifetime maternal employment measures, as well as measures for specific years of life, such as the
first three years.10 In addition to these data, the NLSY also provides a wide array of information on
5Recently, Dietz and Bellizi (1999) reporting on a conference convened by the International Obesity Task Force, noted that the BMI “offered a reasonable measure with which to assess fatness in children and adolescents.” Additionally, they conclude that a BMI above the 85th percentile for a child’s age and sex group is likely to accord with the adult definition of overweight, and above the 95th percentile with the adult definition of obese. 6See http://www.cdc.gov/growthcharts/ for general information, and see http://www.cdc.gov/nchs/about/major/nhanes/growthcharts/bmiage.txt for specific BMI percentiles. 7While the new growth charts are based on data from 1963-1994, the 1988-1994 data from NHANES III is exluded in order to reflect increasing overweight. Prior to the release of these growth charts, percentiles based entirely on NHANES I from 1971-1974 had been available for older children. The newly released cutoffs are similar. 8Sample means for all the variables used from the full NLSY sample are reported in Appendix Table. 9 Only children born after the start of the survey are included in the sample. 10The child care choices of mothers who work is likely an important element in determining their children’s outcomes and the NLSY does provide some limited information on child care use. This information mainly consists of the types of arrangements used in the child’s first three years of life for almost all children. Data on the characteristics of current care in each year are not as complete. Basic information on the type of care used for the youngest child is collected in 1982, 1983, 1984, and 1985. In 1986 and 1988 detailed information, including quality measures, on the current arrangement is collected for all children. Information on enrollment in nursery or preschool was also available in 1988, 1990, 1992, 1994 and 1996 for children over 3, and not yet in regular school. In these years, for those between the ages of 10 and 14

11
other characteristics of respondents. Plentiful information exists regarding demographics, family
income, characteristics of respondents’ parents (the grandparents of the children assessed), and the
like.
Although the NLSY is ideal for all of the planned reduced form models, and contains limited
information on physical activity, such as measures of television viewing, it provides no information
on food intake. Thus, we also use the NHANES and CSFII to supplement the NLSY. Both the
NHANES and the CSFII include detailed 24-hour recall food intake information. Both are cross-
sectional data sets, providing snapshots of children’s nutrition at a particular point in time.
However, both have only contemporaneous measures of maternal employment.11 Both the
NHANES and the CSFII also include measures of television viewing that we exploit in our analysis
below. In laying out the basic facts about nutrition intake, energy expenditures and resulting
probability of overweight, we provide the background necessary for interpreting the results from the
more formal models that follow.
IV. EMPIRICAL ANALYSES
A. Descriptive Analysis
We begin our analysis by providing a descriptive examination of the relationship between
nutritional measures and television viewing patterns among children that differ by their mothers’
employment using all three of the datasets available to us. In Table 1 we examine differences by
current maternal employment status. The first two rows indicate the percentage of children who are
we can identify who cared for them (including extended day programs) after regular school ended. In our analysis, we experimented with including measures of early life child care exposure as well maternal employment, but found the data were not sufficiently powerful to differentiate across modes of care among children whose mothers worked. Further analysis of the role of types of care, as well as its quality, should be pursued in future research. 11Unfortunately, because young children are oversampled in the NHANES, not all children have mothers in the sample. Additionally, the relationship between sample members is not always clear. We experimented with using only households with just 1 adult woman, or just 1 woman between the ages of 20 and 50. Of 10,649 adult women, 1,956 were deleted in this manner. Another 5,426 had no children. Of the 13,944 sampled children, only 6,339 had a matching woman in the household.
12
overweight or at-risk of being overweight. These data display no clear pattern by current maternal
employment status. Overall, the NHANES III and NLSY data are roughly consistent in finding that
11 to 12 percent of children are overweight and about one-quarter are at-risk of overweight. Data
from the CSFII indicate substantially higher levels of these outcomes, potentially due to
measurement error created by parent-reports of children’s height and weight in those data.12
Nevertheless, patterns across current maternal employment status are similar in that no evidence
exists that children of mothers who work more are more likely to be overweight.
Supporting this finding, these data show few differences in the food consumed or the amount
of television viewed per day across these groups of children.13 The CSFII provides the most
evidence in this regard, highlighting that there is little obvious pattern in calories consumed, calories
from fat, or levels of consumption of many food groups. Interestingly, both the CSFII and the
NHANES data indicate that fast food consumption is considerably higher among children whose
mothers work, despite the fact that this does not translate into detectable differences in calorie
consumption or levels of overweight.14 Among working mothers, however, those with full-time
schedules are more likely to have an overweight child.
A potential reason why these findings are relatively weak is that overweight is a condition
that develops over time, not instantaneously in response to changes in a child’s environment. An
12We pursued this discrepancy in measures of overweight with representatives of the federal agency that puts out the CSFII (U.S. Department of Agriculture, Food Services Research Group) and this was the only reason they could put forward to explain it. Since federal reports using these data concentrate on the food consumption measures rather than BMI, they had not investigated the problem. In the NLSY, about 20 percent of observations have a mother reported height or weight. If both are mother reported, the child is 8 percentage points more likely to be classified as overweight. 13The television viewing estimates in the NLSY are considerably higher than that in the other surveys. We suspect that many of the respondents in the NLSY based their answers to these questions on a weekly rather than a daily frame of reference. This suspicion is based upon the relatively large number of individuals who said they watched TV for exactly 10, 15, 20, or even longer than 24 hours in a day. 14Regression-based estimates that control for a variety of characteristics of the mother and the child do not substantially alter the nature of the results presented in Table 1.
13
alternative approach is to compare children’s level of overweight with the extent to which their
mothers worked since they were born.
Table 2 presents the evidence we are able to bring to bear on this question given the available
data. Here we are unable to use the CSFII, which contains no information on anything other than the
mother’s current employment status. With the NHANES, we construct a proxy measure for lifetime
employment, representing an indicator for whether a child was enrolled in a child care center for
longer than 10 hours per week before the age of 4. Although such a measure obviously does not
capture all of the variation in maternal employment across a child’s life, we hypothesize that
mothers of children who satisfy this condition are likely to work over more of their children’s lives
than other mothers. In the NLSY we have extensive data on maternal employment over the child’s
lifetime. For this analysis, we divide children into categories based on the average hours per week
the child’s mother worked since the child’s birth. Here, we treat mothers who worked at least 35
hours per week since the child was born as those who have been full-time workers over the child’s
life. Therefore, these groups loosely distinguish between mothers who worked full or part-time from
those who never worked since their child was born.
Separating the samples in these ways provides some indication that children of mothers who
worked a lot since the child was born are more likely to be overweight or at-risk of this condition.
For instance, in the NHANES III, those children who were enrolled in a child care center for 10 or
more hours per week by age 4 were a full percentage point more likely to be overweight than those
children who were not. As in Table 1, fast food consumption is also higher for those children whose
mothers worked, although no difference in television viewing is detected.
With better measures of lifetime exposure to maternal employment in the NLSY, we find
bigger differences in overweight. Children whose mothers while working averaged 35 or more
hours per week since the child was born are 2 to 3 percentage points more likely to be overweight
14
and 5 to 7 percentage points more likely to be at-risk of overweight compared to those children
whose mothers did not work at all or who worked part-time. These absolute differences are large
relative to the base level of overweight and at-risk of overweight among children whose mothers
either do not work or who work part-time, representing increases on the order of 25 percent. The
nonlinearity in these findings is important to note; based on these results we find no evidence
suggesting that working part-time is associated with higher rates of overweight. While still only
descriptive, this result is consistent with a model in which full-time work implies a higher level of
substitution from time-intensive to goods-intensive inputs, such as potentially higher calorie fast
food.
B. Multivariate Analysis
This section reports the results of our estimation of the econometric models described earlier
using data from the NLSY. Throughout this analysis, we focus on a binary dependent variable
indicating whether or not a child is overweight.15 We also experiment with alternative measures of
maternal employment, including current employment, employment over the child’s lifetime, and
employment while the child was very young.
Table 3 presents probit estimates where maternal employment is measured over the last
calendar year. The first column is designed to approximate the results reported in Table 1.16 As we
reported earlier, without controlling for other factors there is no clear pattern in children’s
overweight status as a function of mother’s current employment. Again, without controlling for
other maternal characteristics, it is difficult to draw any substantive conclusions. For instance, as
15We have also estimated comparable models using an indicator for at-risk of overweight and BMI as a continuous measure as dependent variables and obtained qualitatively similar results. 16 All models include a variable indicating whether the child’s height and weight were physically measured or reported by the child’s mother. While not shown, mothers appear to underestimate the child’s height, resulting in those children being more likely to be classified as overweight.

15
shown in Appendix Table 1, the observed characteristics of mothers who don’t work, who work
part-time and who work full-time are considerably different.
In Column 2 of this table, we alter the specification of maternal employment to include
measures of weeks worked and hours worked per week in the past calendar year.17 We include both
weeks worked and hours per week worked, rather than simply a total hours measure, as it helps us to
distinguish between those mothers who work a lot, but intermittently, from those who consistently
work at a lower intensity.18 In this specification, we find that, holding constant the number of weeks
worked in the past year, every additional 10 hours per week that a mother worked increases her
child’s likelihood of being overweight by 0.8 percentage points.
The remainder of the table includes additional explanatory variables. Among other variables,
Column 3 includes indicator variables for African-American and Hispanic, the mother’s level of
education, family size, and an indicator variable for whether the child is first born. To the extent
that any of these variables are related to both weight status and maternal employment, omitting them
could introduce bias into the analysis. For instance, past evidence shows that minority children are
more likely to be overweight. If minority mothers also have different employment patterns, an
analysis that does not hold race/ethnicity constant may incorrectly attribute differences in children’s
weight status to differences in maternal employment.
17 We have also estimated models analogous to those reported in Columns 2 through 5 of Tables 3 and 4, but continuing to use the same measures of part-time and full-time status in Column 1 of these tables. Throughout the analysis, we consistently find a positive and significant effect of working full-time, but an insignificant effect of working part-time. 18 We have also experimented with estimating a model that includes quadratic measures of hours worked per week to determine whether or not the impact of working intensively is non-linear. The results indicated that the squared term was very small and statistically insignificant. We have also estimated this and subsequent models including an indicator variable for whether the mother worked at all (either in the last year or ever, depending upon specification). In all models, the coefficient on this variable is very small and statistically insignificant, leaving all other coefficients unchanged. Therefore, one can interpret the coefficient on work intensity as an interaction of hours worked and that indicator variable.
16
In fact, results in column 3 do show that including these control variables reduces the
coefficient on average hours per week worked from 0.8 percentage points to 0.5, while the number
of weeks worked remains insignificant. Among the other variables included in this specification,
African American children are found to be significantly more likely to be overweight than other
groups. Mother’s education has a negative and significant effect on the probability that her child is
overweight – an extra year of education reduces the probability that a child will be overweight by
0.6 percentage points. Children from larger families are also less likely to be overweight, although
being the first-born child is not significantly related to the probability of being overweight.
As with the work variables, there is a question of how to interpret these other coefficients.
For instance, maternal education may have a causal impact on childhood overweight, or mothers
with more education may have other attributes that are different and reduce the likelihood that their
children will be overweight. In this paper, we focus on causality as it relates to employment and
subsequent models are designed to address that issue. However, we will also discuss the
interpretation of these other measures, keeping the issue of their causal effect in mind.
Column 4 includes all the controls in column 3 as well as additional controls for whether the
child was ever breastfed, the mother’s weight status, and the child’s birth weight. As discussed
earlier, recent evidence (von Kries, et al. 1999, Gilman, et al. 2001) suggests that children who were
breastfed are less likely to develop weight problems by the time they are school aged. Mothers with
demanding work schedules may be less likely to find the time to breastfeed, and this is a possible
pathway through which maternal work may affect childhood overweight. Additionally, maternal
nutrition may affect the child’s birth weight, and thus the later probability of being overweight.
Mother’s weight status may reflect the impact of genetics on the child’s likelihood of being
overweight.19
19 In a sense, including mother’s weight may be “overcontrolling” for the home environment. If working mothers are
17
Although the additional variables included in column 4 do not change the estimated impact
of hours per week or weeks worked, they are found to be related to childhood overweight. We
estimate that children who are breastfed are about 2.3 percentage points less likely to be overweight.
Again, the interpretation of this finding is unclear – there may be nutritional value in breastmilk that
affects children’s health later in life, or it may simply be that mothers who breastfeed are more
attentive to their children’s nutrition throughout the children’s lives. Mothers’ weight is also found
to have a large impact on their children’s weight status. Note that a mother with a BMI of at least 30
(obese) also has a BMI of at least 25 (overweight). Therefore, a child whose mother is obese is a
full 8.2 percentage points (the sum of the two coefficients) more likely to be overweight.
Column 5 also includes controls for average family income since the child’s birth and the
percent of the child’s life that the mother was married. Average family income since the child’s
birth is a proxy for permanent income, which should be a better measure of parents’ long-term
ability to meet their children’s needs. Similarly, the percent of the child’s life for which the mother
was married is a measure of the long-term resources available to the family. Again, the inclusion of
the additional variables in Column 5 does not affect the estimated impact of the maternal
employment variables. Moreover, we find no effect of family income or mother’s average marital
status on childhood overweight.20
Since it takes time for children to become overweight, in Table 4 we estimate multivariate
models relating a child’s probability of overweight to the amount their mother worked since the
child’s birth. In Column 1, we again present estimates from a model that is analogous to the cross-
tabulation presented in Table 2; we similarly find that children of mothers who have worked, on
time constrained and are more likely to rely on calorie-rich prepared and fast foods, then we would expect everyone in the family to be more likely to be overweight when the mother works. 20 The insignificance of family income appears to be due to the fact that socioeconomic status is well controlled for by race, education, AFQT score and grandparents’ education. If we include income without these other variables, we find the anticipated effect that overweight is negatively correlated with income.
18
average, 35 or more hours per week since they were born are about 2 percentage points more likely
to be overweight. Part-time work by the mother is not significantly related to childhood obesity.
Again, the remainder of the table incorporates alternative measures of maternal employment
that can distinguish between the duration of maternal employment and its intensity while working.
In these specifications we again find that it is the intensity of work that has a statistically significant
impact. Before controlling for other factors, we find that children of mothers who work an
additional 10 hours per week while working experience a 1 percentage point increase in the
likelihood of being overweight. Controlling for other factors lowers this estimate to 0.7 to 0.8
percentage points. Other results in the table are comparable to those reported in Table 3.
One difficulty in interpreting the results presented so far is that it is hard to understand the
dynamics of the relationship between maternal employment and childhood overweight. Both
lifetime exposure to more intense maternal employment and exposure over the last year have similar
effects on a child’s likelihood of being overweight. But recent employment and lifetime
employment are highly correlated. To further understand timing issues, we estimate models
comparable to those in Column 5 of Tables 3 and 4, but include multiple measures of maternal
employment at different points in the child’s life. One area upon which we focus is mother’s
employment in the child’s first three years of life. Recent research emphasizes the importance of the
early childhood environment on subsequent outcomes (see c.f. Nelson, 1999; and Shonkoff and
Phillips, 2000). Therefore, we also integrate into the analysis models that include maternal
employment during the child’s first three years of life to determine if there are lasting effects on
weight status attributable to maternal employment in those important developmental years.
The results of this analysis are reported in Table 5. The first three columns separately
include our maternal employment measures in three different time frames, in the past calendar year,
since the child’s birth, and in the child’s first three years of life. All specifications include the full

19
vector of covariates as in Column 5 of Tables 3 and 4; the first two columns of Table 5 simply
replicate those results for convenience. Column 3 of Table 5 includes maternal employment in the
child’s first three years of life only; we find no relationship between this and childhood overweight.
In Column 4, we include measures of the mother’s work patterns both since the child was born and
in the past calendar year. Results indicate that lifetime exposure is probably the more meaningful
measure. The point estimate on hours worked per week if working is largely unaffected, although
the standard error is somewhat elevated due to multicollinearity. On the other hand, the point
estimate on hours worked per week if working in the past calendar year is somewhat diminished. In
the next column, we keep lifetime exposure in the model and include maternal employment
measures in the first 3 years of life. Based on the results in Column 3, it is perhaps not surprising
that these early life experiences have no significant impact on the likelihood that the child is
overweight. Given these findings, the remainder of this analysis focuses on the extent to which a
child’s mother worked since s/he was born.
C. Sibling Difference Models
Although the regression models estimated so far control for a large number of factors that
could affect childhood overweight, unobservable differences across children and families could still
bias our estimates. To further reduce the likelihood of such bias, we have also estimated models
comparing outcomes between siblings as a function of differences in their own characteristics, and
particularly their exposure to maternal employment. As described earlier, this approach is useful
because it differences out any fixed characteristic of the siblings’ family.
We estimate these sibling difference models two different ways. First, we compare them in
the same survey year, so that family characteristics are identical at that time, but the children who
are being compared are at different developmental stages because they are different ages, and they
may differ in the amount their mother has worked since they were born. Second, we utilize the

20
longitudinal nature of the data to compare siblings at the same age, regardless of the survey year. In
this approach, we are holding constant the children’s developmental stage, but we are introducing
some variation in family characteristics because they may have changed between survey years.21
Consistent results across the two approaches will strengthen our ability to draw conclusions.
The results of this analysis are reported in Table 6. All estimates based on sibling differences
are obtained from ordinary least squares regressions. The estimates reported in this table strongly
support the conclusion obtained earlier that the intensity of maternal employment over the child’s
life has a significant impact on childhood overweight. In both the comparisons at the same point in
time as well as at the same age, we find that a 10-hour per week increase in work increases the
likelihood that a child is overweight by 0.7 to 1.1 percentage points. These estimates are somewhat
larger than those reported earlier and are precisely estimated. We continue to find weak results
regarding the relationship between the number of weeks worked since birth and childhood
overweight. It is the intensity of that work effort that seems to be most important.
Results for some of the other variables also bear examination. The coefficient on
breastfeeding, for example, is unstable across the specifications in columns 2 and 4. In neither case
is it significantly different from zero, although in column 4 the point estimate is similar to that in
Table 4. As these results suggest that mothers who breastfeed their children may simply be different
in many ways from mothers who do not, more research is likely needed into the impact of
breastfeeding on the incidence of overweight before a causal effect can be established.
D. Instrumental Variables Models
Another approach to avoiding bias due to correlation between mother’s employment history
and unobserved variables is to apply an instrumental variables technique. The instruments we use to
21Because we have restricted the NLSY child sample to include those between the ages of 2 and 15 and because the NLSY child assessments are only conducted every other year, only about half as many sibling pairs are available when we compare siblings at the same age.
21
predict maternal employment are state child care regulations, wages of child care workers, welfare
benefit levels, the status of welfare reform in the state, and the mean wage and education level of
married men under the age of 60.22
Table 7 presents the results of this analysis. For computational simplicity, we apply linear
probability models to estimate the factors affecting childhood overweight despite the discrete nature
of this outcome. Column 4 in this table reports the results of a linear probability model in which we
do not instrument for maternal employment and shows that the parameter estimates in this model are
virtually identical to the derivatives from the analogous probit model reported in Column 5 of Table
4. Thus, the use of probits versus linear probability models does not change the results. The first
thing to notice about the instrumental variables results in Columns 1 through 3 is that the pattern of
the point estimates on average hours per week when working and weeks work since child’s birth are
similar to those reported in the probit and sibling differences models, although slightly larger in
magnitude. The second thing to notice is the degree of imprecision with which our parameters are
estimated. While the employment effects are not significant, the fact that the pattern of the point
estimates is similar to those reported earlier gives us some confidence that the earlier results were
not driven by endogeneity. However, our instruments do not allow enough power to reject that the
true coefficient is zero.
E. Estimates for Subgroups
Based on the analysis reported to this point, we have found that the OLS estimates reported
in Table 4 provide relatively unbiased estimates of the causal impact of maternal employment on
childhood overweight. But all of the results reported so far have focused on the full population and
22First stage regression results are presented in Appendix Table 2. Because each of our instruments only differs across states and time, the fact that we use so many of them makes it difficult to interpret any one particular coefficient. Multicollinearity will lead to imprecise parameter estimates because so little variation in the data is available to identify any specific coefficient. On the other hand, it is beneficial to include so many instruments to provide the best possible prediction of maternal employment to be used in the second stage.
22
it is entirely possible that the impact of maternal employment differs for different subgroups. This
section of the paper replicates the model estimated in column 5 of Table 4, except we separately
consider differences in estimates by race/ethnicity, mother’s education and income quartile,
respectively.
Table 8 separates the population by race/ethnicity. It shows that the overall effect of more
intensive working appears to be driven mainly by the experience of non-Hispanics, and whites in
particular. The point estimate for Hispanics, in fact, is negative. For non-Hispanics, point estimates
are positive for both blacks and whites, although the impact for whites is twice the size of that for
blacks. Only the effect for whites is statistically significantly different from zero, though given the
larger sample sizes. Some other differences across racial/ethnic groups are also worth noting. For
example, the effect of breastfeeding is only apparent for whites and Hispanics, with no effect for
blacks. The point estimate for Hispanics is especially large, implying a 3 percentage point reduction
in the probability of overweight. However, the small sample size only allows us to reject the null of
no effect at the 8 percent level. Another interesting difference across groups is the effect of family
size, where blacks and Hispanics are driving the overall negative effect. Finally, for whites the
effect of having an obese mother is less than half that for blacks and Hispanics.
Table 9 reports the results when we separate the sample by mother’s level of education. The
most noteworthy result here is that the effect of more intensive work is actually negative for high
school dropouts, with the overall positive impact driven by children of more educated mothers.
Again small samples limit the power of the analysis; we are only able to reject the null hypothesis
that there is no effect for the largest group – children of mothers with only a high school degree. As
with racial/ethnic groups, it is the estimated effects of breastfeeding and family size that differ most
noticeably across groups. In this case, negative point estimates for the effect of breastfeeding on the
23
probability of being overweight are only found for mothers with less than a college degree, while the
negative effect of more children is most pronounced for those without a high school degree.
In Table 10, we divide the sample by lifetime income quartiles. Interestingly, the positive
effect of more intensive employment is working almost exclusively through those in the top
quartile.23 While point estimates are always positive, they are increasing with income quartile, and
the estimated impact for the highest quartile is over 6 times that for the lowest quartile. Here, the
negative effect of additional children is only significantly different from zero for the lowest quartile
and point estimates decrease in magnitude across quartiles. The estimated effect of breastfeeding
shows no real pattern, being positive and significant for the lowest quartile, negative and significant
for the 2nd and 3rd quartiles and negative, but insignificant for the top quartile.
V. DISCUSSION
In this paper, we have explored the relationship between maternal employment and
overweight among children, with a specific focus on determining whether any observed relationship
is causal. Overall, the results of this analysis indicate that a positive relationship exists between
maternal employment and childhood overweight. In particular, we have found that a measure of the
intensity of mother’s work over the child’s lifetime is consistently shown to be positively related to
the child’s likelihood of being overweight. A 10-hour increase in the average hours worked per
week while working over the child’s entire life is estimated to increase the likelihood that the child
is overweight by about one half to one full percentage point. Thus, a mother moving from part-time
(20 hours per week) work to full-time (40 hours) work is expected to increase the probability that
her child is overweight by 1 to 2 percentage points. On the other hand, we found no evidence that
the number of weeks a mother works over her child’s life has any impact on the likelihood that her 23The sample composition poses a potential problem in interpreting this result as an effect of income. Since older children are more likely to have been born to younger mothers, who tend to have lower incomes, this analysis may be confounding mother’s age at child’s birth with income. To address this potential problem, we have estimated comparable

24
child will be overweight. These findings suggest that the link between maternal employment and a
child’s weight status may be the time constraints faced by mothers who work intensively. This
result makes sense if it is the day-to-day routines that matter for a mother’s ability to supervise her
child’s nutritional intake and energy expenditure. Working fewer hours per week allows more time
for shopping, cooking, and energy expending play dates or organized sports.
To put the magnitude of our findings in context, we consider the extent to which this effect
can explain the increased prevalence of overweight among children over the past few decades. To
do this, we used data from the March 1976 and March 2000 CPS to estimate the increase in hours
worked per week over the past calendar year for women, 16 years or older, who had children under
18 living at home. Average hours worked per week increased from 17.8 in 1975 to 25.3 in 1999, or
an increase of about 7.5 hours per week. The results of our analysis above predict that this change in
average hours per week alone would lead to an increase in childhood overweight of between 0.38 to
0.75 percentage points. Levels of overweight among children age 6 and over rose from roughly 5
percent to over 13 percent over this period. Although there are problems associated with a direct
comparison of these results (like the age range of those included), to put some perspective on our
findings, the magnitude indicates that increased maternal employment could “explain” 6 to 11
percent of the growth in childhood overweight. Obviously, other factors also played a significant
role in driving this trend.
One of the other potentially important factors is the growth of adult overweight and obesity.
Estimates indicate that obesity (BMI greater than 30) among women between the ages of 30 and 39
rose from 15 to 26 percent between 1976-80 and 1988-94 and overweight (BMI greater than 25) rose
from 35 to 47 percent over this period. To the extent that adult behavior changes nutritional patterns
in households in a way that affects children increased overweight among adults should correlate with
models only for children between the ages of 3 and 8 and obtained similar results.
25
increased overweight among children. Based on the estimates reported in Tables 3 and 4 (and with
all appropriate precautions against a causal interpretation of those findings), these increases in adult
BMI would be predicted to increase childhood overweight by 0.9 percentage points. Therefore the
increase in adult weight problems can “explain” about 11 percent in the trend in overweight among
children. This effect is only slightly bigger than the effect of increases in the intensity of mothers’
work habits. Nevertheless, even combining these two potential contributors leaves most of the trend
in childhood overweight unexplained.
This project lays the groundwork for future research into the causes of childhood overweight.
The contribution of this work is several-fold. First, much of the research on childhood overweight
reports simple correlations between overweight and various characteristics of the child or the family.
This project is among the first to grapple with issues of causality. It presents robust evidence of a
positive and significant impact of maternal work on the probability that a child is overweight.
Further, it presents prima facie evidence that the mechanism through which this takes place is
constraints on mother’s time; it is hours per week, not the number of weeks worked, that affects
children’s probability of overweight.
There is much more to learn about causal factors related to the epidemic of overweight
among children in the United States. These include understanding direct contributors to childhood
overweight and the mechanisms through which mothers’ working translates into overweight
children. For example, how does child care quality affect children’s nutrition and energy
expenditure? Additionally, we need to know more about children’s opportunities for vigorous
exercise, including physical education in school, after-school programs, and access to parks or other
recreational facilities. This deeper understanding is important if society is going to develop
appropriate policy responses to this important public health issue.
26
References Averett, Susan and Sanders Korenman, “The Economic Reality of ‘The Beauty Myth’: Economic
Differentials by Body Mass, “ Journal of Human Resources, vol. 31, no. 2, 1996, page 304. Bar-Or, Oded, John Foreyt, Claude Bouchard, Kelly D. Brownell, William H. Dietz, Eric Ravussin,
Arline D. Salbe, Sandy Schwenger, Sachico St. Jeor, and Benjamin Torun, “Physical Activity, Genetic, and Nutritional Considerations in Childhood Weight Management,” Roundtable Discussion, The Official Journal of the American College of Sports Medicine, vol 30, no. 1 1998, pp. 2-10.
Birch, Leann L., and Jennifer O. Fisher. "Development of Eating Behaviors Among Children and
Adolescents." Pediatrics, vol. 101, no. 3, March 1998, pp. 539-549. Bouchard, Claude, “Obesity in Adulthood – the Importance of Childhood and Parental Obesity,” New England Journal of Medicine, vol. 337, no. 13, September 25, 1997, p. 926-927. Cawley, John. “Body Weight and Women’s Labor Market Outcomes.” NBER working paper, no.
7841. August 2000. Centers for Disease Control and Prevention, National Center for Health Statistics. Division of
Health Examination Statistics. data available at: http://www.cdc.gov/nchs/products/pubs/pubd/hestats/overwght99.htm.
Dietz, William. “Factors Associated with Childhood Obesity.” Nutrition. Vol. 7, No. 4 (July-August
1991) pp. 290-1. Dietz, William, “Periods of Risk in Childhood for the Development of Adult Obesity – What Do We
Need to Learn?,” Journal of Nutrition, vol. 127, Supplement, 1997, p. 1884-1886. Dietz, William H. and Mary C. Bellizzi. “Introduction: The Use of Body Mass Index to Assess
Obesity in Children. American Journal of Clinical Nutrition. Vol. 70 (suppl). pp. 123S-125S.
Dietz, William H. and Steven L. Gortmaker. “Do We Fatten Our Children at the Television Set?
Obesity and Television Viewing in Children and Adolescents.” Pediatrics Vol. 75 No. 5 (May 1985) pp. 807-12.
Gerald LB, A. Anderson, GD Johnson GD, C Hoff and RF Trimm. “Social Class, Social Support
and Obesity Risk in Children.” Child Care, Health & Development. Vol. 20 No. 3 (May-June 1994) pp. 145-63.
27
Gilman, Matthew, Sheryl L. Rifas-Shiman, Carlos A. Camargo Jr., Catherine S. Berkey, A. Lindsay Frazier, Helaine R. H. Rockett, Alison E. Field, Graham A. Colditz, “Risk of Overweight Among Adolescents Who Were Breastfed as Infants,” Journal of the American Medical Association, May 16, 2001, Vol. 285 No. 19, pp.2461-2467.
Gortmaker, Steven L., Aviva Must, James M. Perrin, Arthur M. Sobol, and William H. Dietz,
“Social and Economic Consequences of Overweight in Adolescence and Young Adulthood, “ New England Journal of Medicine, vol. 329, September 1993, p.1008-12.
Gortmaker Steven L., Aviva Must, Arthur M. Sobol, Karen Peterson, Graham A. Colditz, William
H. Dietz. “Television Viewing as a Cause of Increasing Obesity among Children in the United States, 1986-1990.” Archives of Pediatrics & Adolescent Medicine Vol. 150 No. 4(April 1996) pp. 356-62.
Jain, Anjali, Susan N. Sherman, Leigh A. Chamberlin, Yvette Carter, Scott W. Powers, and Robert
C. Whitaker, “Why Don’t Low Income Mothers Worry about Their Preschoolers Being Overweight,” Pediatrics, Vol. 107, No. 5, (May 2001), pp. 1138-1146.
Johnson, Rachel K., Helen Smiciklas-Wright, Ann C. Crouter and Fern K. Willits, "Maternal
Employment and the Quality of Young Children's Diets - Empirical Evidence Based on the 1987-1988 Nationwide Food-consumption Survey" Pediatrics. Vol 90 No. 2 Part 1 (August 1992), pp. 245-249.
Klesges Robert C., Risa J. Stein, Linda H. Eck, Terry R. Isbell and Lisa M. Klesges. “Parental
Influence on Food Selection in Young Children and its Relationships to Childhood Obesity” American Journal of Clinical Nutrition. Vol. 53 No. 4 (April 1991) pp. 859-64.
Locard, Elisabeth, Nicole Mamelle, Agathe Billette, Michell Migniac, Francoise Munoz, and Sylvie
Rey, “Risk Factors of Obesity in a Five Yar Old Population: Parental versus Environmental Factors,” International Journal of Obesity, vol 16, p. 721-729, 1992.
Mashberg, Tom. "Childhood Obesity Reaches Epidemic Proportions." Boston Herald. May 23,
1999. p. 1. National Institutes of Health. Clinical Guidelines on the Identification, Evaluation and Treatment of
Overweight in Adults: The Evidence Report. June 1998. Available from the National Heart, Lung and Blood Institute web site at http://www.nhlbi.nih.gov/guidelines/obesity/ob_gdlns.pdf
Nelson, C.A. “How important are the first 3 years of life?” Applied Developmental Science, 3, 235-
238, 1999. Power, C., J.K. Lake, and T.J. Cole, “Measurement and Long-term Health Risks of Child and
Adolescent Fatness,” International Journal of Obesity, vol 21, 1997, p.507-526.
28
Schachter, S, “Obesity and Eating,” Science, 161(3843), Aug. 1968.p. 751-756. Shonkoff, Jack P. and Deborah A. Phillips, Editors, "From Neurons to Neighborhoods: The Science
of Early Childhood Development," National Academy Press, Washington DC, 2000. Sobal, Jeffery and Albert J. Stunkard, “Socioeconomic Status and Obesity: A Review of the
Literature,” Psychological Bulletin, vol. 105, no. 2, 1989, p.260-275. Takahashi, E., K. Yoshida, H. Sugimori, M. Miyakawa, T. Izuno, T. Yamagami, S. Kagamimori.
“Influence Factors on the Development of Obesity in 3-year-old Children Based on the Toyama Study.” Preventive Medicine, vol. 28, no. 3 (March 1999) pp. 293-6.
Thompson, “Diabetes: Childhood Obesity Hastens Type II Onset,” Health Line (The National Journal Group, Inc.), December 4, 1998, section: Trends and Timelines. United States Bureau of the Census. Statistical Abstract of the United States 2000. Washington,
DC: Government Printing Office. 2000. von Kries Rudiger, Berthold Koletzko, Thorsten Sauerwald , Erika von Mutius, Dietmar Barnert,
Veit Grunert, Hubertus von Voss. “Breast Feeding and Obesity: Cross Sectional Study” British Medical Journal. Vol. 319 (7203) (July 17, 1999) pp. 147-150.
Vuille, Jean-Claude and Tore Mellbin. “Obesity in 10-year-olds: an Epidemiologic Study.” Pediatrics Vol. 64 No. 5 (November 1979) pp. 564-72. Wolfe Wendy S., Cathy C. Campbell, Edward A. Frongillo Jr, Jere D. Haas and Thomas A. Melnik.
“Overweight Schoolchildren in New York State: Prevalence and Characteristics.” American Journal of Public Health. Vol. 84 No. 5 (May 1994) pp. 807-13.
Woolston, Joseph L., “Obesity in Infancy and Early Childhood,” Journal of the American
Academy of Child Adolescent Psychiatry,” Special Article, vol 26, 1987, p.123-126. Zakus, Gloria E., “Obesity in Children and Adolescents: Understanding and Treating the Problem,”
Social Work in Health Care, Vol. 8, No. 2 (Winter 1982) p. 11-29.
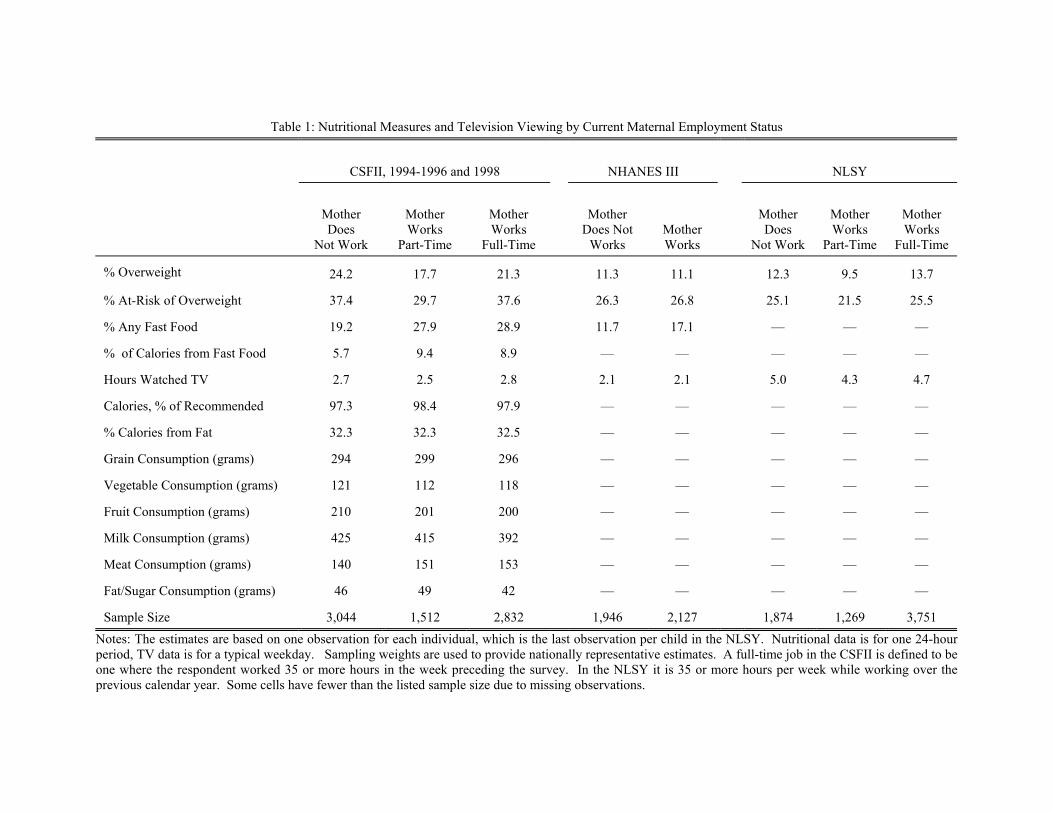
Table 1: Nutritional Measures and Television Viewing by Current Maternal Employment Status
CSFII, 1994-1996 and 1998
NHANES III
NLSY
Mother Does
Not Work
Mother Works
Part-Time
Mother Works
Full-Time
Mother
Does Not Works
Mother Works
Mother Does
Not Work
Mother Works
Part-Time
Mother Works
Full-Time
% Overweight 24.2 17.7 21.3 11.3 11.1 12.3 9.5 13.7
% At-Risk of Overweight 37.4 29.7 37.6 26.3 26.8 25.1 21.5 25.5
% Any Fast Food 19.2 27.9 28.9 11.7 17.1 — — —
% of Calories from Fast Food 5.7 9.4 8.9 — — — — —
Hours Watched TV 2.7 2.5 2.8 2.1 2.1 5.0 4.3 4.7
Calories, % of Recommended 97.3 98.4 97.9 — — — — —
% Calories from Fat 32.3 32.3 32.5 — — — — —
Grain Consumption (grams) 294 299 296 — — — — —
Vegetable Consumption (grams) 121 112 118 — — — — —
Fruit Consumption (grams) 210 201 200 — — — — —
Milk Consumption (grams) 425 415 392 — — — — —
Meat Consumption (grams) 140 151 153 — — — — —
Fat/Sugar Consumption (grams) 46 49 42 — — — — —
Sample Size 3,044 1,512 2,832 1,946 2,127 1,874 1,269 3,751 Notes: The estimates are based on one observation for each individual, which is the last observation per child in the NLSY. Nutritional data is for one 24-hour period, TV data is for a typical weekday. Sampling weights are used to provide nationally representative estimates. A full-time job in the CSFII is defined to be one where the respondent worked 35 or more hours in the week preceding the survey. In the NLSY it is 35 or more hours per week while working over the previous calendar year. Some cells have fewer than the listed sample size due to missing observations.
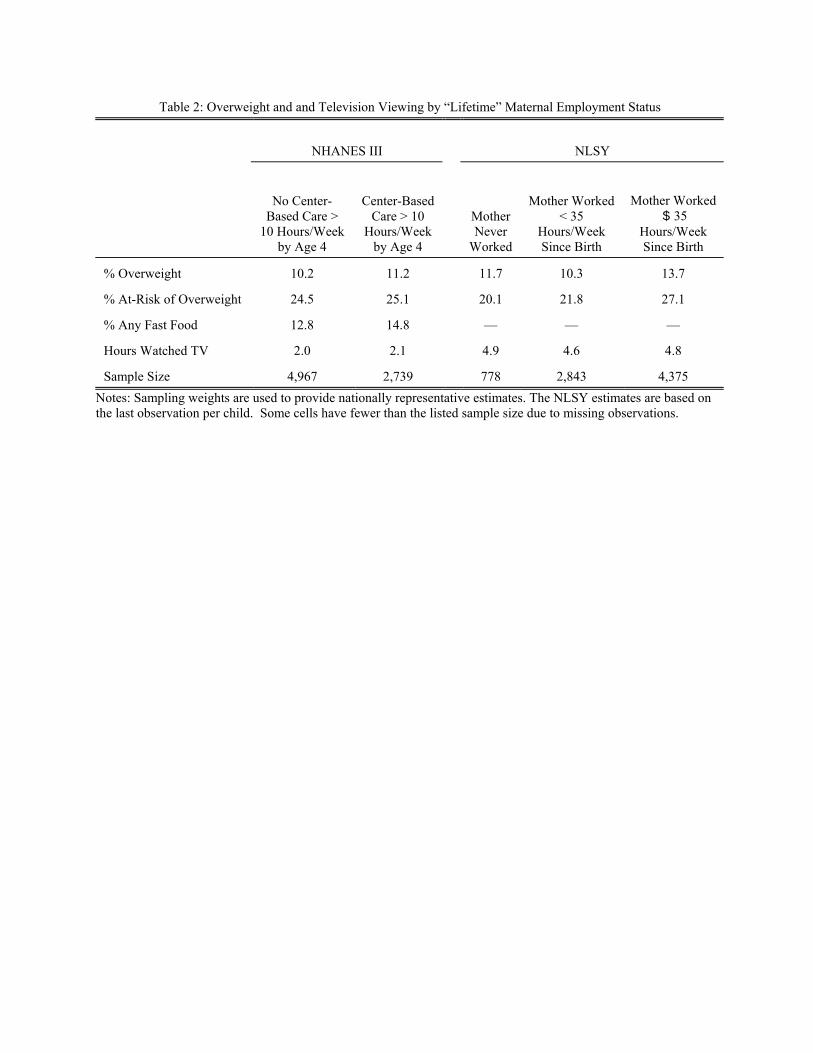
Table 2: Overweight and and Television Viewing by “Lifetime” Maternal Employment Status
NHANES III
NLSY
No Center-Based Care >
10 Hours/Week by Age 4
Center-Based Care > 10
Hours/Week by Age 4
Mother Never
Worked
Mother Worked < 35
Hours/Week Since Birth
Mother Worked $ 35
Hours/Week Since Birth
% Overweight 10.2 11.2 11.7 10.3 13.7
% At-Risk of Overweight 24.5 25.1 20.1 21.8 27.1
% Any Fast Food 12.8 14.8 — — —
Hours Watched TV 2.0 2.1 4.9 4.6 4.8
Sample Size 4,967 2,739 778 2,843 4,375 Notes: Sampling weights are used to provide nationally representative estimates. The NLSY estimates are based on the last observation per child. Some cells have fewer than the listed sample size due to missing observations.

Table 3: Probit Estimates of the Impact of Current Maternal Employment on Childhood Overweight (Estimates Represent Derivatives, Robust Standard Errors in Parentheses)
(1)
(2)
(3)
(4)
(5)
Mother Worked $ 35 Hours/Week Over Last Calendar Year
0.017 (0.006)
Mother Worked < 35 Hours/Week Over Last Calendar Year
-0.017 (0.006)
Average Hours per Week if Working, Last Calendar Year (in units of 10)
0.008 (0.002)
0.005 (0.002)
0.005 (0.002)
0.005 (0.002)
Number of Weeks Worked Last Calendar Year (in units of 52)
-0.022 (0.009)
-0.0004 (0.010)
-0.006 (0.010)
-0.002 (0.010)
African American
0.056 (0.010)
0.036 (0.005)
0.027 (0.006)
Hispanic
0.015 (0.010)
0.011 (0.007)
0.010 (0.007)
Mother’s Highest Grade Completed
-0.006 (0.002)
-0.006 (0.002)
-0.005 (0.002)
Child Was First Born
-0.008 (0.007)
-0.005 (0.005)
-0.003 (0.004)
Number of Children
-0.009 (0.004)
-0.09 (0.004)
-0.008 (0.004)
Child Was Breast Fed
-0.021 (0.008)
-0.021 (0.008)
Mother’s BMI ≥ 25 (Overweight or Obese)
0.034 (0.008)
0.034 (0.008)
Mother’s BMI ≥ 30 (Obese)
0.048 (0.113)
0.046 (0.112)
Average Family Income Since Birth (in units of $10,000)
-0.002 (0.002)
Percent of Child’s Life Mother was Married
-0.017 (0.011)
Psuedo R-Squared
0.018
0.017
0.041
0.059
0.060
Number of Observations
23,013
23,013
20,135
18,606
18,502
Notes: Dependent variable is a binary variable equal to 1 if child’s BMI is above the 95th percentile for his/her age. The standard errors are robust, clustered on the mother’s identification code, as there are multiple children per mother. All columns include dummies for mother reported height and weight. Columns 3-5 also include child’s birth weight, mother’s afqt score, both the child’s and mother’s age in years, dummy variables for the year of the survey, controls for education levels of the mother’s parents, dummy variables indicating whether mother’s parents were present when she was 14, and a dummy variable indicating whether the child is female. All estimates are weighted using the child’s sampling weight.
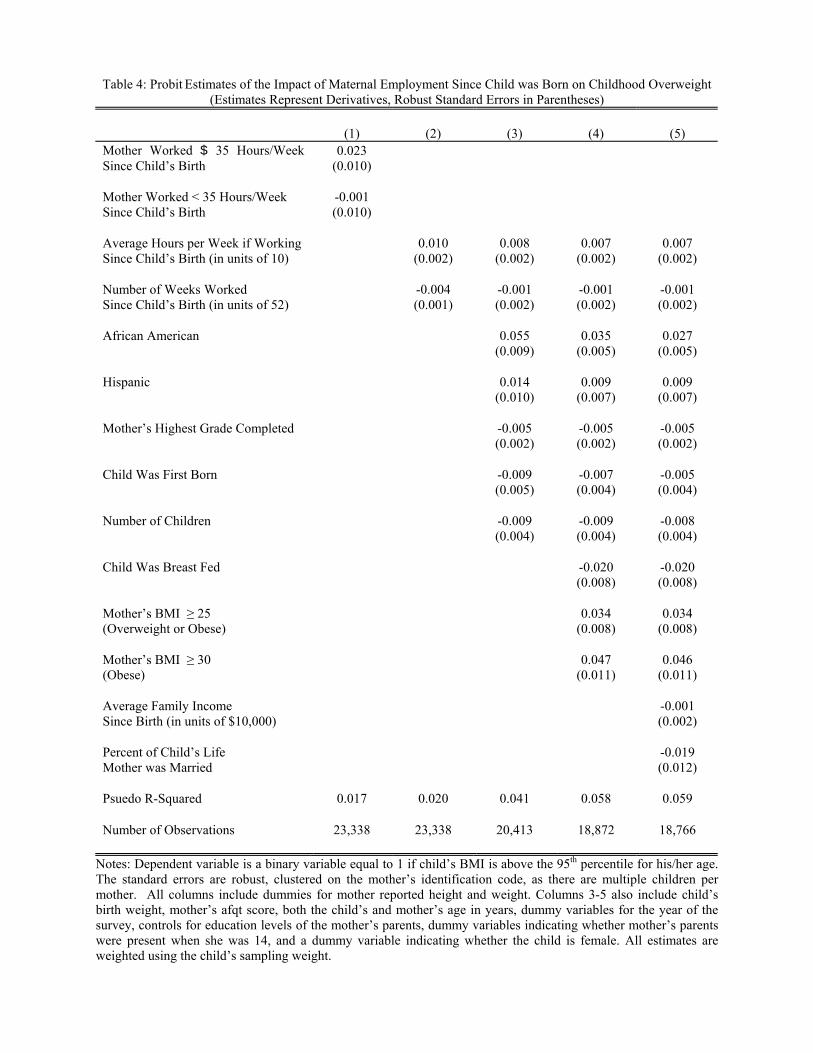
Table 4: Probit Estimates of the Impact of Maternal Employment Since Child was Born on Childhood Overweight (Estimates Represent Derivatives, Robust Standard Errors in Parentheses)
(1)
(2)
(3)
(4)
(5)
Mother Worked $ 35 Hours/Week Since Child’s Birth
0.023 (0.010)
Mother Worked < 35 Hours/Week Since Child’s Birth
-0.001 (0.010)
Average Hours per Week if Working Since Child’s Birth (in units of 10)
0.010 (0.002)
0.008 (0.002)
0.007 (0.002)
0.007 (0.002)
Number of Weeks Worked Since Child’s Birth (in units of 52)
-0.004 (0.001)
-0.001 (0.002)
-0.001 (0.002)
-0.001 (0.002)
African American
0.055 (0.009)
0.035 (0.005)
0.027 (0.005)
Hispanic
0.014 (0.010)
0.009 (0.007)
0.009 (0.007)
Mother’s Highest Grade Completed
-0.005 (0.002)
-0.005 (0.002)
-0.005 (0.002)
Child Was First Born
-0.009 (0.005)
-0.007 (0.004)
-0.005 (0.004)
Number of Children
-0.009 (0.004)
-0.009 (0.004)
-0.008 (0.004)
Child Was Breast Fed
-0.020 (0.008)
-0.020 (0.008)
Mother’s BMI ≥ 25 (Overweight or Obese)
0.034 (0.008)
0.034 (0.008)
Mother’s BMI ≥ 30 (Obese)
0.047 (0.011)
0.046 (0.011)
Average Family Income Since Birth (in units of $10,000)
-0.001 (0.002)
Percent of Child’s Life Mother was Married
-0.019 (0.012)
Psuedo R-Squared
0.017
0.020
0.041
0.058
0.059
Number of Observations
23,338
23,338
20,413
18,872
18,766
Notes: Dependent variable is a binary variable equal to 1 if child’s BMI is above the 95th percentile for his/her age. The standard errors are robust, clustered on the mother’s identification code, as there are multiple children per mother. All columns include dummies for mother reported height and weight. Columns 3-5 also include child’s birth weight, mother’s afqt score, both the child’s and mother’s age in years, dummy variables for the year of the survey, controls for education levels of the mother’s parents, dummy variables indicating whether mother’s parents were present when she was 14, and a dummy variable indicating whether the child is female. All estimates are weighted using the child’s sampling weight.
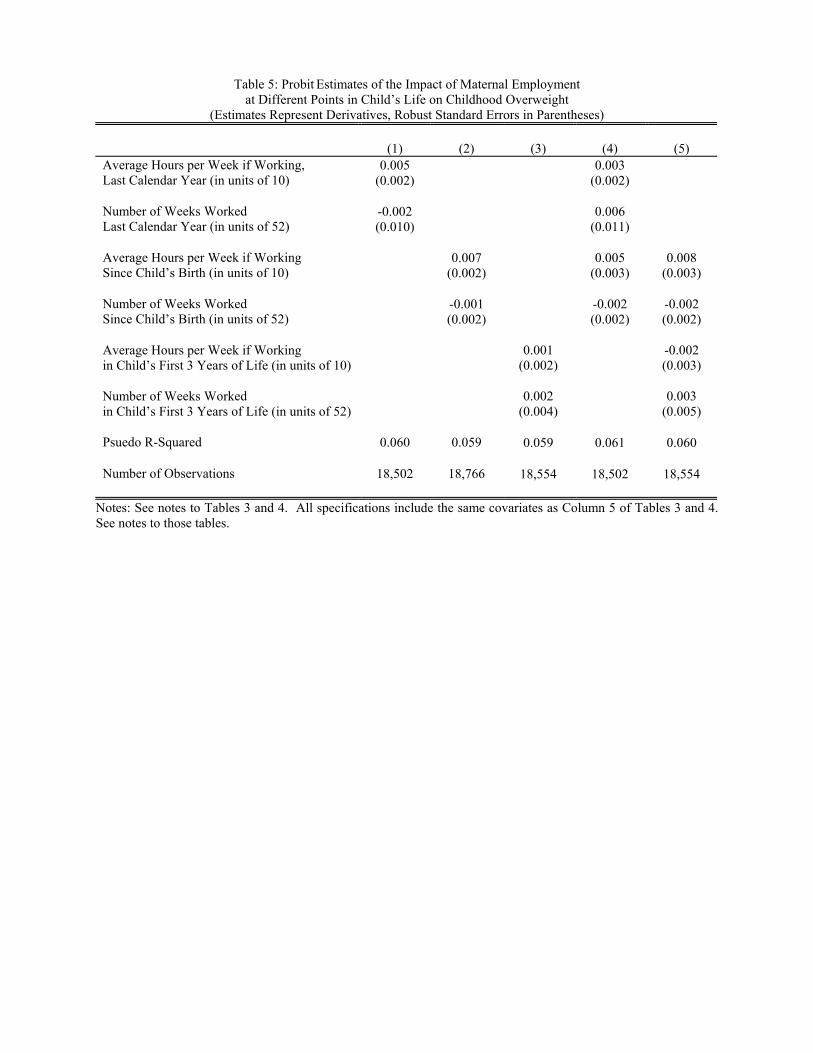
Table 5: Probit Estimates of the Impact of Maternal Employment at Different Points in Child’s Life on Childhood Overweight
(Estimates Represent Derivatives, Robust Standard Errors in Parentheses)
(1)
(2)
(3)
(4)
(5)
Average Hours per Week if Working, Last Calendar Year (in units of 10)
0.005 (0.002)
0.003 (0.002)
Number of Weeks Worked Last Calendar Year (in units of 52)
-0.002 (0.010)
0.006 (0.011)
Average Hours per Week if Working Since Child’s Birth (in units of 10)
0.007 (0.002)
0.005 (0.003)
0.008 (0.003)
Number of Weeks Worked Since Child’s Birth (in units of 52)
-0.001 (0.002)
-0.002 (0.002)
-0.002 (0.002)
Average Hours per Week if Working in Child’s First 3 Years of Life (in units of 10)
0.001 (0.002)
-0.002 (0.003)
Number of Weeks Worked in Child’s First 3 Years of Life (in units of 52)
0.002 (0.004)
0.003 (0.005)
Psuedo R-Squared
0.060
0.059
0.059
0.061
0.060
Number of Observations
18,502
18,766
18,554
18,502
18,554
Notes: See notes to Tables 3 and 4. All specifications include the same covariates as Column 5 of Tables 3 and 4. See notes to those tables.
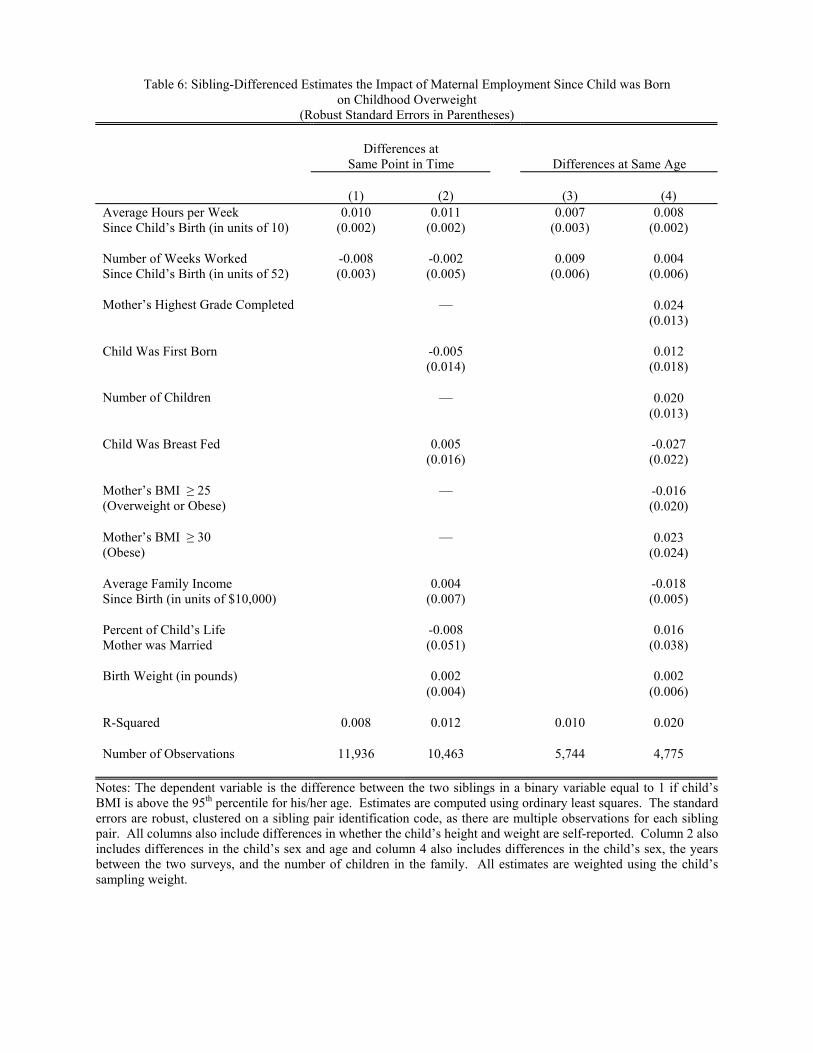
Table 6: Sibling-Differenced Estimates the Impact of Maternal Employment Since Child was Born on Childhood Overweight
(Robust Standard Errors in Parentheses)
Differences at Same Point in Time
Differences at Same Age
(1)
(2)
(3)
(4)
Average Hours per Week Since Child’s Birth (in units of 10)
0.010 (0.002)
0.011 (0.002)
0.007 (0.003)
0.008 (0.002)
Number of Weeks Worked Since Child’s Birth (in units of 52)
-0.008 (0.003)
-0.002 (0.005)
0.009 (0.006)
0.004 (0.006)
Mother’s Highest Grade Completed
—
0.024 (0.013)
Child Was First Born
-0.005 (0.014)
0.012 (0.018)
Number of Children
—
0.020 (0.013)
Child Was Breast Fed
0.005 (0.016)
-0.027 (0.022)
Mother’s BMI ≥ 25 (Overweight or Obese)
—
-0.016 (0.020)
Mother’s BMI ≥ 30 (Obese)
—
0.023 (0.024)
Average Family Income Since Birth (in units of $10,000)
0.004 (0.007)
-0.018 (0.005)
Percent of Child’s Life Mother was Married
-0.008 (0.051)
0.016 (0.038)
Birth Weight (in pounds)
0.002 (0.004)
0.002 (0.006)
R-Squared
0.008
0.012
0.010
0.020
Number of Observations
11,936
10,463
5,744
4,775
Notes: The dependent variable is the difference between the two siblings in a binary variable equal to 1 if child’s BMI is above the 95th percentile for his/her age. Estimates are computed using ordinary least squares. The standard errors are robust, clustered on a sibling pair identification code, as there are multiple observations for each sibling pair. All columns also include differences in whether the child’s height and weight are self-reported. Column 2 also includes differences in the child’s sex and age and column 4 also includes differences in the child’s sex, the years between the two surveys, and the number of children in the family. All estimates are weighted using the child’s sampling weight.
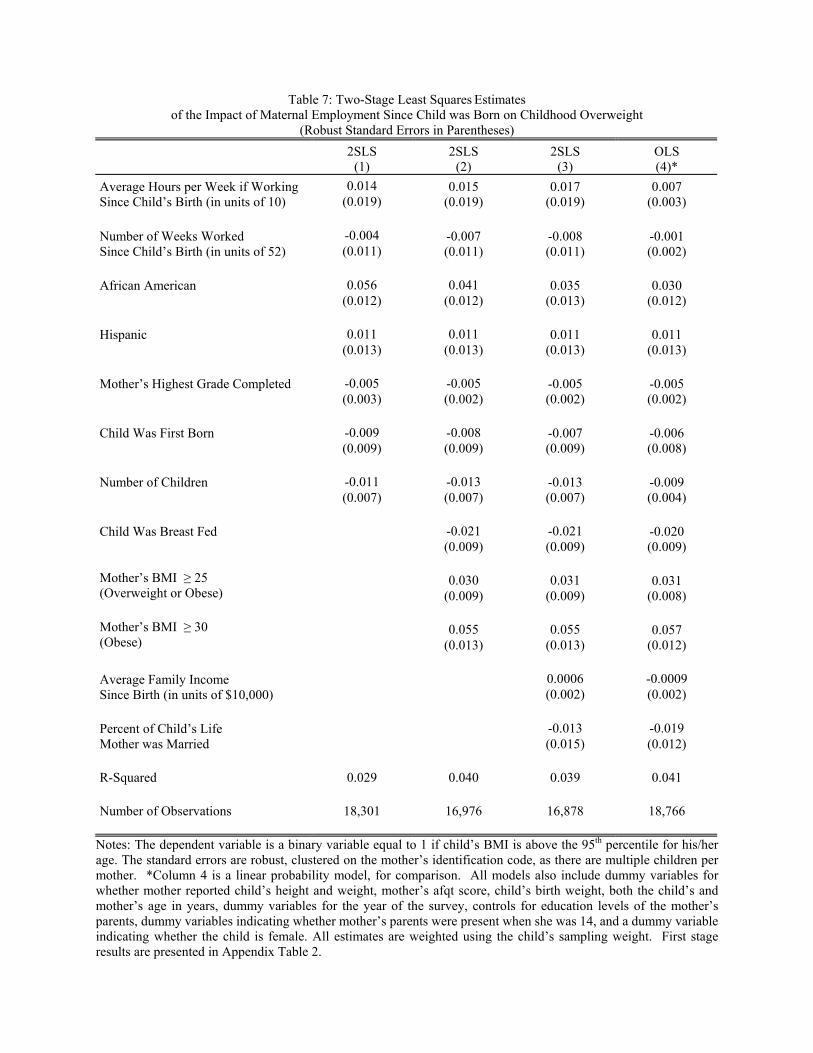
Table 7: Two-Stage Least Squares Estimates
of the Impact of Maternal Employment Since Child was Born on Childhood Overweight (Robust Standard Errors in Parentheses)
2SLS (1)
2SLS (2)
2SLS (3)
OLS (4)*
Average Hours per Week if Working Since Child’s Birth (in units of 10)
0.014 (0.019)
0.015 (0.019)
0.017 (0.019)
0.007 (0.003)
Number of Weeks Worked Since Child’s Birth (in units of 52)
-0.004 (0.011)
-0.007 (0.011)
-0.008 (0.011)
-0.001 (0.002)
African American
0.056 (0.012)
0.041 (0.012)
0.035 (0.013)
0.030 (0.012)
Hispanic
0.011 (0.013)
0.011 (0.013)
0.011 (0.013)
0.011 (0.013)
Mother’s Highest Grade Completed
-0.005 (0.003)
-0.005 (0.002)
-0.005 (0.002)
-0.005 (0.002)
Child Was First Born
-0.009 (0.009)
-0.008 (0.009)
-0.007 (0.009)
-0.006 (0.008)
Number of Children
-0.011 (0.007)
-0.013 (0.007)
-0.013 (0.007)
-0.009 (0.004)
Child Was Breast Fed
-0.021 (0.009)
-0.021 (0.009)
-0.020 (0.009)
Mother’s BMI ≥ 25 (Overweight or Obese)
0.030 (0.009)
0.031 (0.009)
0.031 (0.008)
Mother’s BMI ≥ 30 (Obese)
0.055 (0.013)
0.055 (0.013)
0.057 (0.012)
Average Family Income Since Birth (in units of $10,000)
0.0006 (0.002)
-0.0009 (0.002)
Percent of Child’s Life Mother was Married
-0.013 (0.015)
-0.019 (0.012)
R-Squared
0.029
0.040
0.039
0.041
Number of Observations
18,301
16,976
16,878
18,766
Notes: The dependent variable is a binary variable equal to 1 if child’s BMI is above the 95th percentile for his/her age. The standard errors are robust, clustered on the mother’s identification code, as there are multiple children per mother. *Column 4 is a linear probability model, for comparison. All models also include dummy variables for whether mother reported child’s height and weight, mother’s afqt score, child’s birth weight, both the child’s and mother’s age in years, dummy variables for the year of the survey, controls for education levels of the mother’s parents, dummy variables indicating whether mother’s parents were present when she was 14, and a dummy variable indicating whether the child is female. All estimates are weighted using the child’s sampling weight. First stage results are presented in Appendix Table 2.
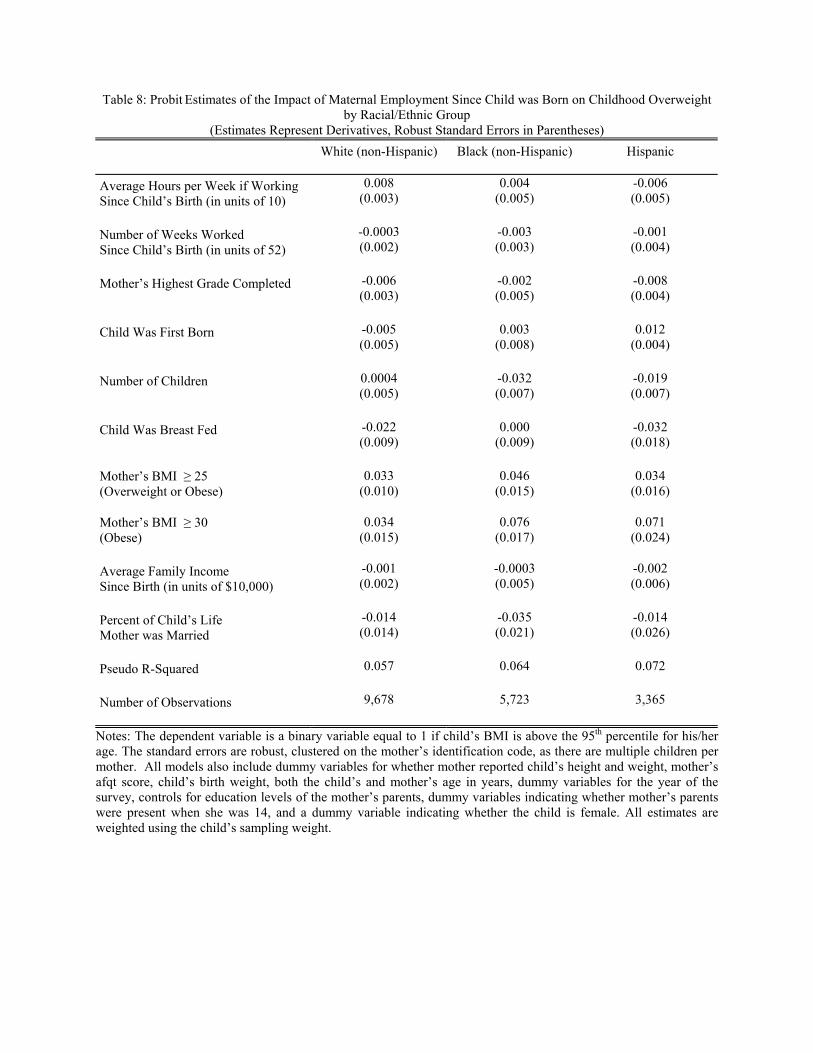
Table 8: Probit Estimates of the Impact of Maternal Employment Since Child was Born on Childhood Overweight
by Racial/Ethnic Group (Estimates Represent Derivatives, Robust Standard Errors in Parentheses)
White (non-Hispanic)
Black (non-Hispanic)
Hispanic
Average Hours per Week if Working Since Child’s Birth (in units of 10)
0.008 (0.003)
0.004 (0.005)
-0.006 (0.005)
Number of Weeks Worked Since Child’s Birth (in units of 52)
-0.0003 (0.002)
-0.003 (0.003)
-0.001 (0.004)
Mother’s Highest Grade Completed
-0.006 (0.003)
-0.002 (0.005)
-0.008 (0.004)
Child Was First Born
-0.005 (0.005)
0.003 (0.008)
0.012 (0.004)
Number of Children
0.0004 (0.005)
-0.032 (0.007)
-0.019 (0.007)
Child Was Breast Fed
-0.022 (0.009)
0.000 (0.009)
-0.032 (0.018)
Mother’s BMI ≥ 25 (Overweight or Obese)
0.033 (0.010)
0.046 (0.015)
0.034 (0.016)
Mother’s BMI ≥ 30 (Obese)
0.034 (0.015)
0.076 (0.017)
0.071 (0.024)
Average Family Income Since Birth (in units of $10,000)
-0.001 (0.002)
-0.0003 (0.005)
-0.002 (0.006)
Percent of Child’s Life Mother was Married
-0.014 (0.014)
-0.035 (0.021)
-0.014 (0.026)
Pseudo R-Squared
0.057 0.064 0.072
Number of Observations
9,678 5,723 3,365
Notes: The dependent variable is a binary variable equal to 1 if child’s BMI is above the 95th percentile for his/her age. The standard errors are robust, clustered on the mother’s identification code, as there are multiple children per mother. All models also include dummy variables for whether mother reported child’s height and weight, mother’s afqt score, child’s birth weight, both the child’s and mother’s age in years, dummy variables for the year of the survey, controls for education levels of the mother’s parents, dummy variables indicating whether mother’s parents were present when she was 14, and a dummy variable indicating whether the child is female. All estimates are weighted using the child’s sampling weight.
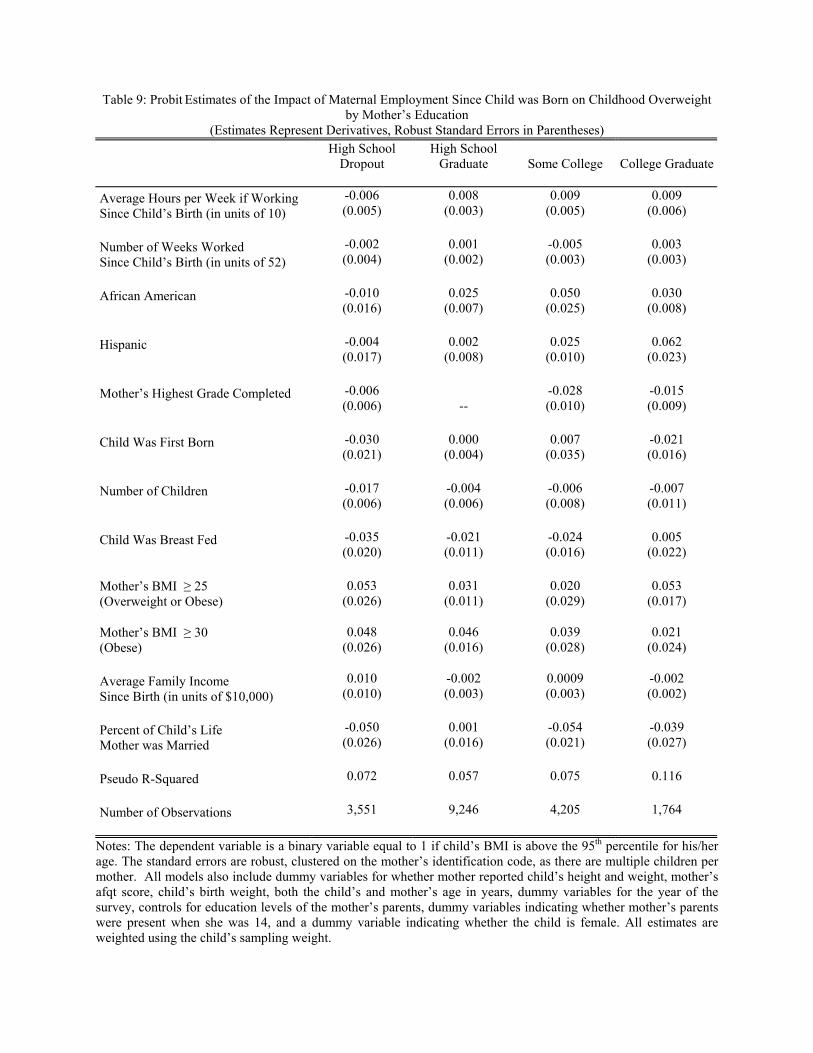
Table 9: Probit Estimates of the Impact of Maternal Employment Since Child was Born on Childhood Overweight
by Mother’s Education (Estimates Represent Derivatives, Robust Standard Errors in Parentheses)
High School Dropout
High School Graduate
Some College
College Graduate
Average Hours per Week if Working Since Child’s Birth (in units of 10)
-0.006 (0.005)
0.008 (0.003)
0.009 (0.005)
0.009 (0.006)
Number of Weeks Worked Since Child’s Birth (in units of 52)
-0.002 (0.004)
0.001 (0.002)
-0.005 (0.003)
0.003 (0.003)
African American
-0.010 (0.016)
0.025 (0.007)
0.050 (0.025)
0.030 (0.008)
Hispanic
-0.004 (0.017)
0.002 (0.008)
0.025 (0.010)
0.062 (0.023)
Mother’s Highest Grade Completed
-0.006 (0.006)
--
-0.028 (0.010)
-0.015 (0.009)
Child Was First Born
-0.030 (0.021)
0.000 (0.004)
0.007 (0.035)
-0.021 (0.016)
Number of Children
-0.017 (0.006)
-0.004 (0.006)
-0.006 (0.008)
-0.007 (0.011)
Child Was Breast Fed
-0.035 (0.020)
-0.021 (0.011)
-0.024 (0.016)
0.005 (0.022)
Mother’s BMI ≥ 25 (Overweight or Obese)
0.053 (0.026)
0.031 (0.011)
0.020 (0.029)
0.053 (0.017)
Mother’s BMI ≥ 30 (Obese)
0.048 (0.026)
0.046 (0.016)
0.039 (0.028)
0.021 (0.024)
Average Family Income Since Birth (in units of $10,000)
0.010 (0.010)
-0.002 (0.003)
0.0009 (0.003)
-0.002 (0.002)
Percent of Child’s Life Mother was Married
-0.050 (0.026)
0.001 (0.016)
-0.054 (0.021)
-0.039 (0.027)
Pseudo R-Squared
0.072 0.057 0.075 0.116
Number of Observations
3,551 9,246 4,205 1,764
Notes: The dependent variable is a binary variable equal to 1 if child’s BMI is above the 95th percentile for his/her age. The standard errors are robust, clustered on the mother’s identification code, as there are multiple children per mother. All models also include dummy variables for whether mother reported child’s height and weight, mother’s afqt score, child’s birth weight, both the child’s and mother’s age in years, dummy variables for the year of the survey, controls for education levels of the mother’s parents, dummy variables indicating whether mother’s parents were present when she was 14, and a dummy variable indicating whether the child is female. All estimates are weighted using the child’s sampling weight.
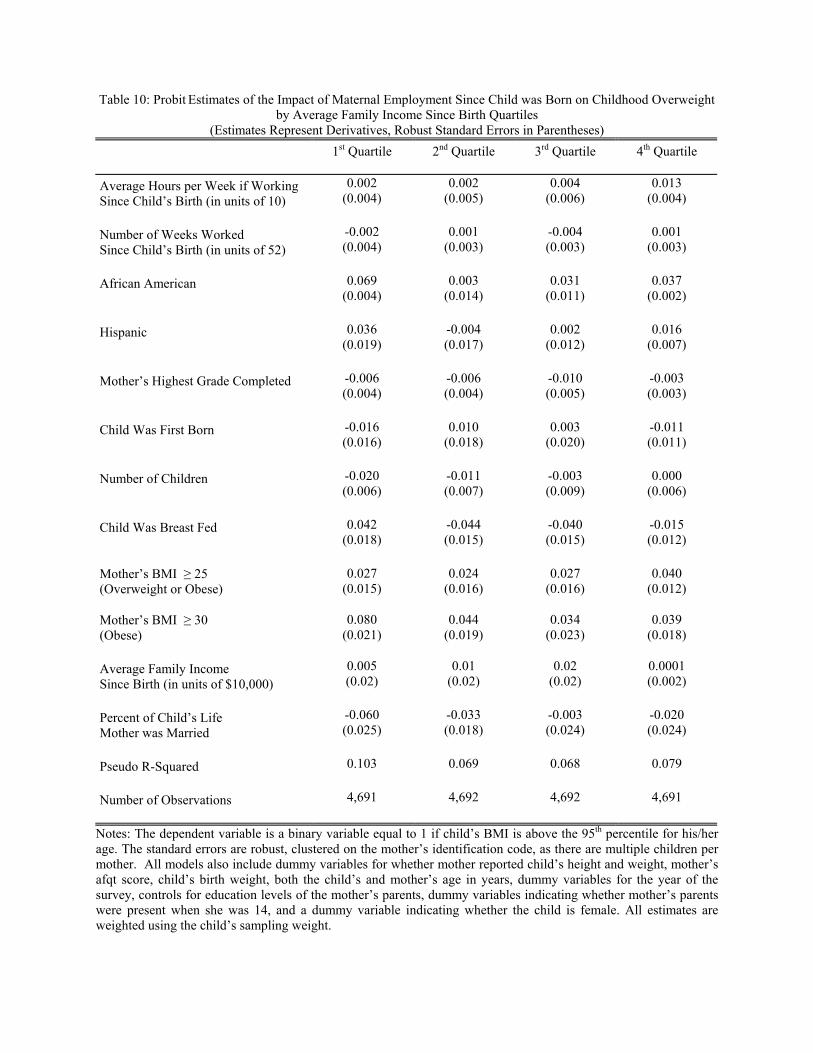
Table 10: Probit Estimates of the Impact of Maternal Employment Since Child was Born on Childhood Overweight
by Average Family Income Since Birth Quartiles (Estimates Represent Derivatives, Robust Standard Errors in Parentheses)
1st Quartile
2nd Quartile
3rd Quartile
4th Quartile
Average Hours per Week if Working Since Child’s Birth (in units of 10)
0.002 (0.004)
0.002 (0.005)
0.004 (0.006)
0.013 (0.004)
Number of Weeks Worked Since Child’s Birth (in units of 52)
-0.002 (0.004)
0.001 (0.003)
-0.004 (0.003)
0.001 (0.003)
African American
0.069 (0.004)
0.003 (0.014)
0.031 (0.011)
0.037 (0.002)
Hispanic
0.036 (0.019)
-0.004 (0.017)
0.002 (0.012)
0.016 (0.007)
Mother’s Highest Grade Completed
-0.006 (0.004)
-0.006 (0.004)
-0.010 (0.005)
-0.003 (0.003)
Child Was First Born
-0.016 (0.016)
0.010 (0.018)
0.003 (0.020)
-0.011 (0.011)
Number of Children
-0.020 (0.006)
-0.011 (0.007)
-0.003 (0.009)
0.000 (0.006)
Child Was Breast Fed
0.042 (0.018)
-0.044 (0.015)
-0.040 (0.015)
-0.015 (0.012)
Mother’s BMI ≥ 25 (Overweight or Obese)
0.027 (0.015)
0.024 (0.016)
0.027 (0.016)
0.040 (0.012)
Mother’s BMI ≥ 30 (Obese)
0.080 (0.021)
0.044 (0.019)
0.034 (0.023)
0.039 (0.018)
Average Family Income Since Birth (in units of $10,000)
0.005 (0.02)
0.01 (0.02)
0.02 (0.02)
0.0001 (0.002)
Percent of Child’s Life Mother was Married
-0.060 (0.025)
-0.033 (0.018)
-0.003 (0.024)
-0.020 (0.024)
Pseudo R-Squared
0.103 0.069 0.068 0.079
Number of Observations
4,691 4,692 4,692 4,691
Notes: The dependent variable is a binary variable equal to 1 if child’s BMI is above the 95th percentile for his/her age. The standard errors are robust, clustered on the mother’s identification code, as there are multiple children per mother. All models also include dummy variables for whether mother reported child’s height and weight, mother’s afqt score, child’s birth weight, both the child’s and mother’s age in years, dummy variables for the year of the survey, controls for education levels of the mother’s parents, dummy variables indicating whether mother’s parents were present when she was 14, and a dummy variable indicating whether the child is female. All estimates are weighted using the child’s sampling weight.
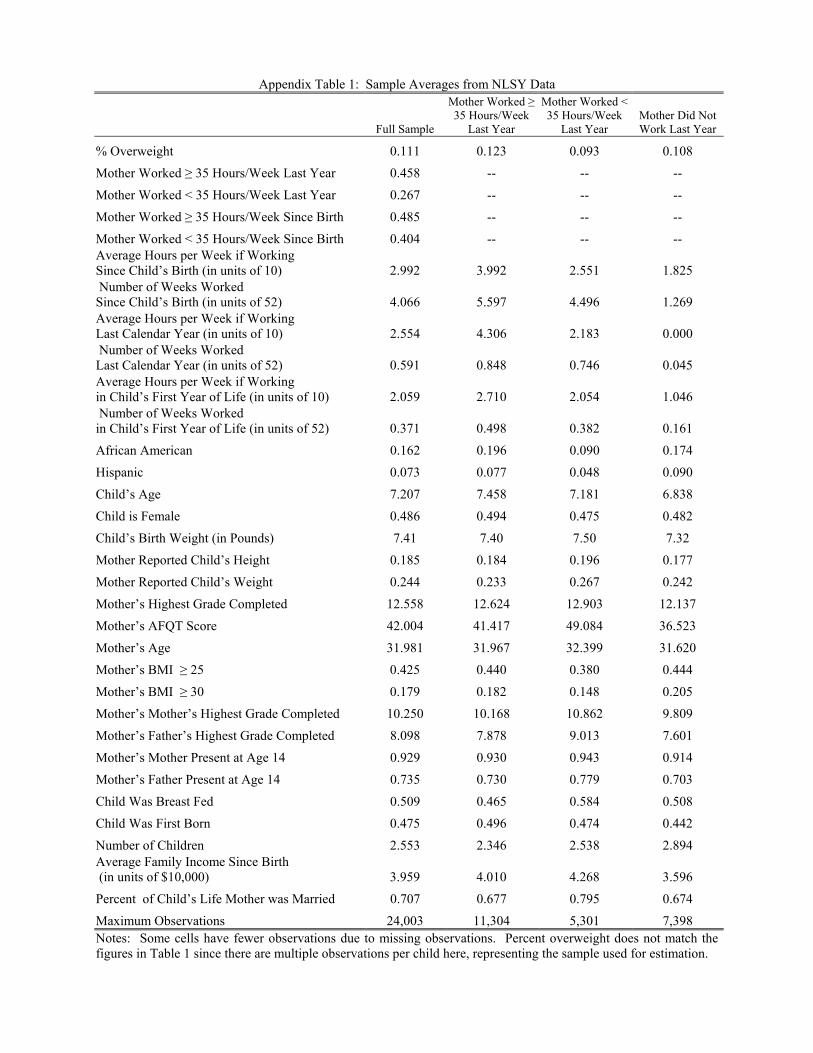
Appendix Table 1: Sample Averages from NLSY Data
Full Sample
Mother Worked ≥ 35 Hours/Week
Last Year
Mother Worked < 35 Hours/Week
Last Year Mother Did Not Work Last Year
% Overweight 0.111 0.123 0.093 0.108
Mother Worked ≥ 35 Hours/Week Last Year 0.458 -- -- --
Mother Worked < 35 Hours/Week Last Year 0.267 -- -- --
Mother Worked ≥ 35 Hours/Week Since Birth 0.485 -- -- --
Mother Worked < 35 Hours/Week Since Birth 0.404 -- -- -- Average Hours per Week if Working Since Child’s Birth (in units of 10) 2.992 3.992 2.551 1.825 Number of Weeks Worked Since Child’s Birth (in units of 52) 4.066 5.597 4.496 1.269 Average Hours per Week if Working Last Calendar Year (in units of 10) 2.554 4.306 2.183 0.000 Number of Weeks Worked Last Calendar Year (in units of 52) 0.591 0.848 0.746 0.045 Average Hours per Week if Working in Child’s First Year of Life (in units of 10) 2.059 2.710 2.054 1.046 Number of Weeks Worked in Child’s First Year of Life (in units of 52) 0.371 0.498 0.382 0.161
African American 0.162 0.196 0.090 0.174
Hispanic 0.073 0.077 0.048 0.090
Child’s Age 7.207 7.458 7.181 6.838
Child is Female 0.486 0.494 0.475 0.482
Child’s Birth Weight (in Pounds) 7.41 7.40 7.50 7.32
Mother Reported Child’s Height 0.185 0.184 0.196 0.177
Mother Reported Child’s Weight 0.244 0.233 0.267 0.242
Mother’s Highest Grade Completed 12.558 12.624 12.903 12.137
Mother’s AFQT Score 42.004 41.417 49.084 36.523
Mother’s Age 31.981 31.967 32.399 31.620
Mother’s BMI ≥ 25 0.425 0.440 0.380 0.444
Mother’s BMI ≥ 30 0.179 0.182 0.148 0.205
Mother’s Mother’s Highest Grade Completed 10.250 10.168 10.862 9.809
Mother’s Father’s Highest Grade Completed 8.098 7.878 9.013 7.601
Mother’s Mother Present at Age 14 0.929 0.930 0.943 0.914
Mother’s Father Present at Age 14 0.735 0.730 0.779 0.703
Child Was Breast Fed 0.509 0.465 0.584 0.508
Child Was First Born 0.475 0.496 0.474 0.442
Number of Children 2.553 2.346 2.538 2.894 Average Family Income Since Birth (in units of $10,000) 3.959 4.010 4.268 3.596
Percent of Child’s Life Mother was Married 0.707 0.677 0.795 0.674
Maximum Observations 24,003 11,304 5,301 7,398 Notes: Some cells have fewer observations due to missing observations. Percent overweight does not match the figures in Table 1 since there are multiple observations per child here, representing the sample used for estimation.
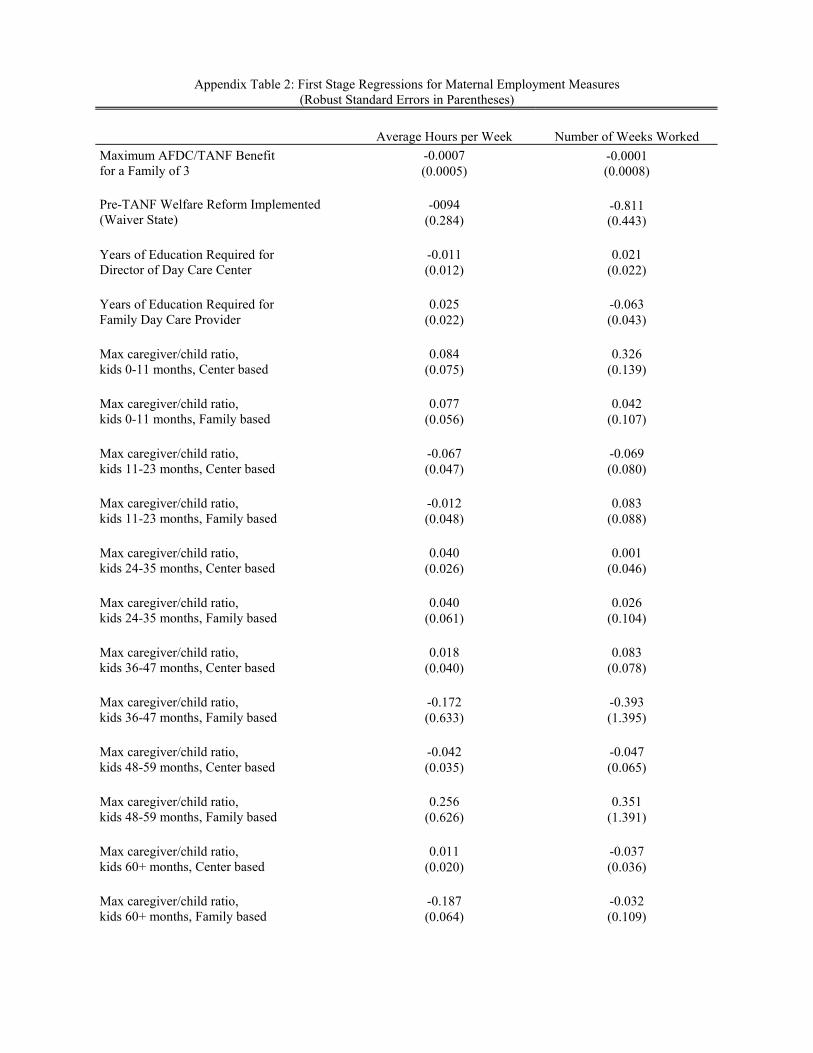
Appendix Table 2: First Stage Regressions for Maternal Employment Measures (Robust Standard Errors in Parentheses)
Average Hours per Week
Number of Weeks Worked
Maximum AFDC/TANF Benefit for a Family of 3
-0.0007 (0.0005)
-0.0001 (0.0008)
Pre-TANF Welfare Reform Implemented (Waiver State)
-0094 (0.284)
-0.811 (0.443)
Years of Education Required for Director of Day Care Center
-0.011 (0.012)
0.021 (0.022)
Years of Education Required for Family Day Care Provider
0.025 (0.022)
-0.063 (0.043)
Max caregiver/child ratio, kids 0-11 months, Center based
0.084 (0.075)
0.326 (0.139)
Max caregiver/child ratio, kids 0-11 months, Family based
0.077 (0.056)
0.042 (0.107)
Max caregiver/child ratio, kids 11-23 months, Center based
-0.067 (0.047)
-0.069 (0.080)
Max caregiver/child ratio, kids 11-23 months, Family based
-0.012 (0.048)
0.083 (0.088)
Max caregiver/child ratio, kids 24-35 months, Center based
0.040 (0.026)
0.001 (0.046)
Max caregiver/child ratio, kids 24-35 months, Family based
0.040 (0.061)
0.026 (0.104)
Max caregiver/child ratio, kids 36-47 months, Center based
0.018 (0.040)
0.083 (0.078)
Max caregiver/child ratio, kids 36-47 months, Family based
-0.172 (0.633)
-0.393 (1.395)
Max caregiver/child ratio, kids 48-59 months, Center based
-0.042 (0.035)
-0.047 (0.065)
Max caregiver/child ratio, kids 48-59 months, Family based
0.256 (0.626)
0.351 (1.391)
Max caregiver/child ratio, kids 60+ months, Center based
0.011 (0.020)
-0.037 (0.036)
Max caregiver/child ratio, kids 60+ months, Family based
-0.187 (0.064)
-0.032 (0.109)
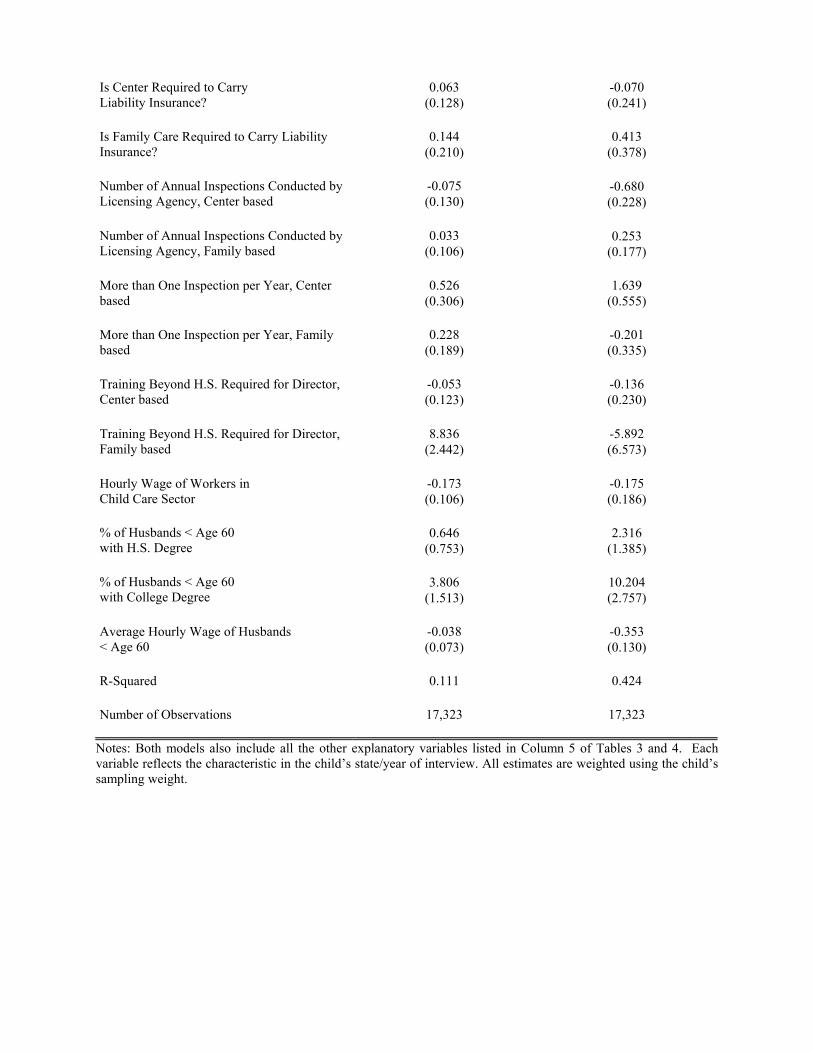
Is Center Required to Carry Liability Insurance?
0.063 (0.128)
-0.070 (0.241)
Is Family Care Required to Carry Liability Insurance?
0.144 (0.210)
0.413 (0.378)
Number of Annual Inspections Conducted by Licensing Agency, Center based
-0.075 (0.130)
-0.680 (0.228)
Number of Annual Inspections Conducted by Licensing Agency, Family based
0.033 (0.106)
0.253 (0.177)
More than One Inspection per Year, Center based
0.526 (0.306)
1.639 (0.555)
More than One Inspection per Year, Family based
0.228 (0.189)
-0.201 (0.335)
Training Beyond H.S. Required for Director, Center based
-0.053 (0.123)
-0.136 (0.230)
Training Beyond H.S. Required for Director, Family based
8.836 (2.442)
-5.892 (6.573)
Hourly Wage of Workers in Child Care Sector
-0.173 (0.106)
-0.175 (0.186)
% of Husbands < Age 60 with H.S. Degree
0.646 (0.753)
2.316 (1.385)
% of Husbands < Age 60 with College Degree
3.806 (1.513)
10.204 (2.757)
Average Hourly Wage of Husbands < Age 60
-0.038 (0.073)
-0.353 (0.130)
R-Squared
0.111
0.424
Number of Observations
17,323
17,323
Notes: Both models also include all the other explanatory variables listed in Column 5 of Tables 3 and 4. Each variable reflects the characteristic in the child’s state/year of interview. All estimates are weighted using the child’s sampling weight.