nber working papers series anatomy of … · nber working papers series anatomy of financial...
TRANSCRIPT

NBER WORKING PAPERS SERIES
ANATOMY OF FINANCIAL DISTRESS:AN EXAMINATION OF JUNK-BOND ISSUERS
Paul Asquith
Robert Gertrier
David Scharf stein
Working Paper No. 3942
NATIONAL BUREAU OF ECONOMIC RESEARCH1050 Massachusetts Avenue
Cambridge, MA 02138December 1991
This paper is part of NBER's research program in CorporateFinance. Any opinions expressed are those of the authors and notthose of the National Bureau of Economic Research.
NBER Working Paper #3942December 1991
ANATOMY OF FINANCIAL DISTRESS:AN EXAMINATION OF JUNK-BOND ISSUERS
ABSTRACT
This paper examines the events following the onset of
financial distress for 102 public junk bond issuers. We find
that out-of-court debt relief mainly comes from junk bond-
holders; banks almost never forgive principal, though they do
defer payments and waive debt covenants. Asset sales are an
important means of avoiding Chapter 11 reorganization; however,
they may be limited by industry factors. If a company simply
restructures its bank debt, but either does not restructure its
public debt or does not sell major assets or merge, the company
goes bankrupt. The structure of a company's liabilities affects
the likelihood that it goes bankrupt; companies whose bank and
private debt are secured as well as companies with complex public
debt structures are more prone to go bankrupt. Finally, there is
no evidence that more profitable distressed companies are more
successful in dealing with financial distress; they are not less
likely to go bankrupt, sell assets, or reduce capital expenditures.
Paul Asquith Robert GertnerSloan School of Management Graduate School of BusinessM.I.T. University of Chicago50 Memorial Drive 1101 E. 58th StreetCambridge, MA 02139 Chicago, IL 60637
David ScharfsteinSloan School of ManagementM.I.T.50 Memorial DriveCambridge, MA 02139and NBER

1. Introduction
What are the COsts of financial distress? There are as many answers as models. In
truth, no one knows, though these costs are presumed to be a central component of
capital structure decisions. Indeed, we do not even know much about what companies
do when they get into financial trouble. This paper begins to fill this gap — first bydocumenting how companies cope with financial distress, and second by analyzing
what implications these findings have for understanding the costs of financial distress.
Our study is based on a sample of 102 companies that issued high-yield "junk"
bonds, during the 1970s and 1980s and subsequently got into financial trouble. These
companies deal with distress in one or more ways. They: (i) restructure their bank and
private debt through direct negotiations; (ii) restructure their public debt with an ex-
change offer of cash and securities; (iii) get an infusion of new capital; (iv) sell major
assets or merge; (v) reduce capital expenditures; and (vi) file for Chapter 11 reorganiza-
tion.
There are a number of striking facts that emerge:
(1) Outside of formal bankruptcy proceedings, banks almost never (there is one
exception) forgive principal on their loans and they rarely provide new financing. They
often waive covenants and defer principal and interest payments, buy they also often
force accelerated payments and increase their collateral.
(2) Asset sales are an important means of avoiding bankruptcy; only 3out of 21
companies that sell over 20% of their assets go bankrupt. But, asset sales are limited by
industry factors. Consistent with Shleifer and Vishny's (1991) model, companies in
poorly performing industries or in industries with high leverage (so that there is less
debt capacity in the industry to finance an acquisition) are less likely to sell assets.
(3) Public debt restructurings through exchange offers are also crucial for avoiding
bankruptcy. Every company in the sample that simply restructures its bank debt, but
either fails to restructure its public debt or does not sell major assets or merge, goes
bankrupt.

(4) The structure of a company's liabilities affects the likelihood that it goes bank-
rupt. In particular, companies whose bank and private debt is secured as well as com-
panies with complex public debt structures are more prone to end up seeking
bankruptcy protection.
(5) There is no evidence that companies with better performance are more succes-
sful in dealing with financial distress. Better companies (measured by operating income
and cash flow shortages) are not less prone to go bankrupt, sell assets, or reduce capital
expenditures.
(6) Capital expenditure reductions are large. 83% of the firms reduce capital expen-
ditures from the year before the onset of distress to the year after. Industry factors and
company downsizing account for much, but not all, of the reduction.
We conclude that banks do not play much of a role in resolving financial distress.
This is despite the view that one of the benefits of borrowing from a bank is that the
bank is in a better position by virtue of its relationship with the firm to assist it in finan-
cial distress. Nevertheless, companies that restructure their bank debt are just as likely
to go bankrupt as those that do noL Real debt relief --when it is obtained -- comes from
subordinated public creditors.
In our view, banks play such a limited role because of the presence of subordinate
public debt. The reason is that bank-led bailouts primarily benefit the subordinated
creditors since they are the residual claimants. Also, because the banks are always se-
nior — and in many cases secured -- they stand to do quite well in bankruptcy. There-
fore their incentive to take unilateral steps to help the company are quite limited; this is
a variation on the familiar debt overhang problem identified by Myers (1977). Thus it is
not surprising that we find that companies whose private debt is secured are more
prone to file for Chapter 11.
What is in some ways more puzzling is why there aren't more comprehensive debt
restructurings of both the bank debt and the public debt. These would avoid costly
Chapter 11 filings that occur so often in our sample. The answer must be either that

Chapter 11 is not very expensive, or that there are substantial impediments to compre-
hensive out-of-court restructurings. Our finding that companies with compkx debt
structures are more prone to go bankrupt is consistent with the latter view.1
This evidence is indirect support for the notion that financial distress is costly. So is
our finding that operating performance does not seem to affect whether or not a
company files for bankruptcy. As Jensen (1989) has suggested one would expect good
companies that get into trouble just because of high leverage to be able to restructure
(almost) costlessly out of court; there is too much to lose by not doing so. But, this ap-
parently is not the case. Moreover, the fact that asset sales are limited by industry fac-
tors adds to the costs of distress. Firms might prefer to bear the costs of an expensive
restructuring to selling assets below their intrinsic value.
The remainder of the paper is organized as follows. The next section describes our
sample selection and data sources. Sections 3 and 4 provide summary sample statistics
on the causes and severity of financial distress in our sample and describe the varia-
tions in debt structure. Sections 5-9 contain analyses of bank restructurings, public debt
restructurings, asset sales, capital expenditures, and bankruptcy, respectively. Section
10 is a brief conclusion.
2. Sample Selection and Data Description
Our sample selection procedure is motivated by our desire to include firms that get
into financial distress because of high leverage rather than poor operating performance.
For this reason, we choose to look at firms which issued high-yield public bonds
("junk' bonds) since these companies have significantly higher leverage than average
companies. In addition, the incidence of distress, as measured by default, is large.2 One
potential disadvantage of restricting attention to junk-bond issuers is that these firms
I See Bulow and Shoven (1978), White (1980), Roe (1987), and Gez-tncr and Scharfstcin (1991) fortheoretical arguments for this view.
2 Our ample is drawn from the universe of firms that issued high-yield public debt in the 1970s and
1980s, the sample analyzed by Asquith. Mullins, and Wolff (1989).
3

all have significant public debt in their capital structure, so our results may apply only
to firms with public debt. This is a caveat that should be kept in mind throughout and
we will remind the reader when it seems most relevant.
We do not select distressed firms on the basis of market performance, since market
performance measures presumably include some information about the ability of a firm
to cope with financial distress. If the market perceives that a particular company will be
able to resolve its financial distress costlessly, the market reaction to the distress will
not be severe. Therefore, a sample based on stock market returns will be biased to firms
with relatively costly financial distress.
We define financial distress based on interest coverage ratios. A firm is classified as
financially distressed if in any two years after issuing junk bonds, its earnings before
interest, taxes, depreciation, and amortization (EBJTDA) is less than its reported inter-
est expense, or if in any one year EB1TDA is less than 80% of its interest expense. We do
not include a firm if it has an interest coverage ratio between 0.8 and 1.0 in one year.
This is because the several firms that satisfy this condition took no discernable actions
in response to distress, having sufficient liquid funds to meet their interest payments.
In addition, firms may have especially high interest expense in the year they issue pub-
lic debt because fees may be included in interest expense and the company may not
have fully invested the proceeds of the issue. They may use some of these proceeds to
pay first year's interest.
In addition, we eliminate firms which list a financial industry as their primary SIC
code.3 We require that firms have publicly-traded equity, in order to have access to full
financial and market data. Thus, there are no LBOs in the sample.4
The resulting sample consists of 102 firms. For each of these firms, we collect data
from a variety of sources. Financial accounting data comes from Compustat and indi-
vidual 10-K filings with the Securities and Exchange Commission. Market return data
This does not eliminate all firms with significant financial components; there are a few home buildersin the sample which own a financial subsidiary.For information on the incidence of financial distress in LBOs, see Kaplan and Stein (1991).

comes from CRSP at The University of Chicago. We also do extensive searches on the
Nexis databae which includes the Wall Street Journal Index, The New York Times, other
newspapers, trade journals, business journals, and press releases.
We collect data along four basic dimensions: operating performance, including
industry-adjusted performance; capital structure; asset sales; and financial restructur-
ings. Our basic measure of performance is earnings before interest, taxes, and depreci-
ation, although we also collect from Compustat and 10-Ksdata on sales, book value of
assets, cash holdings, working capital, book value of equity, and capital expenditures.
Industry performance controls, capital structure and size comparisons are collected
by matching the sample firm's principal 4-digit SIC code from Dun and Bradstreet's
Million Dollar Directory with other public firms with the same principal SIC code.5 The
data for these firms are then collected from Compustat. We derive deviations from in-
dustry medians for firms in the sample.
Capital structure information on Compustat is insufficiently detailed for our analy-
sis, so we collect this information directly from 10-Ks. In particular, we collect a great
deal of information on private debt, including the extent to which it is secured by the
firm's assets, the number of lines of credit, whether the debt is bank debt or not, and
whether the bank debt is syndicated. We collect similar detailed information on the
public issues, paying close attention to the number of different issues, the number of
levels of subordination of the public debt, and its maturity structure. We feel that many
of these details may affect the incentives of creditors to renegotiate their claims and the
efficiency of the bargaining process outside of bankruptcy, so if we wish to study how
'capital structure affects the resolution of distress, it is necessary to collect data at this
level of detail.
Asset sales are the most difficult information on which to get consistent data across
firms. The main source of this information is in the notes to the 10-Ks and press releases
We use the Million Dollar D:rcctory's classification instead of Compustats because Compustat onlylists the most recent SIC code. Since distressed companies move in and out of industries quite oftinit is important to have an accurate industry cIssi1ication at the time of distress.
obtained from Nexis. Although firms do seem to report major asset sales regularly, they
do not report standard information about these sales. When possible, we collect the
cash component of the sale, and then separately collect the stated value of securities or
other consideration given the selling firm. Finally, information about financial restruc-
turings including covenant waivers, exchanges, and bankruptcies are taken from the
10-Ks and Nexis.
3. Sources of Financial Distress
The coverage shortfall criterion for financial distress can be met for three broad
reasons: an industry downturn, highinterestexpense, or poor firm operating perform-
ance relative to its industry. In this section, we discuss the importance of these three
factors for triggering financial distress. Table I contains some relevant summary statis-
tics. Firms in our sample have approximately twice the interest expense of the median
firm in their industry; junk- bond issuers are, not surprisingly, highly-leveraged. The
median firm in the sample barely has positive EBITDA in the first year of financial dis-
tress and the mean return on assets is 0.12 less than the industry median. Only 5 firms
outperform the industry median firm in year 0. In the first year of financial distress, the
average firm's industry performs slightly worse than in the previous year.
We make the following three calculations for each firm in order to allocate the un-
portance of the three factors in causing financial distress: (1) How much would cash
flow improve in year 0 if the firm did as well as the median firm in its industry? (2)
How much would the firm's cash flow improve in year 0 if it had the same ratio of in.
terest expense to assets as the median firm in its industry? (3) How much would the
firm's cash flow improve in year 0 if it did as well relative to industry as it actually did,
but the industry did as well as it did in the previous year? The percentage of distress
cause we allocate to firm operating performance is the answer to (1) divided by the sum
of (l)-(3), the percentage we allocate to leverage is (2) divided by the sum of (l)-(3), and
the percentage we allocate to industry performance is (3) divided by the sum of (l)-(3).
6

Panel B of Table 1 shows that firm performance is the most important factor, ac-
counting for 60% of the initial cash flow shortage, the high leverage of our sarple is
responsible for 24% of cash flow shortage, and industry performance accounts for the
remaining 16%. Only 9 firms have high leverage as the primary cause of distress and
15 have poor industry performance as the primary cause.
Thus, our attempts to generate a large sample of financially distressed companies
that are not economically distressed is not entirely successful. Even among junk-bond
issuers, the majority of firms that suffer from financial distress under-perform other
firms in their industry significantly.
4. Debt StructureA sizable portion of our analysis deals with the relation between the details of capi-
tal structure and the resolution of distress. Before proceeding, it is useful to have a pic-
ture of how the liabilities of the sample are structured before they get into trouble.
Table 2 provides summary statistics on the debt structure of the sample companies. The
data are from year -1, one year before the initial coverage shortfall. In almost all cases,
companies have not yet begun any financial restructuring at this time.
As the table indicates, total debt is divided about evenly between public and pri-
vate sources — 51.5% is publicly-held issues while 48.5% is private debt held by banks
and other financial institutions. The public debt is typically subordinate in right of pay-
ment to the bank and institutional debt, which comprise most of a company's senior
debt.
Of the public debt, only a small fraction is secured. Further, the numbers in Table 2
probably overstate the degree of security of public debt because in many cases the pub-
lic debt has only second or third liens on assets, behind the liens of private lenders.
On average, the sample companies have more than 2 public debt issues outstand-
ing. Although these issues are all subordinate to the senior debt, they may have differ-
ent rankings relative to each other. Most companies only have one tier of subordinated
7

debt, but there are 37 companies with at least two tiers.'
Of the private debt, 61.0% is bank debt the remainder is usually held by insurance
companies and other non-bank financial institutions. In almost all cases the company
has a main credit facility with a bank from which it draws funds on a revolving basis.
This facility comprises a large portion of the bank debt.
5. Bank Debt Restructurings
Of the 76 companies in our sample that react to financial distress by restructuring
their assets or liabilities significantly, 59 (78%) restructure their bank debt in some way.
Bank debt restructurings are most often triggered by a covenant violation, an omitted
debt payment to the bank, or the recognition that either will soon occur. There are 43
covenant violations in the sample and 21 instances in which the company fails to make
a payment to the bank
Usually, covenants are written so that if the borrower violates a covenant or misses
a debt payment, the bank can call the loan? Typically banks do not fully exercise these
contractual rights, choosing instead to restructure the debt. In every case in which a
firm either violates a covenant or misses a debt payment there is some restructuring,
though it is often a limited restructuring. The incentive to restructure is clear if there
are substantial deadweight costs of bankruptcy. Bargaining takes place in the shadow
of these potential costs and the threat point is the bank's right to call the loan and trig-
ger bankruptcy.
A bank debt restructuring can take many forms. But, one form that it rarely takes is
forgiveness of principal. It is clear why a senior -- possibly secured -- bank lender
would not unilaterally forgive principal. By simply deferring principal and interest pay-
We determine the number of tiers based upon the priority suggested by the names of the securities.It is possible that we under-measure the number of tiers because iwo debentures with the same titlemay have unequal ranking.There are some instances in which covenant violations trigger an increase in the interest rate.

ments the bank can easily let the company stay in business. But, by not reducing its full
claim, the bank does not compromise its claim in bankruptcy.
The more puzzling question is why we do not see principal forgiveness of senior
bank debt as part of a comprehensive debt restructuring which includes the subordi-
nated public debt. Zapata is the only such case in our sample. Zapata's principal bank
lender agreed to take a package of cash, debt, and equity in exchange for $595 million
of its original unsecured debt as part of a comprehensive restructuring which included
as asset sale and an exchange of the subordinated public debt. In many ways the re.
structuring resembles a Chapter 11 reorganization. But, this is the only such case.
The other bank debt restructurings that we observe are more modest in scope. Re-
struct'urings can take one of two broad forms: banks can "loosen the screws" by waiving
covenants, delaying principal and interest, or reducing the interest rate. Alternatively,
banks can "tighten the screws" by reducing lines of credit or increasing their collateral.
Most often, banks simultaneously loosen the screws in one way and tighten them in
another. For example, when Kenai violated a covenant in its bank loan agreement, the
bank waived the covenant but converted its otherwise unsecured line into a secured
line. Similarly, Digicon's bank waived the covenant violation, but forced them to pay
down $79 million on their $60 million revolver.
In our sample there are 35 cases in which a bank waives covenant out of a total of
43 covenant violations. By itself, a covenant waiver does not constitute much of a re-
structuring. In many of these cases, the covenant is waived for a short period untilthe
technical default can be cured or the debt can be restructured. In the 8 cases in which
the bank did not waive a covenant, the maturity of the debt was extended without an
explicit waiver in 2 cases, the line of credit was reduced in 5 cases, and in another case
the firm filed for Chapter 11 reorganization shortly afterwards.
In 28 cases, banks permit companies to delay debt payments. often converting a
revolving line of credit into a term loan. Sometimes they simultaneously lower interest
rates although in other cases interest rates are increased.
In 21 instances, a bank with a revolving line of credit tightens the screws by either
reducing the amount available on the line or forcing the firm to pay down outstanding
balances. There are 11 cases in which a bank takes new collateral on an outstanding
loan. In some cases the collateral increase is combined with the bank reducing its expo-
sure; in others, the collateral increase is compensation for allowing the company to
delay its principal and interest payments.
The incentive to loosen or tighten the debt contract depends on a number of factors.
First, one might expect banks to be more lax with better performing companies or those
with better prospects. We find no evidence for this. Second, banks should be more re-
luctant to loosen the screws when they have only a small portion of the debt; the other
creditors reap much of the benefit. Again there is no evidence to support this view.
Finally, the bank's security status should affect its restructuring incentives; here the
date are more enlightening. Banks whose loans have collateral well in excess of their
outstanding balance have little to lose by loosening the screws: even if the firm does
poorly there is a deep cushion to protect the bank. If they tighten the screws, they risk
bankruptcy, in which case they are likely to be paid in full, but may bear costs in pur-
suing their claim. In addition, sometimes bankruptcies have a life of their own, so there
is always some risk that the deep cushion may disappear. Secured banks with small
cushions have the opposite incentives. If firm value improves they gain nothing since
they are already secured; if it falls, they bear most of the costs. We should see these
banks be most aggressive in pursuing their claims.
The incentives of unsecured banks are more complicated. Since they typically hold
short-term debt, they have some implicit seniority, to the extent that they are paid be-
fore others outside of bankruptcy. But, by extending maturity they give up some of
their implicit seniority; their unsecured status means they are likely to do worse in a
Chapter 11 reorganization than a secured creditor. Thus, we should see banks with
unsecured, short-term loans tighten the screws by either pulling money out of the firm
or by trying to increase their security status.
10

The data are generally in line with this prediction. In cases where the bank extends
maturity, on average 65% of the private debt is secured, whereas when the bank does
not extend maturity, 51% is secured. The medians are 79% and 51% respectively. The
difference of the means is statistically significant at the 5% level. For banks that reduce
lines of credit the results are less clear. The differences in the ratios are consistent with
the theory, but the differences are small and not statistically significant.
In addition to restructuring existing debt, banks sometimes -- though not often --
provide new financing. This happens for 7 firms. The new money is an average of 20%
of the original loan. In 4 of the cases — National Healthcare, Zapata, Kenai, and Radice
-- the bank provides new financing in exchange for securing its previously unsecured
loan. In these cases, even though the new secured loan might not be profitable for the
bank, taken as a package, the security on the old debt may make the transaction profit-
able by improving the bank's position in bankruptcy. There is no discernable pattern in
the other 3 cases. In the case of Cardis, the new money was loaned as part of restruc-
turing of a secured loan in which payments are deferred. In another case, Hardwicke
simultaneously pays down part of the loan with an asset sale and borrows some more
to finance working capital. And finally Documation increases its unsecured revolver
substantially, only to violate covenants shortly afterwards. The company was then ac-
quired.
6. Public Debt Restructurings — Exchange Offers
While bank debt restructurings are usually the result of direct negotiation, the prin-
cipal mechanism through which public debt is restructured is an exchange offer: the
firm offers a package of cash and securities in exchange for some or all of its outstand-
ing debt. The offer is usually contingent on the tender of a minimum fraction of the
debt. Restructuring takes this form rather than a direct renegotiation with large debt-
The terms of an exchange are often the outcome of negotiation between the firm and large dcbthold-ers.
LI

holders or a trustee because the Trust Indenture Act of 1939 prohibits any voting
mechanism (except unanimity) to alter the interest and principal payments on public
debt. Thus, debtholders cannot include in the indenture a provision that allows them to
reduce principal, if, for example, two-thirds subsequently agree to do so.9 The only
ways to restructure public debt are either agreements with individual debtholders or
tender offers which exchange the old debt for securities which effectively lead to reduc-
tions of principal or longer maturity.
As Roe (1987) and Gertner and Scharfstein (1991) point out, however, exchange
offers present problems of their own. If debtholders all have small stakes, no individual
debtholder has an incentive to forgive principal or take a more junior claim such as
equity or even longer maturity debt. He has no effect on whether the exchange goes
through; if the offer is successful, others bear the cost, and he retains his full claim. If
the exchange does not go through, his tender decision is irrelevant. So, there can be
severe holdout problems, and as a result we may not expect to see many exchanges.
However, exchanges are quite common -- 34 companies successfully complete ex-
changes, many for more than one debt issue and some at more than one time. There are
a total of 93 public debt issues exchanged. There are two explanations. First, debenture
holders, in some instances, have large stakes and presumably take into account their
effect on the outcome of the exchange offer. For example, First Executive Corporation
held 82% of FPA's 12 5/8% senior notes and 87% of its 14 1/2% subordinated deben-
tures. The exchange that occurred in July 1990 was more a negotiated restructuring
than an arms-length transaction.
Second, as pointed out in Gertner and Scharfstein (1991) exchange offers can be
structured to eliminate the holdout problem by offering debtholders more senior secu-
rities or, when it is available, cash. For example United Merchants and Manufacturers
offered each holder of $1000 of its 15% subordinated debentures, $950 of 3% senior sub-
Theyare able to change covenants. however. For a discussion about how this can be used as a part ofan exchange offer, see Coffee and Klein (199) and Gertner and Scharfstcin (1991).
12

ordinated debentures, with a second lien on all assets of the company except accounts
receivable. Consider the decision facing a small debtholder. If everyone else tenders, he
owns a junior claim that is potentially worthless in bankruptcy.'° The prospect of being
further subordinated in the debt structure induces debtholders to tender even if they
are made no better off (and possibly worse off) as a group. The holdout problem is
transformed into a "hoId-in problem in which debtholders rush to exchange. Such
exchanges are quite common: of the 93 successful exchanges, at least 38 offer a more
senior security as part of the exchange and 9 addition exchanges offer just cash.
Completing an exchange is a key determinant of whether a firm can avoid Chapter
11. Two facts make this clear. Of the 13 companies that try an exchange and fail, 12 later
file for bankruptcy protection. The only one that does not, Electro-Audio Dynamics,
liquidates itself outside of Chapter 11 over several years.
Moreover, of the 34 companies that complete an exchange, just 9 go bankrupt. This
is lower than the 33 bankruptcies among the 42 companies that do some restructuring
other than an exchange." Of these 9 companies that avoid Chapter 11, 7 are acquired
and the 2 others sell a large fraction of their assets. This points out the importance of
public debt exchange offers relative to bank debt restructurings for keeping companies
out of bankruptcy court.
Finally, there is an important difference between the exchanges of companies that
avoid Chapter 11 and those that ultimately file. In the former case, most -- 14 out of 20
companies on which we have data -- provide some permanent relief by reducing prin-
cipal and offering equity in an exchange. By contrast, of the 10 exchanging companies
that eventually go bankrupt, only 3 offer such relief.'2
Shortly after the exchange, United Merchants filed for bankruptcy. In the reorganization plan, hold-ers of the old debentures are to be paid substantially less than debtholdcrs who tendered.' If we include in the denominator, companies that weather distress without any restructuring or ma-jor asset sales, the percentage of firms that do not attempt an exchange that go bankrupt is 55%which is still larger than the 29% of firms that complete an exchange. In addition, because we includeas successful exchanges, any exchange in which the debtor accepts some securities, the category con-tains some exchanges that the debtor would undeniably call a failure.
2 Relief may come in other ways such as a reduction and deferral of interest payments, interest pay-ments in common stock elimination of restrictive covenants, or elimination of a sinking fund pay-
'3

7. Asset Sales and Mergers
One of the most natural ways for a financially distressed company to generate cash
is to sell off some or all of its assets. There are three potential barriers to use of asset
sales. First, management and equity may have little incentive to sell assets. When a firm
is in serious financial distress, it is likely that the liquidation value of the firm is less
than the firm's liabilities.'3 When this is the case, the only value of equity is its option
value. Even if the firm's assets are worth more than its liabilities, the option value may
be an important component of equity's value. By selling assets, equity is giving up the
option value of those assets. Thus, equity will not have much incentive to sell assets.
Management, to the extent that they act as agent's of equity will also have reduced in-
centives. The incentives of a manager who considers his own career in addition to (or
instead of) equity's interests may wish to. sçll assets to avoid stigma associated with
bankruptcy, but may also wish to maintain as large an organization as possible.
Second, Shleifer and Vishny (1991) point out that industry factors may limit the
ability of companies to sell assets at a reasonable price. If a financially distressed com-
pany is in a financially distressed industry, natural industry buyers may not have suffi-
cient to cash to buy the asset. And, given debt overhang and asymmetric information
problems, it may be difficult and costly for them to raise funds externally. The same
argument can be made for companies in good industries but which have high leverage.
Finally, private and public debt covenants may put severe restrictions on the ability
of firms to sell assets and on the use of proceeds from any asset sales that are not pro-
hibited. An individual creditor will be concerned that the firm will sell assets to pay
back other creditors, pay dividends, or use as working capital. Moreover, proceeds
from the sale of assets which secure a loan will typically need to be used to pay back
the principal on the secured debt. Therefore, if an asset is worth less than the face value
rnent. We have not yet collected information on this although we plan to do so.By liquidation value, we do not necessailly mean piecemeal liquidation, but include the possibility ofsell the entire firm or divisions as going-concerns.
14

of the claim that it secures, a sale of that asset will not service unsecured debt nor pro-
vide funds for operations.
Thus, some creditors -- particularly secured creditors -- may seek to force asset
sales and others may wish to block them. Sometimes an asset sale may benefit all credi-
tors since they can extinguish equity's call option on the assets. And, management may
in some cases want to sell assets for good economic reasons. Thus, it seems important
to think of asset sales, not as unilateral decisions by management, but as negotiated
agreements with privates and perhaps public, creditors.
Measuring asset sales is quite difficult since there is no standard way that compan-
ies report them and one cannot get reliable numbers from Compustat. Most-companies
report major asset sales in the notes to their financial statements in 10-Ks.They invari-
ably report the cash component of the sale, but often give only sketchy details on other
consideration received such as securities and assumption of liabilities of the seller. We
include the value of the non-cash portion of the deal when it is reported. Moreover,
some asset sales take the form of piecemeal liquidation of capital and shut-downs. LI
they are not reported in the notes of financial statements, we do not include them in
asset sales. We only include asset sales prior to Chapter 11, for those companies that go
bankrupt.Our measure of asset sales is the total (cash and non-cash) proceeds of the sale di-
vided by the book value of assets in year -1. Note that we normalize a market value
number by a book value number; this has some obvious limitations. One alternative
would be to use the book value of the assets sold, but we could not get such informa-
tion. The other possibility would be to normalize by the market value of all assets, but
it is virtually impossible to measure the market value of most debt.
Overall, asset sales play a fairly important role in restructurings. On average, com-
panies sell 12% of their assets. Twenty-one companies sell more th2O% of their as-
s, and the median level among these twenty-one firms is 48%. Although the use of
proceeds from asset sales is difficult to follow directly, there is some indication that
'5

much of it goes to pay off senior private debt. The median percentage reduction of non-
public debt from year -1 to year 1 for firms that sell at least 20% of their assets is -61%
while the median percentage change in non-public debt over the same period for firms
that sell less than 20% of their assets is a 34.6% increase. The same numbers for public
debt are a 10% decrease for the median asset seller and no change for the median non-
asset seller.
Summary statistics on the relation between asset sales and a variety of variables are
reported in the first two columns of Table 4. Firms that sell assets are considerably less
likely to go bankrupt — only 14% (three out of twenty-one) compared to 49% of the
non-asset sellers. Firms that sell a large fraction of their assets are more likely to com-
plete a successful exchange --62% (13 of 21) versus 28% (22 of 79) for non-asset sellers.
And, as we discuss in more detail below, asset sellers are in less highly leveraged in-
dustries than non-asset sellers. There are no other statistically significant differences in
the means.
The first column of Table 5 reports probit results where the dependent variable is a
dummy equal to one if the firm sells at least 20% of its assets. Operating performance
variables are statistically insignificant as are degree of distress and firm capital struc-
ture variables. The number of public debt issues outstanding is marginally significant
and positive. We do not have a good explanation for its relevance to asset sales.
The two significant variables are both industry variables: industry leverage and
industry Tobin's q. Although statistically significant, the economic magnitude of the
coefficients is not particularly large. A one standard deviation increase in industry le-
verage reduces the likelihood of significant asset sales by .06 and a one standard devi-
ation increase in the reciprocal of industry Tobins q, also reduc?s the likelihood of
significant asset sales by .06.
These estimates are consistent with Shleifer and Vishny (1991) who argue that the
market for assets of financially distressed firms may be quite illiquid because the poten-
tial buyers who value the assets most may also be suffering from distress. Additionally,
16

high industry leverage will make asset sales more difficult since indust-iy participants
will be constrained in their ability to take on new debt to buy the division.
Thirteen firms in our sample are bought in their entirety by other firms. In many
respects, a merger is analogous to an asset sale of 100% of the company. However, there
are some differences. First, the incentives of managers to merge may be very different
from their incentives to sell off a significant fraction of their assets. Major asset sales
may be designed so that management can keep their jobs. In contrast, they may lose
their jobs in a merger. Second, an asset sale permits equity holders to maintain some of
their option value, but the option disappears with a merger.
Third, in a merger the acquirer often assumes the debt of the target, reducing the
default risk of the debt dramatically. A potential acquirer would like to avoid making
this transfer to the debenture holders. However, public debtholders have a very strong
incentive to hold out in any exchange which offers less than full value; if they hold out
and the acquisition goes through, their debt will be assumed. One way around this
problem is to require a large supermajority in the exchange, thereby making most deb-
tholders pivotal. This, of course, makes it less likely that the deal will go through.
Otherwise, it seems that this problem implies that mergers will be more likely if the
public debt is not dispersedly-held or if the merger takes place before the value of the
public debt falls much below its face value.
The last two columns of Table 4 compares a variety of variables for firms that
merge and firms that do not. There are very few significant differences.Note that al-
though asset sales are strongly associated with exchange offers, mergers are not. This is
consistent with the view that hold-out problems may be even more severe in mergers.
However, there is no evidence that firms that merge are performing better or are in less
severe financial distress than other firms.
The second column of numbers in Table 5 reports estimates from a probit on merg-
ers and the third column has estimates from a probit where the dependent variable
equals one if either the firms sells at least twenty percent of its assets or it merges. The
17

merger only regression demonstrates a significant and positive coefficient of the num-
ber of public debt issues outstanding. which we still do not have a good explanation
for. In addition, the firm leverage coefficient is negative and statistically significant.
More highly leveraged firms may find mergers less attractive because there is a greater
likelihood that there will be nothing left for equity holders. The combinedaseta-
les/merger regression ipoks very much like the asset-sales-only regression.
Our overall conclusion is that industry factors are significant in affecting the ability
of firms to do distressed asset sales. Mergers appear to be qualitatively somewhat dif-
ferent than asset sales. The lack of a relation between exchange offers and mergers and
the relative low leverage of merging firms is some evidence for the view that it is diffi-
cult to induce public creditors to forgive debt and that the incentive of equity holders to
maintain their option value acts as a deterrent to mergers.
8. Capital ExpendituresCapital expenditures are one of the few discretionary uses of cash for a financially
distressed firm. Thus, a significant cost of financial distress may be the firm's failure to
make necessary and valuable investments. The firm may not have sufficient cash after
making interest payments and it is likely to be very difficult to raise significant capital
from outsiders because of the debt overhang problem.'1 For example, it is popularly
believed that a large cost of financial distress to Southland was its inability to invest in
the upkeep and improvement of its Seven-Eleven stores and a large cost to Interco was
its inability to advertise and promote its Converse sneakers.15 In this section we explore
the impact that financial distress has on capital expenditures.
Table 6 provides information on capital expenditures. One striking fact is that capi-
tal expenditures do indeed_drop dramatically when afirm1Ththitself in ancial dis-
tress. Most of this impact does not appear until the year following the initial coverage
See Myers (1977). For a discussion on how bankruptcy rules, priority structure and exchange oilersinteract with the debt overhang problem. see Gertncr and Seharlstein (1991).Neither lirm is in our sample because they are both LBOs.
18
shortfall. The median decline in capital expenditures from the year before the initial
coverage shortfall to the yar 4fter is.66%. Only 17% percent of the firms increase capi-
tal expenditures over this two year period. Correcting for industry capital expenditure
growth rates, the effects are somewhat mitigated, but still very large.
Looking first at the ratio of capital expenditures to assets in Panel B, we see that the
median ratio goes from .072 in year -1 to .025 in year 1. However, when we adjust for
industry changes, the effect becomes considerably smaller; the median difference goes
from 0 to -0.013. In Panel A we see that the median growth rates also decline from year
-Ito I both with and without industry adjustment.
There are two interpretations of these capital expenditure reductions with very
different implications. The first one, already mentioned above, is that distressed firms
are constraind from investing efficiently.The second interpretation is that financially
distressed firms are largely in trouble because they are performing poorly, are in bad
industries, and are poorly managed. Therefore, it may be efficient to reduce capital
expenditures. The concurrent reduction in industry capital expenditures indicates that
the second interpretation has some merit.
To explore this issue in more detail, it is useful to see if we can explain the differ-
ences in industry-adjusted capital expenditures with performance, degree of distress,
and, capital structure variables. Table 7 contains OLS regression estimates for capital
expenditures in year 1. The results, unfortunately, are at best, inconclusive. The only
two significant variables are preceding year's industry-adjusted operating income and
industry-adjusted leverage. A positive coefficient on operating income is consistent
with both interpretations, since better performance probably implies better investment
opportunities. but it also indicates more cash flow to use for investment. We should
lean toward the efficiency interpretation if industry-adjusted Tobin's q is statistically
significant, but it is not. We should lean toward the constrained-investment interpreta-
tion if cash stock or cash flow shortage are statistically significant, but they are not." It
Note we subtract previous periods capital expenditures in measuring the cash flow shortage to
'9

is unclear why industry-adjusted leverage is positive. Regressions on year-O capital
expenditures are even less illuminating, so we do not report them.
9. BankruptcyIn our sample of 102 financially distressed firms, 42 file for bankruptcy, all under
Chapter 11 of he US 'B.nlruptcy Code. The ostensible goal of Chapter 11 is to give
finns the time and breathing room to develop a consensual restructuring with creditors
while maintaining firm value. In Chapter 11, firms are able to continue operating with
current management, all debt payments are stayed, secured creditors cannot take pos-
session of collateral, executory contracts can be rejected or assumed, and new borrow-
ing usually has priority over all pre-bankruptcy claims. The debtor has the exclusive
right to propose a reorganization plan for the first 120 days of the bankruptcy. The
judge has the power, regularly used, to extend the exdusivity period. All operations of
the firm are overseen by the court, and creditors are able to object to major business
decisions. Creditors can try to force a resolution of a bankruptcy by seeking an end to
exclusivity in order to propose their own plan and secured creditors' can attempt to lift
the automatic stay in order to take possession of their collateral. The bankruptcy contin-
ues until a reorganization plan is approved or the company is liquidated.
Chapter 11 is usually considered to be costly and inefficient because of administra-
tive costs (legal, consulting, accounting), the potential loss of valued customers and
employees, the distraction of management, and the court's influence on operating deci-
sions. Warner (1977), Altman (1984), and Weiss (1990) document the direct administra-
tive costs of Chapter 11 bankruptcies. They estimate that direct costs are significant but
not sufficiently large to make direct bankruptcy costs a key determinant in capital
structure decisions. For example, Weiss (1990) finds that direct costs average 3.1% of
the book value of debt plus the market value of equity at the end of the year prior to
bankruptcy.'7 The other studies find slightly larger costs. Nonetheless, except in rare
avoid spurious correlation, given that last year's capital expenditures were a choice of the firm.

circumstances, a prolonged Chapter 11 bankruptcy must be less efficient than the same
restructuring outside of bankruptcy since the same restructuring could theoretically be
achieved without many of the costs associated with bankruptcy.18 Of course, bank-
ruptcy law will determine the threat points in the restructuring negotiations, and there-
by determine the form of restructuring.
lithe debtor and creditors are symmetrically informed and there are no transac-
tion costs that ifnpede restructuring negotiations, the Coase theorem implies that re-
stz-ucturings should be efficient and financial distress costless -- the parties will agree to
a capital structure and operating policy that maximize firm value.1' But the incidence of
bankruptcy seems to be inconsistent with this view: fully 42% of the firms in our sam-
ple file for Chapter 11. This compares to the 34% of the sample that restructure out of
court. Thus, 55% of the firms that restructure in some way, do so in bankruptcy.2° It is
hard to reconcile the high rate of bankruptcy with costless distress unless bankruptcy
costs are insignificant. A more plausible explanation is that there are inefficiencies in
the restructuring process.
As we have noted in the previous sections, it does appear that companies try to
avoid bankruptcy by restructuring in other ways. Table 8 compares the means and me-
dians of financial ratios and restructuring events for Chapter 11 and non-Chapter 11
firms. The table shows that firms that eventually file for Chapter 11 are significantly
less likely to sell assets. As already indicated, of the 21 companies that sell more than
This is based on a sample of large firms. Since there are probably significant economies of scale indirect bankruptcy costs, this percentage would be higher for smaller companies. Studies on smallercompanies are consistent with this.There may be some tax advantages to a bankruptcy restructuring compared to the same out-of-courtrestructuring. Pre-packaged bankruptcies, which are growing in popularity may not be more costlythan an out-of-court restructuring. In a pre-packaged or '1126-b' bankruptcy, a firm files for bank-ruptcy with a reorganization plan already agreed upon to by creditors. The main benefit of a pre-packaged plan relative to an out-of-court restructuring is that it can compel all the creditors in a classto accept the will of a 2/3 majority of the class. In contrast, the Trust indenture Act requires unanimi-ty to restructure interest or principal payments on public debt. Crystal Oil is the only pre-packagedbankruptcy in our sample.Haugen and Senbet (1978) make this argument.This number is much larger than bargaining breakdowns in other settings such as union labor negoti-ations or pre-trial litigation negotiation.c.
21

20% bI their assets only 3 go bankrupt. And, Chapter 11 firms are much less likely to
have completed an exchange.
Bank debt restructurings seem to have much less impact on Chapter 11. There is no
relation between bankruptcy filings and line of credit reduction, collateral increases, or
new money infusions. By contrast, banks extend debt and interest payments with
greater frequency for firms that eventually go bankrupt. There need be no causal link
between the two; maturity extensions may only signal that the company is in serious
distress and are more likely to require a restructuring. Overall, this evidence on bank
debt restructurings and bankruptcy confirms our findings discussed in Section 5 on the
limited role of bank debt restructunngs.
The central issue here is why these other forms of restructuring are not more
successful at keeping companies out of bankruptcy court. The answer must lie in un-
derstanding the bargaining breakdowns that lead to Chapter 11. For example, Jensen
(1989) argues that highly-leveraged companies that are in financial distressshould have
an easier time restructuring out of court. Because of their high leverage they get into
trouble before much value is dissipated. Thus, creditors realize that there is a lot to lose
by not restructuring efficiently and have strong incentives to do so.
By contrast, much of the theoretical work on bankruptcy focuses on bargaining
failures stemming for the existence of public debt and large numbers of creditors. Bu-
low and Shoven (1978) and White (1980) derive inefficiencies by assuming that it is
impossible to negotiate with public creditors. Gertrter and Scharfstein (1991)extend this
work by showing that similar inefficiencies persist even when firms are capable of re-
structuring public debt with exchange offers. Gertrter (1990) shows how increasing the
number of parties can increase bargaining inefficiencies under asymmetric information.
Tables 8 and 9 display comparisons of sample means and probits designed to ad-
dress this issue. The specifications of the regression equations include both financial
and operating performance variables. We use capital structure variables at t = -1, the
year before the first cash flow shortfall, since we wish to look at financial structure

prior to any distress-related restructuring. Our performance measure -- the deviation of
operating income before depreciation. interest, and taxes (EBITDA) from industry me-
dian EBITDA is taken in year 0. In addition to industry-adjusted performance, we wish
to get a measure of the severity of financial distress. We use the cash flow shortfall
(interest expense minus EBITDA) normaiized by interest expense at year 0.
We run two types of probits. The first includes all firms in the sample. The second
adds industry-adjusted performance and cash flow shortage in year 1. Since a number
of firms file for Chapter 11 in year 1 and performance may be affected by a filing, we
drop these firms from our second specification.
The results reported in Tables 8 and 9 shed some doubt on the view that better per-
forming, higher leverage companies should be more likely to achieve an out-of-court
restructuring. There is no strong evidence that operating performance has a significant
impact on the likelihood of bankruptcy. The coefficient of industry-adjusted operating
income is not statistically significant (nor is the difference in means in Table 8). This is
also true in the probit that includes performance the year following distress. The point
estimates also suggest little economic significance, so the problem is more than one of
insufficient sample size and variation. The impact of a one standard deviation in-
crease in the year-0 industry-adjusted operating income decreases the probability of
bankruptcy less than 1% in the first specification and less than 7% in the second specifi-
cation.21
Moreover, the coefficient of percentage cash shortfall is statistically insignificant
and the incorrect sign in year 0.22 In year I, the coefficient is statistically significant at
the 10% level. A one standard deviation increase in year-I cash shortfall increases the
probability of subsequent bankruptcy by 0.23. This provides some weak evidence that
21 The size of these effects depend upon what values of the variables we start from. All calculations arcdone based on sample means.Since the sample selection criterion is based on cash shortfall in year zero, it is possible that some biasmay creep in here.
23

continued cash shortages over a period of two years increases the likelihood of bank-
ruptcy.
In addition, the coefficient of industry-adjusted leverage is also statistically insig-
nificant in both specifications. This indicates, once again, the failure to find evidence
that better, more highly-leveraged distressed firms are more likely to resolve financial
distress without bankruptcy and have lower distress costs.
Our next set of results relates to how debt structure affects the probability of bank-
ruptcy. First, we find, somewhat surprisingly, that the coefficient of the fraction of debt
that is public is statistically insignificant. As discussed above, much of the theoretical
work on bankruptcy suggests that public debt is a major impediment to efficient re-
structuring. Additionally, Gilson, John, and Lang (1990) provide empirical evidence
that the presence of public debt increases the likelihood of bankruptcy relative to an
out-of-court restructuring. The best way to explain the discrepancy in the results is that
the Gilson, John, and Lang sample includes companies with no public debt. It makes
sense that the mere presence of any significant public debt complicates the negotiation
process considerably, while variations in the fraction of public debt conditional on its
presence has little effect. This interpretation both reconciles our study with Gilson, John
and Lang's and indicates that one reason why the incidence of bankruptcy is so high in
our sample is because of the presence of public debt for all our companies.
By contrast, the number of public debt issues outstanding has a positive and statis-
tically significant coefficient; a one standard deviation increase in the number of debt
issues outstanding increases the probability of bankruptcy by 0.12 and 0.16 in the two
probits, respectively. This variable measures the complexity of the public debt. If there
are more issues outstanding the coordination needed for a restructuring is greater and
the incentives for debtholders to free-ride on forgiveness of other creditors may in-
crease. Therefore we interpret this result as being consistent with a bargaining ineffi-
ciency view of bankruptcy and financial distress. We have collected two other measures
of debt structure complexity: the number of priority tiers in the public debt and a Her-
24

findahi index to correct the number of public issues for variations in size. All three vari-
ables are very highly correlated and the results are not much different depending upon
which one we use.
Our final result, and perhaps the most interesting, relates to the coefficient of the
fraction of private debt (bank and non-bank) that is secured. We find a statistically sig-
nificant positive relation between this variable and bankruptcy. A one standard devi-
ation increase in this variable increase the likelihood of bankruptcy by 0.12 and 0.09 in
two regressions, respectively. A shift from none of the debt secured to all of it secured
increases the estimated probability of bankruptcy by 0.34 and 0.25, respectively.
One explanation of this result is that secured creditors do well in bankruptcy; they
are likely to be paid in full, or nearly in full.23 Thus, secured creditors have strong in-
centives to pull the plug and trigger bankruptcy when they fear that their collateral is
threatened or when they fear that cash is going to be distributed to less senior creditors.
This explanation, however, is seemingly at odds with the earlier result that secured
banks are more likely to extend maturity on a loan. In one case, they appear to be more
prone to tighten the screws, in another, to loosen the screws. The difference, in our
view, may be one of timing. Secured banks may be lax early on to the extent that their
loans are more than fully collateralized. Extension of maturity costs the bank nothing
in the long run, so long as its cushion remains deep enough to be paid in full. But,
when the value of its security falls near the level of the loan, they have stronger incen-
tives and greater ability than an unsecured creditor to pull the plug as quickly as possi-
ble. By contrast, an unsecured private creditor may be willing, at this point, to
restructure in exchange for an increase in collateral.
We conclude by noting that it is possible that there is an exogenous factor which
determines both bankruptcy and capital structure choices. Although it is hard to tell a
plausible story of this form for debt complexity, it may be possible to tell one for secun-
a This statement was more true prior to the Supreme Court decision in United Savings Assciat,on ofTexas v. Timbers Jnwcod Forest Assscxiates, Ltd. 484 U.S. 365 (1988). The decision reduced the ability
of undersecured creditors to receive interest payments during bankruptcy proceedings.
25

ty. Although we do not have a satisfactory explanation for variation in the presence of
secured debt, it is possible that firms with more liquid assets have more secured debt
because it is easier to foreclose and resell. It is also possible that creditors are more like-
ly to force a firm with a high liquidation value into bankruptcy since bankruptcy costs
may be lower. If this is the case, there may be no causal link between secured debt and
bankruptcy.
10. Conclusion
Our paper is part of a growing empirical literature on bankruptcy and financial
distress. We conclude by briefly reviewing this literature and discussing its relation to
our work Two other studies compare Chapter 11 reorganizations to out-of-court re-
structurings. Gilson, John, and Lang (1990), which we discussed above, shows that
firms with more public debt and creditors are less likely to restructure out of court.
Franks and Torous (1991) compare deviations in absolute priority in out-of-court re-
structurngs and bankruptcy reorganizations. These papers differ from ours in that
they restrict their focus to debt restructurings and Chapter us. In addition, they select
their samples based upon the outcomes of financial distress and reductions in market
values. By using coverage ratios, we feel that we are likely to avoid some of the selec-
tion biases potentially introduced by their procedures.
Flynn (1989) analyzes a large sample of Chapter 11 filings. He shows a positive,
but weak relation between the time spent in bankruptcy and the ratio of assets to liabi-
lities prior to filing among firms that successfully reorganize. This finding is consistent
with the idea that better performing firms do not necessarily have lower costs of finan-
cial distress. In contrast to our results, Hoshi, Kashyap, and Scharfstein (1990) demon-
strate that Japanese firms that have close tics to a bank appear to suffer less in financial
distress than firms that do not. One reason that Japanese banks may play such an im-
portant role in restructuring is that, until recently, there was no real public debt market
in Japan. Finally, Gilson (1989) and (1990) document the effects of financiJ dtrss on
26

managers and corporate governance, respectively, two reactions to distress that we do
not consider. He finds that banks often gain control of the company and maitagerial
turnover is high. But, given our results, this may be more to protect their own interests
at the expense of the company.
Taken together, these papers and ours help to piece together an anatomy of finan-
cial distress. We doubt whether anyone will ever be able to measure the costs of finan-
cial distress accurately. But this anatomy should be helpful in identifying what these
costs may be, identifying how firms can structure their debt to avoid them, and point-
ing to the practical difficulties firms face in dealing with financial distress.
27

Table 1
Sources of Coverage Shortfall for Sample of 102 Distressed Junk-Bond Issuers with EarningsCoverage Less than 1.0 for Two Consecutive Years or Less than 0.8 for One Year
Panel A: Sources of Coverage Shortfall in First Year of Financial Distress (t = 0)
Mean Median StandardError of Mean
Number ofObservations
INTEREST EXPENSE / ASSETS
Sample Firms 0.075 0.068 0.004 101
Industry Median 0.039 0.036 0.002 102
Deviation from Industry Median 0.036 0.028 0.004 101
EBITDA / ASSETS
Sample Firms -0.031 0.004 0.014 101
Industry Median 0.097 0.109 0.007 102
Deviation from Industry Median -0.127 -0.102 0.016 99
INDUSTRY MtDIAN ChANGE IN EIIITDA I ASSETS
FROM T-ITOTO -0.030 -0.018 0.005 100
Panel B: Normalized Sources of Coverage Shortfall in First Year of Financial Distress It = 0)
FactorMean % Median % Standard
Deviation %Number ofFirms with
Prlmaiy Cause
Leverage 0.239 0.198 0.312 9
Industry Operating Performance 0.157 0.083 0.371 15
Firm Operating Performance 0.603 0.704 — 0.398 66

Table 2
Structure of Debt Obligations for Sample of 102 Distressed Junk Bond-Issuers with EarningsCoverage Less than 1.0 for Two Consecutive Years or Less than 0.8 for One Year
All debt summary statistics are for year -I. the fiscal year-end prior to a companys first coverage shortfall.
MeanStandardDeviation
Number ofCompanies
PUBLIC DEBT/TOTAL DEBT 0.5 15 0.262 100
SECURED PUBLIC DEBT/ PUBLIC DEBT 0.105 0.267 95
NUMBER OF PUBLIC ISSUES 2.45 2.27 100
TIERS 1.46 0.881 100
PRIVATE DEBT / TOTAL DEBT 0.485 0.262 100
NON-BANK PRIVATE DEBT / PRIVATE DEBT 0.399 0.32 100
SECURED NoN-BAr DEnT/Now-BASic PluvAit DEBT 0.406 0.218 99
BANK DEBT / PRIVATE DEBT 0.60 1 0.32 100
SEcUP.EDBANXDEBT/BANKDEBT 0.562 0.768 90
MAIN FACILITY / PRIVATE DEBT 0.438 0.35 99
2)
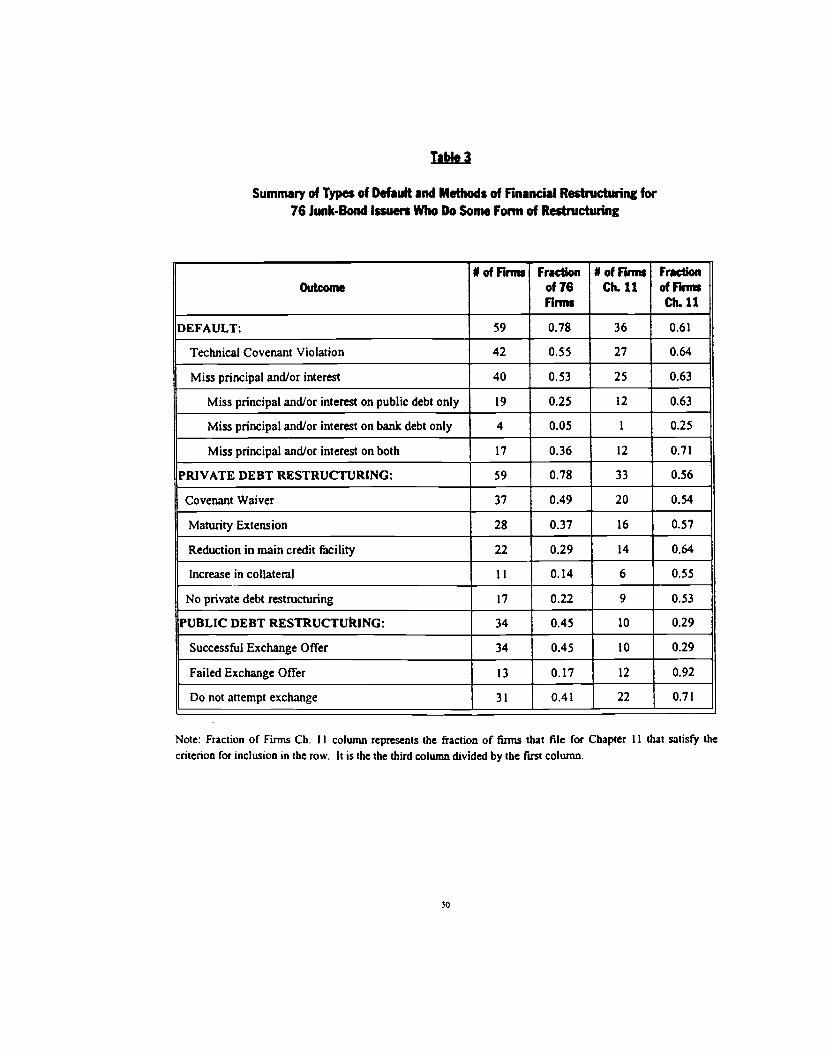
Table 3
Summa,y of Types of Default and Methods of Financial Restructuring for76 Junk-Bond Issuers Who Do Some Fomi of Restructuring
Outcome* of Firms Fraction
of 76Firms
I of FirmsCh. 11
Fractionof FinnsCh.11
DEFAULT: 59 0.78 36 0.61
Technical Covenant Violation 42 0.55 27 0.64
Miss principal andior interest 40 0.53 25 0.63
Miss principal and/or interest on public debt only 19 0.25 12 0.63
Miss principal and/or interest on bank debt only 4 0.05 I 0.25
Miss principal and/or interest on both 17 0.36 12 0.71
PRIVATE DEBT RESTRUCTURING: 59 0.78 33 0.56
Covenant Waiver 37 0.49 20 0.54
Maturity Extension 28 0.37 16 0.57
Reduction in main credit facility 22 0.29 14 0.64
Increase in collateral 11 0.14 6 0.55
No private debt restructuring 17 0.22 9 0.53
PUBLIC DEBT RESTRUCTUtUNG: 34 0.45 10 0.29
Successful Exchange Offer 34 0.45 10 0.29
FailedExchangeOffer 13 0.17 12 0.92
Do not attempt exchange 31 0.41 22 0.71
Note: Fraction of Firms Ch. II column represents the fraction of firms that file for Chapter II that salisfy thecriterion for inclusion in the row. It is the the third column divided by the first column.
30

Table 4
Determinants of Asset Sales arid Mergers — Comparison of Mean Financial Ratios andRestructuring Event Incidence in a Sample of 102 Junk-Bond Issuers with Interest Coverage
Less than 1.0 for Two Consecutive Years or Less than 0.8 for One Year
Variable
Asset Sales>20%Mean
(Si.)
N=21
Asset Sales<20%Mean
(Si.)
N=81
Merger
Mean(Si.)
N=13
No Merger
Mean
(S.E.)
N=89(EBITDA / Assets) - Industry Median (EBITDA I
Assets) at t 0-0.165(0.043)
-0.118(0.017)
-0.179(0.065)
-0.120
(0.016)
Debt / Assets at t = -1 0.519(0.050)
0.51(0.018)
0.449*(0.035)
0.520*(0.019)
(Interest Expense - EBITDA) / interest Expenseat t 0
1.279(0.320)
1.319
(0.137)1.520
(0.484)1.270
(0.126)Cash Balances / Interest Expense at t =0 1.846
(0.684)1.115
(0.164)0.691**(0.184)
1.347**
(0.209)
Fraction of bank and private debt securedatt=-I
0.531(0.082)
0.558(0.043)
0.497(0.110)
0.563(0.040)
Fraction of debt that is publicly held at t = -I 0.524(0.050)
0.523(0.030)
0.546
- (0.066)0.511
(0.029)
Number of public debt issues at t = -1 2.810(0.486)
2.390(0.260)
3.154(0.697)
2.345(0.239)
Industry Median (Debt I Assets) at t =0 0.262(0.039)
O.373***(0.017)
0.301(0.044)
0.354(0.017)
Industry Median(1 / Tobin'sq)attO 0.723(0.125)
0.949(0.068)
0.957 0.889(0.109) (0.066)
Chapter Il Dummy 0,l43***(0.078)
Ø494***(0.057)
0.000(0.000)
0.472(0.053) —
Successful Exchange Offer Dummy 0.619'(0.109)
0.278***(0.051)
0.385(0.140)
0.337(0.050)
Bank Maturity Extension Dummy 0.238(0.095)
0.304(0.052)
0.077**(0.077)
0.315**(0.050)
Bank Collateral Increase Dummy 0.095(0.066)
0.114(0.036)
0 077(0.077)
0.112(0.034)
New Money From Any Source Dummy .381(0.109)
0.354 0.538(0.054) (0.144)
0.3370.050)
Note: • denotes significance at lO% level, • at 5% level, and • at 1% level.
ii

Table 5
Detenninants of Asset Sales and Mergers - Probit Regressions in a Sample of102 Junk-Bond Issuers with Interest Coverage Less than 1.0 for
Two Consecutive Years or Less than 0.8 for One Year
Dependent variable is a dummy equal to I if firm sells more than 20% of its assets. Model I dependent variable isa I if the flim sells more than 20% of its assets and does not merge. Model 2 dependent variable is a 1 if the firmmerges. Model 3 dependent variable is a I if either the firm sells more than 20% of its assets or it merges. Thefraction of asset sales is the market value of assets sold divided by book value of assets at t0. t-statistics are inarentheses. ____________
VariableModel 1:
Aunt SalesOnly
Coefficient(t-statistlc)
Model2Meier
Only
Coefficient(t-statistlc)
Model 3:Asset Sales
orMerger
Coefficient(t-statlstlc)
Mean(SW. Dcv.)
Fraction of bank and private debt secured at t= -1 -0.137(.0.285)
-0.043(.0.080)
-0.177(-0.424)
0.54(0.37)
# of public debt issues outstanding at t = -1 0.140
(1.698)
0.18
(1.951)
0.131
(1.766)2.50
(2.29)
Fraction of debt that is public at t = -I .0.7 13
(-1.018)-0.504
(-0.659)
-0.502(-0.624)
0.52(0.26)
Debt/Assets at t -1 0.010(-0.009)
-3.907(-2.182)
-1.006(-1.011)
0.51
(0.17)
(EBITDA/Assets) - Industry Median(EBI1DA/Assets) at t = 0
-1.263(-0.844)
-1.343(-0.793)
-0.161(-0.123)
-0.13(0.16)
(Interest Expense. EBITDA)I Interest Expenseat t = 0
-0.088(-0.448)
-0.14(-0.681)
-0.004(-0.025)
1.31
(1.28)
Cash Balances / Interest Expense at t = 0 0.0179(0.164)
-0.499(-1.537)
-0.095(-0.852)
1.171
(1.515)
Industry Median (Debt / Assets) -2.199(-1.997)
-0.605(-0.416)
-2.081
(-2.079)0.35
(0.16)
Industry Median(1 /Tobins q) -0.679(-2.181)
-0.249(-0.714)
-0.551
(-2.032)0.91
(0.61)
Constant 0.397(0.472)
1.321
(1.236)
1.212
(1.483)
Dependent Variable: Asset Sales DummyAsset Sales Only
Mergers OnlyAsset Sales or Merger
Number of ObservationsCh12
9413.31
9612.25
94
- 11.71
0.190.110.28
32
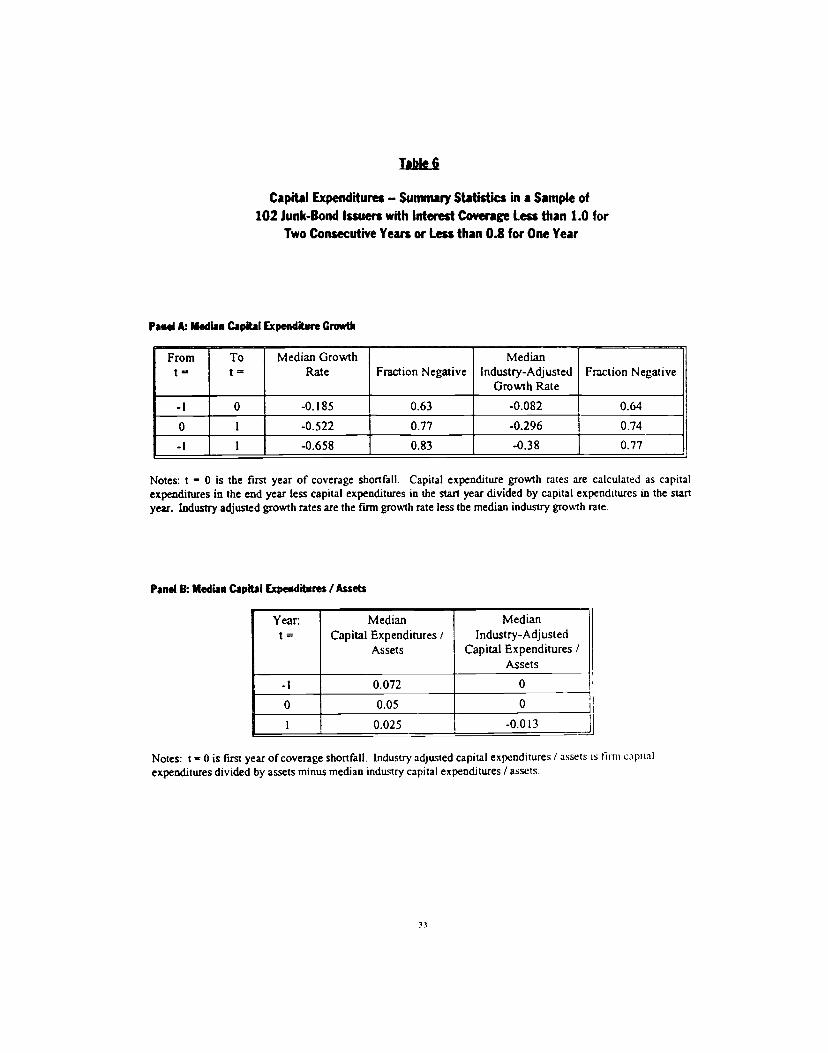
Table 6
Capital Expenditures - Summary Statistics in a Sample of102 Junk-Bond Issuers with Interest Coverage Less than 1.0 for
Two Consecutive Years or Less than 0.8 for One Year
Panelk Media. Capital Expenditure Grent
From=
To=
Median GrowthRate Fraction Negative
MedianIndustry-Adjusted
Growth RateFraction Negative
-1 0 -0.185 0.63 -0.082 0.64
0 1 -0.522 0.77 -0.296 0.74
-I 1 -0.658 0.83 -0.38 0.77
Notes: t 0 is the first year of coverage shortfall. Capital expenditure growth rates are calculated as capitalexpenditures in the end year less capital expenditures in the stall year divided by capital expenditures in the startyear. Industry adjusted growth rates are the firm growth rate less the median industry growth rate.
Panel B: Median Capital Expenditures / Assets
Year=
MedianCapital Expenditures /
Assets
MedianIndustry-Adjusted
Capital Expenditures /Assets
-1 0.072 0 —0 0.05 0
I 0.025 -0.0 13
Notes: t 0 is first year of coverage shortfall. Industry adjusted capital expenditures / assets is turn capital
expenditures divided by assets minus median industry capital expenditures / assets.
1

Table?
Capital Expenditures - Regression In a Sample of102 Junk-Bond Issuers with InterestCoverage Less than 1.0 for
Two Consecutive Years or Less than 0.8 for One Year
Dependent variable is capital expenditures divided by assets minus median industry capital expenditures divided byassets in year t — I, the first year afier coverage shortfall. t-stalistics are in parentheses.
Variable Coefficient(t-statlstk)
Mean(SW. Dev.3
Capital Expenditures I Assets - Median Industry CapitalExpenditures / Assets at t = 0
0.180(1.723)
0.071(0.068)
Fraction of bank and private debt secured at t -1 0.0 10
(0.804)0.53
(0.369)
# of public debt issues outstanding at t = -l -0.001
(-0,191)2.425
(2.147)
Fraction of debt that is public at t = -l 0.008
(0.444)
0.5 14
(0.274)
Debt/Assets - Industry Median (Debt/Assets) at t = -1 0.065
(2.674)
0.192(0.207)
(EBITDAJAssets) - Industry Median (EBITDAJAs5ets)at t 0
0.111
(1.925)-0.097(0.104)
(Interest Expense - EBITDA - Capital Expenditures) /Interest Expense at t = 0
0.003
(0.709)-0.120(1.641)
Cash Balances / Interest Expense at t = 0 0.004(1.485)
1.286
(1.602)
(1 / Tobin's q) - Industry Median (1 / Tobin's q) at t = 0 0.00 1
(0.410)
-0.176(2.314)
Constant -0.042(-2.901)
Dependent Variable:(Capital Expenditures / Assets) - Industry Median(Capital Expenditures / Assets) at t = 0
Number of ObservationsR2
730.215
-0.137(0.040)
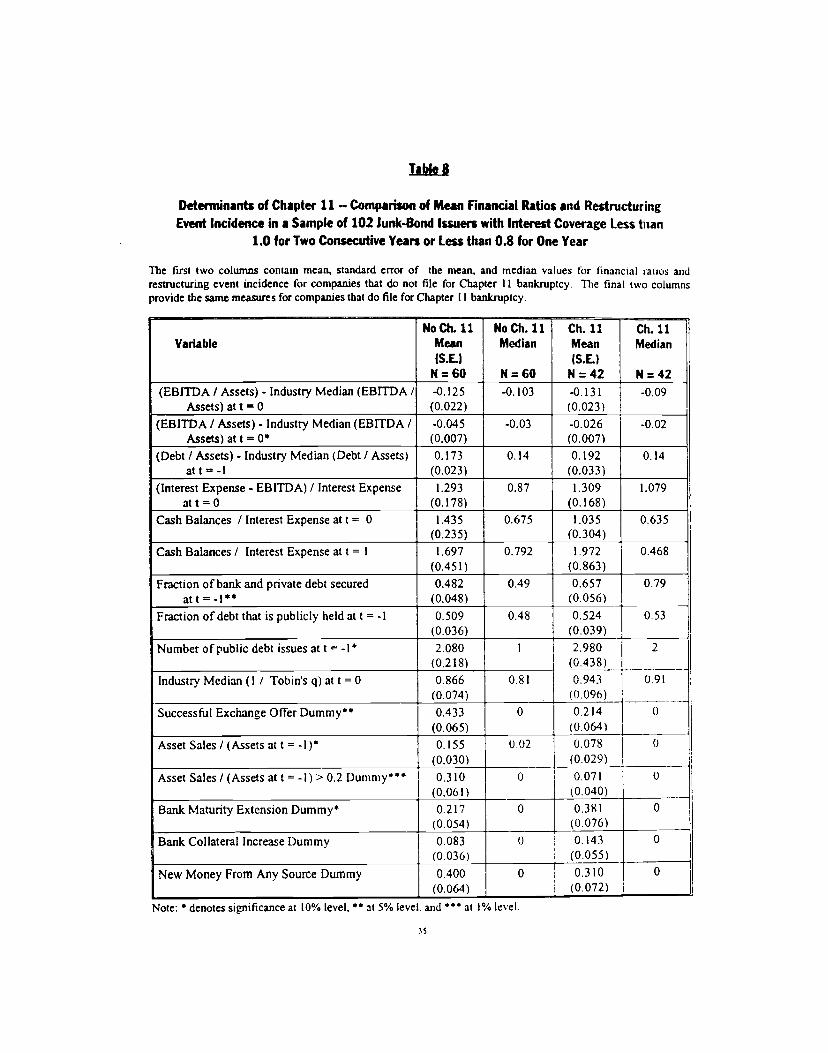
Table 8
Determinants of Chapter 11 — Compatison of Mean Financial Ratios and RestructuringEvent Incidence in a Sample of 102 Junk-Bond Issuers with Interest Coverage Less than
1.0 for Two Consecutive Years or Less than 0.8 for One Year
The first two columns contain mean, standard error of the mean, and median values for financial ratios andrestructuring event incidence for companies that do not file for Chapter II bankruptcy. The final two columnsprovide the same measures for companies that do file for Chapter I 1 bankruptcy.
VariableNo Ch. 11
Mean(S.E.)
N=60
No Ch. 11Median
P4=60
Ch. 11Mean(S.E.)
P4=42
Ch. 11Median
P4=42
(EBITDA / Assets) - Industry Median (EBITDA /Assets) at t = 0
-0.125(0.022)
-0.103 -0.131(0.023)
-0.09
(EBITDA / Assets) - lndustty Median (EBITDA IAssets) at t = 0
-0.045
(0.007)-0.03 -0.026
(0.0071-0.02
(Debt / Assets) - Industry Median (Debt / Assets)at t = -l
0.173(0.023)
0.14 0.192(0.033)
0.14
(Interest Expense - EBITDA) / Interest Expenseatt=0
1.293
(0.178)0.87 1.309
(0.168)1.079
Cash Balances / Interest Expense at t = 0 1.435
(0.235)0.675 1.035
(0.304)0.635
Cash Balances / Interest Expense at t = I 1.697
(0.451)0.792 1.972
(0.863)0.468
Fraction of bank and private debt securedat t = 1**
0.482(0.048)
0.49 0.657(0.056)
0.79
Fraction of debt that is publicly held at t = -1 0.509(0.036)
0.48 0.524(0.039)
0.53
Number of public debt issues at t = * 2.080(0.218)
1 2.980(0.438)
2
Industry Median(l / Tobinsq)att=O 0.866(0.074)
0.81 0.943(0.096)
091
Successful Exchange OtTer Dummy** 0.433(0.065)
0 0.2 14
(0.064)0
Asset Sales / (Assets at t = -l) 0.155(0.030)
0.02 0.078(0.029)
0
-________Asset Sales / (Assets at t = -I)> 0.2 Dumnly*** 0.3 10
(0.0611
0 0.071(0.040)
0
Bank Maturity Extension Dummy* 0.2 17
(0.054)0 0.381
(0.076)0
Bank Collateral Increase Dummy 0.083(0.036)
0 0.143(0.055)
0
New Money From Any Source Dummy 0.400(0.064)
0 0.3 10
(0.072)0
Note: * denotes significance at 10% level. at 5% level, and ' at 1% level.
35

Table 9
Determinants of Chapter 11- Probit Regressions in a Sample of102 Junk-Bond Issuers with Interest Coverage Less than 1.0 for
Two ConsecutIve Years or Less than 0.8 for One Year
Dependent variable is a dummy variable equal to I if firm files Chapter 11. Model 1 contains all firms in thesample for which we have the necessary data. The column to its right contains mean and standaid deviation of thevariable. Model 2 contains all firms except those firms that file for Chapter II within one year of initial coverageshortfall. t-statistics are in parentheses
VariableModell:
All FinnsMean
(SW. Dev.)
ModeIZ.Exclude
EartyCh. 11
Mean
(SW. 0ev.)
Fraction of bank and private debt secured at t -l 0.741
(1.972)0.55
(0.37)0568
(1.090)0.53
(0.37)
ofpublic debt issues outstanding at t = -l 0.138
(1.894)
2.47
(2.28)0.291
(2.312)2.51
(2.36)
Fraction of debt that is public at t = -l -0.119(-0.210)
0.51
(0.26)0.259
(0.326)
0.51
(0.27)
DebtiAssets - Industry Median (Debt/Assets) at t = -1 0.050(0.062)
0.18(0.19)
-1.800(-1.374)
0.17
(0.19)
(EBITDA/Assets) - Industry Median (EBITDAIAssets)at t = 0
0.528(0.424)
-0.13(0.16)
-2.968(-0.809)
-0.10(0.08)
(EBITDA/Assets) - lndustty Median (EBITDAIAssets)at t = I
0.363
(0.072)-0.08(0.08)
(Interest Expense - EBITDA) / Interest Expenseat t 0
0.059(0.164)
1.29
(1.27)-0.374
(-1.307)1.12
(1.03)
(Interest Expense - EBITDA) / Interest Expenseatt= I
0.645(1.477)
0.74
(1.21)
Cash Balances / Interest Expense at t 0 -0.295(-2.107)
1.179
(1.503)
-0.205
(-0.523)
Cash Balances / Interest Expense at t = I -1.110(1.907)
Constant -0.609(-1.429)
-0.869(-1.199)
Dependent Variable — Chapter 11 Dummy
Numberof ObservationsChi2
9615.68
0.42
7332.46
0.34

ACKNOWLEDGEMENTS
We would like to thank Doug Baird, Walter Bluxn, Paul Healy, SteveKaplan, Randy Picker, Julio Roternberg, Andrei Shleifer, JeremyStein, Rob Vishriy and participants at the NBER Summer Institutefor helpful comments. Gregor Andradie and Mathew Zames helpedcollect the data. Kevin Corgan provided exceptional researchassistance. All three of us acknowledge research support fromthe Garn Institute of Finance. Asquith and Scharfsteiriacknowledge research support from IFSRC at M.I.T. Gertneracknowledges research support from NSF Grant SES-89l1334, theCenter for the Study of the Economy and the State, and theGraduate School of Business, The University of Chicago.Scharfstein acknowledges research support from NSF GrantSES—9111069. Much of the research was done while Gertner was anJohn Olin Fellow at the University of Chicago Law School andwhile Scharfstein was a Batterymarch Fellow.

REFERENCES
Altman, E., "A Further Investigation of the Bankruptcy Cost Question," Journal ofFinance, 39, 1984, 1067-1089.
Asquith, P., D. Mullins, and E. Wolff, "Original Issue High Yield Bonds: AgingAnalyses of Defailt Ehiñges, and Calls," Journal of Finance, 44, 1989, 923-952.
Bulow, J. and J. Shoven, 'The Bankruptcy Decision," Bell Journal of Economics, 9, 1978,436-445.
Coffee, J. and W. Klein, "Bondholder Coercion: The Problem of Constrained Choice inDebt Tender Offers and Recapitalizations," Working Paper #53, Center for Lawand Economic Studies, Columbia University, 1991.
Flynn, E. "Statistical Analysis of Chapter 11," working paper, Statistical Analysis andReports Division, Administrative Office of the United States Court, BankruptcyDivision, 1989.
Franks, J. and W. Torous, "How Firms Fare in Workouts and Chapter 11Reorganizations," working paper, University of California, Los Angeles, 1990.
Gertner, R. and D. Scharfstein, "A Theory of Workouts and the Effects ofReorganization Law," Journal of Finance, 46, 1991, 1189-1221.
Gertner, R., "Inefficiency in Three-Person Bargaining," manuscript, University ofChicago, 1990.
Gilson, S., Management Turnover and Financial Distress," Journal of Financial Economics,25, 1989, 241-262.
Gilson, S. "Bankruptcy, Boards, Banks, and Blockholders: Evidence on Changes inCorporate Ownership and Control when Firms Default," Journal of FinancialEconomics, 27, 1990, 355-387.
Gilson, S., K. John, and L. Lang, "Troubled Debt Restructurings: An Empirical Study ofPrivate Reorganization of Firms in Default," Journal of Financial Economics, 27,1990, 315-353.
37
Haugen, R. and L. Senbet, "The Insignificance of Bankruptcy Costs to the Theory oOptimal Capital Structure, Journal of Finance, 33, 1978, 383-393.
Hoshi. T., A. Kashyap, and D. Scharfstein, The Role of Banks in Reducing the Costs ofFinancial Distress in Japan," Journal of Financial Eco,iomics, 27, 1990, 67-88.
Jensen, M., "Active Investors, LBOs and the Privatization of Bankruptcy," Journal ofApplied Corporate Finance, 2, 1989, 35-44.
Kaplan, S. and J. Stein, "The Evolution of Buyout Pricing and Financial Structure in the
1980s," working paper, University of Chicago, 1991.
Myers, S., "Determinants of Corporate Borrowing," Journal of Financial Economics, 5,1977, 147-176.
Roe, M., "The Voting Prohibition in Bond Workouts," Yale Law Journal, 97, 1987, 232-279.
Shleifer, A. and K Vishny, "Asset Sales and Debt Capacity," manuscript, University ofChicago, 1991.
Warner, J., "Bankruptcy Costs: Some Evidence," Journal of Finance, 32, 1977, 337-347.
Weiss, "Bankruptcy Resolution: Direct Costs and Violation of Priority of Claims,"Journal of Financial Economics, 27, 1990, 285-314.
White, M., "Public Policy toward Bankruptcy: Me-First and Other Priority Rules," BellJournal of Economics, 11, 1980, 550-564.
3$