nbp.329 final report
TRANSCRIPT

final repport
This publication is published by Meat & Livestock Australia Limited ABN 39 081 678 364 (MLA). Care is taken to ensure the accuracy of the information contained in this publication. However MLA cannot accept responsibility for the accuracy or completeness of the information or opinions contained in the publication. You should make your own enquiries before making decisions concerning your interests. Reproduction in whole or in part of this publication is prohibited without prior written consent of MLA.
Project code: NBP.329
Prepared by: Dr David Phelps (Project Leader) Benjamin C Lynes Peter T Connelly Darrell J Horrocks Grant W Fraser Michael R Jeffery
Department of Primary Industries & Fisheries
Date published: April 2007
ISBN: 9781 741 912 241 PUBLISHED BY Meat & Livestock Australia Limited Locked Bag 991 NORTH SYDNEY NSW 2059
Sustainable Grazing in the Channel Country Floodplains (phase 2)
A technical report on findings between March 2003 and June 2006
Northern Beef Program
Sustainable Grazing in the Channel Country Floodplains (Phase 2)
Page 2 of 158
Abstract ‘Sustainable Grazing in the Channel Country Floodplains’ was initiated by industry to redress the lack of objective information for sustainable management in the floodplains of Cooper Creek and the Diamantina and Georgina Rivers. The project has maintained links with the grazing community and has extensively drawn upon expert local experience and knowledge. The project has provided tools for managers to better anticipate the size of beneficial flooding arising from rains in the upper catchment and to more objectively assess the value of the pasture resulting from flooding. The latest information from the project has enabled customisation of the EDGENetwork™ Grazing Land Management training package for the Channel Country. In combination, these tools will assist in making earlier cattle stocking decisions, including when cattle may need to be mustered out of floodplain paddocks, how many additional cattle will be required to take advantage of the flood–grown pasture, and the timing of cattle turnoff. These will reduce costs by providing a greater lead time to plan cattle movements and purchases, and may enhance the sustainability of the resource base by better matching cattle numbers with the feed on offer.

Sustainable Grazing in the Channel Country Floodplains (Phase 2)
Page 3 of 158
Executive Summary ‘Sustainable Grazing in the Channel Country Floodplains’ was initiated by industry to help improve sustainable grazing management of the floodplains of Cooper Creek and of the Diamantina and Georgina Rivers. The floodplains are the powerhouse of beef production in the Channel Country, with 0.5–1.0 million head of cattle grown–out in the area each year. Floodplain pasture production is dependent on floodwaters from the upper catchment to provide ‘natural irrigation’ of the fertile clay soils. The pastures are dominated by soft, annual grasses and broad–leaved plants, meaning that production from the floodplains is truly ‘boom and bust’. High levels of pasture growth follow floods. Nothing but bare ground remains during extended dry periods. These extremes of pasture abundance require flexible management to ensure the sustainability of the natural resources base and future cattle production. Research to measure and model rainfall, flooding, soil moisture and pasture growth was conducted over 7 years at 17 sites located across the major floodplain country types of the Cooper, Diamantina and Georgina. These on-property sites were located on 13 Channel Country properties, with direct and in-kind support from pastoral companies and private land holders. The data collected has been integrated into tables of likely pasture growth, based on flood type and country type. Representatives from Channel country properties were involved in defining the project, setting the goals, and selecting locations for study sites. A Steering Committee provided practical advice and over-saw project direction, and also made important contributions to interpretation of data and design of communication products. Channel Country managers recognise four main types of flood:
• Good (where 80% or more of the floodplain is inundated, providing for 85–100% of peak cattle numbers to be carried);
• Handy (where 50–60% of the floodplain is inundated, providing for 45–85% of peak cattle numbers to be carried);
• Gutter (where shallow channels, called gutters, spread the floodwater inundating 5-15% of the floodplain, providing for 5–25% of peak cattle numbers to be carried); and
• Channel (where floodwaters just break the banks of the channels, inundating less than 5% of the floodplain and providing for 5–15% of peak cattle numbers to be carried).
Pasture growth modelling provided estimates of pasture growth for combinations of flood type and country type. The three main country types, frequently-flooded plains, swamps and depressions, and open plains, relate to the frequency of flooding and position in relation to major watercourses. Swamps and depressions grow up to 8000 kg DM/ha following a Good flood, but only 1200-2500 kg DM/ha following a Channel flood. Open plains are most distant from the main river channels, flood the least often and have the least well-developed alluvial soils. At least a Handy flood is needed to reach the open plains, with pasture growth limited to 100–250 kg DM/ha. Growth on open plains following a Good flood ranges from 1500–3500 kg DM/ha. Pasture growth, botanical composition and forage quality vary depending on the season of flooding (winter or summer) and the weather conditions following a flood. For instance, hot and windy conditions can retard pasture growth by scorching seedlings and rapidly drying out the soil surface. Flood type and post–flood pasture growth conditions are therefore critical in determining the numbers of cattle that can be stocked initially, and how many can be carried to achieve desired liveweight gains.

Sustainable Grazing in the Channel Country Floodplains (Phase 2)
Page 4 of 158
A ‘flooding rules of thumb’ guide has been produced for the Cooper and Diamantina to allow managers to better anticipate whether a Good, Handy, Gutter or Channel flood will result from upper catchment rains, and the likely pasture growth that will result. A guide to forage value has also been produced which will assist in matching cattle numbers with available feed, and help achieve production goals while minimising risk of any deterioration of the natural resource base. Changes in pasture yield, ground cover and botanical composition within and outside of the 17 site exclosures were documented between 2002 and 2006. Over this four-year period, the over-riding influence has been moisture availability, with flood–induced pasture growth and cover declining throughout dry periods even in the absence of grazing. The only suggestion of grazing impact on vegetation was in areas of unusually high grazing pressure, such as within holding paddocks. However, such effects could not be confirmed within the four years of monitoring. These new guides to flooding and pasture management will be distributed to all Channel Country managers during 2007. These guides and other information from the project have been incorporated into a Channel Country version of the EDGENetwork™ Grazing Land Management training package. Training has been delivered since early 2007, with participants able to more objectively match cattle carrying capacity with the productive capacity of the land. These products will promote practices which help consolidate sustainable management of the Channel Country. Small gains in productivity in the Channel Country, with an estimated annual turnoff of $65 million, can lead to substantial financial gains for the region. For instance, a 5% increase in either cattle numbers or liveweight gains, would lead to an additional $3.3 million per annum, on average. The potential gains may indeed be higher, with single large floods reported to turn-off $150 million worth of beef. Other regions and researchers can benefit from the results of this project. For instance, the data used to derive the pasture growth tables can be used as the basis for testing the GRASP pasture production model in other annual pasture systems, especially those growing on clay soils.

Sustainable Grazing in the Channel Country Floodplains (Phase 2)
Page 5 of 158
Contents Page
Abstract........................................................................................ 2
Executive Summary .................................................................... 3
List of Tables ............................................................................... 8
List of Figures ............................................................................. 9
List of Plates.............................................................................. 11
1 Introduction ....................................................................... 12
2 Project Objectives............................................................. 14
3 Background to the Channel Country .............................. 14 3.1 Physical Attributes of the Channel Country..................................................................... 14 3.1.1 Geographic Information ...................................................................................... 14 3.2 Biophysical Description of the Channel Country ............................................................. 17 3.2.1 Geology and landforms ...................................................................................... 17 Floodplains...................................................................................................................... 17 Outside country ............................................................................................................... 17 3.2.2 Soils ................................................................................................................... 18 Formation of floodplain soils ........................................................................................... 18 Classification of floodplain soils ...................................................................................... 18 Floodplain soil fertility......................................................................................................19 Floodplain soil moisture .................................................................................................. 19 Outside country soils....................................................................................................... 20 3.2.3 Bioregions .......................................................................................................... 20
3.2.4 Land systems ..................................................................................................... 21
3.2.5 Rainfall ............................................................................................................... 24
3.2.6 Evaporation ........................................................................................................ 25
3.2.7 Flooding.............................................................................................................. 26 Irregular infrequent flooding ............................................................................................ 26 Floods in arid areas......................................................................................................... 26 3.2.8 Vegetation of the Channel Country..................................................................... 27 Floodplain pastures......................................................................................................... 27 Outside country ............................................................................................................... 27 3.2.9 Industry............................................................................................................... 28 Cattle production systems and property management.................................................... 29 3.3 History of Development................................................................................................... 30 3.3.1 Settlement .......................................................................................................... 30
3.3.2 Cropping and irrigation in the Channel Country.................................................. 30
4 An active partnership with the grazing community....... 31

Sustainable Grazing in the Channel Country Floodplains (Phase 2)
Page 6 of 158
4.1 Project consultation......................................................................................................... 31 4.1.1 The Project Steering Committee......................................................................... 32 4.2 Defining relevant flood categories................................................................................... 33 4.3 Flood rules of thumb – an example of combining local knowledge and science............. 34 4.4 Feed Budgeting Guides – an example of industry driven management guidelines ........ 36 4.4.1 Setting initial cattle numbers............................................................................... 36
4.4.2 Destocking Schedules ........................................................................................ 37 4.5 Timing of information delivery ......................................................................................... 38 4.6 Combining science and local knowledge through a continuous learning cycle............... 38
5 A review of flood processes in the Channel Country.... 41 5.1 Overview of flooding in the Channel Country.................................................................. 41 5.1.1 General processes in the Cooper ....................................................................... 41
5.1.2 General processes in the Diamantina................................................................. 41
5.1.3 General processes in the Georgina .................................................................... 42 5.2 The flooding process....................................................................................................... 42 Water source and colour ................................................................................................. 43 5.3 Floodplain features.......................................................................................................... 44 Lakes, claypans, swamps and waterholes...................................................................... 44 Floodwater distribution and watercourses....................................................................... 44 5.4 Anabranching channels and bankfull stage processes ................................................... 45 5.5 Gutters and flood stage processes ................................................................................. 47 5.6 Floodways and overbank stage processes ..................................................................... 48 5.7 Flood types...................................................................................................................... 50 5.7.1 Primary flood types............................................................................................. 50 5.8 Modifiers of flood type ..................................................................................................... 53 5.8.1 Transmission losses ........................................................................................... 53
5.8.2 Flood duration and number of peaks .................................................................. 53
5.8.3 Location.............................................................................................................. 55
5.8.4 Wave speed (rate of increase of the rising arm) ................................................. 55
5.8.5 Local watercourses............................................................................................. 56
5.8.6 Channel and waterhole pre-wetting .................................................................... 56
5.8.7 Secondary flood types ........................................................................................ 56
5.8.8 Summarising the modifiers of flood type............................................................. 57 5.9 Conclusion ...................................................................................................................... 58
6 Monitoring rainfall, stage height, spatial extent of flooding and soil moisture in the Channel Country ...... 60
6.1 Introduction ..................................................................................................................... 60 6.2 Methodology....................................................................................................................60 6.2.1 Rainfall probabilities and flooding frequency ...................................................... 60
6.2.2 MODIS remote sensing ...................................................................................... 60
6.2.3 ARIDFLO hydrology model................................................................................. 60

Sustainable Grazing in the Channel Country Floodplains (Phase 2)
Page 7 of 158
6.2.4 Flood - peak travel times .................................................................................... 61
6.2.5 Site specific flood depth and resultant soil moisture ........................................... 62 6.3 Results and Discussion................................................................................................... 62 6.3.1 Rainfall probabilities and flooding frequency ...................................................... 62
6.3.2 MODIS remote sensing ...................................................................................... 64
6.3.3 ARIDFLO hydrology model................................................................................. 68
6.3.4 Flood - peak travel times .................................................................................... 69
6.3.5 Site specific flood depth and resultant soil moisture ........................................... 69 6.4 Conclusion ...................................................................................................................... 70
7 Predicting pasture growth from flood and rainfall events............................................................................................ 71
7.1 Introduction ..................................................................................................................... 71 7.2 The pasture growth pulse concept .................................................................................. 71 7.3 Flood categories and pasture response.......................................................................... 72 7.4 Methodology....................................................................................................................73 7.4.1 Understanding and modelling pasture growth pulses ......................................... 73
7.4.2 Rainfall and flooding ........................................................................................... 74
7.4.3 Soil moisture....................................................................................................... 74
7.4.4 Pasture nutrients ................................................................................................ 74
7.4.5 Yield and composition ........................................................................................ 75
7.4.6 Estimating bluebush browse............................................................................... 76 7.5 Modelling pasture growth pulses..................................................................................... 76 7.6 Results and Discussion................................................................................................... 76 7.6.1 Rainfall and flooding ........................................................................................... 76
7.6.2 Pasture nutrient levels ........................................................................................ 77
7.6.3 Yield and composition ........................................................................................ 78
7.6.4 Estimating bluebush browse............................................................................... 81 7.7 Modelling pasture growth pulses..................................................................................... 82 7.7.1 Setting ‘GRASP’ parameters .............................................................................. 82
7.7.2 Calibrating ‘GRASP’ for improved accuracy ....................................................... 83
7.7.3 Soil water............................................................................................................ 85
7.7.4 Model calibration accuracy ................................................................................. 86
7.7.5 ‘GRASP’ modelled output ................................................................................... 89
7.7.6 Indicative pasture growth tables ......................................................................... 90 7.8 Conclusion ...................................................................................................................... 90
8 Monitoring for Land Condition in the Floodplains......... 90 8.1 Introduction ..................................................................................................................... 90 8.2 Methodology....................................................................................................................90

Sustainable Grazing in the Channel Country Floodplains (Phase 2)
Page 8 of 158
8.2.1 Monitoring grazing impacts................................................................................. 90
8.2.2 Incorporating local/experiential knowledge......................................................... 91
8.2.3 Vegetation differences........................................................................................ 91 8.3 Results and Discussion................................................................................................... 91 8.3.1 Infrastructure influences on grazing pressure................................................... 102
8.3.2 A conceptual framework for assessing changes in land condition.................... 103
8.3.3 Monitoring land condition.................................................................................. 104 8.4 Conclusions................................................................................................................... 106
9 Success in Achieving Objectives.................................. 107
10 Impact on Meat and Livestock Industry–Now and in Five Years Time....................................................................... 107
11 Conclusions and Recommendations............................ 108
12 References....................................................................... 112
13 Appendices...................................................................... 121 13.1 Glossary of Terms......................................................................................................... 121 13.2 Summary of Catchment Scale Rainfall Events and Reports on Subsequent Flooding.124 13.3 Summary of Flood Categories for Major Published Events for a) Cooper Creek and b)
Diamantina River........................................................................................................... 138 13.4 Automated gauge depth (m) and resultant soil moisture levels (%) from selected sites
following the 2004 flood pulse....................................................................................... 142 13.5 Site Overview–Aerial Photographs from the 2004 Flood Pulse. ................................... 151 13.6 MODIS 16–day Composite Imagery from the 2004 Flood Pulse .................................. 157 List of Tables Table 3–1. Distribution and size (km2) of the Channel Country floodplains (from Graetz 1......... 17 Table 3–2. Channel Country Land System descriptions (modified from Turner et al. 1993 and
Mills 1980)........................................................................................................................ 23 Table 3–3. Rainfall Statistics for Cooper Creek (Longreach and Innamincka Station); Diamantina
River (Winton and Birdsville); and Georgina River (Camooweal). (Clewett et al. 1999) .. 24 Table 4–1. The Sustainable Grazing in the Channel Country Floodplains Steering Committee
membership as of January 2006...................................................................................... 32 Table 5–1. Summary of hydrological characteristics and land systems flooded during good,
handy, gutter and Channel Floods ................................................................................... 52 Table 5–2. Important watercourse modifiers of flood type ........................................................... 56 Table 6–1. The probability of receiving sufficient rain for Good and Handy flooding in a) the
Cooper Creek b) the Diamantina River catchments......................................................... 63 Table 6–2. Estimated time for the flood peak to travel between key locations on a) the Cooper b)
the Diamantina ................................................................................................................. 69 Table 6–3. Peak flood depth, start date and duration of the 2004 flood pulse, and maximum
resultant soil moisture levels (%) for each of the 17 Channel Country monitoring sites .. 70 Table 7–1. Flood type definitions (from Edmondston 2001) ........................................................ 73 Table 7–2. Pasture chemical analyses and procedures .............................................................. 74 Table 7–3. Site locations in relation to Land System, sub-category (bluebush or lignum dominant)
and river system............................................................................................................... 75

Sustainable Grazing in the Channel Country Floodplains (Phase 2)
Page 9 of 158
Table 7–4. Average protein (%), digestibly (IVDMD %) and phosphorus (P %) within plant categories of perennial grass, annual grass, bluebush, forbs and other plants across a) River systems and b) land systems ................................................................................. 77
Table 7–5. Correlation values (r2) of visual, measured and diameter based calculated parameters for estimating bluebush and peabush browse (kg/plant). Highlighted values are significant (P<0.01) ........................................................................................................................... 82
Table 7–6. Adjusted values for key model parameters at the Monkira C1 bluebush site, compared with standard black speargrass model values ................................................ 83
Table 7–7. The date sequences of rainfall and flooding events at Site 16 during a period of poor ‘GRASP’ pasture growth model accuracy in 2003 ........................................................... 87
Table 7–8. Indicative pasture yields (kg/ha) within the flood categories Good, Handy, Gutter and Channel............................................................................................................................ 90
Table 8–1. Changes in a) total yield (kg/ha) within grazed and ungrazed transects on 10 occasions between July 2002 and November 2005 and b) ground cover (%) between December 2004 and November 2005. There were significant differences within groups. Significance levels are represented by chi squared values ............................................. 93
Table 8–2. Frequency of occurrence (%) of the ten most common plant species recorded between July 2002 and November 2005 following continued grazing (gr) or exclosure (ungr) since 1999 ............................................................................................................. 95
Table 8–3. Grazing pressure (low, moderate or high) inferred by the proximity of water points, roads and yards to the 17 floodplain grazing monitoring sites. ...................................... 102
Table 8–4. Potential ABCD land condition framework for the Channel Country floodplains indicating botanical composition and landscape processes in floodplains in A, B, C or D condition within a) C1 and C3 land systems and b) C2 land systems............................ 105
List of Figures Figure 1–1. The target area of the project ‘Sustainable Grazing in the Channel Country
Floodplains’ (SGCCF). Grazing properties with major areas of floodplain are shown, and the location of the 17 detailed study sites are indicated (stars)........................................ 13
Figure 3–1. The Lake Eyre Basin, showing the Georgina and Diamantina Rivers and Cooper Creek (adapted from White 2002, courtesy of Desert Channels Queensland) ................ 16
Figure 3–2. An example of the location of land systems relative to major river channels, in this case Cooper Creek south of Windorah. WARLUS land systems are shown overlaying a satellite image (Landsat ETM+) from 2001 ...................................................................... 22
Figure 3–3. Five-year average rainfall trend figures for Birdsville and Longreach from mid 1890s (Clewett et al. 1999) ......................................................................................................... 25
Figure 3–4. The major pasture communities of western Queensland.......................................... 29 Figure 4–1. Hydrograph of stage heights (water levels) required for good, handy, gutter and
Channel Floods at Windorah............................................................................................ 34 Figure 4–2. Cattle stocking response on the floodplains (as a percentage of the potential cattle
numbers) following the first Good Flood after drought & destocked conditions, but with no follow-up flooding or rain. In reality dates and stock numbers would vary from this; it is presented as a simple model to demonstrate that restocking takes time and that destocking occurs in stages ............................................................................................. 38
Figure 4–3. Summary of the project inputs (e.g. data and local knowledge), tools produced and delivery mechanisms to ensure sustainable grazing in the Channel Country floodplains based on a continuous improvement cycle ...................................................................... 40
Figure 5–1. Monthly distribution (mm/month) for average rainfall and pan evaporation rates for selected upper catchments at a) Camooweal (Georgina) b) Winton (Diamantina) c) Hughenden (Cooper) d) Tambo (Cooper) and mid to lower catchments at e) Birdsville (Diamantina)and f) Windorah (Cooper) climate stations. MAR is Mean Annual Rainfall (Clewett et al. 2003) ......................................................................................................... 43
Sustainable Grazing in the Channel Country Floodplains (Phase 2)
Page 10 of 158
Figure 5–2. Hydrograph of three ‘above-major’ (good) flood events at Windorah (BoM historical data) ................................................................................................................................. 54
Figure 5–3. Stylised flood waves showing a rapid, less effective, rise (solid line) and a slower, more effective, rise (dotted line)....................................................................................... 55
Figure 5–4. An example decision tree to assist in predicting flood size, once upper catchment rains have begun.............................................................................................................. 59
Figure 6–1. Channel Country project site locations in relation to the mid-Diamantina ARIDFLO model area ....................................................................................................................... 61
Figure 6–2. Pie chart of the frequency of good, handy, gutter and Channel Floods in a) Cooper Creek at Windorah b) the Diamantina River at Diamantina Lakes................................... 64
Figure 6–3. MODIS 16–day composite imagery from the Handy to Good flood event of 2004, showing a) the initial flood pulse in the upper to mid reaches (mid January 2004) and (next page); b) the flood pulse progressing through the mid to lower reaches (early February 2004); c) the flush of green pasture following the flood pulse at it progresses through the lower reaches (mid February 2004); d) pasture growth in all reaches following the flood pulse (early March 2004), and e) maintained through to early April 2004. Floodwaters appear as blue, pasture as green and cloud as white ................................. 66
Figure 6–4. Predicted ARIDFLO flow regimes (vertical bars) for the cell containing Monkira C1 bluebush and observed homestead stage height (crosses) between 1999 and 2003 ..... 68
Figure 7–1. A simple conceptual representation of the dynamics of floods and responding vegetation growth............................................................................................................. 72
Figure 7–2. The relative importance of Good, Handy, Gutter and Channel Floods in terms of pasture response and the potential numbers of cattle initially carried.............................. 73
Figure 7–3. Harvested pasture component (perennial grass, annual grass, bluebush, forbs and other plants) and total yields (kg/ha) between April 1999 and August 2005 in relation to flood events at a) Site 3, b) Site 5, c) Site 6, d) Site 13 and e) Site 16. Flood height, duration and category (Good, Handy, Gutter or Channel) descriptions are for the nearest flood gauging station ........................................................................................................ 80
Figure 7–4. Conceptual diagram of species composition (hard-seeded versus soft-seeded) changes following drought compared with those following a sequence of Good Flood events. Potential changes in peabush and sorghum dominance are used as examples. 81
Figure 7–5. Observed and simulated useful bluebush yield for the Monkira bluebush site ......... 84 Figure 7–6. Observed (points) and predicted (continuous line) data for a) yield (kg/ha) and b) soil
moisture (total soil water content (mm) to a depth of 1 m) for the Monkira bluebush site. The circled data in a) indicates where measured standing dry matter yields have been over-estimated through the inclusion of lodged material.................................................. 86
Figure 7–7. Observed versus predicted total standing dry matter (TSDM) (measured as kg/ha) for all 17 sites within C1 bluebush, C1 lignum, C2 or C3 land systems on the Channel Country floodplains of Cooper Creek and the Diamantina and Georgina Rivers (as indicated by annotations on each graph). R2 values of the regression (forced through the origin) are indicated for each location. Site 16 is presented as a complete data set and with data from a difficult to predict flood event in 2003 excluded for comparison. ........... 88
Figure 7–8. Modelled (solid line) ‘GRASP’ pasture growth for a) Site 3; b) Site 5; c) Site 6; d) Site 13 and e) Site 16, compared with observed (points) values ............................................ 89
Figure 8–1. Comparative a) yield (kg/ha) and b) cover (%) values between river systems (Cooper, Diamantina and Georgina), as measured by visual estimation between July 2002 and November 2005................................................................................................ 97
Figure 8–2. Comparative a) yield (kg/ha) and b) cover (%) values between land systems (C1 bluebush, C1 lignum, C2 and C3), as measured by visual estimation between July 2002 and November 2005......................................................................................................... 98
Figure 8–3. Pasture yield (kg/ha), ground cover (%) and example quadrat photographs in grazed and ungrazed site transects at a) Site 5 (C3 bluebush), b) Site 7 (C1 lignum) and c) Site 13 (C2) ........................................................................................................................... 101
Sustainable Grazing in the Channel Country Floodplains (Phase 2)
Page 11 of 158
Figure 8–4. Theoretical impact of grazing on the rate of pasture decline and growth in a) an annual pasture and b) a perennial pasture. ................................................................... 104
Figure 11–1. A simple conceptual diagram of the broad processes determining flooding and pasture growth in the Channel Country floodplains. Blue boxes and lines relate to flooding processes, green to pasture growth processes and yellow to losses from the ground based system. Dashed lines represent modifiers of the main processes. For simplicity, many relationships are not shown.................................................................................. 110
List of Plates Plate 5–1. The ultimate Hortonian overland flow: the Diamantina River between Brighton Downs
and Diamantina Lakes National Park during a moderate flood forms a sheet of water nearly 20 km wide. Photograph courtesy of Bob and Linda Young.................................. 45
Plate 5–2. A flooded primary anabranching channel in the Thomson River at Longreach in the upper reaches of the Cooper. Note the Coolabah trees lining the channel are partially submerged at the overbank stage.................................................................................... 47
Plate 5–3. Secondary anabranching channels carrying water away from the primary channel zone in Cooper Creek near Windorah. Water is then being further distributed through swamp gutters at the flood stage ..................................................................................... 47
Plate 5–4. Braided gutters within the green zone ........................................................................ 49 Plate 5–5. Swamp gutters redistributing floodwater at flood stage. The unnaturally straight line to
the right is a fence line ..................................................................................................... 49 Plate 5–6. Floodways carry water during overbank stage, with floodwater flow cutting across
anabranching channels as the water assumes a more direct downstream flow path ...... 50

Sustainable Grazing in the Channel Country Floodplains (Phase 2)
Page 12 of 158
1 Introduction The concept for the project ‘Sustainable Grazing in the Channel Country Floodplains’ (SGCCF) arose from a community and beef industry desire to ensure sustainable production within the area. A series of community forums throughout the early to mid–1990s to discuss possible World Heritage Listing of the area and an application for broad-acre irrigation crystallised the community and industry notion of land managers and scientists working together to define sustainable land management. A period of consultation and funding grant applications ensued, and the project commenced as a partnership between the Department of Primary Industries and Fisheries (DPI&F), community and industry with support from the National Heritage Trust in 1998. Further research grants have been provided by Meat and Livestock Australia, Desert Channels Queensland, and both in-kind and direct financial support from the beef industry (Phelps et al. 2003). This report details data and information gathered for the current phase of research, between June 2003 and August 2006. Earlier reports include bench-marking current industry practice (Edmondston 2001), a review of available literature (White 2001) and a project report for the initial phase of research (Phelps et al. 2003). A number of conference proceedings and popular articles have also been produced. The project comprises detailed measurements on 17 sites within the floodplains of Cooper Creek, and the Diamantina and Georgina Rivers (Figure 1–1). The project has also entailed on-going engagement and consultation with key members of the beef industry. This report will:
• Provide background to the biophysical features of the Channel Country; • Review the latest literature and link scientific and industry definitions of flooding; • Present and discuss the partnership between industry members and science; and • Present and discuss the implications of the latest data of rainfall, flooding, pasture
production and grazing pressure from 17 key sites in the floodplains. This report will also outline guides produced for use by land managers, namely:
• The Channel Country Grazing Land Management education package (Chilcott et al. 2007);
• Flooding rules of thumb for the Cooper and Diamantina (Phelps et al. 2007a, b); and • A guide to forage value in the Channel Country Floodplains (Phelps et al. 2007c).

Sustainable Grazing in the Channel Country Floodplains (Phase 2)
Page 13 of 158
Figure 1–1. The target area of the project ‘Sustainable Grazing in the Channel Country Floodplains’ (SGCCF). Grazing properties with major areas of floodplain are shown, and the location of the 17 detailed study sites are indicated (stars)

Sustainable Grazing in the Channel Country Floodplains (Phase 2)
Page 14 of 158
2 Project Objectives The objectives of the current phase of research were that, by 31 August 2006:
1. Flood depth and duration on pastoral properties will be predictable from upstream flood characteristics using rules of thumb, historic data and monitoring systems.
2. The pasture response (amount, duration and quality) to flood and rain events at floodplain
sites will be predictable with at least 60% confidence.
3. A Decision Support Package of guidelines and tools for flooding prediction and tracking, and feed budgeting for setting initial cattle numbers and for destocking will be published and available for use at a property level.
4. Management guidelines and field tools (such as rules of thumb, photo-standards and a
sustainable management booklet) will be available to determine pasture yield, pasture quality, expected cattle growth rates and grazing pressure in the Decision Support Package to enhance sustainable floodplain management.
5. The impact of grazing on floodplain pasture condition and trend will be documented for
the four years between 2002 and 2006.
6. Management practices a At least 80% of Channel Country landholders and a majority of the general
community in the Channel Country will be aware of the project and its outputs; b At least 50% of landholders in the Channel Country will be testing and using the
decision support guidelines and tools in their floodplain grazing management; and c Educated debate on environmental issues relating to sustainable floodplain
management will be occurring within the general and scientific communities. 3 Background to the Channel Country 3.1 Physical Attributes of the Channel Country
3.1.1 Geographic Information
Three major river systems traverse the Channel Country of eastern central Australia: the Cooper, Diamantina and Georgina. All three arise in the semi-arid rangelands of Queensland and the Northern Territory, where variable rainfall leads to intermittent flows and flooding throughout the rivers. Flooding in the Channel Country is generally beneficial, often being the only source of water within an otherwise arid landscape. Flooding can occur in the absence of local rains, with floodwaters originating in the upper catchment able to travel hundreds of kilometres downstream before evaporating, soaking into the floodplain soils or being diverted into swamps and lakes (Young and Kingsford 2006). The Cooper, Diamantina and Georgina carry floodwaters for up to 1523 km from the north-east of Australia into Lake Eyre, in southern central Australia (Kotwicki 1989; Figure 3–1). The rivers start in high runoff areas such as the rocky hills, jump-ups (mesas) and sandy country of the Great Dividing and Selwyn Ranges and Barkly Tablelands at altitudes of 250–440 m above sea level. Large portions of the catch of each drainage basin are comprised of clay soils with relatively low infiltration rates (low saturated hydraulic conductivity). The rivers drain into the lowest point on the Australian continent, the floor of Lake Eyre, which is 15 m below sea level (Bye et al. 1978; Kotwicki 1986). All three systems reach flat landscapes within 200–300 km of

Sustainable Grazing in the Channel Country Floodplains (Phase 2)
Page 15 of 158
their headwaters. At these points, they start to form broad floodplains within ancient valley floors (Gibling et al. 1998). During major floods, the floodplains can be covered by a single sheet of floodwater spread as wide as 70 km. These floods are beneficial, filling ephemeral wetlands which are important environmentally (e.g. for waterbird breeding, Kingsford 1996). The floods also grow naturally irrigated native pastures, with recorded yields in excess of 7000 kg/ha (Phelps et al 2003). A cattle production industry is based on these pastures, and the Channel Country carries between 0.5 and 1.0 million head of cattle, with an economic value in excess of $150 M (Phelps et al. 2003). The Cooper, Diamantina and Georgina are classified as anastomosing1 rivers, as are many of their major tributaries (Rosgen 1994; Nanson and Knighton 1996; Makaske 2001). Anastomosing rivers have two or more relatively straight channels which branch off the main channel but rejoin it downstream, with large, stable islands between the channels. The channels are generally not meandering or greatly curved. Anastomosing rivers are a complex form of anabranching, or multiple braided, rivers which form under relatively low flow, high sediment conditions. Anabranching channels exhibit greater sediment transporting capacity per unit available stream power and thus maximise flow efficiency (Jansen and Nanson 2004). The Cooper is officially recorded as Cooper Creek, which is a misnomer as it is a River in every sense except for a continuous flow of water. The Cooper is 1523 km long, has a valley floor of up to 70 km width, and the average daily flow at Innamincka between 1973–1993 was 63 m3/sec, similar to that of the Thames in the UK (White 2001). The first European to see the Cooper was the explorer Sturt, on 13 October 1845. He established a temporary camp on the banks of a waterhole 220 m wide and 8 m deep in the lower reaches of the system: “…we found ourselves on the banks of a splendid creek [Cooper Creek], far exceeding in size any we had seen in the interior” (Sturt 1847). They traced the watercourse for over 105 km, but had to turn back due to a lack of water, recognising that they were still nowhere near the headwaters of the system. Presumably the lack of flowing water lead Sturt to name it Cooper Creek, despite a diary entry comparing it with the River Murray. Convention sees the Cooper remain titled a creek, even though later explorers recognised its tributaries, the Thomson and Barcoo, as Rivers. Similarly, Eyre Creek (also named by Sturt) originates as the Georgina River, and probably should also be recognised as a river, rather than a creek. Whilst the Thomson and Barcoo form the Cooper just north of Windorah, neither are considered to have “true” Channel Country; although there are areas of flat floodplain which substantially benefit from flood events in both of these, and other rivers. The Bulloo River to the east which lies outside of the Lake Eyre Basin, is possibly the most similar to true Channel Country, whilst in the Northern Territory there are similarities with flooded lake systems of the Barkly Tableland.
1 See Appendix 13.1 ‘Glossary of Terms’ for definitions.

Sustainable Grazing in the Channel Country Floodplains (Phase 2)
Page 16 of 158
Figure 3–1. The Lake Eyre Basin, showing the Georgina and Diamantina Rivers and Cooper Creek (adapted from White 2002, courtesy of Desert Channels Queensland) The Lake Eyre Basin (LEB) is one of the world’s largest internally draining (endorheic) catchments. It covers around 1.3 million km2 (Kingsford and Porter 1993), 15% of the Australian continent. The terminal point, Lake Eyre, is the lowest point of the Australian continent, at about 15 m below sea level (Bye et al. 1978; Kotwicki 1986), although the precise value and location within the lake bed changes over time (Twidale and Wopfner 1990). During the largest recorded flood event of 1974, the surface areas of Lake Eyre North and South were 8,430 and 1,260 km2 and the volumes 27,700 and 2,380 km3 respectively (Bye et al. 1978). The total combined floodplain area of the Georgina, Diamantina and Cooper is approximately 208,000 km2, or 30% of their combined catchment area (Table 3–1). All three river systems have extensive floodplains of up to 70 km wide. The floodplains represent wide valley floors. Over the last 100,000 years slow moving, sediment charged, floodwaters have built up clay soils of 2–9 m depth through deposition (Gibling et al. 1998). The source of the clay is predominantly the Mitchell grasslands (Orr and Holmes 1984) of the upper reaches of the rivers. Sand is available through erosion in many upper catchment areas (e.g. Turner et al. 1993), but the river systems lack the water speed and stream energy to carry these heavier particles (Gibling et al. 1998). However layers of sand, aged from between 100,000 and 300,000 years ago, underlay the clay
Barkly Tableland
Selwyn Range
Great D
ividing Range

Sustainable Grazing in the Channel Country Floodplains (Phase 2)
Page 17 of 158
soils. These sands indicate faster moving floodwaters with greater stream energy and hence that a generally wetter period existed between 100,000 and 300,000 years ago (Gibling et al. 1998). Table 3–1. Distribution and size (km2) of the Channel Country floodplains (from Graetz 1980)
River system Floodplain area (km2)
Catchment area (km2)
Floodplain proportion
Cooper Creek 103,600 296,000 35% Diamantina River 55,000 158,000 35% Georgina River 49,000 242,000 20% Total 207,600 696,000 30% 3.2 Biophysical Description of the Channel Country
3.2.1 Geology and landforms
Floodplains The term Channel Country is derived from the clay rich floodplains of the anastomosing river systems which have been aggrading slowly over the past 100,000 years (Gibling et al. 1998). This overlying mud unit dates from modern at the surface to 50,000 to 80,000 B.P. at its contact with extensive alluvial sand plains on the lows of the historic drainage basins 2.5 to 7.0 m below the surface (Nanson et al. 1986; Nanson et al. 1988). These were formed by erosion during the Quaternary period (Dawson 1974; State Public Relations Bureau 1977; Hughes 1980) of Cretaceous sediments (McDonald and Thomas 1993) such as mudstones and labile sandstones, which weathered to form clay or sandy clay soils (Mills and Ahern 1980). The deposition of these sands were characterised by meandering, laterally-migrating channels (Nanson et al. 1988). For a discussion of the evolution of the Lake Eyre Basin see Alley (1998). From around 60,000 to 50,000 B.P. Lake Eyre became drier, changing from a permanently wet lake and enabling sediment to be deflated (by wind erosion) from the lake floor forming the current playa2. From then to 35,000 B.P. conditions at Lake Eyre were wetter than at any time since and from that time to 10,000 B.P. the lake was at least as dry as today. The current ephemerally flooding playa conditions were established between 3,000 to 4,000 B.P. (Magee and Miller 1998; Nanson et al. 1998). Lacustrine3 deposits are extensive in the Lake Yamma Yamma area with over 100 m of alluvia recorded (Dawson 1974). The Channel Country floodplains of today are only part of a former great spread of silts, with considerable areas now covered by wind-accumulated sand deposits removed from the flood zone deposits (BoI 1947). To the west of the Georgina and to a lesser extent the Cooper, extensive sandplains and dunefields occur. The dunes in the Simpson Desert are up to 320 km long, running in a NNW-SSE direction, fixed, except for their unvegetated crests (State Public Relations Bureau 1977). Outside country The country beyond the floodplains is colloquially known as ‘the outside country’. The landforms of the outside country include the dissected remains of tertiary land surfaces. These vary from resistant silcrete-capped tablelands, mesas and buttes which rise from 30 to 100 m above the plains, known colloquially as ‘jump-ups’, through undulating plains to flat detrital plains left after the deflation of the original tertiary land surface through wind. These plains are generally covered with small stones, known as gibbers, which represent the remains of the eroded laterite (State Public Relations Bureau 1977).
2 From the Spanish playa for shore or beach, it describes flat topographic depressions that flood occasionally. 3 of, or relating to, a lake

Sustainable Grazing in the Channel Country Floodplains (Phase 2)
Page 18 of 158
The development of the dunefields of the Simpson Desert, Tirari Desert and Sturt’s Stony Desert represent the most recent depositional event of the late Cainozoic sedimentation cycle. The surface beneath the dunefield is of depositional origin resembling a tilted irregularly indented, and hence asymmetrical, dish (Twidale and Wopfner 1990). The Simpson Desert location is associated with Lake Eyre itself and the large floodout of the Diamantina River southwest of Birdsville. These are primary sources of sand for the desert (Twidale and Wopfner 1990). Salt lakes, formed by wind deflation of alluvium to the level of the water table, are present in the area. These receive groundwater seepage from salt impregnated alluvium around the lake when the water table rises, and with the subsequent fall in the water table the salt crystallises forming a crust. Groundwater in the South Australian section of Cooper Creek floodplain contains salt at two levels: less than 1,000 mg/l; and up to 3,000 mg/l, of which sodium is the major component (Mollemans et al. 1984). The source of salts is believed to be connate salts, deposited in sediments when the area was a marine environment, inundated by the sea in the Cretaceous period (Johnson 1980). Claypans are deflation hollows where the groundwater table has not been reached and which therefore do not receive groundwater seepage (Mollemans et al. 1984). 3.2.2 Soils
Formation of floodplain soils The floodplains are the product of an extensive historical erosion system. Channels receive pedogenic, sand-sized mud aggregates generated on adjacent floodplains and reworked into braid bars during valley wide floods. Some quartz sand is provided from excavation of subsurface Pleistocene sands in deep channels and waterholes and aeolian dunes on the floodplains. Adjacent gibber stone plains provide some gravel to the system. Channel sediments form mainly as accretionary benches of mud and sand, sandy channel-base sheets and vegetation shadow deposits. They are profoundly affected by desiccation during dry periods and by bioturbation (disturbance by living organisms such as by within-channel trees and burrowing invertebrates, especially crayfish). Floodplain muds are converted to vertisols with Gilgai (saucer-like water holding depressions), deep desiccation cracks, and impregnations of carbonate and gypsum (Gibling et al. 1998). Classification of floodplain soils Soils of the floodplains in the South Australian section of the Channel Country are classified using Northcote’s description, as Ug 5.24: grey self-mulching cracking clays (Laut et al. 1977), or on the channelled plains as Ug 5.28 (Purdie 1984). The alluvial soils of the Queensland sections of the Diamantina and Cooper are brown medium clays, light medium clay or light clay, in places overlying a thick sand layer at depth of about 2 m (CMPS&F 1996). They exhibit varying amounts of silts and sand throughout the profile, and profiles are well structured to massive throughout with massive grey clays predominating in swampy areas (Mills and Ahern 1980). On the Cooper floodplain, soils are described as self-mulching heavy grey clay characterised in dry weather by a loose surface mulch of about 7.5 cm overlying stiff and heavily cracked clay (Skerman 1947). As the Cooper floodwaters spread out near Windorah, deposition of coarser sediments ceases and mainly fine sand, clay and silt particles are carried further and slowly deposited. Some of these fine clay particles remain in suspension as turbid water in waterholes (Skerman 1947). Drill logs on the Cooper show a tendency for a greater total proportion of mud in the alluvium downstream of Innamincka contrasting with a greater proportion of sand in the cores near Windorah. This is probably related to the greater frequency and power of floods in the upper catchment compared with the lower slope downstream (Nanson et al. 1988).

Sustainable Grazing in the Channel Country Floodplains (Phase 2)
Page 19 of 158
Floodplain soil fertility Floodplain soils are moderately fertile, but limited by the high clay content, massive cracking and high alkalinity. Available phosphorus (P) levels are high by Australian standards, which are usually low to very low. Grey clays have been noted to generally contain 27 mg/kg of P and Phelps et al. (2003) report a range of 13–48 mg/kg, placing the floodplain soils at the richer end of the scale for these soils (Russell and Greacen 1977). Soil Organic Carbon (organic matter, %) levels range from 0.13–0.63% (Phelps et al. 2003) which is low, but comparable to other soils within western Queensland (Mills and Ahern 1980). Total nitrogen (N) ranges from 0.02–0.07% (Phelps et al. 2003) and available nitrogen is generally high, but can be exhausted from the “nitrogen pool” due to the volume of forage produced after a flood. Small falls of rain may not initiate plant growth but may activate breakdown of organic matter by soil micro-organisms, releasing N in the available ammonium and nitrate form. The flush of growth after sufficient rain or floods utilises this available N, reducing the mineral N pool. In a series of successive floods large amounts of the nitrogen reserves may be tied up in an organic form, both in the soil organic matter and in plants. The breakdown of soil organic matter and litter is an important process in nutrient availability, soil structure and consequently porosity and the ability to retain moisture (Dawson and Ahern 1974). After periods of pasture production soils are likely to lose considerable available N if they are saturated during warm summer months, this being exacerbated if above-ground plant residues remain (Pu et al. 1999). This is often replenished during and immediately after the next flood. High levels of potassium (K), magnesium (Mg), calcium (Ca) and Sodium (Na) have been recorded in the Cooper and Diamantina floodplain soils. Additionally, the Diamantina soil had high exchangeable Mg; a pH of 6.1 and low levels of total soluble salts (TSS); the Cooper soil recorded high levels of sulphur (S); very high soluble salt levels; an acute deficiency in zinc (Zn) and a pH of 6.3 (CMPS&F 1996). The Cation Exchange Capacity (CEC) of the grey clays tends to indicate a predominantly montmorillonitic type clay with Ca being the dominant cation and exchangeable Mg and K having a satisfactory plant nutrition level (Dawson and Ahern 1974). Clay content ranges from 46 to 62% (Boyland 1984). Locations within the Diamantina and Georgina, but not the Cooper, become saline (an EC of >4 mS/cm) at depth which may limit moisture penetration (Phelps et al. 2003). Deposits of limestone and gypsum (CaSO4) occur at depths below 60 cm (Skerman 1947). Gypsum is associated with less alkaline soils, whereas calcium carbonate (CaCO3) is commonly associated with the more alkaline soils. The alluvial clays are generally non-saline at the surface, and at times saline at depth associated with gypsum deposits (Mills and Ahern 1980). Salinity increases towards the terminus of the system reflecting the transportation downstream and concentration by evaporation (Marree Soil Conservation Board 1996). Soil pH levels are generally alkaline (Mills and Ahern 1980), ranging from neutral to strongly alkaline (Marree Soil Conservation Board 1996) and increasing with depth (Skerman 1947). Grey clays on alluvia exhibit a slightly acid to mildly alkaline reaction on the surface, with a range of reactions from strongly acid to very strongly alkaline at 60 cm (Dawson and Ahern 1974). High levels of alkalinity or acidity can lead to toxicity or deficiency of some trace elements (Mills and Ahern 1980). Floodplain soil moisture The clay soils of the floodplains have a high water storage capacity. Large cracks from 75-150 mm wide can develop leaving lenses of soil up to one metre across. These cracks allow easy entry of the floodwater, with the first water appearing underground in the cracks ahead of the main flood (Skerman 1947). After this occurs and the surface seals, infiltration rates become extremely low (Dawson and Ahern 1974; Mills and Ahern 1980). However, when wet up to field capacity by floods, plant growth can be maintained for months (Mills and Ahern 1980). Skerman
Sustainable Grazing in the Channel Country Floodplains (Phase 2)
Page 20 of 158
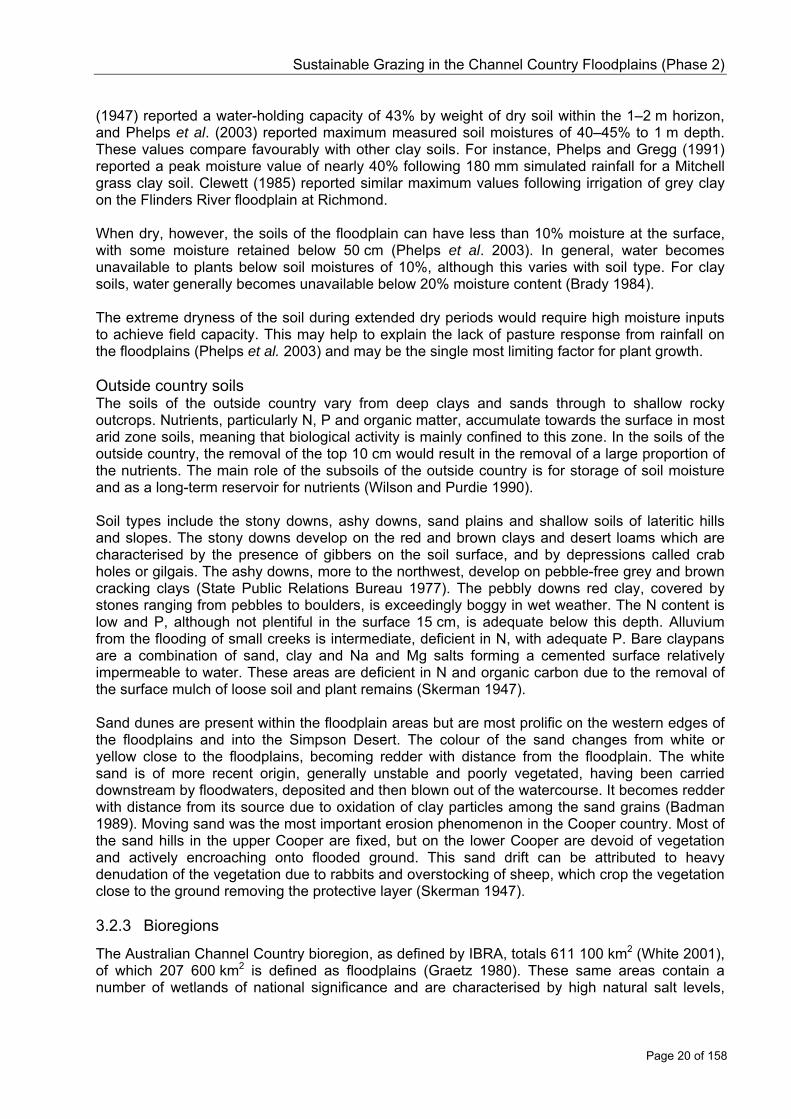
(1947) reported a water-holding capacity of 43% by weight of dry soil within the 1–2 m horizon, and Phelps et al. (2003) reported maximum measured soil moistures of 40–45% to 1 m depth. These values compare favourably with other clay soils. For instance, Phelps and Gregg (1991) reported a peak moisture value of nearly 40% following 180 mm simulated rainfall for a Mitchell grass clay soil. Clewett (1985) reported similar maximum values following irrigation of grey clay on the Flinders River floodplain at Richmond. When dry, however, the soils of the floodplain can have less than 10% moisture at the surface, with some moisture retained below 50 cm (Phelps et al. 2003). In general, water becomes unavailable to plants below soil moistures of 10%, although this varies with soil type. For clay soils, water generally becomes unavailable below 20% moisture content (Brady 1984). The extreme dryness of the soil during extended dry periods would require high moisture inputs to achieve field capacity. This may help to explain the lack of pasture response from rainfall on the floodplains (Phelps et al. 2003) and may be the single most limiting factor for plant growth. Outside country soils The soils of the outside country vary from deep clays and sands through to shallow rocky outcrops. Nutrients, particularly N, P and organic matter, accumulate towards the surface in most arid zone soils, meaning that biological activity is mainly confined to this zone. In the soils of the outside country, the removal of the top 10 cm would result in the removal of a large proportion of the nutrients. The main role of the subsoils of the outside country is for storage of soil moisture and as a long-term reservoir for nutrients (Wilson and Purdie 1990). Soil types include the stony downs, ashy downs, sand plains and shallow soils of lateritic hills and slopes. The stony downs develop on the red and brown clays and desert loams which are characterised by the presence of gibbers on the soil surface, and by depressions called crab holes or gilgais. The ashy downs, more to the northwest, develop on pebble-free grey and brown cracking clays (State Public Relations Bureau 1977). The pebbly downs red clay, covered by stones ranging from pebbles to boulders, is exceedingly boggy in wet weather. The N content is low and P, although not plentiful in the surface 15 cm, is adequate below this depth. Alluvium from the flooding of small creeks is intermediate, deficient in N, with adequate P. Bare claypans are a combination of sand, clay and Na and Mg salts forming a cemented surface relatively impermeable to water. These areas are deficient in N and organic carbon due to the removal of the surface mulch of loose soil and plant remains (Skerman 1947). Sand dunes are present within the floodplain areas but are most prolific on the western edges of the floodplains and into the Simpson Desert. The colour of the sand changes from white or yellow close to the floodplains, becoming redder with distance from the floodplain. The white sand is of more recent origin, generally unstable and poorly vegetated, having been carried downstream by floodwaters, deposited and then blown out of the watercourse. It becomes redder with distance from its source due to oxidation of clay particles among the sand grains (Badman 1989). Moving sand was the most important erosion phenomenon in the Cooper country. Most of the sand hills in the upper Cooper are fixed, but on the lower Cooper are devoid of vegetation and actively encroaching onto flooded ground. This sand drift can be attributed to heavy denudation of the vegetation due to rabbits and overstocking of sheep, which crop the vegetation close to the ground removing the protective layer (Skerman 1947). 3.2.3 Bioregions
The Australian Channel Country bioregion, as defined by IBRA, totals 611 100 km2 (White 2001), of which 207 600 km2 is defined as floodplains (Graetz 1980). These same areas contain a number of wetlands of national significance and are characterised by high natural salt levels,

Sustainable Grazing in the Channel Country Floodplains (Phase 2)
Page 21 of 158
sediment loads and wind-borne sand movement. Sustainable grazing practices will help to ensure the fine ecological balance of these rivers and wetlands is maintained. The Queensland Channel Country bioregion (Sattler and Williams 1999) covers an area of 238,800 km2 or 13.7% of the state and contains six provinces based on climate, geology, landform and vegetation, and 56 regional ecosystems (Wilson 1999). The provinces and the number of regional ecosystems present within each are:
1. Simpson–Strzelecki dunefields with 13 regional ecosystems (considered by Thackway and Cresswell in 1995 to be a distinct bioregion);
2. Diamantina plains with 29 regional ecosystems; 3. Goneaway tablelands with 15 regional ecosystems; 4. Cooper plains with 29 regional ecosystems; 5. Toko plains with 15 regional ecosystems; and 6. Noccundra slopes with 12 regional ecosystems.
Of the 56 regional ecosystems present, two are classed as ‘endangered’ (Sattler & Williams 1999): the artesian mound springs, and the Acacia peuce (waddy tree) low open woodlands on the Diamantina plains. Five are of concern: Coolabah/river red gum fringing woodland in provinces 2 and 4; sparse herbland on claypans in provinces 1, 2 and 4; mulga woodland in provinces 3 and 6; Acacia calcicola (northern myall) tall shrubland between dunes in province 4; and saltbush, burrs and short grasses on Cretaceous sediment in provinces 2 and 5. The remaining 46 provinces are classed as being ‘of no concern’ at the present (Wilson 1999). 3.2.4 Land systems
The Channel Country floodplains have been classified into three major, and one minor, land systems in Queensland (Table 3–2) based on the six-part Western Arid Region Land Use Survey (WARLUS) series (Turner et al. 1993). Land systems comprise a numbered code (e.g. C1), a descriptive code (e.g. Cooper) and a description. Flooding frequency, duration, water speed and inundation height differ between these classifications. Land system C1 (Cooper) generally floods more frequently, can be deeper and with faster moving water than C3 (Woonabootra) or C2 (Cunnawilla) as it follows the major river channels (Figure 3–2). In contrast, C2 floods the least frequently and for the shortest duration, has the lowest water depth and slow water speed as it occurs the furthest from major channels, or as higher areas if close to major channels. C3, whilst having an intermittent flooding frequency with variable water speed and inundation, tends to have the longest flooding duration, as it occurs as low-lying swamps and depressions.

Sustainable Grazing in the Channel Country Floodplains (Phase 2)
Page 22 of 158
Figure 3–2. An example of the location of land systems relative to major river channels, in this case Cooper Creek south of Windorah. WARLUS land systems are shown overlaying a satellite image (Landsat ETM+) from 2001

Sustainable Grazing in the Channel Country Floodplains (Phase 2)
Page 23 of 158
Table 3–2. Channel Country Land System descriptions (modified from Turner et al. 1993 and Mills 1980)
Land System Vegetation description Flooding description Soils description
COOPER (C1)
To the north, sparse (open) grassland, ephemeral herbland or forbland, with Queensland bluebush/lignum low open shrubland in depressions, and Coolabah, lignum/belalie, gooramurra shrubby (low) open woodland on major channels; grading into Coolabah/lignum low open woodland on major channels, and river red gum/Coolabah low open woodland to open woodland on main channels to the south
Frequently flooded alluvial plains with anastomosing channels, often with deep and fast moving water associated with major channels
Very deep, grey cracking clays
CUNNAWILLA (C2)
Ephemeral sparse (open) herbland, grassland, forbland or saltbush/bassia/short grass herbfield, with Coolabah/lignum shrubby low open woodland along minor channels
Occasionally flooded, flat alluvial plains
Very deep, crusted, brown and grey cracking clays subject to scalding
WOONABOOTRA (C3)
Queensland bluebush herbaceous low open shrubland and lignum low open scrub with Coolabah, lignum, belalie, gooramurra shrubby low open woodland on larger channels and ephemeral herbland and forbland sparsely wooded with Coolabah, with areas of swamp canegrass low open shrubland to the south
Poorly drained swamps and depressions on alluvial plains (often channelled)
Very deep, poorly drained, grey cracking clays with occasional small gilgai
KENDALL (C1 in WARLUS Part V, north of Windorah)
Predominantly short grasses with bluebush, lignum low open-shrubland in depressions to Coolabah, river red gum, belalie, gooramurra, lignum shrubby open-woodland fringing the channels and deep waterholes
Flooded alluvial plains with anastomosing channels
Deep grey cracking clays.

Sustainable Grazing in the Channel Country Floodplains (Phase 2)
Page 24 of 158
3.2.5 Rainfall
Mean annual rainfall varies from 400 to 500mm in the headwaters to less than 100 mm at Lake Eyre (Knighton and Nanson 1994). At any location within the study area the variability of rainfall is high, with major rainfall and flooding extremes, especially over a 2 to 4 year cycle (Puckridge et al. 1998b), being linked to the La Niña phase (Kotwicki and Allan 1998; Puckridge et al. 1998a) of the El Niño Southern Oscillation (ENSO) phenomenon (Allan 1990). At Longreach, for example, the recorded annual rainfall varies from 109 mm in 1902 to 1,077 mm in 1894 (Clewett et al.1999). The rainfall is also seasonal (see Table 3–3). In the northern areas, 70%, on average, falls in the five month period December to April. This comes mainly from the northern monsoons which can cross the coast and degenerate into rain depressions. The southern areas around Lake Eyre are not as seasonal, with around 40% of the average 172 mm falling in the cooler winter months at Innamincka, and 50% of the average 160 mm at Marree (Mollemans et al. 1984). Average annual rainfall in the southwest corner of Queensland is around 150 mm (DNR 1997). In 1974, Mawson et al (1974) concluded that the rainfall deficiency experienced at the beginning of the 20th century was the largest on record; now equalled by the current (2000–2006) drought. The breaking of the drought at the beginning of the century was followed by a 20-year period of generally above average rainfall. From the mid 1920s to the 1950s followed a period of generally below average rainfall, including a drought which started in 1946. The decade from 1950 to 1960 was the wettest on record and was followed by a further period of below average falls to 1972 (Mawson et al. 1974). Figure 3–3 details the 5-year moving average rainfall for Birdsville and Longreach from the beginning of rainfall recordings (Clewett et al. 1999). From the 1890s to the mid 1970s rainfall trends between the two regions, as described by Mawson et al (1974), were similar. Rainfall during the 30-year period from the 1920s seems to exhibit greater deficiency than at the turn of the century. Since the mid 1970s, Longreach has experienced generally below average rainfall, while Birdsville has been above average. Table 3–3. Rainfall Statistics for Cooper Creek (Longreach and Innamincka Station); Diamantina River (Winton and Birdsville); and Georgina River (Camooweal). (Clewett et al. 1999) Longreach Innamincka Winton Birdsville Camooweal max mean min max mean min max mean min max mean min max mean min Jan 420 69 0 536 28 0 563 80 0 263 26 0 593 94 0 Feb 405 84 0 313 22 0 464 88 0 300 28 0 385 91 0 Mar 379 59 0 305 22 0 250 54 0 167 17 0 311 56 0 Apr 314 33 0 95 11 0 186 22 0 87 10 0 174 13 0 May 175 25 0 117 12 0 215 21 0 110 12 0 147 11 0 Jun 126 19 0 74 12 0 158 18 0 74 10 0 117 11 0 Jul 112 19 0 101 11 0 114 16 0 108 11 0 82 6 0 Aug 70 9 0 57 7 0 69 6 0 57 6 0 88 3 0 Sept 122 12 0 132 8 0 63 9 0 86 6 0 80 6 0 Oct 139 24 0 65 12 0 172 19 0 97 12 0 125 15 0 Nov 163 29 0 99 11 0 243 32 0 163 14 0 138 29 0 Dec 232 54 0 131 17 0 241 50 0 109 16 0 289 61 0 Annual 1077 438 109 866 172 14 1171 368 88 542 167 33 1003 398 151

Sustainable Grazing in the Channel Country Floodplains (Phase 2)
Page 25 of 158
Figure 3–3. Five-year average rainfall trend figures for Birdsville and Longreach from mid 1890s (Clewett et al. 1999) 3.2.6 Evaporation
Evaporation losses become very significant when calculating water balances (input-output relationships) for the river systems. Floods are summer dominant, cover vast areas and are relatively shallow, factors which enhance evaporation rates (Knighton and Nanson 1994). Throughout the area nine stations measure evaporation using U.S. Class A Pan Evaporimeters. Mean annual evaporation figures from 3,000 to 4,000 mm have been measured, with 3,400 mm at Birdsville and 3,100 mm at Longreach (DNR 1998a, b). Using an annual evaporation rate at Moomba of 3,610 mm it was estimated that water bodies such as Coongie Lakes could expect to lose as much as 2,200 to 2,500 mm annually (Ried and Gillen 1988). Studies around Longreach (GHD 1994) estimated that actual evaporation from the surface of open water storages was 75 to 78% of the evaporation measured by a U.S. Class A Pan Evaporimeter. Using a factor of 75% of Pan figures, evaporation loss at Coongie Lakes would be above 2,700 mm. Allan (1988), using 70% to calculate actual evaporation, estimated Coongie Lake would take 7 to 9 months to dry up depending on the time of the year.

Sustainable Grazing in the Channel Country Floodplains (Phase 2)
Page 26 of 158
3.2.7 Flooding
Irregular infrequent flooding Flooding frequency, duration, water speed and depth of inundation differ between land systems. C1 (Cooper) generally floods more frequently, can be deeper and with faster moving water than C3 (Woonabootra) or C2 (Cunnawilla) as it follows the major river channels (Figure 3–2). In contrast, C2 floods the least frequently and for the shortest duration, has the lowest water depth and slowest water speed as it occurs the furthest from major channels, or at higher areas if close to major channels. C3 tends to have an intermittent flooding frequency, with variable water speed and inundation, but tend to have the longest flooding duration, as it occurs as low-lying swamps and depressions. It is worth noting that C1 (Kendall) occurs only in Part V of the WARLUS series, located to the north of Windorah. C1 (Kendall) occurs mainly along the Thomson River. There are no floodplain land systems in WARLUS surveys to the east of Quilpie (Parts III and IV). Floods in arid areas The extensive braided stream systems, overflows, backplains, terminal floodplain lakes, and dunefield swales provide an extraordinary range of environments, from highly ephemeral wetlands through persistent swamps to permanent waterholes, all of which are surrounded by very arid country. Flooding occurs from rainfall in the catchments beyond the area; some flooding occurs virtually every year, but its extent is highly variable. Floods provide the naturally variable pulse that drives biological production on the floodplain, supporting both aquatic plants and animals and the grazing industry (Roberts 1999). Riverine ecosystems are in a dynamic fluctuating equilibrium. All watercourses within the LEB are ephemeral and seasonally and annually variable (DNR 1997). The Cooper, Georgina and Diamantina have two flow systems, a deep narrow anastomosing system operating at moderate flows transporting sand and mud, and an extensive network of braided channels which transports clay-rich mud at high flows (Morton et al. 1995). The extremes of zero flow and flooding are important to the functioning of the system: the drying phases allow nutrient cycling and system productivity, while the flood events maintain important wetland and lake systems as well as floodplain productivity (Young 1999). Flow is the maestro that orchestrates pattern and process in rivers (Walker et al. 1995). Three significant aspects of hydrological behaviour that influence flooding parameters and response (Walker et al. 1995) are: • Flood pulse concept–an increase followed by a decrease in discharge. Each flood pulse
has a complex character with unique patterns of magnitude, timing, duration, rate of rise and fall and frequency. The flood pulse is the driving force for river-floodplain systems and maintains them in dynamic equilibrium (Junk et al. 1989). Pulses are greatly influenced by location of rain and timing and magnitude of merging tributary flows (Young 1999). For large arid zone rivers, the concept, while sound, needs modification for complete applicability (Puckridge et al. 1998b)
• Flow history (previous sequence of pulses) and variability. Antecedent conditions influence how the flood moves through the system and how it is dispersed at the end of the system. Floodplain vegetation condition and the wetness of different parts of the floodplain, including the water level in lakes, are very important (Young 1999).
• Flow regime (long-term generalisation of flow behaviour). Flow drives sediment transport and so shapes the river channel and nutrient status which drives the riverine food webs (Young 1999).
The flooding process is discussed in detail in Chapter 5.

Sustainable Grazing in the Channel Country Floodplains (Phase 2)
Page 27 of 158
3.2.8 Vegetation of the Channel Country
Floodplain pastures Floodplain vegetation is dominated by annual species which respond to ephemeral flooding events within an otherwise arid rainfall pattern. Non-floodplain areas are colloquially known as ‘the outside country’ and dominated by perennial species which are reliant on variable rainfall for establishment, growth and longevity. Floodplain pastures are dominated by shallow-rooted annual herbage and grass species, with some deep-rooted perennial shrub species such as Queensland bluebush (Chenopodium auricomum) and lignum (Muehlenbeckia florulenta). Both localised rainfall and floods influence pasture production on the floodplains. Floods may arise from rainfall in the immediate area (localised floods) or, typically, from rainfall many hundreds of kilometres away. Local rainfall can also increase the growing period of pastures on the floodplains as the floodwaters recede. Channel pastures comprise 5.4 million ha of anastomosing channels, major watercourses (such as the Georgina, Diamantina and Bulloo Rivers and Cooper and Eyre Creeks) and floodout areas in the south west of Queensland (Figures 3 –1 & 3–2). Coolabah (E. Coolabah) and river red gums (E. camaldulensis) are the major trees lining the watercourses, with Queensland bluebush (Chenopodium auricomum) and lignum (Muehlenbeckia florulenta) common in depressions and run-on areas. A number of grasses (such as rat’s tail couch, Sporobolus mitchellii), chenopods (such as burrs, Sclerolaena spp.) and other dicotyledons (such as cow vine, Ipomoea lonchophlla) respond to the irregular flooding along the lower catchment. Cattle growth rates are the best quoted by Weston (1988) for native pasture in Queensland, with an estimated annual average gain of 0.50 kg/head/day, although carrying capacity is relatively low at 40 ha per AE (Adult Equivalent). Channel Country floodplain and river systems are unique in a number of ways, including:
• The high levels of grazing potential within an otherwise arid to semi-arid landscape; • Cooper Creek and the Diamantina and Georgina Rivers’ physical structure of “braided
channels within braided channels” (anastomosing); • The width of the floodplains (e.g. the Cooper is about 65 km wide to the south of
Windorah); • Internally draining (endoreic) into inland wetlands and lakes (e.g. Lake Yamma
Yamma, Coongie Lakes, Lake Hope, Lake Eyre); • Vegetation growth is dominated by annual species dependant on flooding and overland
flow, supplemented by growth of the perennial shrub, Queensland bluebush; and • Extremes of climatic variability (e.g. the timing and extent of rainfall and flood events)
resulting in different seasonal vegetation responses, and necessitating long term monitoring.
The pasture response of these natural irrigation areas can be substantial both in area and amount, and has been utilised by a variety of grazing enterprises for over 130 years. These areas are the backbone on which the breeding and growing-out operations of the large pastoral companies are based and are also important for smaller locally based graziers. Based on anecdotal evidence alone, it appears that there has been minimal impact on the resource base. This may be especially true for the floodplains, which the experienced managers regard as self-regulating, with cattle generally unable to access floodplain pastures until after seed set. This is, however, unsubstantiated scientifically and requires further investigation. Outside country The pastures in the outside country are dominated by deep-rooted perennial grass and perennial browse species, with some other perennial and annual herbage species and include: Mitchell grasslands; spinifex pastures; mulga woodlands; and gidyea woodlands. Pasture production in these areas of the Channel Country is influenced primarily by local rainfall.
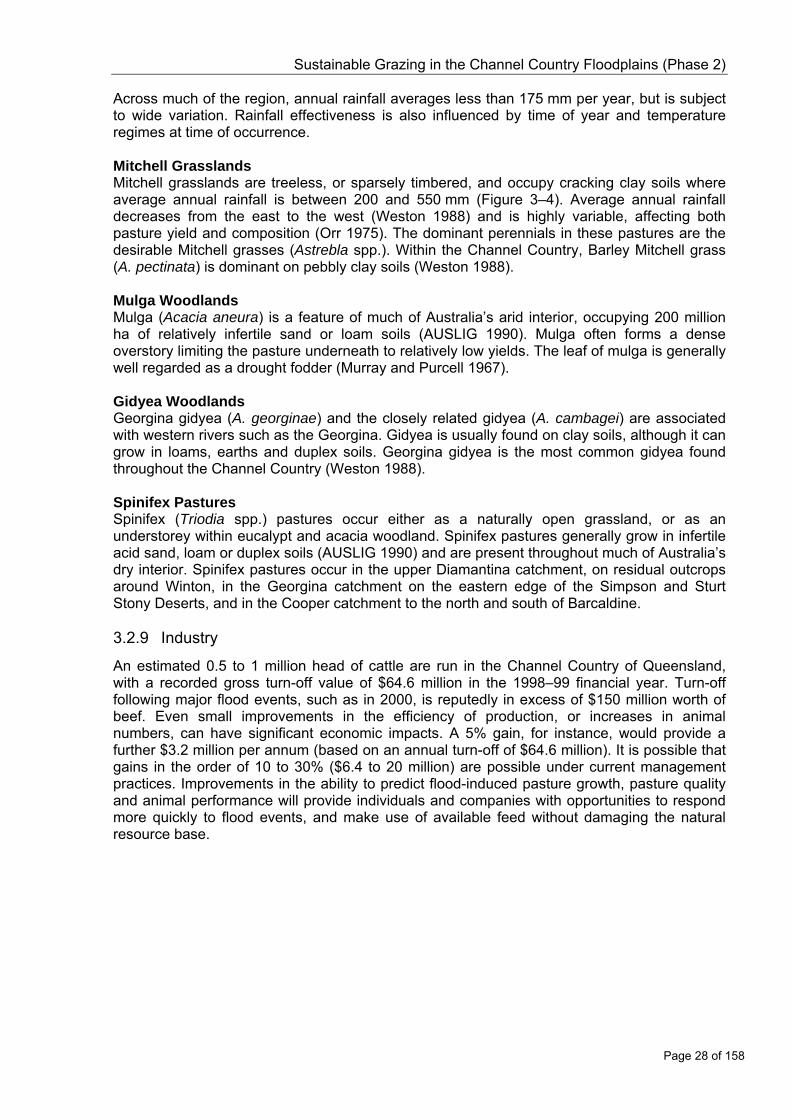
Sustainable Grazing in the Channel Country Floodplains (Phase 2)
Page 28 of 158
Across much of the region, annual rainfall averages less than 175 mm per year, but is subject to wide variation. Rainfall effectiveness is also influenced by time of year and temperature regimes at time of occurrence. Mitchell Grasslands Mitchell grasslands are treeless, or sparsely timbered, and occupy cracking clay soils where average annual rainfall is between 200 and 550 mm (Figure 3–4). Average annual rainfall decreases from the east to the west (Weston 1988) and is highly variable, affecting both pasture yield and composition (Orr 1975). The dominant perennials in these pastures are the desirable Mitchell grasses (Astrebla spp.). Within the Channel Country, Barley Mitchell grass (A. pectinata) is dominant on pebbly clay soils (Weston 1988). Mulga Woodlands Mulga (Acacia aneura) is a feature of much of Australia’s arid interior, occupying 200 million ha of relatively infertile sand or loam soils (AUSLIG 1990). Mulga often forms a dense overstory limiting the pasture underneath to relatively low yields. The leaf of mulga is generally well regarded as a drought fodder (Murray and Purcell 1967). Gidyea Woodlands Georgina gidyea (A. georginae) and the closely related gidyea (A. cambagei) are associated with western rivers such as the Georgina. Gidyea is usually found on clay soils, although it can grow in loams, earths and duplex soils. Georgina gidyea is the most common gidyea found throughout the Channel Country (Weston 1988). Spinifex Pastures Spinifex (Triodia spp.) pastures occur either as a naturally open grassland, or as an understorey within eucalypt and acacia woodland. Spinifex pastures generally grow in infertile acid sand, loam or duplex soils (AUSLIG 1990) and are present throughout much of Australia’s dry interior. Spinifex pastures occur in the upper Diamantina catchment, on residual outcrops around Winton, in the Georgina catchment on the eastern edge of the Simpson and Sturt Stony Deserts, and in the Cooper catchment to the north and south of Barcaldine. 3.2.9 Industry
An estimated 0.5 to 1 million head of cattle are run in the Channel Country of Queensland, with a recorded gross turn-off value of $64.6 million in the 1998–99 financial year. Turn-off following major flood events, such as in 2000, is reputedly in excess of $150 million worth of beef. Even small improvements in the efficiency of production, or increases in animal numbers, can have significant economic impacts. A 5% gain, for instance, would provide a further $3.2 million per annum (based on an annual turn-off of $64.6 million). It is possible that gains in the order of 10 to 30% ($6.4 to 20 million) are possible under current management practices. Improvements in the ability to predict flood-induced pasture growth, pasture quality and animal performance will provide individuals and companies with opportunities to respond more quickly to flood events, and make use of available feed without damaging the natural resource base.
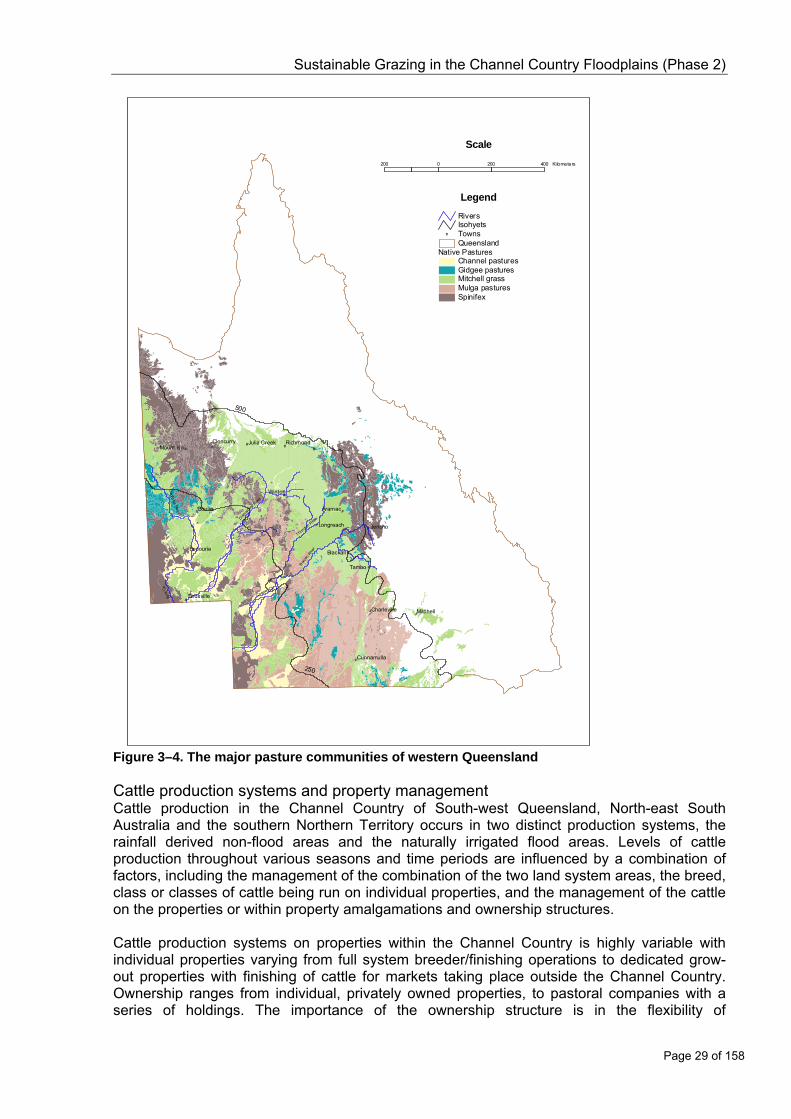
Sustainable Grazing in the Channel Country Floodplains (Phase 2)
Page 29 of 158
## ## #
#
# #
##
# #
#
#
##
#
Tambo
Winton
Boulia Aramac
Jericho
Richmond
BedourieBlackall
Mitchell
CloncurryMount Isa
Longreach
Birdsville
Cunnamulla
Julia Creek
Charleville
500
250
Eyre
Ck
Barcoo
Rive
r
Geo rg ina R ive r
Diaman
tina Rive
r
Thomson Rive
r
Cooper Ck
Native PasturesChannel pasturesGidgee pasturesMitchell grassMulga pasturesSpinifex
Queensland# Towns
IsohyetsRivers
Legend
200 0 200 400 Kilometers
Scale
Figure 3–4. The major pasture communities of western Queensland Cattle production systems and property management Cattle production in the Channel Country of South-west Queensland, North-east South Australia and the southern Northern Territory occurs in two distinct production systems, the rainfall derived non-flood areas and the naturally irrigated flood areas. Levels of cattle production throughout various seasons and time periods are influenced by a combination of factors, including the management of the combination of the two land system areas, the breed, class or classes of cattle being run on individual properties, and the management of the cattle on the properties or within property amalgamations and ownership structures. Cattle production systems on properties within the Channel Country is highly variable with individual properties varying from full system breeder/finishing operations to dedicated grow-out properties with finishing of cattle for markets taking place outside the Channel Country. Ownership ranges from individual, privately owned properties, to pastoral companies with a series of holdings. The importance of the ownership structure is in the flexibility of
Sustainable Grazing in the Channel Country Floodplains (Phase 2)
Page 30 of 158
managers/owners to respond to changes in pasture conditions whilst maintaining production. A significant proportion of the cattle grown out or finished in the Channel Country are brought into the area each year, either as a result of inter-property transfer within companies or through sales. Cattle vary from straight-bred Bos taurus breeds including Shorthorn and Hereford, B. taurus x B. indicus crossbreeds and straight-bred B. indicus (Brahman) breeds. The cross-bred and high content B. indicus cattle tend to be bred outside the Channel Country and moved into the area for finishing, while the B. taurus cattle are primarily bred in the area. 3.3 History of Development
3.3.1 Settlement
“The Cooper country was first settled not many years after Bourke and Wills had travelled through to Innamincka, and Nappamerrie, taken up under ‘The Pastoral Lease Act of 1869’ was the first property to be occupied on the lower Cooper. In the early years the lower Cooper was devoted to sheep raising, the wool taking up to two years to reach the Brisbane market. Then cattle raising followed, and the succeeding history of the Cooper has recorded a series of years of alternating, but irregular, periods of abundance and scarcity according to the incidence of Cooper floods, heavy local rain or drought. The 1901 drought was particularly severe and many land lessees abandoned their properties. The 1925–30 drought was also disastrous. Despite these calamitous years the Channel Country, when flooded, forms a remarkable natural fattening paddock from which some of the finest quality meat in Australia has been produced” (Bureau of Investigation, Introduction, 1947). The Channel Country of Queensland is administered by the Shires of Boulia (administrative centre Boulia), Diamantina (administrative centre Birdsville), Barcoo (administrative centre Jundah) and Bulloo (administrative centre Thargomindah). A small area of Channel Country occurs within the Winton Shire. The combined Shires of Boulia, Diamantina, Barcoo and Bulloo had a population of 1828 persons on 30 June 2001, with a projected decline to 1554 in 2021. Of these, 337 were indigenous Australians. Agriculture employs 463 people (48.5% of the working population) across these shires and grossed $64.6 million in the 1998–99 financial year for livestock (cattle) products and disposals (OESR 2001). These statistics indicate that the population base, and hence the social fabric, of the Channel Country is largely dependent on cattle grazing. Both pastoral companies and private landholders play their role in maintaining this social fabric. For example, AA Co (Australia’s largest landowner with 26 properties, an area of 7.96 million ha, and largest cattle producers with more than 500 000 head) employ over 200 staff throughout Australia. Approximately 250 people are employed in the Channel Country between the three major cattle companies of AA Co, Kidman and NAP Co. In addition to these pastoral companies with large Channel Country interests, Consolidated Pastoral Company, Colonial Agricultural Company, Santos and private individuals and companies employ numerous people within the cattle industry. Companies such as Kidman, NAP Co and AA Co. have a history of implementing Equal Employment Opportunity policies, with aboriginal stockmen and general workers a part of the history, and current practice, of the Channel Country. 3.3.2 Cropping and irrigation in the Channel Country
Cropping is not practised on a commercial scale within the region. Attempts have been made at Lake Yamma Yamma and south of Thargomindah on the alluvial clays but without success (Boyland 1984).

Sustainable Grazing in the Channel Country Floodplains (Phase 2)
Page 31 of 158
In a system such as the Channel Country where water supply is widely fluctuating, the stable water demands of irrigation would cause catastrophic changes to the downstream ecosystem which is intimately adapted to this variability. There can be no guarantee that the hydrological regime of systems like the Cooper can provide a reliable seasonal supply of water, the issue being compounded by the large losses to evaporation of storage facilities (Walker et al. 1997). In 1995, a proposal was made to pump water from Cooper Creek to irrigate cotton at Currareva north of Windorah (DNR 1996). While being unsuccessful, it had some interesting repercussions for the Cooper Creek community and the Channel Country in general. Goodall (1999), in discussing a similar scenario on other western rivers, raised many issues of relevance to the Channel Country, not the least of which was the challenge to the graziers to their very presence and the potential for useful alliances to argue their continued occupation. Ecological considerations, and to a lesser extent sustainable and economic land uses, were the tools used to argue against the potential profits of cotton. The gathering of this ecological data highlighted to the pastoral community the paucity of factual data to support grazing as a sustainable and appropriate use of the Channel Country floodplains. The research project Sustainable Grazing in the Channel Country floodplains (SGCCF) was a consequence of this. Cotton farming and other intensive irrigated horticultural and agricultural uses require large volumes of water in regular and storable amounts at the right time, regardless of the impact on downstream users or the environment (Goodall 1999). If the proposal had been successful the Cooper could have resulted in substantial and unpredictable change. Even without cropping, the control of the current upstream extraction of water is of concern to the downstream users. The potential for large scale water extraction, including the harvest of overland flow, has been limited through recent Queensland legislation (e.g. legislation such as the Water Act 2000 and subordinates Water Regulation 2002; Water Resource (Cooper Creek) Plan 2000 and Water Resource (Georgina and Diamantina) Plan 2004). 4 An active partnership with the grazing community A lack of published information on the management of the Channel Country floodplains, coupled with increasing interest in irrigation from the Cooper and increasing scrutiny from environmental groups (e.g. a proposal to list the entire Lake Eyre Basin for World Heritage listing) lead the beef industry to realise that more objective information was needed to ensure a sustainable cattle industry in the Channel Country (Edmondston 2001; White 2001; Phelps et al. 2003). The project ‘Sustainable Grazing in the Channel Country Floodplains’ (SGCCF) originated from a need identified by the cattle industry, in particular the large pastoral companies. The original project proposal was developed in consultation with Queensland and South Australian Government Departments and community groups and has involved extensive consultation since its inception. 4.1 Project consultation
Consultation with the pastoral companies: Australian Agricultural Co (AA Co), Kidman Holdings (Kidman), the North Australia Pastoral Company (NAP Co), Consolidated Pastoral Company (CPC), Colonial Agriculture (recently purchased by Georgina Pastoral Company), Western Grazing, and the former Stanbroke Pastoral Company (Stanbroke), and with private pastoral managers has been extensive, frequent and ongoing, and has encouraged their continued interest and support. For instance, a semi-structured interview approach was used in the compilation of the industry experience-based book ‘Managing the Channel Country Sustainably. Producers’ Experiences’ (Edmondston 2001), the first in the series of project publications.

Sustainable Grazing in the Channel Country Floodplains (Phase 2)
Page 32 of 158
Pastoral company representatives were involved in defining the project, setting the goals, and deciding on the experimental techniques to be used. On-ground property managers and LandCare managers were involved in selecting suitable locations of experimental study sites, and also involved in conducting site assessments. 4.1.1 The Project Steering Committee
A Steering Committee, comprising representatives of the major grazing companies with Channel Country holdings, private landholders, Lake Eyre Basin Catchment Committee, Desert Channels Queensland, Meat and Livestock Australia and Queensland agency staff, was formed in late 1999, with membership modified as the project has evolved (Table 4–1). The initial role of the committee was to provide practical advice and oversee project direction to ensure industry and community goals were met. The role evolved, however, as the project changed and as trust was built between science and on-ground practice. The Steering Committee were consulted on the type, style and distribution of communication products. They also helped to interpret recent data and to propose reasons for observations (e.g. in relation to possible grazing impacts across exclosure fencelines). The Steering Committee has also been instrumental in maintaining project funding, including a period of direct funding from some of the pastoral companies (AA Co; Kidman; NAP Co; and Stanbroke). The committee met three to four times per year, and were involved in regular informal discussions with the project team throughout the year. The Steering Committee is one of the reasons for the success of the project, and in turn, one of the reasons for the success of the committee is the level of understanding that the project helps committee members to reach. The most critical factor in the success of the committee, however, was the shared vision for sustainable management of the Channel Country through cattle grazing, and the passion held for the area by committee members and the project team alike. A second critical success factor is the trust that was developed through active engagement by both land managers and scientists. The Steering Committee expressed a need for the continuation of research and monitoring in the longer term (a minimum of 10 to 15 years overall) to try and capture the extreme variability encountered through the Channel Country. The main industry issue expressed by the Steering Committee is that sustainable grazed ecosystems are needed in these areas to ensure the longevity of both the unique natural resources and the valuable cattle grazing industry. Both private land holders and pastoral companies have strongly indicated the desire to know if their current grazing practices are sustainable, what practices (if any) need changing to ensure sustainability and how current sustainable practices can be documented and promoted. One of the key issues is the lack of documented evidence, whether scientific or property records, demonstrating sustainable practices, or the need for improvement. Table 4–1. The Sustainable Grazing in the Channel Country Floodplains Steering Committee membership as of January 2006 Representative Organisation & position John Childs Meat & Livestock Australia Program Coordinator, Resource
Management Mike Chuk NRW–Principal Natural Resource Officer Simon Daley Arrabury Beef/Private Anthony Desreaux North Australian Pastoral Company Pty Ltd–Manager, Monkira Station Allan Hubbard Private grazier–Galway Downs Station, Windorah Sandy Kidd Private–owner Mayfield Station, Windorah Leon Lyons Colonial–Manager, Keeroongooloo Station, Windorah Sharon Oldfield Private grazier–Cowarie Station John Rickertt Australian Agricultural Co.–Manager, South Galway Station Robert Teague Consolidated–Manager, Nocatunga Station Derek Trapp S. Kidman & Co.–Manager, Durrie Station, Birdsville

Sustainable Grazing in the Channel Country Floodplains (Phase 2)
Page 33 of 158
Representative Organisation & position Invited observers Delphine Bentley Environmental Officer, North Australian Pastoral Company Pty Ltd Greg Campbell General Manager–S. Kidman & Co. Peter Connelly Project Technical Officer–DPI Charleville Susie Kearns Rangeland Officer–Australian Agricultural Co. Jenny White Rangeland Manager–Australian Agricultural Co. Past committee members/observers
Shane Blakely Meat & Livestock Australia Program Coordinator, Animal Production Ted Callanan Rangelands R&D Officer, Stanbroke Pastoral Company Peter Edmonds Colonial–Manager, Keeroongooloo Station, Windorah Ellena Hannah Rangeland Officer, Australian Agricultural Co. Michael Jeffery Project Beef Scientist, DPI&F Charleville Geoff Kingston North Australian Pastoral Company Pty Ltd Mick Quirk Program Leader (Environmental Management), DPI Brisbane Bill Scott Stanbroke Pastoral Company, General Manager Shaaron Stephenson/Nora Brandii Lake Eyre Basin Coordinating Group representative
Mick Sullivan Senior Scientist (Beef), DPI&F Mt Isa Jack Walker Rangelands R&D Officer, Stanbroke Pastoral Company There is insufficient evidence at present to determine the impacts of grazing within the floodplains, to make recommendations on potential changes to grazing practices. Research to date has highlighted the extreme variability of the channel country, from a major flood during the summer of 2000 through to the drought conditions currently being experienced. This, in turn, has highlighted the continued need for monitoring summer and winter flood events, pasture response time and the subsequent health of the floodplains in relation to cattle grazing. 4.2 Defining relevant flood categories
Consultation with industry has led to four flood types (Good, Handy, Gutter and Channel) being defined (Edmondston 2001). The SGCCF Steering Committee has been instrumental in further refining these categories, and in defining the flooding conditions needed to achieve each type. For instance, flood height data from the Bureau of Meteorology (BoM) has been graphed and discussed at Steering Committee meetings to determine the flood height required to achieve a good, handy, gutter or Channel Flood (Figure 4–1). The BoM categories of Major, Moderate and Minor have been added to, with above-major flood heights needed to achieve a Good flood. Local knowledge of the value of floods in different years has thus been combined with scientific data to reach a new understanding of flood events in the Channel Country. The flood categories are discussed in detail in Chapters 5 and 6. Further to this, more detailed local knowledge has been sought to determine flood behaviour and key knowledge for the Cooper and Diamantina in the form of flooding rules of thumb.

Sustainable Grazing in the Channel Country Floodplains (Phase 2)
Page 34 of 158
Figure 4–1. Hydrograph of stage heights (water levels) required for good, handy, gutter and Channel Floods at Windorah 4.3 Flood rules of thumb – an example of combining local knowledge and
science
Local experience and knowledge has been accessed since the inception of the project ‘Sustainable Grazing in the Channel Country Floodplains’ (SGCCF), for instance through semi-structured interviews in the compilation of the industry experience-based book ‘Managing the Channel Country Sustainably. Producer's Experiences’ (Edmondston 2001), through informal meetings and discussions during field sampling trips and formally through regular Steering Committee meetings. Through consultation, a set of maps capturing producers’ knowledge of flood events and behaviour has been developed recently. This has provided the basis for a set of flood rules of thumb for the Cooper and Diamantina (Appendix 13.2), which has also incorporated previously undocumented Bureau of Meteorology data and the latest published information. The flood rules of thumb started as a concept to capture both scientific knowledge and local knowledge to allow land managers in the Channel Country to better understand and predict flooding processes. The product aimed to enable land managers to interrogate catchment and sub-catchment scale data and information to make local scale, property level predictions. The overall aim of the flood rules of thumb was to increase the lead time, so that management decisions could be instigated proactively in response to expected flooding rather than the reactive, wait and see approach. This product was designed to be a part of a decision support system; it would foretell the type of flood to be expected and the pasture guide would then enable predictions to be made as to likely quality and yield of pastures subsequent to the expected flood type.
Windorah (Cooper)
0.00
1.00
2.00
3.00
4.00
5.00
6.00
7.00
8.00
9.00
Jan-49 Jan-51 Jan-53 Jan-55Jan-57 Jan-59 Jan-61 Jan-63 Jan-65Jan-67Jan-69Jan-71Jan-73Jan-75Jan-77Jan-79Jan-81Jan-83Jan-85Jan-87 Jan-89 Jan-91 Jan-93 Jan-95Jan-97Jan-99Jan-01Jan-03Jan-05
Year
BoM flood ratings
major = 5.0m
no recordings before 14/2/1971
minor = 3.0 m
moderate = 4.0m
Good Flood
Handy Flood
Gutter Flood
Channel Flood < 2.5 m
SGCCF project flood categories
Hei
ght o
f flo
odw
ater
on
gaug
e (m
)
Sustainable Grazing in the Channel Country Floodplains (Phase 2)
Page 35 of 158
The development of the flood rules of thumb product has been an iterative process involving a number of meetings of the Steering Committee and numerous individual consultations with individual members. It has also incorporated Bureau of Meteorology data and the Queensland Department of Natural Resources and Water (NRW) Watershed data sets, GIS data (topographic and satellite imagery) and GIS applications. Initial development began with capturing local expert knowledge and progressed to applying that knowledge to interrogation of flood data. Historical flood and rain data was sourced from the Bureau of Meteorology. The majority of this information was not previously transcribed into electronic format and was provided as photocopies of microfiche film sheets. This was transcribed into electronic format then graphed; where data gaps occurred it was supplemented by NRW Watershed data if available. These graphs were presented to the Steering Committee for discussion of recollections of individual flood events, possible cycles and flood pattern linkages between sites. It became apparent that since spatial relationships occurred, the most suitable format for display of the flood rules of thumb would be in the format of three catchment scale A0 sized map posters. It was agreed that presentation of the information in this format did not create a restrictive ‘list’ of variables for a particular area and that users would be able to interrogate many more variables and decide for themselves which would have the greatest influence on their area of concern. The project Steering Committee reviewed the four flood categories (good; useful/handy; gutter and channel) documented in “Managing the Channel Country Sustainably. Producers’ Experiences”. They recommended that these be adopted as the basis for presenting information. The managers currently use simple guides developed through their own, previous managers’, and neighbours’ experience to predict flood categories. The Steering Committee discussed the range of rules of thumb they use in predicting how large a flood will be, when it will arrive and when it will recede. In general, managers follow the upstream progress of a flood as soon as rains are received. They use a combination of Bureau of Meteorology information sources (web, fax and radio) on rainfall and flood height, as well as upstream properties, to trace the speed the flood is moving at and the rise or fall in water level as it approaches. In some cases, the conditions for a Good Flood on one property differ from those for another (e.g. the eastern and western side of the Cooper). The committee stressed that information needs to be tailored to paddocks within individual properties if it is to be useful. Whilst many of the rules of thumb currently used have been summarised in “Managing the Channel Country Sustainably: Producers’ Experiences” (Edmondston 2001), the publication was not designed to provide property specific details. The publication and Vince’s interview notes need to be supplemented by a new round of information gathering which will build on this available data. Preliminary hydrological mapping was conducted with the Steering Committee to gauge the usefulness of satellite imagery in developing a descriptive model. The approach was especially useful as the imagery allowed neighbours to discuss what flow patterns make a Good Flood within individual paddocks. The committee recommended that all historical Bureau of Meteorology flood records be accessed, stored electronically and then categorised into good, handy, gutter and Channel Floods. Once completed, the committee wish to review the historical flood categories and link these to available satellite images and records (either written or mental) of pasture and cattle condition as a broad means of validating the flood rating system. The clear indication from the Steering Committee is that descriptive hydrological models and flooding benchmarks are needed for on an individual property basis to improve decision
Sustainable Grazing in the Channel Country Floodplains (Phase 2)
Page 36 of 158
making. These may just be written descriptions, but would benefit from incorporating maps to help in interpretation. These models will feed into the development and use of pasture growth tables. 4.4 Feed Budgeting Guides – an example of industry driven management
guidelines
There are two aspects to feed budgeting in the Channel Country: setting the initial cattle numbers, and determining a destocking (or turn-off) schedule. These aspects differ in importance for properties running breeding as opposed to trading style operations. Local knowledge indicates that a major factor in the number of cattle that can be carried, and the length of time that they can be carried for, is primarily dependent on the season (winter or summer) of flooding. Winter floods are able to carry cattle for longer, as pasture quality is held for longer under cool temperatures. A summer flood generally grows a greater bulk of pasture, as it occurs during high temperatures when tropical pastures respond the best. 4.4.1 Setting initial cattle numbers
The potential initial cattle numbers are being assessed as soon as upper catchment rains begin. Generally, the numbers of cattle already on a Channel Country property are insufficient to take advantage of the pasture growth subsequent to a flood. For pastoral companies, additional cattle are sourced from other properties owned by the same company or purchased; for private landholders they are generally purchased. Depending on the size of the flood, as many as 10–15,000 head of cattle may be required which are trucked in on roadtrains, generally over distances in excess of 500 km. The logistics of acquiring and transporting such large numbers of cattle requires careful planning, and any gains in the time available can lead to substantial cost reductions. Cattle numbers are set according to both the amount and quality of pasture available subsequent to flooding. The key determinants of available feed are the area flooded, the season of flooding and the duration of flooding. In general, the longer that flood levels peak, the more the waters are distributed through the floodplains and the greater the area of available feed. Floods of equal depth, but different durations, do not produce the same area of inundation, nor grow the same amount of feed. Initial cattle numbers are dependent on the feed available following a flood and can be based on Grazing Land Management (GLM) education package style pasture growth tables (e.g. Chilcott et al. 2004). The project Steering Committee has clearly indicated that this needs to be done at the paddock level. To achieve this, the area of floodplain is needed for each paddock within individual properties. Properties with existing digital maps have been targeted first, and tables of the areas of floodplains within each paddock are being developed. Properties without existing maps may need to be lent GPS units to catalogue infrastructure so that digital maps may be produced. Preliminary pasture growth tables are being developed for the good, handy, gutter and Channel Flood categories. These will be based on current ‘GRASP’ modelling, which has allowed the development of a standard set of parameters across all sites. This approach has provided reasonable historical estimations of pasture growth but, in the absence of further significant flooding, remains untested in its predictive capacity. It is recognised that scientifically more pasture and soil moisture data is needed to refine the ‘GRASP’ model for each site. However, it is not yet clear how precise the output used for the pasture growth tables needs to be. This will become apparent once the tables are developed and start to be tested by key co-operators.

Sustainable Grazing in the Channel Country Floodplains (Phase 2)
Page 37 of 158
Queensland bluebush browse needs to be incorporated into pasture growth tables. So far, there have been difficulties in estimating these levels in the field and through modelling. A field based browse estimation study was recently conducted to address this issue. Preliminary data suggest that existing techniques (e.g. the Adelaide technique) can be used, and that it may be possible to develop photo standards as the basis for managers to estimate available browse. Bluebush browse can now be accurately estimated for all 17 sampling sites, and used to further refine ‘GRASP’ modelling. The Steering Committee recommended that separate winter and summer pasture growth tables be produced. To date a winter flood has not been recorded, but estimations of the bulk of feed produced relative to a summer flood may be possible through expert local knowledge (e.g. comparative cattle numbers). 4.4.2 Destocking Schedules
The timing of flooding seems to be most important for determining a destocking schedule, as it relates to feed quality and cattle growth rates. For instance, winter floods are able to carry cattle longer than summer floods, even though summer floods may grow more bulk. Early summer floods carry the risk of hot winds ‘burning’ the feed off more rapidly than a mid-summer flood. A preliminary destocking schedule has been produced through discussions with John Rickertt and endorsed by the Steering Committee. As with the hydrology modelling and pasture growth tables, the committee has recommended that schedules be tailored for individual properties and paddocks. This will be done in conjunction with flood mapping exercises. The variation between properties is likely to be small and dependent on differences in flood plain type and areas within individual paddocks. It should also be noted that pasture composition is an important determinant of both the initial cattle numbers and the destocking schedule. A pasture dominated by peabush as opposed to native sorghum will not carry the same number of cattle. A pasture dominated by cow vine might carry high numbers initially, but will rapidly deteriorate with hot winds or high insect numbers. The Steering Committee have indicated that it is not possible to predict pasture composition. However a recent PhD thesis from Griffith University (Flow variability and vegetation dynamics in a large arid floodplain: Cooper Creek, Australia by Samantha Capon, 2003) suggests that seed germination studies may assist in predicting which species are likely to germinate following different flood events. For instance, native sorghum germinates within the floodwaters, and requires at least 7 days inundation. This aspect is not currently being pursued within the project but may require future attention. The relationship between initial cattle numbers, destocking schedules and season of flooding as described by the Steering Committee has been stylised and presented as Figure 4–2.

Sustainable Grazing in the Channel Country Floodplains (Phase 2)
Page 38 of 158
0
10
20
30
40
50
60
70
80
90
100
Decem
ber
Janu
ary
Februa
ryMarc
hApri
lMay
June Ju
ly
Augus
t
Septem
ber
Octobe
r
Novem
ber
Decem
ber
Janu
ary
Februa
ryMarc
hApri
l
month of the year
% o
f max
imum
cat
tle n
umbe
rss
Summer flooding Winter flooding
Summer (January) floodWinter (April) flood
Figure 4–2. Cattle stocking response on the floodplains (as a percentage of the potential cattle numbers) following the first Good Flood after drought & destocked conditions, but with no follow-up flooding or rain. In reality dates and stock numbers would vary from this; it is presented as a simple model to demonstrate that restocking takes time and that destocking occurs in stages 4.5 Timing of information delivery
The ability to move cattle quickly off the floodplains as a flood approaches is an important management decision indicated by the Steering Committee and key individuals (e.g. Greg Campbell–Kidman, Jenny White–AACo and Delphine Bentley–NAPCO). The timing of this information is critical, for instance upstream flood levels are needed within 2–3 days to estimate a flood’s progress and speed. However, not all paddocks are destocked, as some have enough high country (e.g. sand dunes) to afford shelter. Potential cattle numbers are being estimated as soon as a flood starts, especially by the experienced mangers. Actual cattle numbers are generally determined during the peak of the flood. Information to help decide cattle numbers and restocking dates would greatly enhance operational planning, especially within the larger companies. The committee have indicated that information provided during a flood needs to be timely (within 2–3 days) and brief (a half page report at most). Detailed information (e.g. pasture nutrient levels) could wait until later, when there is time to reflect on its meaning. 4.6 Combining science and local knowledge through a continuous learning
cycle
The conduct of research in conjunction with on-going discussion and feedback from the project Steering Committee has lead to the development of a continuous improvement cycle. This cycle applies to both the research within the project, and to Steering Committee members’ on-ground management. For instance, the latest publications have been written in consultation with industry, taking into account the type and timing of stocking decisions that are made in the Channel Country in relation to flooding. Research inputs of pasture sampling and modelling, soil and flood sampling have been coupled with local knowledge in compiling the documents,

Sustainable Grazing in the Channel Country Floodplains (Phase 2)
Page 39 of 158
to ensure scientific rigour and local relevance. For instance, pasture growth tables (see Chapter 7) allow for improved planning, but the forage guide acts as the check when actual stocking and destocking decisions are being made. The major training tool for delivery of these guides will be the EDGENetwork™ Grazing Land Management package customised for the Channel Country. Overall, the process is part of an on-going improvement cycle, designed to achieve sustainable grazing in the Channel Country floodplains. The improvement cycle has been unique in the closeness of the relationship between graziers and scientists, and has assured that both on-ground management and scientific query have improved. These processes are summarised in Figure 4–3.

Sustainable Grazing in the Channel Country Floodplains (Phase 2)
Page 40 of 158
Figure 4–3. Summary of the project inputs (e.g. data and local knowledge), tools produced and delivery mechanisms to ensure sustainable grazing in the Channel Country floodplains based on a continuous improvement cycle
Goal:
TO ACHIEVE SUSTAINABLE
GRAZING IN THE CHANNEL
COUNTRY FLOODPLAINS
Grazing Cycle
Inputs
Tools (Outputs)
GLM (Delivery)
Outcomes
Improvement Cycle
Restocking Destocking
Tools Leading to Outcomes
Good Pastures, Good Cattle
Monitor Review Plan Implement
Photographs
Plant Nutrient Data
Pasture Growth Tables (for paddocks)
Flood Rules of Thumb
of flood events with descriptions
Feed Budgeting & Restocking Guide
Photo Guides of Yield & Quality Booklets Main Pasture Types
Destocking Guide
Post Flood Condition Guide e.g. Follow-up rain = longer stocking
Flood Heights
Local Knowledge What is a good Flood?
Satellite Images
GRASP Modelling
BOTANAL Transects
Photo Guides
GRASP Modelling Pasture growth within
flood categories Property Maps

Sustainable Grazing in the Channel Country Floodplains (Phase 2)
Page 41 of 158
5 A review of flood processes in the Channel Country 5.1 Overview of flooding in the Channel Country
The flooding patterns, and subsequent vegetation responses, of the Channel Country are some of the most unpredictable in the world (Kingsford 2006). There are many landscape and local processes that act as modifiers that may increase or decrease the production benefits derived from subsequent pasture growth. The aim of seeking knowledge of the dynamics of flooding processes in the Channel Country is to make inferences in relation to how big the floods will be and to what spatial extent the landscape will be flooded. The river systems are primarily flat. For instance, the Georgina River and Cooper Creek systems have an average gradient of less than 19 cm/km for 90% of their length. The Diamantina River system has a gradient of less than 25 cm/km in the upper section of lateritic, red iron oxide soils, and flattens out at Brighton Downs Station about 740 km upstream from Lake Eyre. All three catchments enter a zone of floodplains corresponding generally to the 250 mm rainfall isohyet. 5.1.1 General processes in the Cooper
The upper catchment of the Cooper drains an area of approximately 155,400 km2 above Windorah and has an annual average rainfall of 430 mm, with approximately 90% of the area receiving more than 380 mm annual rainfall. Below Windorah the floodplain spreads out to a maximum width of 65 km and continues southerly for a distance of approximately 320 km. The Cooper then turns abruptly to the west to enter South Australia through a valley approximately 800 m wide and 15 m deep cut through the lateritic strata. Below Windorah the catchment area is 77,700 km2 of which 1,416,000 ha are floodplains. With the exception of some 81,000 ha of sand hills, the whole of the floodplain is fertile soil that is occasionally inundated by Cooper floodwaters. Within the floodplains there are several low-lying areas, ranging between 8,000 and 12,000 ha in area that are frequently flooded and consequently are of a greater pasture value than that of the plains. Two extensive areas, Lake Yamma Yamma and Barrioola Swamp, are probably of greater pasture value than any other areas of equivalent size on the three western river systems (Georgina, Diamantina & Cooper). After entering South Australia, the Cooper floodplains spread further and because of the extent and complexity, are difficult to determine the extent of the inundated areas. Only floods which are higher than average at Windorah overflow the banks of the sixty-mile channel from Innamincka to Coongie Lakes. Whilst the Cooper is substantially the most important of the three Channel Country rivers, for small and medium floods it is of little use to South Australia and consequently Lake Eyre. 5.1.2 General processes in the Diamantina
The upper catchment of the Diamantina drains an area of 58,200 km2 above Diamantina Gates, an area where the river is funnelled between the Guyder and Hamilton Ranges. A large proportion of the upper catchment is lateritic top-rock with rapid runoff. Therefore even though less than half of the upper catchment is above the 380 mm isohyet, it is thought that the river has comparatively frequent small floods. The 1,214,00 ha of floodplains in the Diamantina are slightly smaller in area than that of the Cooper and the outer areas of the floodplains are flooded less frequently. Two areas in particular on the Diamantina that are of great pastoral significance are the Durrie Plain in Queensland and Goyder’s Plain in South Australia which receive benefit from almost any floods, whatever the size. The Durrie Plain is on a bend in the river similar to Barrioola Swamp on the Cooper. As with

Sustainable Grazing in the Channel Country Floodplains (Phase 2)
Page 42 of 158
Coongie Lakes on the Cooper, Goyder’s Lagoon is usually the terminus of floods but is far more valuable to production than Coongie Lakes. Farrar’s Creek is an important tributary of the Diamantina, and also has substantial floodplain areas. It is difficult to delineate the areas of flood plain on Farrar’s Creek as there are areas of active or recently occurring sand hills. Although of less importance than the Cooper, the Diamantina is of significant importance to the South Australian pastoral industry as it runs more frequently with almost insignificant runs reaching the Goyder Plain and spreading out with exceptional efficiency. 5.1.3 General processes in the Georgina
The complex upper catchments of the Georgina drain an area of about 158,000 km2 and consist of an area of less than 250 mm of average annual rain. It is comprised of: the Jervois Range district in the Northern Territory; a central limestone area; some tributaries in the Cloncurry series; and the Hamilton which drains a portion of the artesian basin that is similar to the head of the Cooper. With the whole of the Georgina catchment below the 250 mm rainfall isohyet, it receives considerably less mean annual rainfall than the Diamantina or Cooper catchments. The Georgina is mostly reliant on the monsoonal rains of the Barkly Tablelands some 650 km from the main floodplains. The Georgina floodplains of some 728,000 ha begin near the breakaway at the junction of the river with the Hamilton River (King Creek) with extensive floodplains east and south-east of Bedourie (Lake Whitehouse) where King Creek rejoins the river. Two areas of exceptional pastoral significance that are analogous to those of the Cooper and the Diamantina are Lake Machattie at the bend in the river (about 50 km south-east of Bedourie) and Muncoonie Lakes (about 150 km downstream, west south-west) which is the terminus of most floods. The 25 m high Muncoonie Sandhill cuts off the old channel of the Georgina at the confluence of the Mulligan River and force the river to fill a series of lakes before it can join the Mulligan. It is only on rare occasions that floods are large enough to fill Muncoonie Lakes and therefore South Australia rarely derives any benefit from the Georgina. 5.2 The flooding process
Generalised floods begin with rainfall in the upper semi-arid catchment, where average annual rainfall is greater than the arid mid and lower reaches. For instance Tambo, in the upper reaches of the Cooper, has a mean annual rainfall of 531 mm whilst Windorah, in the mid reaches of the Cooper, has a mean annual rainfall of 293 mm and Birdsville, in the lower reaches of the Diamantina has a mean annual rainfall of 165 mm (Figure 5–1). Flooding can occur in the absence of any rainfall in the mid or lower reaches. Rainfall throughout the basin is summer (October–March) dominant leading to a summer dominated flood pattern. Less frequently with the lag periods between rainfalls in the upper reach and floods occurring in the lower reaches, periodic floods may occur in winter. In contrast with the declining rainfall, evaporation rates are generally higher to the west and downstream. The mean annual pan evaporation at Tambo is 2665 mm, at Windorah 3322 mm and at Birdsville 3468 mm. Camooweal, even though in the upper catch of the Georgina, has a high pan evaporation rate of 3650 mm due to its westerly location. Not surprisingly, evaporation is the major source of floodwater loss (Knighton and Nanson 1994).

Sustainable Grazing in the Channel Country Floodplains (Phase 2)
Page 43 of 158
Localised floods originate from summer storm activity over smaller catchment areas, where creeks and rivers tend to ephemeral and flashy. These events are highly unpredictable, but can contribute substantially to generalised flooding, should the events correspond.
a) Camooweal MAR = 394 +/- 173 mm
-500
-400
-300
-200
-100
0
100
200
Jan Feb Mar Apr May Jun Jul Aug Sep Oct Nov Dec
Evap
orat
ion
loss
(mm
)
Rai
nfal
l (m
m)
Mean annual evaporation = 3650 mm
b) Winton MAR = 411 +/- 201 mm
-450
-350
-250
-150
-50
50
150
Jan Feb Mar Apr May Jun Jul Aug Sep Oct Nov Dec
Evap
orat
ion
loss
(mm
)
Rain
fall
(mm
)
Mean annual evaporation = 3322 mm
c) Hughenden MAR = 487 +/- 201 mm
-380
-330
-280
-230
-180
-130
-80
-30
20
70
120
Jan Feb Mar Apr May Jun Jul Aug Sep Oct Nov Dec
Evap
orat
ion
loss
(mm
)
Rai
nfal
l (m
m)
Mean annual evaporation = 2884 mm
d) Tambo MAR = 531 +/- 195 mm
-400
-350
-300
-250
-200
-150
-100
-50
0
50
100
Jan Feb Mar Apr May Jun Jul Aug Sep Oct Nov Dec
Evap
orat
ion
loss
(mm
)
Rai
nfal
l (m
m)
Mean annual evaporation = 2665 mm
e) Birdsville MAR = 165 +/- 109
-550
-450
-350
-250
-150
-50
50
Jan Feb Mar Apr May Jun Jul Aug Sep Oct Nov Dec
Evap
orat
ion
loss
(mm
)
Rain
fall
(mm
)
Mean annual evaporation = 3468 mm
f) Windorah MAR = 293+/- 157 mm
-600
-500
-400
-300
-200
-100
0
100
Jan Feb Mar Apr May Jun Jul Aug Sep Oct Nov Dec
Evap
orat
ion
loss
(mm
)
Rain
fall
(mm
)
Mean annual evaporation = 3322 mm
Figure 5–1. Monthly distribution (mm/month) for average rainfall and pan evaporation rates for selected upper catchments at a) Camooweal (Georgina) b) Winton (Diamantina) c) Hughenden (Cooper) d) Tambo (Cooper) and mid to lower catchments at e) Birdsville (Diamantina)and f) Windorah (Cooper) climate stations. MAR is Mean Annual Rainfall (Clewett et al. 2003) Water source and colour Floodwater in the Channel Country has a naturally high sediment load, as fine particles are washed from clay soils of the upper catchment (Gibling et al. 1998). These fine particles are suspended in the floodwaters, and give a ‘milky’ look to the water as they are derived from predominantly grey-clay soils. Some catchments, such as that of the Mayne River, are dominated by hard setting red soils. In these instances the suspended particles tend to be larger and of red colour, hence the floodwaters tend to flow red in colour. Graziers often use the colour of the floodwater as a useful guide to the origin of the water. In some cases there are reports of two or three separately coloured streams within a flood, with the origin of each stream apparent from its colour.
Sustainable Grazing in the Channel Country Floodplains (Phase 2)
Page 44 of 158
5.3 Floodplain features
Lakes, claypans, swamps and waterholes Whilst Lake Eyre is the largest of the ephemeral lakes, it is not the only major lake. Lakes Buchannan and Galilee are major salt lakes perched at the top of the Great Dividing Range in the upper catchment of the Cooper (to the north-east of Longreach), with waters only rarely overflowing and contributing to the Cooper. Lake Yamma Yamma is a major lake on the Cooper, covering almost 90,000 ha, but it does not have a salt lake bed. Other major lakes are so ephemeral or shallow as to be considered claypans (e.g. Bilpa Morea claypan), some form linked wetlands (e.g. the Coongie Lakes system) and others have gypsum, rather than salt, lake beds (e.g. Lake Hope). There are also major ephemeral swamps, such as the King Creek floodout in the Georgina system, within the floodplains. These swamps usually have clay soils and intricate networks of shallow channels which slowly distribute the floodwaters further into the swamps. Waterholes have generally formed within recent channels through scouring, although some may be present in more ancient channel beds. Waterholes represent the size that channels would be if water flow was faster, and if flooding events occurred more frequently. Lakes, claypans, swamps and waterholes store floodwaters and provide an important source of water for fish, birds and cattle during dry times. However, they also reduce the amount of floodwater available downstream (Knighton and Nanson 1994 b). Floodwater distribution and watercourses Three broad levels of watercourse exist within the floodplains of the Cooper, Diamantina and Georgina: anabranching channels; shallow gutters and floodways. All three levels in combination give an aerial impression of the floodplains looking like a fisherman’s net, with fine braids hanging from thicker cords. The term ‘anastomosing’ comes from this appearance (Fagan and Nanson 2004). The watercourses cut through the floodplain clay soils and form an active channel zone. A second, un-channelled zone exists in the floodplain where floodwaters rarely reach. During moderate to large floods, the impression is given that water is being pushed uphill through the complex networks of gutters. The initial impression of gutters is that they are the headwaters of small streams, carrying local rains back down into the river system. The main role that gutters perform, however, is to carry floodwaters away from the main river system into the floodplain. Floodwater distribution and spread within these anastomosing systems is complex. It is rare for the full length of the rivers to be flooded at any one time. Instead, a flood travels as a pulse of water which may be one third to one-half the length of the system (approximately 300–500 km). The floodwater is initially contained within the major channels but progressively spills out into gutters, floodways and–should the flood be large enough–across the entire floodplain. As the flood pulse recedes, waterholes are left full, pasture begins to grow and the floodplains begin to dry out once again. Swamps within the floodplains can still be filling for days or weeks after the main flood pulse has receded downstream, and lakes which have filled during the flood pulse often drain back into the main channels as water levels drop. The speed at which subsequent drying of the soil occurs depends on the evaporation rates at the time the flood recedes–floods which arrive in early summer quickly dry out, whilst water from infrequent winter floods can sit in shallow depressions for weeks or months. When a second flood pulse arrives before the soil has dried and before water bodies have evaporated from the first pulse, the area it spreads into is generally enhanced.

Sustainable Grazing in the Channel Country Floodplains (Phase 2)
Page 45 of 158
Floodwaters are distributed differently according to stream stage (water level or volume) through three broad levels. In general, the water flows down the anabranching channels up to bankfull stage, pushes out into smaller channels known as gutters at flood stage and then forms sheets of floodwater displaying Hortonian overland flow, through floodways at over-bank stage (Plate 5–1). Water velocity is always low, but is highest within the channels, followed by that within the gutters, and slowest within the floodways.
Plate 5–1. The ultimate Hortonian overland flow: the Diamantina River between Brighton Downs and Diamantina Lakes National Park during a moderate flood forms a sheet of water nearly 20 km wide. Photograph courtesy of Bob and Linda Young Creeks and rivers feeding the major rivers are generally ephemeral and flashy as they are dependent on rainfall local storms within arid areas. The volume of floodwater from these tributaries depends on their catchment area and whether clay, sand or rock dominates the catchment. The benefit derived from flooding is primarily dependent upon the timing in relation to flooding in the main river system. 5.4 Anabranching channels and bankfull stage processes
Anabranching channels range between 10 and 125 m in width (Fagan and Nanson 2004) and are generally 3 to 5 m deep (Gibling et al. 1998). They are inset into the floodplain surface and are the only streams to carry water during low volume floods. They also carry water during medium and high volume floods, but with lesser importance once the floodwaters reach over-bank stage. They are comprised of major (primary), moderate (secondary) and minor (tertiary) sized channels which carry the floodwaters downstream. Primary channels are lined by shrubs (especially lignum) and large trees–Coolabahs where clay soils predominate, river red gums where there is a sandy bottom or shelf and Melaleucas in other areas. There are usually one to four long, relatively straight primary channels in any reach (Knighton and Nanson 1994b) which carry water in the same way as any other creek or river system (Plate 5–2). However, some primary channel segments display high sinuosity and meandering patterns which may reflect earlier palaeochannel forms.
Sustainable Grazing in the Channel Country Floodplains (Phase 2)
Page 46 of 158
Secondary channels are narrower and shallower than primary channels. They are generally lined with lignum and smaller Coolabahs or small Acacia spp. trees, usually have relatively straight segments and show a continuous connection with other channels (Plate 5–3). Tertiary channels are shallower than secondary channels, but may be of equal width. They are generally lined with lignum and scattered small Coolabahs and usually have relatively straight segments. However, tertiary channels may not be directly connected to primary or secondary channels, and appear as isolated segments within the floodplains (Gibling et al. 1998). Anabranching channels are formed through scouring out where the floodwaters have the greatest velocity and energy. The channels flow between low levees and higher un-channelled islands which have formed from sediment deposition, and between sand dunes which have formed from wind borne sand particles (Gibling et al. 1998). In-channel waterholes have formed at points of water concentration, such as channel junctions or at sand dunes, from scouring during floods (Knighton and Nanson 2000). Waterholes range in length from 100 m to 22 km and between 20 and 240 m in width (Knighton and Nanson 1994a) and are mostly relatively straight, the few highly sinuous ones (e.g. Eulbertie Waterhole) may follow deep palaeochannels from 100,000–300,000 years ago. The waterholes serve to concentrate and redistribute the floodwaters into other channels. New anabranches generally arise at obtuse angles at the downstream end of waterholes (Knighton and Nanson 1994b). Anabranching channels represent an active channel zone–where water flow is the strongest and erosion rates are the highest. As a result, the active channel zone is colloquially referred to as ‘current swept’ (John Rickertt, pers. comm. 2005). This zone equates to the Cooper (C1) Land System (Chapter 3). The rate of stage (the height of the water on a flood gauge) rise is important in erosion and delivering sediment: faster stage rises tend to scour out channels, leading to localised erosion and sedimentation into splays and braid bars. Slower stage rises tend to result in greater sedimentation–both top–dressing the pasture and filling in waterholes. The anabranching channels are like arteries within the river systems–they carry water downstream through the floodplains and also into the outlying floodplains and swamps but do not distribute water across the skin of the floodplain.

Sustainable Grazing in the Channel Country Floodplains (Phase 2)
Page 47 of 158
Plate 5–2. A flooded primary anabranching channel in the Thomson River at Longreach in the upper reaches of the Cooper. Note the Coolabah trees lining the channel are partially submerged at the overbank stage
Plate 5–3. Secondary anabranching channels carrying water away from the primary channel zone in Cooper Creek near Windorah. Water is then being further distributed through swamp gutters at the flood stage 5.5 Gutters and flood stage processes
Gutters are usually wide (1.8–32 m), shallow (0.1–0.9 m) channels that have formed where floodwaters flow with reduced velocity, and hence have less energy to scour out channels and waterholes (Fagan and Nanson 2004). Gutters generally do not carry water during low volume floods, only becoming active once flood or overbank stage has been achieved during medium and high volume floods. Gutters are present in a complex array of sizes, shapes and functions; as with anabranching channels, primary, secondary and tertiary gutters can be recognised

Sustainable Grazing in the Channel Country Floodplains (Phase 2)
Page 48 of 158
according to size. However, gutters perform three hydrologic roles and can be classified as channel gutters, braid gutters and swamp gutters (reticulate channels). Gutters occur in the Cooper (C1), Woonabootra (C3) and Cunnawilla (C2) land systems. Since gutters are shallower than channels, they do not hold water for as long and hence do not support Coolabah trees. They generally grow small, scattered Acacia spp. trees, bluebush or lignum shrubs, perennial sedges (such as spiny flat sedge) or perennial grasses (such as rat’s tail couch). The shallowest tertiary gutters generally do not support perennial vegetation. Channel gutters are short and split off at (almost) right-angels to primary and secondary anabranching channels. They may serve as a pressure valve in the banks of the channels, redistributing floodwaters short distances out from the channels. They generally flow into (and hence) connect tertiary channels during flooding and may represent poorly developed segments of tertiary channels which are possibly still actively forming. Channel gutters lie within the active channel zone, and are contained within the Cooper (C1) Land System. Braid gutters (braided channels) are 3.5–32 m wide and 0.07–0.90 m deep (Fagan and Nanson 2004), are generally lined with lignum and bluebush shrubs and tend to be oriented downstream (Plate 5–4). They carry water between higher locations (levees, braid bars and splays) closer or adjacent to, anabranching channels and cover 44% of the floodplain surface. The majority of braid gutters lie within the non-active channel zone (Fagan and Nanson 2004) within the Woonabootra (C3) Land System. Swamp gutters (reticulate channels) are between 1.8–8.5 m wide and 0.12–0.63 m deep (Fagan and Nanson 2004), are generally lined with lignum or bluebush shrubs and tend to be oriented towards the centre of depressions and swamps. Swamp gutters have formed from floodwaters pushing around the uneven clay soil surfaces (with gilgais) and following natural depressions and cracks. As a result, there is a prevalence of nearly right angled confluences and bifurcations with an extremely high drainage density (Plate 5–5). The gilgais have formed through the process of the clay soils cracking and heaving during drying and wetting cycles (Fagan and Nanson 2004). Swamp gutters redistribute water through lower-lying swamps and large depressions and are usually located well away from the active channel zone. The majority of swamp gutters lie within the non-active channel zone and cover about 40% of the floodplain surface (Fagan and Nanson 2004). They are located entirely within the Woonabootra (C3) Land System. The gutters are like capillaries within the river systems–distributing water to the outlying skin of the system, where evaporation losses are high, but possibly cooling like the cooling effect of sweating. 5.6 Floodways and overbank stage processes
Floodways are broad zones that the majority of the floodwaters flow down once overbank stage has been reached during high volume floods. The majority of floodways contain tertiary channels and braid gutters and their banks are defined by levees and braid bars. Floodways appear to cut across anabranching channels, leading earlier researchers to (erroneously) speculate that they represented older river channels which had become filled in by sediment (Nanson et al. 1986). Under the highest flood stages, floodways include poorly defined, or even undefined, depressions and represent the natural flow of water across higher areas (e.g. across higher, un-channelled, levees) and back towards the channel and gutter systems (Knighton and Nason 1994).

Sustainable Grazing in the Channel Country Floodplains (Phase 2)
Page 49 of 158
Plate 5–4. Braided gutters within the green zone
Plate 5–5. Swamp gutters redistributing floodwater at flood stage. The unnaturally straight line to the right is a fence line

Sustainable Grazing in the Channel Country Floodplains (Phase 2)
Page 50 of 158
Plate 5–6. Floodways carry water during overbank stage, with floodwater flow cutting across anabranching channels as the water assumes a more direct downstream flow path Floodways (Plate 5–6) are present in unchannelled areas of both the active and non-active channel zones, and hence can be within the Cooper (C1) or Woonabootra (C3) land systems. The major non-channelled area is the Cunnawilla (C2) Land System which occurs most distant from the active channel zone. Within the active channel zone, the flow of floodwaters into the floodways is often initiated within channel gutters, but floodways may also result from overland flow. Floodways may change from flood to flood depending on features that direct water flow, such as stockpads (livestock trails), vegetation or high levels of ground litter. 5.7 Flood types
5.7.1 Primary flood types
The most important aspect of flooding for cattle production is the total area flooded, and the quality of the resultant pasture. The greater the extent of flooding, the more forage that is available to cattle, and the higher the number of cattle that can be safely grazed following flooding. The higher the quality of the pasture, the better these cattle will grow and meet market specifications. Ecologically, the amount of carbon and nitrogen produced by algae and available to primary consumers at the start of the food chain (Bunn et al. 2003) is probably related to the extent of flooding. The appearance of rings of algae around receding water is colloquially known to graziers as ‘bath tub rings’. The Bureau of Meteorology define three flood types within Australia (Major, Moderate and Minor), which serve as a flood warning system and as a framework to report on damage caused by flooding (BoM 1997). The BoM flood types are: • Major Flooding: causes inundation of large areas, isolating towns and cities. Major
disruptions occur to road and rail links. Evacuation of many houses and business premises may be required. In rural areas widespread flooding of farmland is likely.
• Moderate Flooding: causes the inundation of low-lying areas requiring the removal of stock and/or the evacuation of some houses. Main traffic bridges may be closed by floodwaters.
Sustainable Grazing in the Channel Country Floodplains (Phase 2)
Page 51 of 158
• Minor Flooding: causes inconvenience such as closing of minor roads and the submergence of low level bridges and makes the removal of pumps located adjacent to the river necessary.
The amount of rainfall required to produce minor, moderate or major flooding in the Cooper Creek system has been estimated as (BoM 1997): • Major flooding: requires a large scale rainfall situation over the Thomson and Barcoo Rivers
and Cooper Creek catchment. More specifically, general 100 mm or heavier falls in 24 hours over a wide area will most likely cause major flooding particularly in the middle to lower reaches of the Thomson and Barcoo Rivers extending downstream to Windorah on Cooper Creek.
• Moderate flooding: requires 75 mm in 24 hours over isolated areas, with lesser rains of 50 mm over more extensive areas plus lesser rainfalls recorded in the previous 24 to 72 hours, with the possibility of major flooding.
• Minor flooding: 75 mm in 24 hours over isolated areas, with lesser rains of 50 mm over more extensive areas will cause stream rises and the possibility of minor flooding. Isolated flooding will be caused by falls of 100 mm in 24 hours in the immediate area of the heavy rain.
The BoM flood type system is useful for their stated purpose, but does not necessarily reflect the levels of flooding that are of benefit to the floodplains of the Channel Country. Four flood categories are generally used by cattle producers within the Channel Country (Good, Handy, Gutter and Channel), based on the beneficial effects of the flood for cattle production (Edmondston 2001). In general the best floods spread out as far as possible across the floodplain, thus naturally irrigating as much country as possible. The best floods also stay up for an extended duration, thus allowing the floodwaters to penetrate as deeply as possible into the soil profile and acting as a moisture source for an extended period of pasture growth. The flood types for the Channel Country have been redefined (Edmondston 2001) to reinforce the benefits of floods as natural irrigation events and to better define the flood heights and behaviour that lead to optimising beneficial flooding (Table 5–1). These are: • Good–Good floods occur when the water escapes from the gutters, connecting up to form
large sheets of water inundating more than 80% of the floodplain. There is a large pasture response from these floods, but the extent to which the feed lasts is determined by the time of year (heat) and how long the soils remain covered by floodwater (determining the moisture penetration in the soil); 85–100% of a property’s potential number of cattle can be carried.
• Handy (or average)–Handy floods are similar to Good Floods, but cover a lower proportion of the floodplain (50–60%) with water at varying depths; 45–85% of a property’s potential number of cattle can be carried.
• Gutter–Gutter floods occur when the water escapes from the main channels and spills over to the many small waterways (gutters) that flow from the main channels. These floods promote growth of a good body of herbage and grasses along the braid gutters; 5–25% of a property’s potential number of cattle can be carried.
• Channel–Channel Floods occur when the main channels run but water does not escape to the surrounding floodplain. Pasture growth is limited to the main channel and channel gutter margins; 5–15% of a property’s potential number of cattle can be carried.
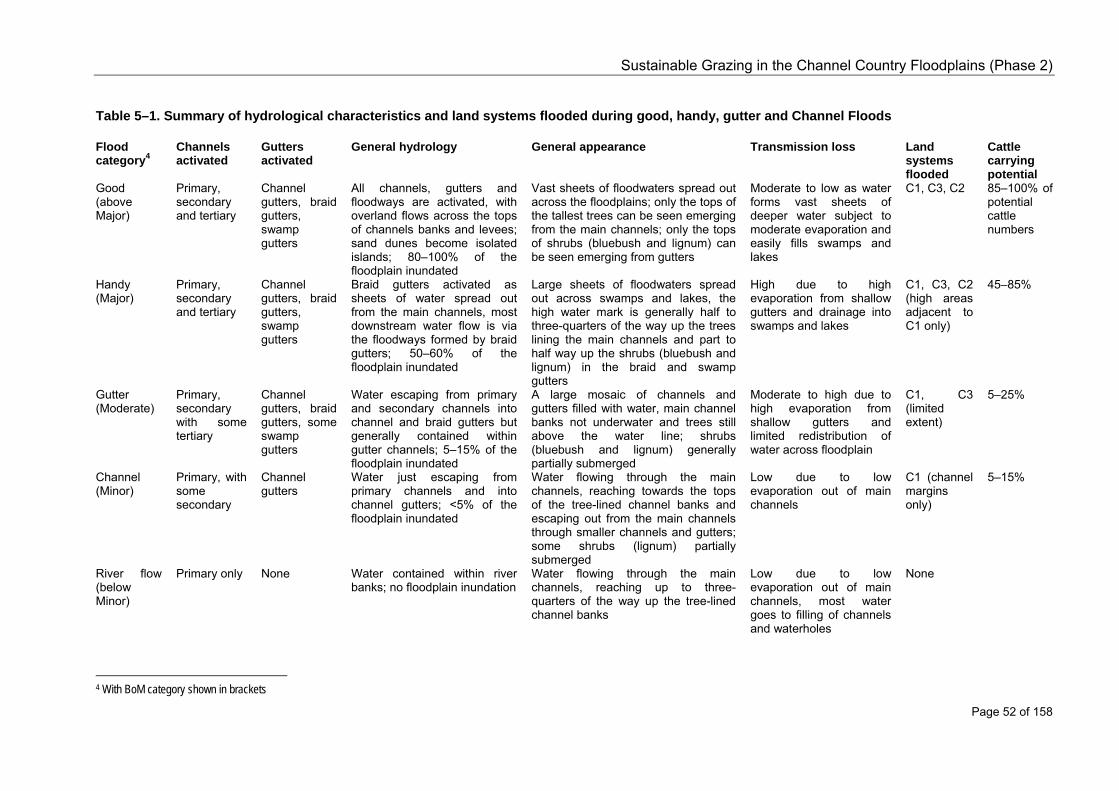
Sustainable Grazing in the Channel Country Floodplains (Phase 2)
Page 52 of 158
Table 5–1. Summary of hydrological characteristics and land systems flooded during good, handy, gutter and Channel Floods
4 With BoM category shown in brackets
Flood category4
Channels activated
Gutters activated
General hydrology General appearance Transmission loss Land systems flooded
Cattle carrying potential
Good (above Major)
Primary, secondary and tertiary
Channel gutters, braid gutters, swamp gutters
All channels, gutters and floodways are activated, with overland flows across the tops of channels banks and levees; sand dunes become isolated islands; 80–100% of the floodplain inundated
Vast sheets of floodwaters spread out across the floodplains; only the tops of the tallest trees can be seen emerging from the main channels; only the tops of shrubs (bluebush and lignum) can be seen emerging from gutters
Moderate to low as water forms vast sheets of deeper water subject to moderate evaporation and easily fills swamps and lakes
C1, C3, C2 85–100% of potential cattle numbers
Handy (Major)
Primary, secondary and tertiary
Channel gutters, braid gutters, swamp gutters
Braid gutters activated as sheets of water spread out from the main channels, most downstream water flow is via the floodways formed by braid gutters; 50–60% of the floodplain inundated
Large sheets of floodwaters spread out across swamps and lakes, the high water mark is generally half to three-quarters of the way up the trees lining the main channels and part to half way up the shrubs (bluebush and lignum) in the braid and swamp gutters
High due to high evaporation from shallow gutters and drainage into swamps and lakes
C1, C3, C2 (high areas adjacent to C1 only)
45–85%
Gutter (Moderate)
Primary, secondary with some tertiary
Channel gutters, braid gutters, some swamp gutters
Water escaping from primary and secondary channels into channel and braid gutters but generally contained within gutter channels; 5–15% of the floodplain inundated
A large mosaic of channels and gutters filled with water, main channel banks not underwater and trees still above the water line; shrubs (bluebush and lignum) generally partially submerged
Moderate to high due to high evaporation from shallow gutters and limited redistribution of water across floodplain
C1, C3 (limited extent)
5–25%
Channel (Minor)
Primary, with some secondary
Channel gutters
Water just escaping from primary channels and into channel gutters; <5% of the floodplain inundated
Water flowing through the main channels, reaching towards the tops of the tree-lined channel banks and escaping out from the main channels through smaller channels and gutters; some shrubs (lignum) partially submerged
Low due to low evaporation out of main channels
C1 (channel margins only)
5–15%
River flow (below Minor)
Primary only None Water contained within river banks; no floodplain inundation
Water flowing through the main channels, reaching up to three-quarters of the way up the tree-lined channel banks
Low due to low evaporation out of main channels, most water goes to filling of channels and waterholes
None
Sustainable Grazing in the Channel Country Floodplains (Phase 2)
Page 53 of 158
5.8 Modifiers of flood type
5.8.1 Transmission losses
Knighton and Nanson (1994) note that evaporation is a key determinant of the volume of floodwater that is lost–and hence a key determinant of the volume of floodwater in the lower reaches of the river systems. In general, the amount of floodwater declines downstream due to evaporation but more likely the highest “losses” of moving water occur as the floodwaters fill waterholes, swamps and lakes and as the floodwaters soak into the clay soils of the floodplains (Knighton and Nanson 1994). In terms of overall production, only evaporation represents an actual loss from the system, as waterholes provide stock water, swamps and lakes provide stock water and pasture, and soakage into floodplain soils is the natural irrigation event triggering pasture growth. In engineering terms, the reduction in available floodwater represents transmission loss from an upstream location to a downstream location. For instance, there is an average transmission loss of 77% between Windorah and Nappa Merrie on the Cooper (Knighton and Nanson 1994), and 78% between Diamantina Lakes and Birdsville on the Diamantina River (Costelloe 2006). High transmission losses create difficulties in attempting to predict flood size (as either stage height or volume) downstream (Costelloe 2006), especially when more than one factor is involved. However, we suggest that the transmission losses will only modify the actual flood result by one category of that expected based on upper catchment rainfall alone. For instance, sufficient rain to produce a Gutter Flood would result in a Channel Flood if the soils of the main channels were dry and waterholes nearly empty. An anticipated Handy Flood would be improved to a Good Flood in combination with sufficient local rainfall to produce local flooding. 5.8.2 Flood duration and number of peaks
Flood duration is a key modifier of the area covered. The longer the duration, the longer that braid and swamp gutters are active, and hence the greater the distributions of water throughout higher and, perversely, lower lying areas. In the Cooper, for instance, so long as a minimum stage height of 4 m is reached at Windorah, floodwater can be distributed through braided and swamp gutters. However the rate of water distribution is extremely slow–it takes about 3 weeks for the floodwaters to spread out across the swamps of South Galway Station and rejoin the main channels of the Cooper. The main floodwaters have already passed by Innamincka, some 350 km downstream, by this stage. Local experience highlights the importance of a single anabranching channel (the Town Channel) to the south and west of Windorah in facilitating the spread of floodwater across Mayfield Station and South Galway Station. Floodwaters from the main channel of the Cooper are always funnelled through the Town Channel which splits into three channels (the three-way split) before being distributed through tertiary channels and swamp gutters. Local experience suggests that the flood needs to be of at least 5 days duration for floodwaters to rise sufficiently in the Town Channel to then be distributed out through the three-way split. Whilst the local knowledge suggests that ‘there is a hump’ in the channel, is it likely that the Town Channel, and the small waterhole preceding the three-way split, simply need to fill prior to water being carried further. Only surveying would reveal if an actual rise in the floodplain or the bed of the Town Channel acts as the impediment to more rapid distribution of water. Thus a predicted Gutter Flood can become handy if the floodwaters remain near 4 m for long enough. A stage height of 7 m at Windorah is required for a Good Flood downstream. Three recent floods have reached a stage height in excess of 7 m at Windorah, with stage height data recorded daily (Figure 5–2). These data–obtained from the BoM microfiche records–demonstrate the

Sustainable Grazing in the Channel Country Floodplains (Phase 2)
Page 54 of 158
importance of flood duration in relation to stage height. Whilst the 2000 flood was in excess of 7 m, local knowledge indicates that it was only barely a Good Flood. The 2000 flood was of relatively short duration. The peak height was maintained for just 5 days, and the floodwaters had receded within 33 days of the initial rise. A lack of upstream rains meant that the 2000 flood had a single peak. The largest recorded flood in the Cooper (and in most rivers in the Eastern States) was in 1974. This flood peaked at 8.5 m, but remained at or above 7 m for approximately 22 days. The flood event lasted for more than 50 days, and upstream rains resulted in multiple flood peaks. It would be expected that multiple peaks would be a requirement of a longer duration flood, as upstream rains would be required to achieve higher volumes of water, which would enter the system as multiple pulses. The 1990 flood was the largest since 1974, and also regarded as a Good flood. This flood also had multiple peaks as upstream rains continued to contribute to the volume of floodwater over the 46 days of the flood event. The floodwaters remained above 7 m for 8 days, but remained above 5 m (major flood height) for 36 days. Such long duration floods ensure that braid and swamp gutters are active for a substantial amount of time, and, in the case of the Cooper south of Windorah, that the Town Channel and three-way split are distributing floodwaters for an extended period of time. The key factor in the value of the 1974 and 1990 floods was the volume of water that spread slowly throughout a large area of the floodplains, wetting up the soil profile and allowing for sustained pasture growth to ensue. However, volume is usually calculated from stage height data and not available until some time after a flood event. Since Channel Country managers require real-time information (Chapter 4), stage height and duration are useful and appropriate practical measures of a flood that are easy to interpret and track when making decisions about moving cattle out of floodplain paddocks, or when gauging the likely beneficial extent of a flood.
2
3
4
5
6
7
8
9
0 2 4 6 8 10 12 14 16 18 20 22 24 26 28 30 32 34 36 38 40 42 44 46 48 50
Days since start of flooding
Gau
ge h
eigh
t (m
)
channel flood level (3 m)
gutter flood level (4 m)
handy flood level (5 m)
good flood level (7 m)
1974 - the 'big one', high and of long duration
1990 - the best since '74
2000 - a high flood, but all over within a month
Figure 5–2. Hydrograph of three ‘above-major’ (good) flood events at Windorah (BoM historical data)
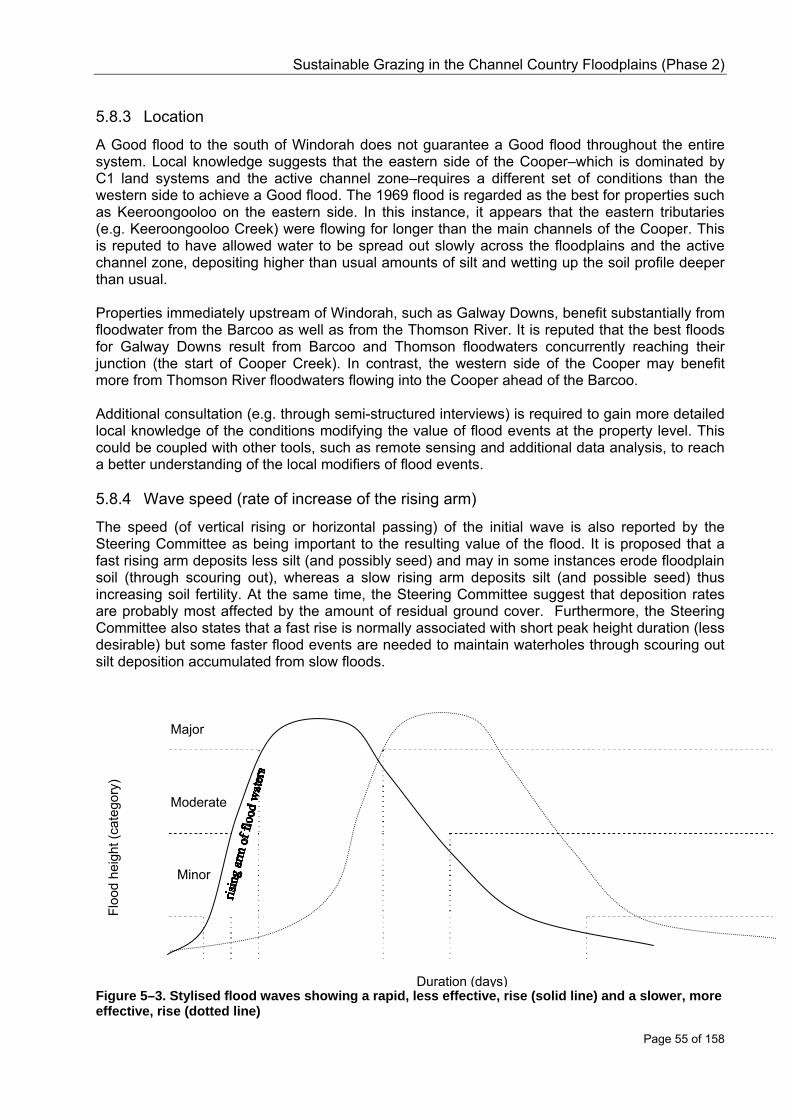
Sustainable Grazing in the Channel Country Floodplains (Phase 2)
Page 55 of 158
5.8.3 Location
A Good flood to the south of Windorah does not guarantee a Good flood throughout the entire system. Local knowledge suggests that the eastern side of the Cooper–which is dominated by C1 land systems and the active channel zone–requires a different set of conditions than the western side to achieve a Good flood. The 1969 flood is regarded as the best for properties such as Keeroongooloo on the eastern side. In this instance, it appears that the eastern tributaries (e.g. Keeroongooloo Creek) were flowing for longer than the main channels of the Cooper. This is reputed to have allowed water to be spread out slowly across the floodplains and the active channel zone, depositing higher than usual amounts of silt and wetting up the soil profile deeper than usual. Properties immediately upstream of Windorah, such as Galway Downs, benefit substantially from floodwater from the Barcoo as well as from the Thomson River. It is reputed that the best floods for Galway Downs result from Barcoo and Thomson floodwaters concurrently reaching their junction (the start of Cooper Creek). In contrast, the western side of the Cooper may benefit more from Thomson River floodwaters flowing into the Cooper ahead of the Barcoo. Additional consultation (e.g. through semi-structured interviews) is required to gain more detailed local knowledge of the conditions modifying the value of flood events at the property level. This could be coupled with other tools, such as remote sensing and additional data analysis, to reach a better understanding of the local modifiers of flood events. 5.8.4 Wave speed (rate of increase of the rising arm)
The speed (of vertical rising or horizontal passing) of the initial wave is also reported by the Steering Committee as being important to the resulting value of the flood. It is proposed that a fast rising arm deposits less silt (and possibly seed) and may in some instances erode floodplain soil (through scouring out), whereas a slow rising arm deposits silt (and possible seed) thus increasing soil fertility. At the same time, the Steering Committee suggest that deposition rates are probably most affected by the amount of residual ground cover. Furthermore, the Steering Committee also states that a fast rise is normally associated with short peak height duration (less desirable) but some faster flood events are needed to maintain waterholes through scouring out silt deposition accumulated from slow floods.
Figure 5–3. Stylised flood waves showing a rapid, less effective, rise (solid line) and a slower, more effective, rise (dotted line)
Major
Moderate
Minor
Duration (days)
Floo
d he
ight
(cat
egor
y)
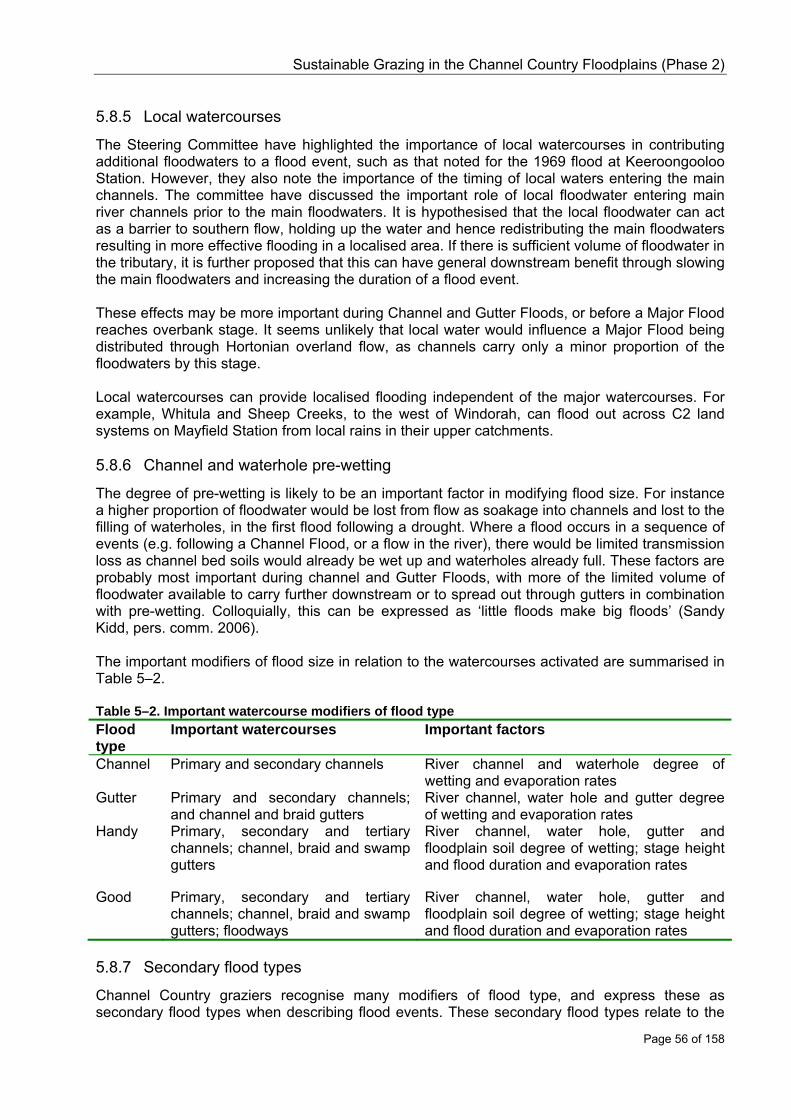
Sustainable Grazing in the Channel Country Floodplains (Phase 2)
Page 56 of 158
5.8.5 Local watercourses
The Steering Committee have highlighted the importance of local watercourses in contributing additional floodwaters to a flood event, such as that noted for the 1969 flood at Keeroongooloo Station. However, they also note the importance of the timing of local waters entering the main channels. The committee have discussed the important role of local floodwater entering main river channels prior to the main floodwaters. It is hypothesised that the local floodwater can act as a barrier to southern flow, holding up the water and hence redistributing the main floodwaters resulting in more effective flooding in a localised area. If there is sufficient volume of floodwater in the tributary, it is further proposed that this can have general downstream benefit through slowing the main floodwaters and increasing the duration of a flood event. These effects may be more important during Channel and Gutter Floods, or before a Major Flood reaches overbank stage. It seems unlikely that local water would influence a Major Flood being distributed through Hortonian overland flow, as channels carry only a minor proportion of the floodwaters by this stage. Local watercourses can provide localised flooding independent of the major watercourses. For example, Whitula and Sheep Creeks, to the west of Windorah, can flood out across C2 land systems on Mayfield Station from local rains in their upper catchments. 5.8.6 Channel and waterhole pre-wetting
The degree of pre-wetting is likely to be an important factor in modifying flood size. For instance a higher proportion of floodwater would be lost from flow as soakage into channels and lost to the filling of waterholes, in the first flood following a drought. Where a flood occurs in a sequence of events (e.g. following a Channel Flood, or a flow in the river), there would be limited transmission loss as channel bed soils would already be wet up and waterholes already full. These factors are probably most important during channel and Gutter Floods, with more of the limited volume of floodwater available to carry further downstream or to spread out through gutters in combination with pre-wetting. Colloquially, this can be expressed as ‘little floods make big floods’ (Sandy Kidd, pers. comm. 2006). The important modifiers of flood size in relation to the watercourses activated are summarised in Table 5–2. Table 5–2. Important watercourse modifiers of flood type Flood type
Important watercourses Important factors
Channel Primary and secondary channels River channel and waterhole degree of wetting and evaporation rates
Gutter Primary and secondary channels; and channel and braid gutters
River channel, water hole and gutter degree of wetting and evaporation rates
Handy Primary, secondary and tertiary channels; channel, braid and swamp gutters
River channel, water hole, gutter and floodplain soil degree of wetting; stage height and flood duration and evaporation rates
Good Primary, secondary and tertiary channels; channel, braid and swamp gutters; floodways
River channel, water hole, gutter and floodplain soil degree of wetting; stage height and flood duration and evaporation rates
5.8.7 Secondary flood types
Channel Country graziers recognise many modifiers of flood type, and express these as secondary flood types when describing flood events. These secondary flood types relate to the
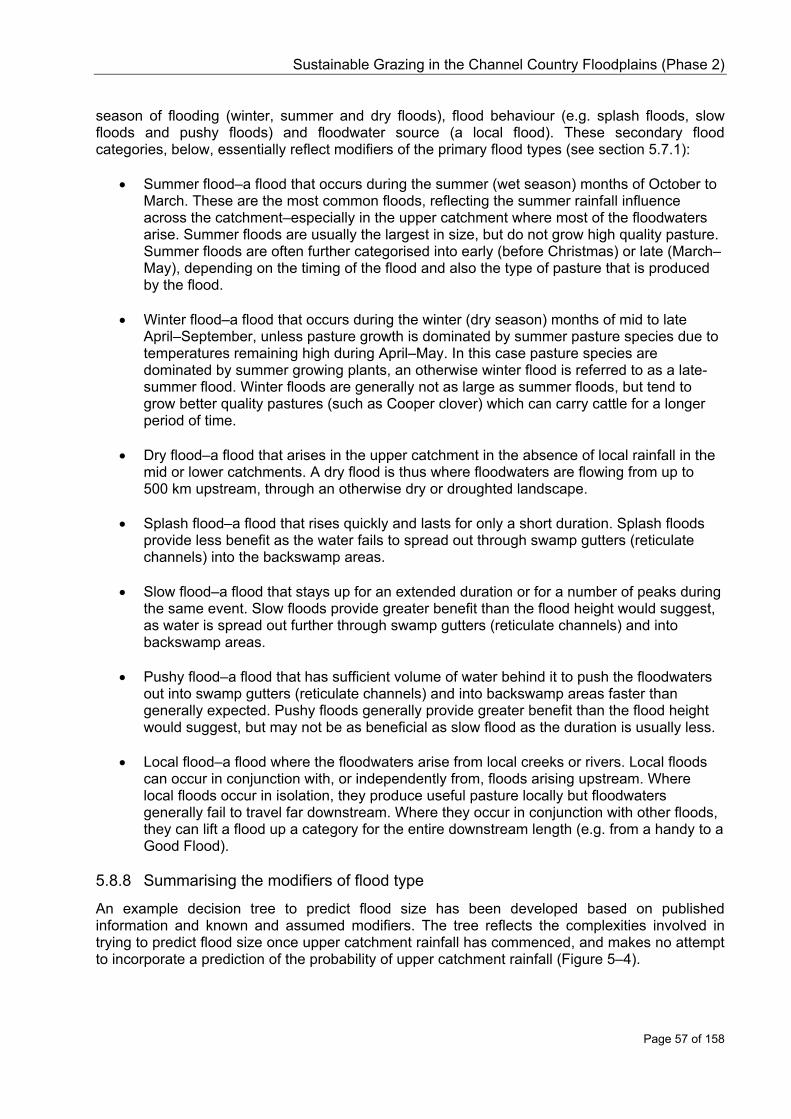
Sustainable Grazing in the Channel Country Floodplains (Phase 2)
Page 57 of 158
season of flooding (winter, summer and dry floods), flood behaviour (e.g. splash floods, slow floods and pushy floods) and floodwater source (a local flood). These secondary flood categories, below, essentially reflect modifiers of the primary flood types (see section 5.7.1):
• Summer flood–a flood that occurs during the summer (wet season) months of October to March. These are the most common floods, reflecting the summer rainfall influence across the catchment–especially in the upper catchment where most of the floodwaters arise. Summer floods are usually the largest in size, but do not grow high quality pasture. Summer floods are often further categorised into early (before Christmas) or late (March–May), depending on the timing of the flood and also the type of pasture that is produced by the flood.
• Winter flood–a flood that occurs during the winter (dry season) months of mid to late
April–September, unless pasture growth is dominated by summer pasture species due to temperatures remaining high during April–May. In this case pasture species are dominated by summer growing plants, an otherwise winter flood is referred to as a late-summer flood. Winter floods are generally not as large as summer floods, but tend to grow better quality pastures (such as Cooper clover) which can carry cattle for a longer period of time.
• Dry flood–a flood that arises in the upper catchment in the absence of local rainfall in the
mid or lower catchments. A dry flood is thus where floodwaters are flowing from up to 500 km upstream, through an otherwise dry or droughted landscape.
• Splash flood–a flood that rises quickly and lasts for only a short duration. Splash floods
provide less benefit as the water fails to spread out through swamp gutters (reticulate channels) into the backswamp areas.
• Slow flood–a flood that stays up for an extended duration or for a number of peaks during
the same event. Slow floods provide greater benefit than the flood height would suggest, as water is spread out further through swamp gutters (reticulate channels) and into backswamp areas.
• Pushy flood–a flood that has sufficient volume of water behind it to push the floodwaters
out into swamp gutters (reticulate channels) and into backswamp areas faster than generally expected. Pushy floods generally provide greater benefit than the flood height would suggest, but may not be as beneficial as slow flood as the duration is usually less.
• Local flood–a flood where the floodwaters arise from local creeks or rivers. Local floods
can occur in conjunction with, or independently from, floods arising upstream. Where local floods occur in isolation, they produce useful pasture locally but floodwaters generally fail to travel far downstream. Where they occur in conjunction with other floods, they can lift a flood up a category for the entire downstream length (e.g. from a handy to a Good Flood).
5.8.8 Summarising the modifiers of flood type
An example decision tree to predict flood size has been developed based on published information and known and assumed modifiers. The tree reflects the complexities involved in trying to predict flood size once upper catchment rainfall has commenced, and makes no attempt to incorporate a prediction of the probability of upper catchment rainfall (Figure 5–4).

Sustainable Grazing in the Channel Country Floodplains (Phase 2)
Page 58 of 158
5.9 Conclusion
The literature and local knowledge provide the basis for understanding individual flood events, which is a key factor in understanding and predicting resultant pasture growth and cattle carrying capacity. It is possible to combine the factors known to lead to, and modify, flooding in the Channel Country. Furthermore, it can be concluded that it is possible to predict flood size once upper catchment rainfall has begun. Rather than being a totally unpredictable system, flooding within the Channel Country can be predicted at a level consistent with improving sustainable land management. However, further research is needed to gain a detailed understanding at the level needed to assist with property scale management.
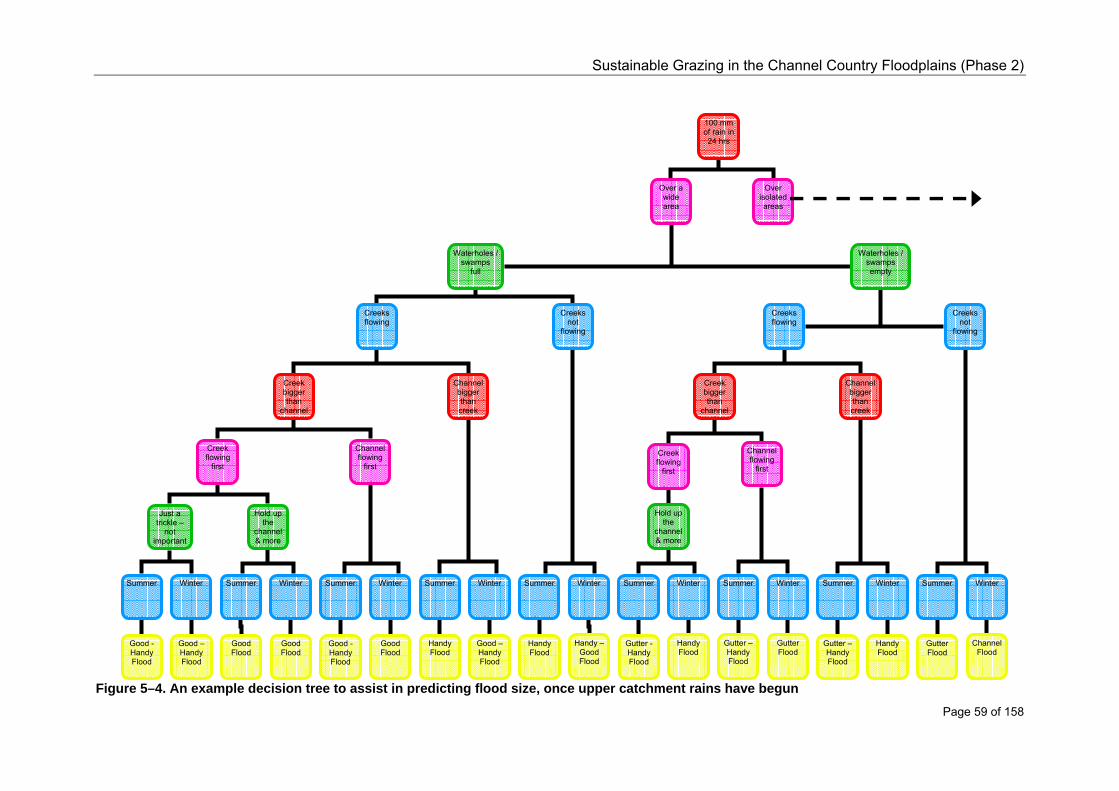
Sustainable Grazing in the Channel Country Floodplains (Phase 2)
Page 59 of 158
Figure 5–4. An example decision tree to assist in predicting flood size, once upper catchment rains have begun
100 mm of rain in 24 hrs
Over a wide area
Over isolated areas
Waterholes / swamps
full
Waterholes / swamps empty
Creeks flowing
Creeks not
flowing
Creek bigger than
channel
Channel bigger than creek
Creek flowing
first
Channel flowing
first
Just a trickle –
not important
Hold up the
channel& more
Summer
Good - Handy Flood
Good Flood
Good - Handy Flood
Summer Winter
Good – Handy Flood
Winter
Good Flood
Good Flood
Summer Winter Summer Winter
Handy Flood
Good – Handy Flood
Handy Flood
Creeks flowing
Creeks not
flowing
Gutter Flood
Creek bigger than
channel
Channel bigger than creek
Creek flowing
first
Channel flowing
first
Summer Winter
Gutter –Handy Flood
Handy Flood
Hold up the
channel & more
Summer Winter
Gutter - Handy Flood
Summer Winter
Gutter Flood
Summer Winter
Handy –Good Flood
Channel Flood
Winter Summer
Handy Flood
Gutter –Handy Flood

Sustainable Grazing in the Channel Country Floodplains (Phase 2)
Page 60 of 158
6 Monitoring rainfall, stage height, spatial extent of flooding and soil moisture in the Channel Country
6.1 Introduction
The extreme variability of rainfall and subsequent flood events in the Channel Country makes predictions of when floods will occur difficult to achieve (Chapter 5). However, once upper catchment rainfall commences flooding is assured and predictions relate to the time of arrival of flood, the size of the flood and the duration of the flood. The previous chapter described the industry flood ratings of Good, Handy, Gutter and Channel Floods and linked these to other flood rating systems and flood processes. The spatial extent of floodwater distribution, the flood depth and the duration of flooding are key elements of how useful a flood is. The most useful floods are those where floodwaters infiltrate through the soil profile, providing moisture to grow pasture for a sustained period. The ability to carry cattle for longer following winter floods, with a sustained period of pasture growth, is one reason why winter floods are valued more highly than summer floods (Chapter 4). The project ‘Sustainable Grazing in the Channel Country Floodplains’ (SGCCF) has used a number of tools to explore the usefulness of different flood events and to apply the ratings used by industry. In particular, archived data has been accessed, MODIS (Moderate Resolution Imaging Spectroradiometer with 36 spectral bands) remote sensing satellite imagery explored, existing hydrological modelling tested and site specific flood depth and resultant soil moisture has been monitored. This chapter will present and discuss these findings. 6.2 Methodology
6.2.1 Rainfall probabilities and flooding frequency
The rainfall probabilities needed to initiate flooding in the upper catchment (75 to 100 mm in 24 hours) were derived from BoM estimates. The probabilities were estimated using ‘HowOften?’ decision support software (APSRU 2000) Previously undocumented stage height data from the Bureau of Meteorology (BoM) were accessed from microfiches and digitised into spreadsheet format to provide a longer history of flood data than was previously available. These data are currently un-calibrated, with historical records of gauge surveys yet to be accessed and documented. These data were combined with all other sources of published information and data to develop tables of flood frequency. The producer defined flood categories were approximated from stage height and available flood descriptions. 6.2.2 MODIS remote sensing
MODIS satellite images were sourced for the 2000–2004 period to visually appraise their use in predicting flood extent, especially for the period of site inundation where automated loggers had failed. An experimental GIS automated flood mapping dataset was accessed from David Roshier (of Charles Sturt University) to appraise the use in near-real time applications, especially for site inundation. 6.2.3 ARIDFLO hydrology model
The ARIDFLO hydrology model (Dry/Wet, Costelloe 1998; 2003a; 2003b; 2004; 2005; 2006) has been developed to enable spatial prediction of flooding within arid systems such as the Channel Country. The model currently encompasses the mid-Diamantina reach (Figure 6–1).

Sustainable Grazing in the Channel Country Floodplains (Phase 2)
Page 61 of 158
ÊÚ
ÊÚ
ÊÚ
ÊÚ
ÊÚ
ÊÚ
ÊÚ ÊÚ
ÊÚ
ÊÚ
ÊÚ
ÊÚ
ÊÚ
ÊÚ
ÊÚ
ÊÚ
ÊÚ
Cluny
Tanbar
Durrie
Monkira
Cowarie
Glengyle
Coorabulka
Mooraberree
Durham Downs
South Galway
Marion Downs
Clifton Hills
Brighton Downs
Diam
antin
a Ri
ver
Ge o
rgi n
a R
iver
Cooper C
k
#13#6
#
15#
11
#
1#
7
#
8
#
3
#
12#
16
#
5#
10#
14
#
17
#
4#
2
# 9
S
N
EW
50 0 50 100 150 200 250 Kilometers
Mid-Diamantina ARIDFLO model areaState borders
ÊÚ Channel Country site locationsMajor Queensland Rivers
Channel County site locationsin relation to the mid-DiamantinaARIDFLO hydrology model area
Figure 6–1. Channel Country project site locations in relation to the mid-Diamantina ARIDFLO model area The ARIDFLO model relies on spatial daily rainfall data and temporally fixed ground cover classes, landscape features and channel connectivity to estimate soil moisture storage, overland flow and within channel flow. The model uses a 0.05 degree cell size (approximately 28 km2) for spatial input, and to output daily storage and flow estimates. This creates a matrix 71 columns wide by 58 rows long and of 3.25 degrees width and 2.9 degrees length. The model area includes both sites (C1 lignum and C1 bluebush) on Monkira Station, the site on Mooraberree Station and the site on Durrie Station. The cell within which each of these sites is located was determined in ArcView (a computer GIS programme by ESRI) by plotting site locations over the grided ARIDFLO model area and manually locating the reference within the grid. This grid reference was then used to extract flow values for each of the relevant sites. It was assumed that the flow regime for the site within the cell was the same as the cell itself. This could prove to be false for low flows, given the large cell size. If there was a flow in the cell, then site soil moisture was re-set to the maximum within ‘GRASP’ (a computerised pasture growth model) using start and finish dates equating to the predicted ARIDFLO flood duration. 6.2.4 Flood - peak travel times
The time taken for the peak of a flood to travel between river locations was estimated through semi-structured interviews with the Steering Committee and other key industry members.

Sustainable Grazing in the Channel Country Floodplains (Phase 2)
Page 62 of 158
6.2.5 Site specific flood depth and resultant soil moisture
Site specific flood height, rate of rise, duration and rate of fall data were monitored using automated water depth sensors at 17 locations in the Cooper, Diamantina and Georgina floodplains (see Figure 1–1, Chapter 7 and Appendix 13.6 for site locations and descriptions). Manual gauges, comprising a rod painted with fluorescene solution and encased in a rain-proof housing were used as a backup to the automated gauges. Soil moisture to 100 cm depth (in 10 cm increments) was estimated by auguring three soil holes within site exclosures and is presented as gravimetric data. 6.3 Results and Discussion
6.3.1 Rainfall probabilities and flooding frequency
The BoM stage height data was incorporated with widely available data (e.g. NR&W watershed data) and local knowledge to classify historical flood events into good, handy, gutter and Channel Floods and to estimate the return interval (flood frequency) for each event. Rainfall data were analysed to estimate the probability of floods, based on the BoM descriptions of rains required to initiate flooding. A minimum of 100 mm of generalised rain in 24 hours over a wide area is needed for Major (good or handy) flooding in the Cooper and Diamantina. Falls of 75 mm in 24 hours lead to minor to moderate flooding, depending on preceding rains and isolated storms (BoM 1997). As a guide, 100 and 75 mm have been chosen as the cut-off for probability analysis based on published information. However, it is possible that lesser rains in the upper catchment of the Diamantina will produce a higher volume of runoff than in the Cooper, given the higher proportion of ‘hard’ country (generally have high or fast water runoff rates) in the upper Diamantina catchment (Chapter 3). The probability of receiving 100 mm rain in a 24 hour period in the upper catchment of the Cooper ranges from 3 to 19% (Table 6–1 a)). Most locations have a probability in excess of 10% (average of 13% for the locations selected), suggesting the probability of major flooding to be better than 10%. The probability of receiving 75 mm in 24 hours is much higher, and generally in excess of 30%. Rainfall probabilities decline rapidly to the south of Longreach, whilst Tambo appears to be an aberration with very low chances of flood causing rains. The probability of receiving 100 mm rain in a 24 hour period in the upper catchment of the Diamantina is lower than the Cooper, ranging from 4 to 16% but with most locations less than 10% (Table 6–1 b)). This would, in turn, suggest the probability of major flooding to be less than 10%. The probability of receiving 75 mm in 24 hours is higher and generally in excess of 20%. Rainfall probabilities tend to decline to the south of Brighton Downs Station. The estimated occurrence of each flood type based on BoM records for the Cooper and Diamantina broadly support the rainfall probabilities. On average, there is a flood every 1.6 years in the Cooper, of which 17 have been Good Floods–or a Good Flood approximately once every 7 years. There is a flood every 1.8 years in the Diamantina, on average, of which 8 have been Good Floods (once every 16 years). The suggestion of one Good Flood approximately every 10 years for the Cooper and less often than every 10 years for the Diamantina, is consistent with the rainfall probabilities. A thorough GIS analysis of rainfall probabilities, incorporating factors such as soil runoff potential, may provide for more accurate estimations of the rainfall needed for each flood category.
Sustainable Grazing in the Channel Country Floodplains (Phase 2)
Page 63 of 158
Table 6–1. The probability of receiving sufficient rain for Good and Handy flooding in a) the Cooper Creek b) the Diamantina River catchments a) Cooper Creek Catchment position
Location Proportion (%) of years that rainfall is at least 100 mm in 24 hours
Proportion (%) of years that rainfall is at least 75 mm in 24 hours
upper Torrens Creek 15 39
upper Muttaburra 19 42
upper Aramac 16 27
upper Barcaldine 13 36 upper Blackall 15 38
upper Tambo 3 7
upper Camoola Park Stn 12 30 mid Longreach 14 36 mid Isisford 3 9
lower Retreat 9 17
mid Stonehenge 3 6
mid Windorah 1 1 lower Nappa Merrie Stn 2 4
b) Diamantina River Catchment position
Location Proportion (%) of years that rainfall is at least 100 mm in 24 hours
Proportion (%) of years that rainfall is at least 75 mm in 24 hours
upper Mackunda Downs Stn 4 10 upper Kynuna 16 33 upper Lana Downs Stn 6 14 upper Bladensburg NP 10 28 mid Brighton Downs Stn 5 13 mid Springvale Stn 3 9 mid Diamantina Lakes NP 2 6 mid Monkira Stn 7 17 mid Mooraberree Stn 2 8 mid Durrie Stn 2 6 lower Betoota 1 10 lower Birdsville 5 10 lower Pandie Pandie Stn 2 7 lower Clifton Hills Stn 5 15 lower Cowarie Stn 1 6

Sustainable Grazing in the Channel Country Floodplains (Phase 2)
Page 64 of 158
Figure 6–2. Pie chart of the frequency of good, handy, gutter and Channel Floods in a) Cooper Creek at Windorah b) the Diamantina River at Diamantina Lakes 6.3.2 MODIS remote sensing
The 16–day composite MODIS satellite images provided a useful overview of the flood events between March 2000 and April 2004. Floodwaters are clearly visible when using nadir reflectance 6, 2 and 4, such as during the 2004 flood event (Figure 6–3 a). The clear discrimination between floodwater and other image elements also allows for automated procedures to be developed. The automated procedure developed by David Roshier has potential to track floods spatially in near-real time. A key element of Roshier’s procedure is the masking out of other high-reflectance landscape features, such as clay pans, thus minimising the risk of over-estimating the extent of floodwaters (Roshier pers comm. 2004).
(once every 7 years)
Flood events in the Cooper between 1882 and 2006 (estimated from historical flood records from Windorah)
7 Channel Floods (once every 18 years)
18 Gutter Floods
38 Handy Floods (once every 3 years)
17 Good Floods (once every 7 years)
on average, there is a flood every 1.6 years in the Cooper
Flood events in the Diamantina between 1876 and 2006(estimated from historical flood records from Diamantina Lakes)
8 Good Floods (once every 16 years)
19 Channel Floods (once every 7 years)
50 Handy (or average) Floods(once every 3 years)
on average, there is a flood every 1.8 years in the Diamantina
a)
b)
Sustainable Grazing in the Channel Country Floodplains (Phase 2)
Page 65 of 158
The Handy or Good flooding of early 2004 can be clearly seen in MODIS 16–day composite imagery (Figure 6–3). Rains of 100–200 mm fell over the upper catchment of each system in early to mid January 2004, leading to the flooding evident in Figure 6–3 a by mid-January 2004. The main channels of the Cooper were carrying water, which arose in both the Thomson and Barcoo Rivers (Appendix 13.3) leading to Handy flooding (Appendix 13.4). Some floodwater was present in the Whitula/Sheep Creek systems on the western side of Windorah. Good flooding was evident along the Diamantina, with pasture growth evident along the length of the floodplains through to early April 2004. Flooding failed to progress into the lower reaches of the Georgina, instead terminating in Lake Machattie and swamps on Cluny Station and Glengyle Station. This would have made for a Good flood for the upper and mid reaches, but would have been a Channel Flood at best downstream. A series of site aerial photographs were also taken during the 2004 flood pulse (Appendix 13.6), at roughly the same time as the MODIS satellite image in Figure 6–3 c). The major limitation of MODIS satellite imagery is pixel size, with 250 m the smallest available pixel size. The scale meant that visual estimation of the extent of flooding at the site scale was difficult, and provided an approximation only. Daily data were used to estimate flood duration during 2004, with reasonable accuracy when used in conjunction with known flood height and duration. When used alone, it was easy to visually assess if a pixel was fully inundated, but difficult to determine to what extent a partially inundated pixel partial was flooded. It may not be possible to rely solely on MODIS satellite imagery to estimate flood extent and duration at a scale smaller than approximately 500 m, where pixels can be averaged to provide an estimate of partial inundation. At this scale, it is unlikely that the extent of Channel or Gutter Floods could be accurately estimated, with maximum anabranching channel widths of 125 m and maximum gutter widths of 32 m (Fagan and Nanson 2004). Whilst the pixel size may preclude accurate estimation of smaller floods, the extent of moderate and major floods should be sufficient to allow for reasonably accurate spatial estimations. The major advantage of satellite imagery is that it provides daily coverage, is currently free, and readily available within 1–2 days of acquisition (e.g. for download from the MODIS Rapid Response System web site: http://rapidfire.sci.gsfc.nasa.gov/subsets/) and could thus provide a near-real time tracking tool for predicting flooding extent, and the time of arrival of the flood pulse. This could provide major benefits to the managers in the Channel Country when determining cattle movements. A simple delivery mechanism would need to be devised, however, to ensure the use of the technology. This could be as simple as a link to the rapid fire system on a Channel Country website, or a daily e-mail newsletter provided during flood events. Other authors report success in using Landsat (e.g. Graetz 1980) and NOAA (Costelloe 1998) satellite imagery in estimating flood size in the Channel Country. Landsat has the advantage of providing more detail (at a pixel size of approximately 25 m) and longer historical coverage, with the first Landsat satellite launched around the time of the 1974 flood. However, Landsat passes are approximately 16 days apart and imagery in neither free nor widely available prior to (about) 1984. NOAA has a pixel size of approximately 5 km and may be too coarse to provide reasonable estimates of less than major floods. Further spatial classification of floods into both BoM and SGCCF categories using a GIS approach could provide further insight into flooding patterns, and allow for improved predictions of flood size. Remote sensing may be the best approach to analyse flood size at the reach or property scale. To date, overall flood categories have only been estimated for the Cooper and Diamantina, although it is known that high transmission loss can lead to lesser floods in lower river reaches.
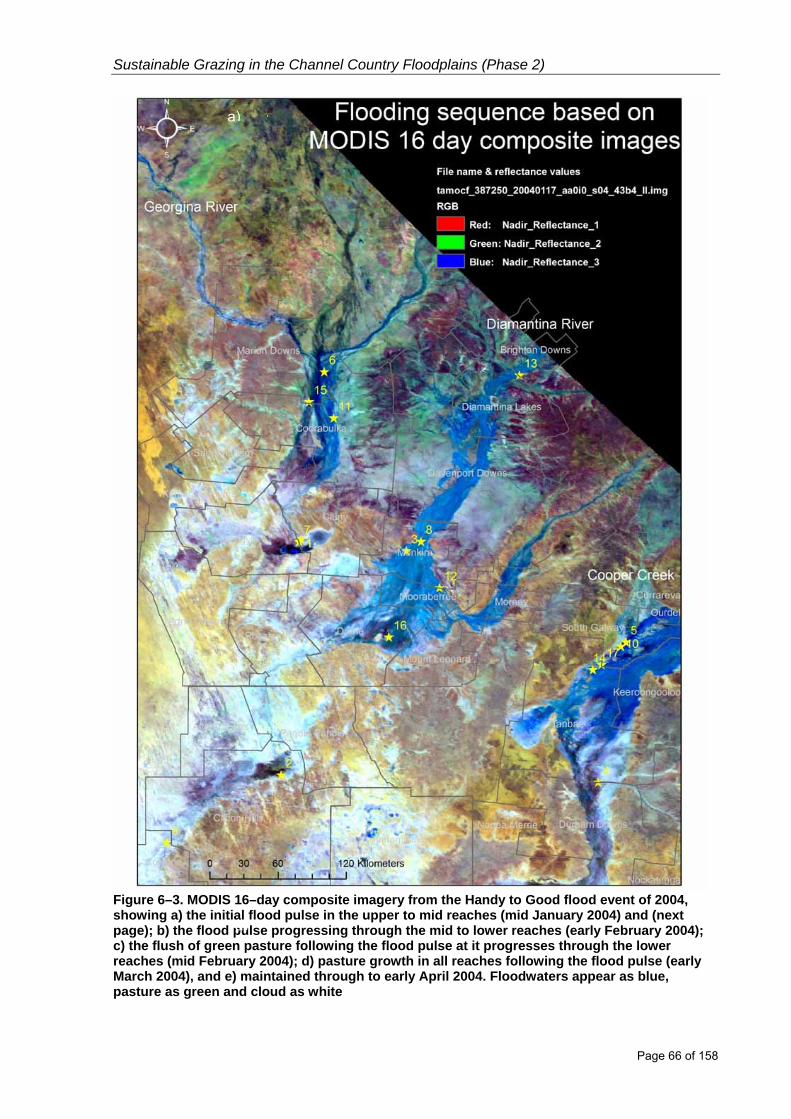
Sustainable Grazing in the Channel Country Floodplains (Phase 2)
Page 66 of 158
Figure 6–3. MODIS 16–day composite imagery from the Handy to Good flood event of 2004, showing a) the initial flood pulse in the upper to mid reaches (mid January 2004) and (next page); b) the flood pulse progressing through the mid to lower reaches (early February 2004); c) the flush of green pasture following the flood pulse at it progresses through the lower reaches (mid February 2004); d) pasture growth in all reaches following the flood pulse (early March 2004), and e) maintained through to early April 2004. Floodwaters appear as blue, pasture as green and cloud as white
a)
a)
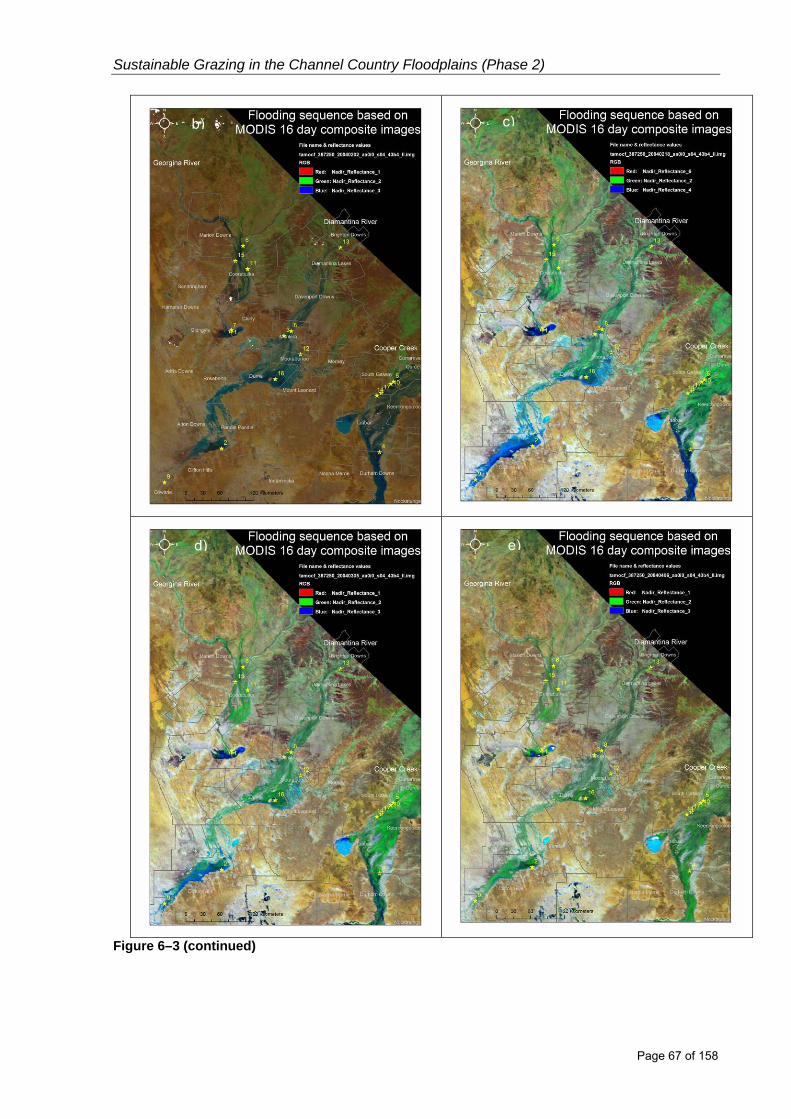
Sustainable Grazing in the Channel Country Floodplains (Phase 2)
Page 67 of 158
Figure 6–3 (continued)
b)
e)d)
c)

Sustainable Grazing in the Channel Country Floodplains (Phase 2)
Page 68 of 158
6.3.3 ARIDFLO hydrology model
There was a reasonable relationship between the timing of the predicted ARIDFLO flood regimes and the flood depth (stage height) measured at Monkira Station between 1999 and 2002 (Figure 6–4). The peak stage height of the 2003 flood occurred in February, whilst the ARIDFLO prediction for peak flow was in January. This discrepancy of nearly one month makes little difference when estimating the size of a flood, but can be critical in modelling the resultant pasture growth. At this stage the ARIDFLO model has coverage limited to the mid and upper reaches Diamantina, lower Cooper and catchments to the south and west of Lake Eyre. This captures five of the 17 SGCCF project sites. Coverage for the other 12 sites would only be possible through constructing new models based on ground cover classes, landscape features and channel connectivity. The potential to use the ARIDFLO model in near-real time was assessed for the four mid-Diamantina reach sites. During these attempts, it became apparent that the large time component to manually translate daily time step rainfall files into useable input would require additional resources, unless an automated procedure could be developed. To date, the author of the ARIDFLO hydrology model (Justin Costelloe of Melbourne University) has not been able to automate the process, suggesting that automation is beyond the current scope of the SGCCF project. It appears that ARIDFLO can estimate flood size relatively accurately, and that it could provide an excellent research tool for estimating historical flooding events. Daily time step rainfall data are available from the 1st January 1889 (Jeffery 2001), making it possible to model flood events through ARIDFLO from 1889 to the present.
Figure 6–4. Predicted ARIDFLO flow regimes (vertical bars) for the cell containing Monkira C1 bluebush and observed homestead stage height (crosses) between 1999 and 2003
0
200
400
600
800
1000
1200
1400
1/1/
1999
3/1/
1999
5/1/
1999
7/1/
1999
9/1/
1999
11/1
/199
9
1/1/
2000
3/1/
2000
5/1/
2000
7/1/
2000
9/1/
2000
11/1
/200
0
1/1/
2001
3/1/
2001
5/1/
2001
7/1/
2001
9/1/
2001
11/1
/200
1
1/1/
2002
3/1/
2002
5/1/
2002
7/1/
2002
9/1/
2002
11/1
/200
2
1/1/
2003
3/1/
2003
Date
Flow
(Ml)
0.0
1.0
2.0
3.0
4.0
5.0
6.0
Stag
e he
ight
(m)C1 bluebush innundation indicator
level (3.5m)
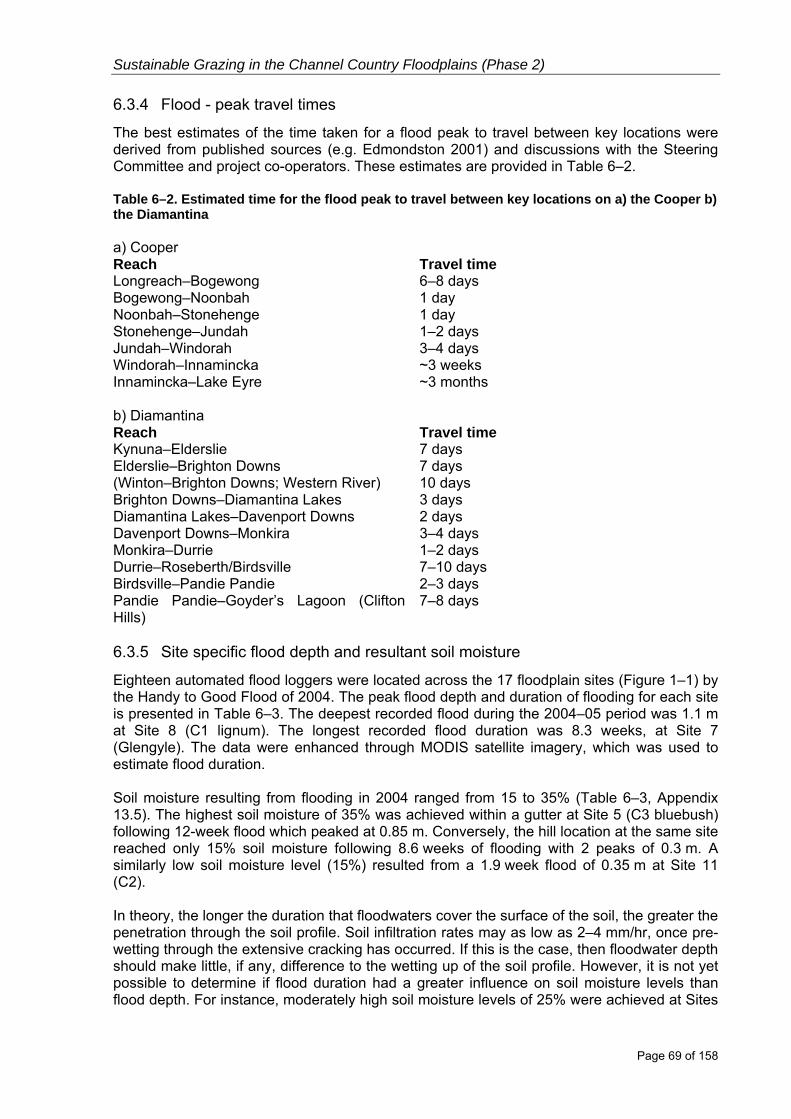
Sustainable Grazing in the Channel Country Floodplains (Phase 2)
Page 69 of 158
6.3.4 Flood - peak travel times
The best estimates of the time taken for a flood peak to travel between key locations were derived from published sources (e.g. Edmondston 2001) and discussions with the Steering Committee and project co-operators. These estimates are provided in Table 6–2. Table 6–2. Estimated time for the flood peak to travel between key locations on a) the Cooper b) the Diamantina a) Cooper Reach Travel time Longreach–Bogewong 6–8 days Bogewong–Noonbah 1 day Noonbah–Stonehenge 1 day Stonehenge–Jundah 1–2 days Jundah–Windorah 3–4 days Windorah–Innamincka ~3 weeks Innamincka–Lake Eyre ~3 months b) Diamantina Reach Travel time Kynuna–Elderslie 7 days Elderslie–Brighton Downs 7 days (Winton–Brighton Downs; Western River) 10 days Brighton Downs–Diamantina Lakes 3 days Diamantina Lakes–Davenport Downs 2 days Davenport Downs–Monkira 3–4 days Monkira–Durrie 1–2 days Durrie–Roseberth/Birdsville 7–10 days Birdsville–Pandie Pandie 2–3 days Pandie Pandie–Goyder’s Lagoon (Clifton Hills)
7–8 days
6.3.5 Site specific flood depth and resultant soil moisture
Eighteen automated flood loggers were located across the 17 floodplain sites (Figure 1–1) by the Handy to Good Flood of 2004. The peak flood depth and duration of flooding for each site is presented in Table 6–3. The deepest recorded flood during the 2004–05 period was 1.1 m at Site 8 (C1 lignum). The longest recorded flood duration was 8.3 weeks, at Site 7 (Glengyle). The data were enhanced through MODIS satellite imagery, which was used to estimate flood duration. Soil moisture resulting from flooding in 2004 ranged from 15 to 35% (Table 6–3, Appendix 13.5). The highest soil moisture of 35% was achieved within a gutter at Site 5 (C3 bluebush) following 12-week flood which peaked at 0.85 m. Conversely, the hill location at the same site reached only 15% soil moisture following 8.6 weeks of flooding with 2 peaks of 0.3 m. A similarly low soil moisture level (15%) resulted from a 1.9 week flood of 0.35 m at Site 11 (C2). In theory, the longer the duration that floodwaters cover the surface of the soil, the greater the penetration through the soil profile. Soil infiltration rates may as low as 2–4 mm/hr, once pre-wetting through the extensive cracking has occurred. If this is the case, then floodwater depth should make little, if any, difference to the wetting up of the soil profile. However, it is not yet possible to determine if flood duration had a greater influence on soil moisture levels than flood depth. For instance, moderately high soil moisture levels of 25% were achieved at Sites
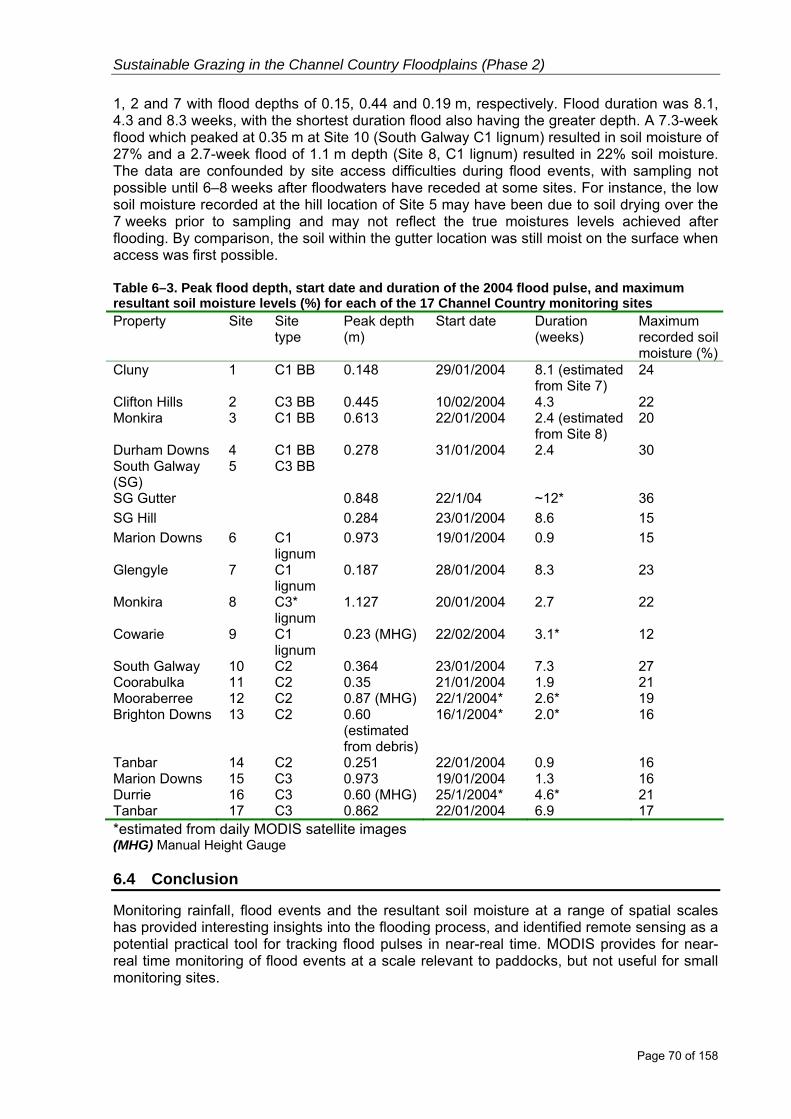
Sustainable Grazing in the Channel Country Floodplains (Phase 2)
Page 70 of 158
1, 2 and 7 with flood depths of 0.15, 0.44 and 0.19 m, respectively. Flood duration was 8.1, 4.3 and 8.3 weeks, with the shortest duration flood also having the greater depth. A 7.3-week flood which peaked at 0.35 m at Site 10 (South Galway C1 lignum) resulted in soil moisture of 27% and a 2.7-week flood of 1.1 m depth (Site 8, C1 lignum) resulted in 22% soil moisture. The data are confounded by site access difficulties during flood events, with sampling not possible until 6–8 weeks after floodwaters have receded at some sites. For instance, the low soil moisture recorded at the hill location of Site 5 may have been due to soil drying over the 7 weeks prior to sampling and may not reflect the true moistures levels achieved after flooding. By comparison, the soil within the gutter location was still moist on the surface when access was first possible. Table 6–3. Peak flood depth, start date and duration of the 2004 flood pulse, and maximum resultant soil moisture levels (%) for each of the 17 Channel Country monitoring sites Property Site Site
type Peak depth (m)
Start date Duration (weeks)
Maximum recorded soil moisture (%)
Cluny 1 C1 BB 0.148 29/01/2004 8.1 (estimated from Site 7)
24
Clifton Hills 2 C3 BB 0.445 10/02/2004 4.3 22 Monkira 3 C1 BB 0.613 22/01/2004 2.4 (estimated
from Site 8) 20
Durham Downs 4 C1 BB 0.278 31/01/2004 2.4 30 South Galway (SG)
5 C3 BB
SG Gutter 0.848 22/1/04 ~12* 36 SG Hill 0.284 23/01/2004 8.6 15 Marion Downs 6 C1
lignum 0.973 19/01/2004 0.9 15
Glengyle 7 C1 lignum
0.187 28/01/2004 8.3 23
Monkira 8 C3* lignum
1.127 20/01/2004 2.7 22
Cowarie 9 C1 lignum
0.23 (MHG) 22/02/2004 3.1* 12
South Galway 10 C2 0.364 23/01/2004 7.3 27 Coorabulka 11 C2 0.35 21/01/2004 1.9 21 Mooraberree 12 C2 0.87 (MHG) 22/1/2004* 2.6* 19 Brighton Downs 13 C2 0.60
(estimated from debris)
16/1/2004* 2.0* 16
Tanbar 14 C2 0.251 22/01/2004 0.9 16 Marion Downs 15 C3 0.973 19/01/2004 1.3 16 Durrie 16 C3 0.60 (MHG) 25/1/2004* 4.6* 21 Tanbar 17 C3 0.862 22/01/2004 6.9 17 *estimated from daily MODIS satellite images (MHG) Manual Height Gauge 6.4 Conclusion
Monitoring rainfall, flood events and the resultant soil moisture at a range of spatial scales has provided interesting insights into the flooding process, and identified remote sensing as a potential practical tool for tracking flood pulses in near-real time. MODIS provides for near-real time monitoring of flood events at a scale relevant to paddocks, but not useful for small monitoring sites.
Sustainable Grazing in the Channel Country Floodplains (Phase 2)
Page 71 of 158
The ARIDFLO hydrology model has been identified as a useful research tool, but not as a near-real time predictor of flood pulses. It does, however, provide the capacity to retrospectively model flood events from 1889 to the present date. Site based data have failed to reveal if flood depth or duration are the most important factors in wetting up the soil profile. Further research is needed to ascertain the relative importance of flood duration and flood depth in wetting up the soil profile. This could be achieved through additional monitoring of site based soil moisture and flood depth or through more controlled experimental procedures. Pasture growth is the most critical factor determining the usefulness of a flood pulse, in that pasture yield, quality and composition determine the number of cattle that can be carried following flooding. Whilst the soil moisture data presented fail to reveal the most likely reasons for differential wetting up, they do provide the basis for modelling pasture growth. This will be addressed in the following chapters. 7 Predicting pasture growth from flood and rainfall events 7.1 Introduction
Pasture growth within the expansive floodplains of the Channel Country is substantially different from other arid and semi-arid rangelands within Australia. Whilst most rangeland pastures are rain-fed systems, Channel Country floodplains are substantively flood-fed. Rainfall events contribute to growth primarily through localised flooding or ponding, rather than initiating growth per se (Phelps et al 2003; Phelps 2003). However, follow-up rainfall can considerably improve the results of flooding by extending time that soil moisture is available to growing plants. Rains immediately preceding a flood event may improve the resultant flood-fed pasture growth by pre-wetting the soil profile (Phelps 2003). Pasture growth within the floodplains occurs as reactive pulses of growth following flood events, with a subsequently long period of senescence and detachment. The speed and peak yield of any growth pulse appears to be governed by the major species growing as a result of the flood variables as well as by post-flood conditions, such as ambient air temperature and drying winds. 7.2 The pasture growth pulse concept
River-floodplain ecosystem function is a relatively new paradigm within which the flood pulse concept (Junk et al. 1989) has been presented as a comprehensive analysis of tropical lowland riverine dynamics. The flood pulse concept is the view that rivers and their peripheral floodplains are integrated components of a single dynamic system, linked by strong interactions between hydrological and ecological processes. The powerhouse of the system is the pulsing of river discharge which determines the degree of connectivity and the exchange processes of matter and organisms across river floodplain gradients. The salient point for this study is that scientific research supports the assertions of the project Steering Committee that there is a complex interaction between the hydrology and ecology of riverine floodplains. Vegetation in the Channel Country is typically dominated by annual species with short life cycles that are able to react to changing and variable environmental conditions. However, vegetation responses are just as variable as the hydrological processes that drive them. Whilst the classic flood pulse concept explains the duality of hydrology and ecology, it focuses on flood events that occur with regularity and predictability. Tockner et al (2000)

Sustainable Grazing in the Channel Country Floodplains (Phase 2)
Page 72 of 158
discuss riverine systems with irregular flows and expand the flood pulse concept to include the influence of expansion and contraction of flood events. The main hydrological factors that affect vegetation response in the Channel Country are: flood height including speed of water rise, fall and flow; season of flooding including timing in relation to other flood events, duration of inundation, flooding frequency and predictability (Figure 7–1). Notwithstanding this, central to appreciating pasture response in the Channel Country is the notion that vegetation growth in response to flood events varies in abundance, relative proportions, distribution and species composition. Furthermore vegetation is varied in: palatability, duration of availability as useful forage, total biomass production and nutrient content.
Figure 7–1. A simple conceptual representation of the dynamics of floods and responding vegetation growth Simplistically, different types and amounts of pastures grow to varying extents, depending upon many factors. These responses can be thought of as reactive pulses of vegetation growth. One of the aims of this project is to record many of these variants through documenting and synthesising expert local knowledge and scientific monitoring to produce useful flood ‘rules of thumb’ and pasture guides. 7.3 Flood categories and pasture response
Floods have been categorised into Good, Handy, Gutter and Channel, based on industry experience and definitions (Edmondston 2001). Pasture growth modelled through ‘GRASP’ will be used to define tables of pasture growth with the subsequent initial cattle numbers for Good, Handy, Gutter and Channel Floods (Table 7–1). The project Steering Committee have recommended that these tables be defined for significant areas of floodplain at the paddock level, to maximise the benefits as a management tool in matching initial cattle numbers with predicted pasture growth. The relative usefulness of each flood category has been determined by the Steering Committee (Figure 7–2), but requires refining for each property.
Temporal Aspects
Rise
Fall
Flow
Water Speed
Duration
Frequency
Timing
Predictability
Vegetation Growth
Species
Proportions
Distribution Biomass
Nutrients
Palatability
Availability
Abundance
Production Aspects
Botanical Aspects
Flood

Sustainable Grazing in the Channel Country Floodplains (Phase 2)
Page 73 of 158
Table 7–1. Flood type definitions (from Edmondston 2001) Flood type Description Land systems
flooded Channel The main channels run but water does not escape to the
surrounding floodplain C1, limited to channel margins
Gutter Gutter floods occur when the water escapes from the main channels and spills over to the many small waterways (gutters) that flow from the main channels. These floods promote growth of a good body of herbage and grasses along the gutters
C1
Handy (or useful)
Handy floods occur when the water escapes from the gutters, connecting up to form the large sheets of water for which the area is famous. It can cover up to 50% of the floodplain with water at varying depths. There is a large pasture response from these floods, but the extent to which the feed lasts is determined by the time of year (heat) and how long the pastures remain covered (determining the moisture penetration in the soil)
C1, C3
Good Good floods are similar to Handy Floods, but cover a much higher proportion of the floodplain (75% or more)
C1, C3, C2
Figure 7–2. The relative importance of Good, Handy, Gutter and Channel Floods in terms of pasture response and the potential numbers of cattle initially carried 7.4 Methodology
7.4.1 Understanding and modelling pasture growth pulses
To understand, and then model, pasture growth pulses to derive pasture growth tables within the floodplains of the Channel Country, 17 sites were established to represent country types (land systems) and river systems. The sites were stratified across both, to account for possible differences in soils, rainfall and flooding conditions. For instance, soil type, depth, water holding capacity and fertility all influence pasture growth, and are accounted for within the different floodplain land systems. Cooper Creek, with a catchment of 296,000 km2 compared with a catchment of 158,000 km2 for the Diamantina River (White 2001), has slightly higher probabilities of flooding. It was thus also important to locate sites across the river systems to account for potential variability in flood frequency.
0
10
20
30
40
50
60
70
80
90
100
good handy gutter channel
flood rating
% o
f pot
entia
l
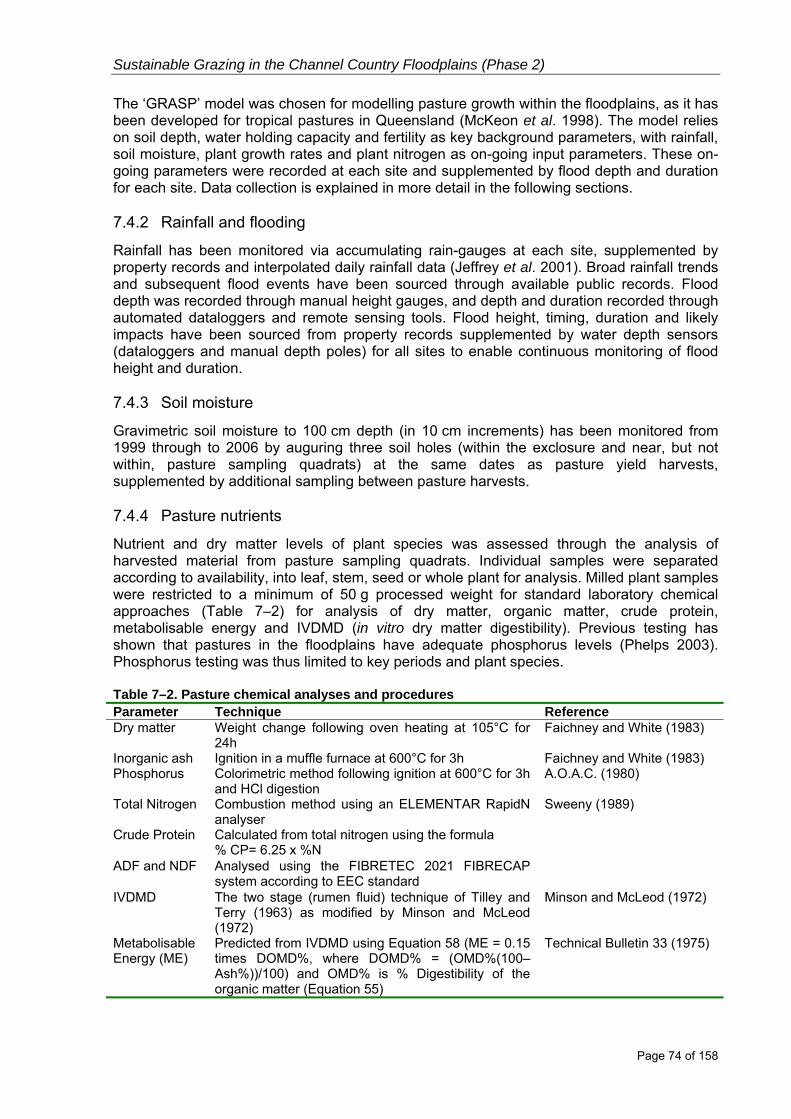
Sustainable Grazing in the Channel Country Floodplains (Phase 2)
Page 74 of 158
The ‘GRASP’ model was chosen for modelling pasture growth within the floodplains, as it has been developed for tropical pastures in Queensland (McKeon et al. 1998). The model relies on soil depth, water holding capacity and fertility as key background parameters, with rainfall, soil moisture, plant growth rates and plant nitrogen as on-going input parameters. These on-going parameters were recorded at each site and supplemented by flood depth and duration for each site. Data collection is explained in more detail in the following sections. 7.4.2 Rainfall and flooding
Rainfall has been monitored via accumulating rain-gauges at each site, supplemented by property records and interpolated daily rainfall data (Jeffrey et al. 2001). Broad rainfall trends and subsequent flood events have been sourced through available public records. Flood depth was recorded through manual height gauges, and depth and duration recorded through automated dataloggers and remote sensing tools. Flood height, timing, duration and likely impacts have been sourced from property records supplemented by water depth sensors (dataloggers and manual depth poles) for all sites to enable continuous monitoring of flood height and duration. 7.4.3 Soil moisture
Gravimetric soil moisture to 100 cm depth (in 10 cm increments) has been monitored from 1999 through to 2006 by auguring three soil holes (within the exclosure and near, but not within, pasture sampling quadrats) at the same dates as pasture yield harvests, supplemented by additional sampling between pasture harvests. 7.4.4 Pasture nutrients
Nutrient and dry matter levels of plant species was assessed through the analysis of harvested material from pasture sampling quadrats. Individual samples were separated according to availability, into leaf, stem, seed or whole plant for analysis. Milled plant samples were restricted to a minimum of 50 g processed weight for standard laboratory chemical approaches (Table 7–2) for analysis of dry matter, organic matter, crude protein, metabolisable energy and IVDMD (in vitro dry matter digestibility). Previous testing has shown that pastures in the floodplains have adequate phosphorus levels (Phelps 2003). Phosphorus testing was thus limited to key periods and plant species. Table 7–2. Pasture chemical analyses and procedures Parameter Technique Reference Dry matter Weight change following oven heating at 105°C for
24h Faichney and White (1983)
Inorganic ash Ignition in a muffle furnace at 600°C for 3h Faichney and White (1983) Phosphorus Colorimetric method following ignition at 600°C for 3h
and HCl digestion A.O.A.C. (1980)
Total Nitrogen Combustion method using an ELEMENTAR RapidN analyser
Sweeny (1989)
Crude Protein Calculated from total nitrogen using the formula % CP= 6.25 x %N
ADF and NDF Analysed using the FIBRETEC 2021 FIBRECAP system according to EEC standard
IVDMD The two stage (rumen fluid) technique of Tilley and Terry (1963) as modified by Minson and McLeod (1972)
Minson and McLeod (1972)
Metabolisable Energy (ME)
Predicted from IVDMD using Equation 58 (ME = 0.15 times DOMD%, where DOMD% = (OMD%(100–Ash%))/100) and OMD% is % Digestibility of the organic matter (Equation 55)
Technical Bulletin 33 (1975)

Sustainable Grazing in the Channel Country Floodplains (Phase 2)
Page 75 of 158
7.4.5 Yield and composition
Each of the 17 sites comprises a 1 to 2 ha exclosure to exclude cattle grazing and ensure measured pasture yields represent maximum growth. Measurements within each area are designed to quantify and understand floods and rainfall events and are based on the SWIFTSYND methodology of Day and Philp (1997) to meet the modelling requirements of the ‘GRASP’ pasture model (McKeon et al. 1990). The data collected from the SWIFTSYND monitoring will provide an insight into the soil and vegetation dynamics following different floods and will be used in modelling the floods to provide pasture growth tables. Table 7–3. Site locations in relation to Land System, sub-category (bluebush or lignum dominant) and river system Site number
Latitude5 S
Longitude E Land System
Sub-category River
1 24:49:44 139:38:20 C1 bluebush Georgina 2 26:42:42 139:28:35 C3* bluebush Diamantina 3 24:55:06 140:28:11 C1 bluebush Diamantina 4 26:46:04 141:59:36 C1 bluebush Cooper 5 25:38:58 142:12:39 C3* bluebush Cooper 6 23:29:26 139:49:09 C1 lignum Georgina 7 24:53:12 139:38:36 C1 lignum Georgina 8 24:50:39 140:35:13 C1 lignum Diamantina 9 27:03:56 138:31:55 C1 lignum Diamantina 10 25:41:04 142:10:25 C3* lignum Cooper 11 23:51:30 139:53:39 C2 open plains Georgina 12 25:12:53 140:43:56 C2 open plains Diamantina 13 23:31:01 141:22:04 C2 open plains Diamantina 14 25:52:09 141:56:55 C2 open plains Cooper 15 23:43:52 139:41:48 C3 outer channels Georgina 16 25:36:36 140:19:49 C3 outer channels Diamantina 17 25:49:48 142:01:06 C3 outer channels Cooper The measurements conducted at each site subsequent to flood and rainfall events have been:
• The yield of the five plant functional groups (bluebush, forbs, annual grasses, perennial grasses and other plants) comprising the pasture. Samples are harvested manually with hand shears from nine 1 m2 quadrats at four to six harvests per annum
• The height of the pasture from the same quadrats and at the same harvest dates • Ground cover (separated into green, dry, bare, rock, litter) from the same quadrats
and at the same harvest dates • Site and quadrat photographs at the same harvest dates, supplemented with
additional dates Site photographs were used to estimate yield at non-sampled dates, to estimate the yield of bluebush available as browse, to estimate the phase of growth (where 1=young fresh growth, 2=active growth, approaching flowering, 3=flowering/seed production and 4=senescence) of the dominant pasture component and to rank the quality according to potential cattle growth rates (where 1=good quality pasture, gaining >0.5 kg/head/day, 2=reasonable quality pasture, gaining 0.1 to 0.5 kg/head/day, 3= moderate quality pasture, maintaining–0.1 to 0.1 kg/head/day, 4=poor quality pasture, losing between 0.1 and 0.5 kg/head/day, and 5=extremely poor quality pasture, losing >0.5 kg/head/day). The quality rank was based on the visual estimation of a number of factors which impact on the ability of the animal to maintain liveweight, including greenness and apparent feed quality (including the probability 5 degrees:minutes:seconds, datum is GDA94 *originally classified as C1, revised based on local experience.
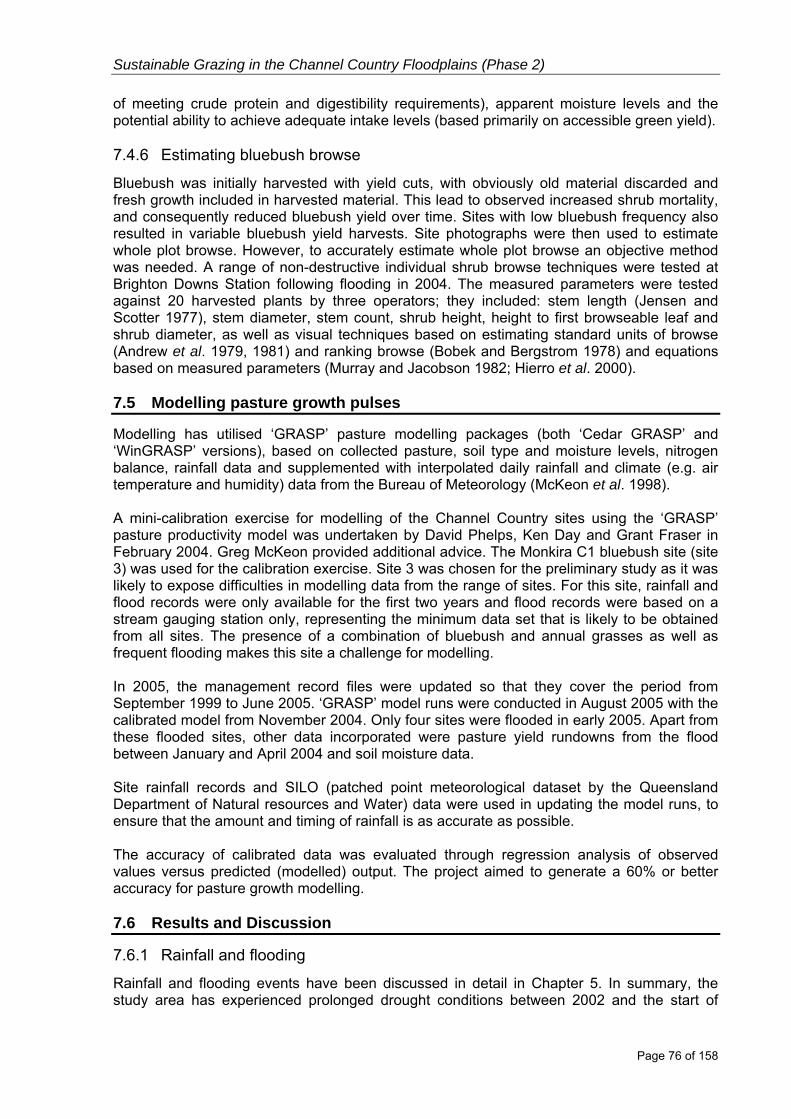
Sustainable Grazing in the Channel Country Floodplains (Phase 2)
Page 76 of 158
of meeting crude protein and digestibility requirements), apparent moisture levels and the potential ability to achieve adequate intake levels (based primarily on accessible green yield). 7.4.6 Estimating bluebush browse
Bluebush was initially harvested with yield cuts, with obviously old material discarded and fresh growth included in harvested material. This lead to observed increased shrub mortality, and consequently reduced bluebush yield over time. Sites with low bluebush frequency also resulted in variable bluebush yield harvests. Site photographs were then used to estimate whole plot browse. However, to accurately estimate whole plot browse an objective method was needed. A range of non-destructive individual shrub browse techniques were tested at Brighton Downs Station following flooding in 2004. The measured parameters were tested against 20 harvested plants by three operators; they included: stem length (Jensen and Scotter 1977), stem diameter, stem count, shrub height, height to first browseable leaf and shrub diameter, as well as visual techniques based on estimating standard units of browse (Andrew et al. 1979, 1981) and ranking browse (Bobek and Bergstrom 1978) and equations based on measured parameters (Murray and Jacobson 1982; Hierro et al. 2000). 7.5 Modelling pasture growth pulses
Modelling has utilised ‘GRASP’ pasture modelling packages (both ‘Cedar GRASP’ and ‘WinGRASP’ versions), based on collected pasture, soil type and moisture levels, nitrogen balance, rainfall data and supplemented with interpolated daily rainfall and climate (e.g. air temperature and humidity) data from the Bureau of Meteorology (McKeon et al. 1998). A mini-calibration exercise for modelling of the Channel Country sites using the ‘GRASP’ pasture productivity model was undertaken by David Phelps, Ken Day and Grant Fraser in February 2004. Greg McKeon provided additional advice. The Monkira C1 bluebush site (site 3) was used for the calibration exercise. Site 3 was chosen for the preliminary study as it was likely to expose difficulties in modelling data from the range of sites. For this site, rainfall and flood records were only available for the first two years and flood records were based on a stream gauging station only, representing the minimum data set that is likely to be obtained from all sites. The presence of a combination of bluebush and annual grasses as well as frequent flooding makes this site a challenge for modelling. In 2005, the management record files were updated so that they cover the period from September 1999 to June 2005. ‘GRASP’ model runs were conducted in August 2005 with the calibrated model from November 2004. Only four sites were flooded in early 2005. Apart from these flooded sites, other data incorporated were pasture yield rundowns from the flood between January and April 2004 and soil moisture data. Site rainfall records and SILO (patched point meteorological dataset by the Queensland Department of Natural resources and Water) data were used in updating the model runs, to ensure that the amount and timing of rainfall is as accurate as possible. The accuracy of calibrated data was evaluated through regression analysis of observed values versus predicted (modelled) output. The project aimed to generate a 60% or better accuracy for pasture growth modelling. 7.6 Results and Discussion
7.6.1 Rainfall and flooding
Rainfall and flooding events have been discussed in detail in Chapter 5. In summary, the study area has experienced prolonged drought conditions between 2002 and the start of

Sustainable Grazing in the Channel Country Floodplains (Phase 2)
Page 77 of 158
2006, interspersed by small to moderate flood events. In the period of 1999 to 2006, the Cooper had a total of 12 flood events, the Diamantina 7 events and the Georgina 7 events. Also in this period, the C1 sites (sites 1–10) experienced 2 to 6 floods, the C3 sites 2 to 5 floods and the C2 sites 2 to 5 floods. On some occasions not all sites were flooded during catchment flood events whilst some sites may have experienced two flood events from multiple peaks of a single catchment flood. 7.6.2 Pasture nutrient levels
Chemical analyses indicate that it is possible that protein and digestibility measured at peak yield (maximum yield, generally as seed heads are forming) is higher for perennial and annual grasses and bluebush from the Georgina River than that of either the Diamantina or the Cooper. It is also possible that perennial and annual grasses in C1 lignum sites are higher in protein and digestibility than that of other land systems (Table 7–4). Table 7–4. Average protein (%), digestibly (IVDMD %) and phosphorus (P %) within plant categories of perennial grass, annual grass, bluebush, forbs and other plants across a) River systems and b) land systems a) Rivers Plant group Category Cooper Diamantina Georgina Perennial grass Protein (%) 6.4 5.6 7.7 IVDMD (%) 42.3 39.2 44.1 P (%) 0.22 0.21 0.28 Annual grass Protein (%) 7.7 7.9 10.3 IVDMD (%) 44.6 55.3 60.5 P (%) 0.21 0.35 0.30 Bluebush Protein (%) 13.0 12.0 16.8 IVDMD (%) 59.5 51.1 58.4 P (%) 0.19 0.18 0.23 Forbs Protein (%) 12.8 12.1 12.7 IVDMD (%) 59.6 59.0 61.3 P (%) 0.32 0.37 0.36 Other plants Protein (%) 8.2 6.8 6.5 IVDMD (%) 41.9 43.6 43.4 P (%) 0.30 b) Land systems Plant group Category C1 bluebush C1 lignum C3 C2 Perennial grass Protein (%) 5.9 7.3 5.8 6.2 IVDMD (%) 43.0 42.2 44.7 40.1 P (%) 0.22 0.29 0.20 0.20 Annual grass Protein (%) 7.6 10.8 7.5 IVDMD (%) 53.3 62.0 50.4 P (%) 0.29 0.32 0.38 Bluebush Protein (%) 14.4 8.5 13.9 IVDMD (%) 54.9 44.7 60.8 P (%) 0.20 0.19 Forbs Protein (%) 11.6 12.1 13.8 13.9 IVDMD (%) 58.5 59.1 61.0 63.5 P (%) 0.36 0.36 0.29 0.37 Other plants Protein (%) 7.7 6.5 IVDMD (%) 42.4 43.4 P (%) 0.30

Sustainable Grazing in the Channel Country Floodplains (Phase 2)
Page 78 of 158
7.6.3 Yield and composition
One example of site yields and major species composition from 1999 to 2005 from each of the land systems are presented in Figure 7–3 a) to e). Peak flood height and duration (where available) from nearest neighbour BoM flood gauging stations are included as a guide to flood events during this period. The point at which the opposite Y-axis crosses the X-axis has been manipulated such that the flood categories approximate the total pasture yield expected within each flood category. This is representative of sites in which a Channel Flood does not provide sufficient inundation to promote pasture growth (Figure 7–3 a), b), d), e)) whilst site 6 (Figure 7–3 c)), a C3 lignum swamp, does produce a small body of pasture growth following a Channel Flood. This could largely be attributed to the slow draining nature of the C3 land system in which the effective inundation of the small flood is enhanced. Conversely, the total pasture yield of this site during a Good Flood is lower relative to that of other sites and equates to a comparable yield of site 3 (Figure 7–3 b)) under a Handy Flood. The Steering Committee have stressed that the height of a flood alone is not sufficient to make predictions about expected pasture response and that the duration of the flood must be accounted for. In January of 1999, site 13 (Figure 7–3 d)) experienced a flood 1.4 m in excess of the classification of a Good Flood. However this flood was of only a short duration and failed to result in a pasture response; likewise for Sites 3 and 16 (Figures 7-4 a), e)) at 0.65 m in excess of a Good Flood but also of short durations. The highest yield (of just over 6000 kg/ha) was recorded at Site 5 (a C3 site on the Cooper dominated by bluebush) following the 2000 flood (Figure 7–3 b). The yield at Site 5 was dominated by forbs. Yield at Sites 6 (C1 lignum, Georgina River) and 16 (C3, Diamantina River) were also dominated by forbs, whilst the yield at Sites 3 (C1 bluebush, Diamantina River) and 13 (C2, Diamantina River) were dominated by forbs.
a) Site 3 (C1 bluebush)

Sustainable Grazing in the Channel Country Floodplains (Phase 2)
Page 79 of 158
b) Site 5 (C3 bluebush)
c) Site 6 (C1 lignum)

Sustainable Grazing in the Channel Country Floodplains (Phase 2)
Page 80 of 158
Figure 7–3. Harvested pasture component (perennial grass, annual grass, bluebush, forbs and other plants) and total yields (kg/ha) between April 1999 and August 2005 in relation to flood events at a) Site 3, b) Site 5, c) Site 6, d) Site 13 and e) Site 16. Flood height, duration and category (Good, Handy, Gutter or Channel) descriptions are for the nearest flood gauging station
d) Site 13 (C2)
e) Site 16 (C3)
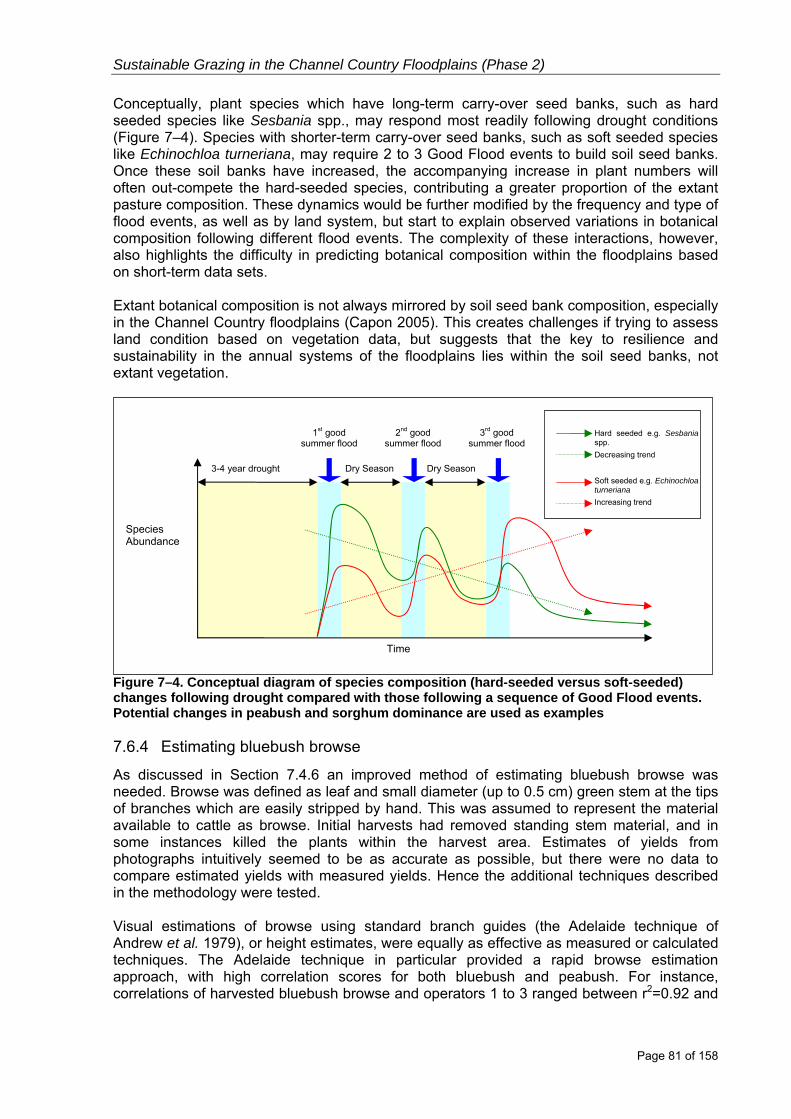
Sustainable Grazing in the Channel Country Floodplains (Phase 2)
Page 81 of 158
Conceptually, plant species which have long-term carry-over seed banks, such as hard seeded species like Sesbania spp., may respond most readily following drought conditions (Figure 7–4). Species with shorter-term carry-over seed banks, such as soft seeded species like Echinochloa turneriana, may require 2 to 3 Good Flood events to build soil seed banks. Once these soil banks have increased, the accompanying increase in plant numbers will often out-compete the hard-seeded species, contributing a greater proportion of the extant pasture composition. These dynamics would be further modified by the frequency and type of flood events, as well as by land system, but start to explain observed variations in botanical composition following different flood events. The complexity of these interactions, however, also highlights the difficulty in predicting botanical composition within the floodplains based on short-term data sets. Extant botanical composition is not always mirrored by soil seed bank composition, especially in the Channel Country floodplains (Capon 2005). This creates challenges if trying to assess land condition based on vegetation data, but suggests that the key to resilience and sustainability in the annual systems of the floodplains lies within the soil seed banks, not extant vegetation.
Figure 7–4. Conceptual diagram of species composition (hard-seeded versus soft-seeded) changes following drought compared with those following a sequence of Good Flood events. Potential changes in peabush and sorghum dominance are used as examples 7.6.4 Estimating bluebush browse
As discussed in Section 7.4.6 an improved method of estimating bluebush browse was needed. Browse was defined as leaf and small diameter (up to 0.5 cm) green stem at the tips of branches which are easily stripped by hand. This was assumed to represent the material available to cattle as browse. Initial harvests had removed standing stem material, and in some instances killed the plants within the harvest area. Estimates of yields from photographs intuitively seemed to be as accurate as possible, but there were no data to compare estimated yields with measured yields. Hence the additional techniques described in the methodology were tested. Visual estimations of browse using standard branch guides (the Adelaide technique of Andrew et al. 1979), or height estimates, were equally as effective as measured or calculated techniques. The Adelaide technique in particular provided a rapid browse estimation approach, with high correlation scores for both bluebush and peabush. For instance, correlations of harvested bluebush browse and operators 1 to 3 ranged between r2=0.92 and
Time
3-4 year drought Dry Season Dry Season
1st good summer flood
2nd good summer flood
3rd good summer flood
Species Abundance
Hard seeded e.g. Sesbaniaspp.
Decreasing trend
Soft seeded e.g. Echinochloaturneriana
Increasing trend

Sustainable Grazing in the Channel Country Floodplains (Phase 2)
Page 82 of 158
r2=0.95. Further testing of this technique has been conducted and it is proving to be both accurate and efficient in estimating the browse of individual shrubs. Leaf weight and green stem were the best of the measured parameters, whilst stem diameter returned a poor correlation for bluebush. The latter was due to difficulties in determining the correct location to measure stem diameter on the multi-stemmed and multi-branched bluebush shrubs (Table 7–5). To be most effective in a research or management context, a reliable technique to estimate shrub density is required. Within sites, shrub density has been estimated by counting plants within strips (sans Etienne 1989). This appears to be adequate but remains to be quantified. It is doubtful that managers within the Channel Country would use the technique for routine management. Moreover, photo-guides based on a combination of plant density and individual plant browse may be a more useful management tool for feed budgeting activities. Table 7–5. Correlation values (r2) of visual, measured and diameter based calculated parameters for estimating bluebush and peabush browse (kg/plant). Highlighted values are significant (P<0.01) TECHNIQUE Bluebush Peabush VISUAL ESTIMATIONS Operator 1 standard unit estimate 0.95 0.97 Operator 2 standard unit estimate 0.92 0.99 Operator 3 standard unit estimate 0.95 0.94 Operator 1 height class estimate 0.74 0.77 Operator 2 height class estimate 0.85 0.77 Operator 3 height class estimate 0.85 0.77 Operator 1 browse rank 0.61 –0.57 Operator 1 browse rank 0.58 –0.48 Operator 1 browse rank 0.59 –0.63 MEASURED PARAMETERS Stem diameter (mm) 0.67 0.92 Maximum height (cm) 0.79 0.86 Height to browse (cm) 0.84 0.86 Seeding stem weight 0.96 Dead stem weight 0.67 Leaf weight 0.95 0.98 Green stem weight 0.97 1.00 Dead stem weight 0.25 Seed weight 0.93 Diameter (average) 0.93 0.98 DIAMETER BASED CALCULATIONS Ellipsoid 0.91 0.98 Inverted cone 0.91 0.98 Upper spheroid 0.91 0.98 Upper prolate spheroid 0.91 0.98 Cylinder 0.91 0.98 Crown area 0.93 0.98 Elliptical crown 0.93 0.98
7.7 Modelling pasture growth pulses
7.7.1 Setting ‘GRASP’ parameters
Initial attempts at modelling pasture growth involved adjusting the parameters that limit growth such as the available nitrogen uptake (kg/ha) and soil water index (where growth stops to non-limiting values). Nitrogen limitations were thought to be unlikely as the soils are

Sustainable Grazing in the Channel Country Floodplains (Phase 2)
Page 83 of 158
considered to be quite fertile. Parameters were set for pasture growth using a number of combinations of the two growth models within ‘GRASP’ – regrowth model and the transpiration efficiency model. The optimal combinations of these parameters, such that the peak yields were attained, were:
1. Regrowth Rate 15, Transpiration Efficiency 0 2. Regrowth Rate 12.5, Transpiration Efficiency 6 3. Regrowth Rate 2.5, Transpiration Efficiency 7.
However these simulations did not show the rapid growth spurt after flooding and it was necessary to use a regrowth rate of 12.5 and a transpiration efficiency of 12. By using the higher growth parameter values the peak yields were over estimated and it was necessary to limit growth using a nitrogen uptake limitation. The peak nitrogen uptake limitation was set to 17 kg/ha, which closely resembles the maximum field measured values at this site. There are two possible reasons for using the nitrogen uptake parameter to limit growth at this site:
• The annual plants have to establish both root and shoot systems after flooding. Hence a large majority of nitrogen could have been used in developing the root system in the annuals. Measurements of nitrogen uptake for ‘GRASP’ parameter setting have predominantly been taken in perennial systems where the majority of nitrogen uptake by the plant is likely to have been used for above ground growth.
• The nitrogen uptake value is acting as a surrogate to represent the determinate growth (phenological characteristics) of the annuals in these systems which have evolved to set seed rapidly to ensure future survival.
After the rapid growth spurt, the annual plants rapidly disappeared and hence a high detachment rate was set (0.0075), three times the rate for black speargrass used in the classic perennial model. Despite the apparent difficulties with modelling in the Channel Country, changes to a few key parameters (Table 7–6) allowed for a reasonable simulation to be achieved. This parameter set provides the basis for further testing within the floodplains, and may serve as a guide to other annual systems on cracking clay soils. Table 7–6. Adjusted values for key model parameters at the Monkira C1 bluebush site, compared with standard black speargrass model values Parameter Parameter
number Adjusted value
Black speargrass value
Regrowth rate 6 12.5 2.0 Transpiration use efficiency 7 12.0 15.0 Nitrogen uptake 99 17.0 23.0 Maximum % nitrogen in plants 100 1.5 2.5 % N where growth stops 101 0.6 0.4 % N where growth is restricted 102 1.1 0.5 Soil water index where growth stops 149 0.01 0.2 Soil water index at which cover is restricted 9 0.01 0.4 Relative supply for layer 3 106 0.2 0.5 Detachment rate for leaf (wet season) 128 0.0075 0.002 Detachment rate for stem (wet season) 129 0.0075 0.002 Detachment rate for leaf (dry season) 130 0.0075 0.002 Detachment rate for stem (dry season) 131 0.0075 0.002 Cracking 35 On (1) Off (0) Evaporation when soil is cracked 36 0.1 0.0 7.7.2 Calibrating ‘GRASP’ for improved accuracy
The Channel Country floodplain sites proved challenging to calibrate, as not only is the system flood-fed but there is also a mix of perennial and annual pasture species. The

Sustainable Grazing in the Channel Country Floodplains (Phase 2)
Page 84 of 158
0
200
400
600
800
1000
1200
1400
10/02/00 28/08/00 16/03/01 02/10/01 20/04/02 06/11/02 25/05/03
Use
ful B
lueb
ush
Yie
ld (K
g/H
a)
Observed Useful Bluebush Yield
Simulated loss of useful Bluebush yield note: Daily Decay Rate = 0.0034*Useful BluebushYield (Kg/ha)
annuals consist of a variety of grass and forb species, the botanical composition of which appears to change depending on the timing of flood and rainfall events (e.g. from native sorghum dominance with summer floods to Cooper clover dominance with winter floods). Difficulties arose in modelling where there was more than one flood peak. It was difficult to determine when to reset the pasture yield when two floods occurred in relatively close succession. The overall duration could be as simple as the duration of the full period, including the non-flooded time, but this could lead to inconsistencies where pasture growth has commenced prior to the second peak arriving. The second flood could, depending on its duration, retard or enhance the growth produced from the first peak. For example, ‘GRASP’ seems to substantially over predict growth at Site 8 and Site 6, but not Site 7 (Appendix 13.3). All had a double flood, although the second flood at Site 7 was only 5 cm depth (Chapter 6). There may also be more work required to accurately estimate detachment rates at some sites. For instance, Site 1 pasture decline was overestimated compared with actual data. Difficulties were encountered in earlier attempts at modeling biomass of Site 3 due to the presence of bluebush. Bluebush retains a large proportion of biomass during dry periods unlike the annual vegetation, which declines rapidly. The large amount of biomass contributed by the bluebush during the dry periods is both inedible and unlikely to affect the water balance as it lies in a dormant state. Hence the difficulties associated with the large yield contributed by bluebush were overcome by removing the residual non-palatable perennial biomass of bluebush. The remaining yield of bluebush (browse, or useful yield) was categorized as useful bluebush yield and was added to the other perennial and annual biomasses. The decline in useful bluebush yield after the 2000 flood was graphed and an equation was developed to simulate this yield decline (Figure 7–5)).
Figure 7–5. Observed and simulated useful bluebush yield for the Monkira bluebush site Another problem encountered during previous attempts to model Site 3 was that the model was underestimating the biomass for a considerable amount of the time (Figure 7–6 a)). A closer look at the site photos indicated that during these times observations included a large amount of dead material lying on the ground. This material was acting more like a litter pool, as there was little edible material; hence the observations have overestimated the total standing dry matter. A review of existing photographs and changes to field protocols will allow for better estimates of the standing dry matter for future modelling runs. Adjustments will be
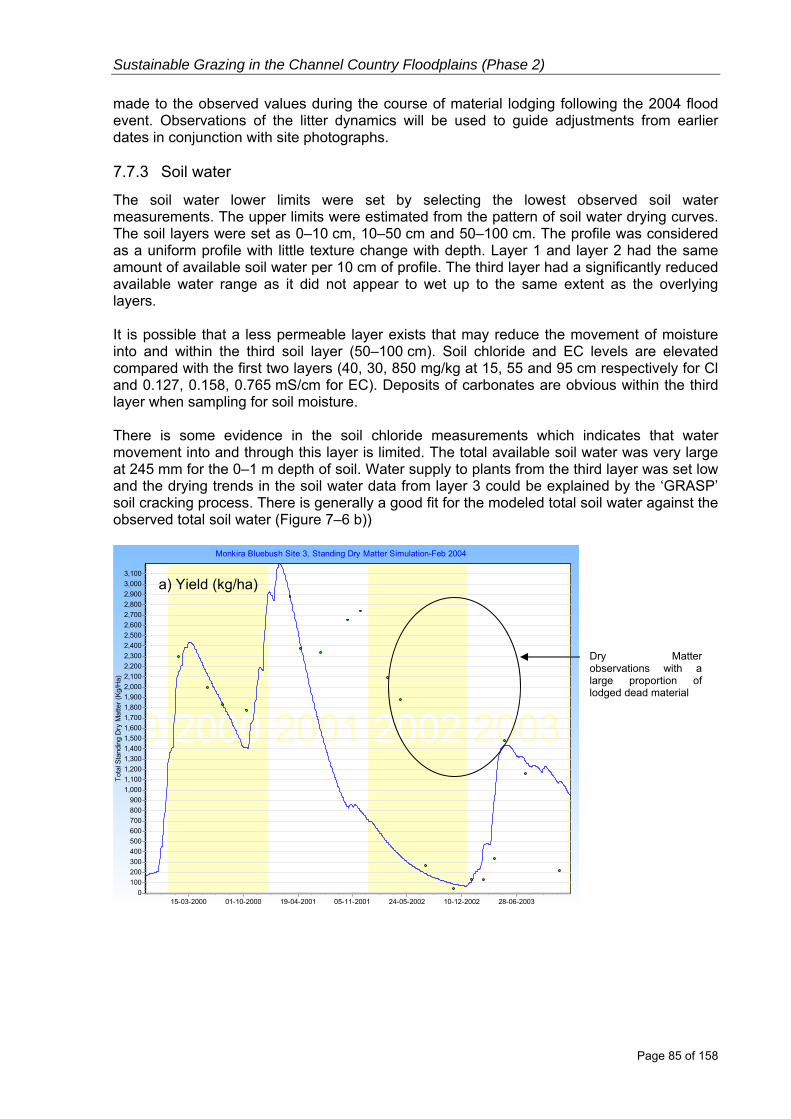
Sustainable Grazing in the Channel Country Floodplains (Phase 2)
Page 85 of 158
made to the observed values during the course of material lodging following the 2004 flood event. Observations of the litter dynamics will be used to guide adjustments from earlier dates in conjunction with site photographs. 7.7.3 Soil water
The soil water lower limits were set by selecting the lowest observed soil water measurements. The upper limits were estimated from the pattern of soil water drying curves. The soil layers were set as 0–10 cm, 10–50 cm and 50–100 cm. The profile was considered as a uniform profile with little texture change with depth. Layer 1 and layer 2 had the same amount of available soil water per 10 cm of profile. The third layer had a significantly reduced available water range as it did not appear to wet up to the same extent as the overlying layers. It is possible that a less permeable layer exists that may reduce the movement of moisture into and within the third soil layer (50–100 cm). Soil chloride and EC levels are elevated compared with the first two layers (40, 30, 850 mg/kg at 15, 55 and 95 cm respectively for Cl and 0.127, 0.158, 0.765 mS/cm for EC). Deposits of carbonates are obvious within the third layer when sampling for soil moisture. There is some evidence in the soil chloride measurements which indicates that water movement into and through this layer is limited. The total available soil water was very large at 245 mm for the 0–1 m depth of soil. Water supply to plants from the third layer was set low and the drying trends in the soil water data from layer 3 could be explained by the ‘GRASP’ soil cracking process. There is generally a good fit for the modeled total soil water against the observed total soil water (Figure 7–6 b))
Monkira Bluebush Site 3, Standing Dry Matter Simulation-Feb 2004
9 2000 2001 2002 2003
28-06-200310-12-200224-05-200205-11-200119-04-200101-10-200015-03-2000
Tota
l Sta
ndin
g D
ry M
atte
r (Kg
/Ha)
3,1003,0002,9002,8002,7002,6002,5002,4002,3002,2002,1002,0001,9001,8001,7001,6001,5001,4001,3001,2001,1001,000
900800700600500400300200100
0
Dry Matter observations with a large proportion of lodged dead material
a) Yield (kg/ha)

Sustainable Grazing in the Channel Country Floodplains (Phase 2)
Page 86 of 158
Monkira Bluebush Site 3 - Feb 2004
999 2000 2001 2002 2003 2
14-01-200428-06-200310-12-200224-05-200205-11-200119-04-200101-10-200015-03-200028-08-1999
Tota
l Soi
l Wat
er (0
-100
cm)
(mm
)3403303203103002902802702602502402302202102001901801701601501401301201101009080706050403020100
Figure 7–6. Observed (points) and predicted (continuous line) data for a) yield (kg/ha) and b) soil moisture (total soil water content (mm) to a depth of 1 m) for the Monkira bluebush site. The circled data in a) indicates where measured standing dry matter yields have been over-estimated through the inclusion of lodged material Following the calibration exercise described above, the accuracy of modelled output (as gauged by the regression of observed versus predicted yield data points) was improved from an R2 value of 0.03 to 0.77. 7.7.4 Model calibration accuracy
Regressions of the observed versus predicted yield data points provide a guide to the accuracy of the calibration for each site, and hence the accuracy of the model runs to the final calibration date (November 2004, Figure 7–7). Such validation data points need to be independent of the calibration exercise but there are insufficient data points to gauge the accuracy of further predictions from the ‘GRASP’ model as, in general, there has been only a single flood event (3 to 4 data points) since the calibration exercise. Most sites have been calibrated relatively accurately, especially given that the parameters for ‘GRASP’ were developed within perennial grass, rain-fed systems. The C2 (outer-plains) sites (Sites 11–14) show the highest calibration regressions (R2 values of 0.89 to 0.97). Growth at these sites is generally dominated by annual grasses and forbs. Growth at C2 sites can be initiated by rainfall as well as flooding. The C1 bluebush sites (areas close to channels dominated by bluebush) (Sites 1 to 5) have been calibrated relatively well (R2 values of 0.77 to 0.96), but there is the need for further refinement for Sites 3 to 5. The C1 lignum sites (areas close to channels dominated by lignum) (Sites 6–10) generally require further refinement, with R2 values in the range of 0.62 to 0.93. The C1 sites have grown a range of species groups including native sorghum (tall annual grasses) through to annual forbs and perennial sedges. Two of the six C3 sites (run-on or swampy areas) (Sites 15–17) require additional calibration to provide useful modelled output. Site 16 was calibrated reasonably well (R2 of 0.77) up to
b) soil moisture

Sustainable Grazing in the Channel Country Floodplains (Phase 2)
Page 87 of 158
flooding and rainfall received during 2003. The inclusion of the data from a small flood in April 2003 leads to an extremely poor R2 of 0.04, as ‘GRASP’ substantially overestimates the growth from this event. The 15–20 cm flood in 2003 was preceded by 95 mm of rainfall, leading a relatively wet modelled soil profile when the flooding occurred. This probably accounts for the over-estimation, and suggests the potential for over-estimation of modelled pasture growth in similar circumstances for other sites. The 2004 flood, which was not preceded by soaking rains, was predicted with similar accuracy to other events. Growth following the 2003 flood was dominated by Ipomoea spp., which require inundation to effectively germinate and grow (Capon 2003). It is thus possible that ‘GRASP’ over-predicted growth because of pasture parameters which assumed germination following 95 mm rain, and further growth based on additional moisture following flooding. In reality, there was little response to the 95 mm of rain (personal observation), and germination did not commence until the flooding event in April (Table 7–7). This event serves to again highlight difficulties in predicting botanical composition, but also highlights the potential for low predictability of future events in the absence of further data to capture variable botanical composition responses and validate current modelling. Table 7–7. The date sequences of rainfall and flooding events at Site 16 during a period of poor ‘GRASP’ pasture growth model accuracy in 2003 Date Rain and flood events 28–Feb–03 95 mm rain 4–Apr–03 15–20 cm flood; 10 mm rain 17–May–03 37 mm rain 12–Jun–03 5 mm rain 21–Jul–03 13 mm rain 26–Sep–03 11 mm rain 5–Dec–03 14 mm rain

Sustainable Grazing in the Channel Country Floodplains (Phase 2)
Page 88 of 158
0 1000 2000 3000 4000
1000
2000
3000
4000
5000Site 1C1 bluebush
Georgina
R2=0.920 500 1000 1500 2000
500
1000
1500
2000Site 2C1 bluebushDiamantina
R2=0.960 1000 2000 3000 4000 5000
1000
2000
3000
4000
5000Site 3C1 bluebushDiamantina
R2=0.770 1000 2000 3000 4000
1000
2000
3000
4000Site 4C1 bluebush
Cooper
R2=0.810 1000 2000 3000 4000
1000
2000
3000
4000
5000Site 5C1 bluebush
Cooper
R2=0.81
0 500 1000 1500 2000 2500 3000
1000
2000
3000
4000
TSDM (observed)
TSD
M(p
redi
cted
)
Site 6C1 lignumGeorgina
R2=0.760 1000 2000 3000 4000
1000
2000
3000
4000Site 7C1 lignumGeorgina
R2=0.620 500 1000 1500 2000
500
1000
1500
2000Site 8C1 lignum
Diamantina
R2=0.800 500 1000 1500 2000
500
1000
1500
2000
2500Site 9C1 lignum
Diamantina
R2=0.890 500 1000 1500 2000 2500
500
1000
1500
2000
2500
3000Site 10C1 lignum
Cooper
R2=0.93
0 500 1000 1500 2000
500
1000
1500
2000
2500
3000Site 11
C2Georgina
R2=0.910 500 1000 1500
500
1000
1500Site 12
C2Diamantina
R2=0.970 500 1000 1500 2000 2500 3000
500
1000
1500
2000
2500
3000Site 13
C2Diamantina
R2=0.91
0 500 1000 1500 2000 2500
1000
2000
3000
4000Site 14
C2Cooper
R2=0.89
0 500 1000 1500 2000 2500
500
1000
1500
2000
2500Site 15
C3Georgina
R2=0.410 500 1000 1500
500
1000
1500Site 16 (all years)
C3Diamantina
R2=0.04
0 500 1000 1500
500
1000
1500
2000Site 17
C3Cooper
R2=0.94
0 500 1000 1500
500
1000
1500Site 16 (2003 excluded)
C3Diamantina
R2=0.70
Figure 7–7. Observed versus predicted total standing dry matter (TSDM) (measured as kg/ha) for all 17 sites within C1 bluebush, C1 lignum, C2 or C3 land systems on the Channel Country floodplains of Cooper Creek and the Diamantina and Georgina Rivers (as indicated by annotations on each graph). R2 values of the regression (forced through the origin) are indicated for each location. Site 16 is presented as a complete data set and with data from a difficult to predict flood event in 2003 excluded for comparison.

Sustainable Grazing in the Channel Country Floodplains (Phase 2)
Page 89 of 158
7.7.5 ‘GRASP’ modelled output
The predicted growth (and observed values) between 1999 and 2005 is shown for representative sites from C1 bluebush (Site 3, Site 5), C1 lignum (Site 6), C2 (Site 13) and C3 (Site 16) land systems. These sites had regression values of 0.77, 0.81, 0.76, 0.91 and 0.04 respectively (Figure 7–7). The sites with high regressions show a good match for observed values and modelled growth whilst the poor match for Site 16 in 2003 is clearly shown in Figure 7–8 e)
Figure 7–8. Modelled (solid line) ‘GRASP’ pasture growth for a) Site 3; b) Site 5; c) Site 6; d) Site 13 and e) Site 16, compared with observed (points) values
Site 3
B r i g h t o n D o w n s - S t a n d i n g D r y M a t t e r
0 0 0 2 0 0 1 2 0 0 2 2 0 0 3 2 0 0
0 1 - 0 8 - 2 0 0 41 4 - 0 1 - 2 0 0 42 8 - 0 6 - 2 0 0 31 0 - 1 2 - 2 0 0 22 4 - 0 5 - 2 0 0 20 5 - 1 1 - 2 0 0 11 9 - 0 4 - 2 0 0 10 1 - 1 0 - 2 0 0 01 5 - 0 3 - 2 0 0 0
Tota
l Sta
ndin
g D
ry M
atte
r (Kg
/ha)
2 , 8 0 0
2 , 7 0 0
2 , 6 0 0
2 , 5 0 0
2 , 4 0 0
2 , 3 0 0
2 , 2 0 0
2 , 1 0 0
2 , 0 0 0
1 , 9 0 0
1 , 8 0 0
1 , 7 0 0
1 , 6 0 0
1 , 5 0 0
1 , 4 0 0
1 , 3 0 0
1 , 2 0 0
1 , 1 0 0
1 , 0 0 0
9 0 0
8 0 0
7 0 0
6 0 0
5 0 0
4 0 0
3 0 0
2 0 0
1 0 0
0
G r a s p D a t a T S D M ( D a i l y )G r a s p D a t a t s d m O ( D a i l y )
D u r r i e T S D M
2 0 0 1 2 0 0 2 2 0 0 3 2 0 0
0 1 - 0 8 - 2 0 0 41 4 - 0 1 - 2 0 0 42 8 - 0 6 - 2 0 0 31 0 - 1 2 - 2 0 0 22 4 - 0 5 - 2 0 0 20 5 - 1 1 - 2 0 0 11 9 - 0 4 - 2 0 0 1
Tota
l Sta
ndin
g D
ry M
atte
r (kg
/ha)
1 , 2 5 0
1 , 2 0 0
1 , 1 5 0
1 , 1 0 0
1 , 0 5 0
1 , 0 0 0
9 5 0
9 0 0
8 5 0
8 0 0
7 5 0
7 0 0
6 5 0
6 0 0
5 5 0
5 0 0
4 5 0
4 0 0
3 5 0
3 0 0
2 5 0
2 0 0
1 5 0
1 0 0
5 0
0
a
b
c
e
d

Sustainable Grazing in the Channel Country Floodplains (Phase 2)
Page 90 of 158
7.7.6 Indicative pasture growth tables
Pasture growth tables (Table 7–8) are based on flood categories, with regard for land system position in the landscape and hence flooding frequency and depth. The C2 Land systems are the least frequently flooded, either because they are on the outer margins of the floodplains or because they are slightly raised ridges within the floodplains. The result in each instance is lower flood height and duration, and a lack of pasture growth under Channel and Gutter Floods, as these areas are not inundated during these small flood events. Shallow flooding over a limited area, leads to lower yields following a Handy Flood. During a Good Flood however, most of the C2 areas are inundated, resulting in better pasture growth than the ‘current swept’ C1 locations. Table 7–8. Indicative pasture yields (kg/ha) within the flood categories Good, Handy, Gutter and Channel Flood type C1 C2 C3
Good 1200–2500 1500–3500 4500–8000
Handy 750–1500 100–250 3500–6500
Gutter 400–1200 none 2000–4500
Channel 250–750 none 1200–2500
7.8 Conclusion
‘GRASP’ has been calibrated for 16 of the 17 sites located on floodplains, with an accuracy of at least 60%. One site has over-predicted pasture response from a flood in 2003. These results indicate that pasture growth tables can be developed for Good, Handy, Gutter and Channel Flood categories, but that further data collection is needed to validate the predictive power of ‘GRASP’ in the floodplains. 8 Monitoring for Land Condition in the Floodplains 8.1 Introduction
Sustainably grazed ecosystems are needed in these areas to ensure the longevity of both the unique natural resources and the valuable cattle grazing industry. Both private land holders and pastoral companies have strongly indicated a desire to know if their current grazing practices are sustainable, what practices (if any) need changing to ensure sustainability and how current sustainable practices can be documented and promoted. One of the key issues at the start of the project was the lack of documented scientific evidence which demonstrates sustainable practices, or the need for improvement. Land condition is a key indicator of sustainable production. In a production context, land condition is defined by Chilcott et al. (2004) as ‘the capacity of the land to grow useful fodder’. Evidence of changes in land condition is limited to anecdotal accounts (e.g. Edmondston 2000) and one reported sampling date (Phelps et al 2003). 8.2 Methodology
8.2.1 Monitoring grazing impacts
Monitoring of changes resulting from exclusion from grazing was included as an objective due to increasing interest from industry (Phelps et al 2003). The same exclosures used for

Sustainable Grazing in the Channel Country Floodplains (Phase 2)
Page 91 of 158
SWIFTSYND measurements of soil moisture and pasture yield for modelling purposes (Chapter 7) were used to monitor changes resulting from excluding grazing compared with maintaining grazing. Since these sites were selected initially to represent land systems, rather than land condition or potential grazing impacts, they lack a structured design in relation to grazing pressure. To account for potential differences in grazing pressure across the 17 grazed sites, their proximities to water points and other infrastructure (e.g. major cattle yards) were estimated through GIS with infrastructure layers, recent Landsat imagery and site location. The sites provide an indicative comparison of ungrazed areas with areas open to normal levels of grazing by cattle through a short time frame. Species presence and total yield were recorded in 30 permanently marked quadrats, each 1 m2, along one transect within each of the grazed and exclosed SWIFTSYND areas of each site using the BOTANAL visual estimation method of Tothill et al. (1992). Assessments have been made on 10 occasions between July 2002 and November 2005, with cover included from 2004 onwards. Total yield, species yield and ground cover data from each date were analysed at each date separately, assuming that grouping within land system and river system provided a valid (if broad) level of replication. Data were analysed within the statistical analysis package ‘GenStat’ using a generalised linear model (REML) with transect as the fixed term and a variable term of (Land System + River System)/site (Phelps et al 2003). Similar analyses were conducted to compare River and Land systems. 8.2.2 Incorporating local/experiential knowledge
The project Steering Committee has been frequently consulted to interpret the results of potential grazing impacts throughout the project. The committee have been critical in providing interpretations and proposing hypotheses of changes in pasture yield, composition and cover. 8.2.3 Vegetation differences
Field data has been collated and preliminary graphs of observed trends were produced and reviewed by the Steering Committee. Limited data were available, with 15 of 17 sites experiencing minor flooding in 2004, and only 5 sites experiencing minor flooding in 2005; none of these flood events promoted good pasture growth responses. Trends in ground cover and yield at non-flooded sites reflect the rate of decline in ground cover and yield, rather than changes due to grazing per se. Ground cover data from December 2004 to November 2005 were presented to the Steering Committee. With the exception of Site 5 (C1 bluebush, Figure 8–1 a)), ground cover was lower in grazed sites than in ungrazed sites. These differences in ground cover ranged from minimal to large (e.g. Site 7, C1 lignum, Figure 8–1 b)). Total pasture yield and botanical composition data were also presented. Total yield was generally lower in grazed transects than in ungrazed transects, following similar trends to ground cover. There was a lack of consistent trends within botanical composition data. 8.3 Results and Discussion
Total yield was consistently lower in grazed than ungrazed transects, with significant differences in July 2002, April 2003, July 2003, December 2004 and March 2005 (Table 8–1 a)). There were differences in species group yields on only two occasions (annual grass in December 2004 and forbs in November 2005). Ground cover was lower in grazed than ungrazed areas (Table 8–1 b)) on each recording date. However, it would be expected that

Sustainable Grazing in the Channel Country Floodplains (Phase 2)
Page 92 of 158
the presence of grazing would lead to reductions in yield and cover, consistent with other rangeland pasture systems. Transect differences in yield were absent at peak growth following summer flood events in 2003 and 2004, but present in 2005 (see Chapter 6 for a description of flood events).

Sustainable Grazing in the Channel Country Floodplains (Phase 2)
Page 93 of 158
The most common species (those species found in abundance on more than two occasions) were the annual grasses Echinochloa turneriana and Iseilema sp., the perennial grass Sporobolus mitchellii, the semi-aquatic annual forb Ipomoea sp., the annual legume Sesbania sp., the semi-aquatic fern Marsilea drummondii, the perennial sedges Cyperus exaltatus, Cyperus gymnocaulos, and Epaltes cunninghamii and the annual forb Calotis spp. (Table 8–2). All species increased substantially in abundance following flood events, but then declined during extended dry conditions. Botanical changes at the genera or species level were found on a limited number of occasions. Echinochloa turneriana was significantly lower under grazed conditions on two occasions, but the differences of 5 and 6% could not be considered biologically important. However in March 2003, a large difference (33.3% under grazing compared with 55.5% under exclosure) approached significance (P=0.073). The other commonly occurring annual grass recorded, Iseilema sp., was present in equal abundance under grazed and exclosed conditions at all recording dates. Sedges were more abundant under grazing on three occasions, and less abundant on one. The semi-aquatic Ipomoea spp. and Marsilea drummondii were less abundant under grazing on one occasion each, whilst the only common perennial grass, Sporobolus mitchellii, tended to be more abundant under grazed conditions. Minor differences between grazed and ungrazed systems, as reported here, would only be logical and occurs in all grazing systems. Significant reductions in total yield and ground cover could be an indicator of negative changes in useful forage growth and land condition. However, it can not be extrapolated from the data collected to date that grazing is having any consistent and lasting negative impact on land condition in the Channel Country. Changes were more evident at the river and land system scale than at the grazed/ungrazed transect scale. Total yield was higher at sites within the floodplains of the Georgina River on four occasions, and ground cover was higher on three occasions (Figure 8–1 a), b)). During the 2002–2005 monitoring period, four floods were recorded for the Georgina, three for the Diamantina and six for the Cooper. These data suggest that the Georgina sites are more productive than the other rivers, even when flooding less frequently. Table 8–1. Changes in a) total yield (kg/ha) within grazed and ungrazed transects on 10 occasions between July 2002 and November 2005 and b) ground cover (%) between December 2004 and November 2005. There were significant differences within groups. Significance levels are represented by chi squared values
a) total yield Date grazed ungrazed X 2 (chi–squared) values July 2002 74 346 <0.001 April 2003 83 165 0.012 May 2003 2,344 3,327 0.188 July 2003 1,097 1,463 0.034 April 2004 3,322 3,698 0.128 July 2004 4,390 4,639 0.356 December 2004 873 994 0.017 annual grass 36 140 0.009 March 2005 1,431 3,466 0.014 August 2005 1,201 1,517 0.374 November 2005 250 555 0.128 forbs 99 240 0.006
b) ground cover December 2004 10 14 0.006 March 2005 12 28 0.016 August 2005 16 24 0.009

Sustainable Grazing in the Channel Country Floodplains (Phase 2)
Page 94 of 158
November 2005 13 21 <0.001

Sustainable Grazing in the Channel Country Floodplains (Phase 2)
Page 95 of 158
Table 8–2. Frequency of occurrence (%) of the ten most common plant species recorded between July 2002 and November 2005 following continued grazing (gr) or exclosure (ungr) since 1999 Botanical name Common
name July 02 April 03 May 03 July 03 April 04 July 04 Dec 04 Apr 05 Aug 05 Nov 05
gr ungr gr ungr gr ungr gr ungr gr ungr gr ungr gr ungr gr ungr gr ungr gr ungr Calotis sp. Daisy burr N/a N/a N/a N/a 50.1 45.6 N/a N/a 0.7 2.2 0.9 0.1 N/a N/a N/a N/a 53.2 51.2 18.2 19.3 Cyperus exaltatus Tall sedge 11.0 8.0 12.8 7.1* 43.6 47.0 7.1 6.0 25.1 16.3* 6.7 0.0 10.9 4.9 2.5 0.4 1.4 1.2 0.04 0.9 Cyperus gymnocaulos
Spiny flat sedge
6.9 9.8 N/a N/a 16.7 28.9 15.5 17.8 3.1 5.5 10.3 6.2 4.7 6.1 6.6 12.6 7.3 10.0 6.1 6.3
Echinochloa turneriana
Native sorghum
12.2 13.5 37.6 30.6* 33.2 55.5 32.2 36.1* 11.6 13.2 N/a N/a 5.9 10.1 17.1 21.8 22.0 19.0 2.3 10.5
Epaltes cunninghamii Tall nutheads 11.2 11.6 N/a N/a N/a N/a N/a N/a 3.1 3.5 19.1 25.8 6.8 8.2 0.7 0.0 25.9 20.6 5.3 14.7* Ipomoea sp. Cow vine 21.2 34.1** 8.6 5.3 56.7 63.3 56.5 64.8 29.3 27.6 6.1 5.3 5.3 10.0 N/a N/a 0.3 0.6 N/a N/a Iseilema sp. Flinder’s grass 3.5 2.5 39.2 33.1 N/a N/a 49.7 43.5 12.8 13.8 35.2 31.9 0.9 5.3 28.0 27.9 15.1 13.1 5.6 5.3 Marsilea drummondii Nardoo 52.7 56.3 4.5 4.1 32.3 44.47 11.6 25.1* 55.2 53.5 42.9 27.1 55.6 57.9 49.1 33.9 14.5 8.9 14.8 18.8 Sesbania sp. Sesbania 4.1 4.7 32.3 32.8 1.1 4.4 10.9 15.9 N/a N/a 7.6 14.2 0.0 1.5 1.1 3.5 0.6 0.3 N/a N/a Sporobolus mitchellii Rat’s tail couch 23.8 19.2 23.1 11.2** 27.7 17.8 33.6 16.9 8.9 7.5 N/a N/a 11.8 9.6 20.8 16.8 10.7 10.7 6.3 8.8
* significant difference at P<0.05 level; ** P<0.01; *** P<0.001. Significant results are highlighted in yellow. N/a = data not available.
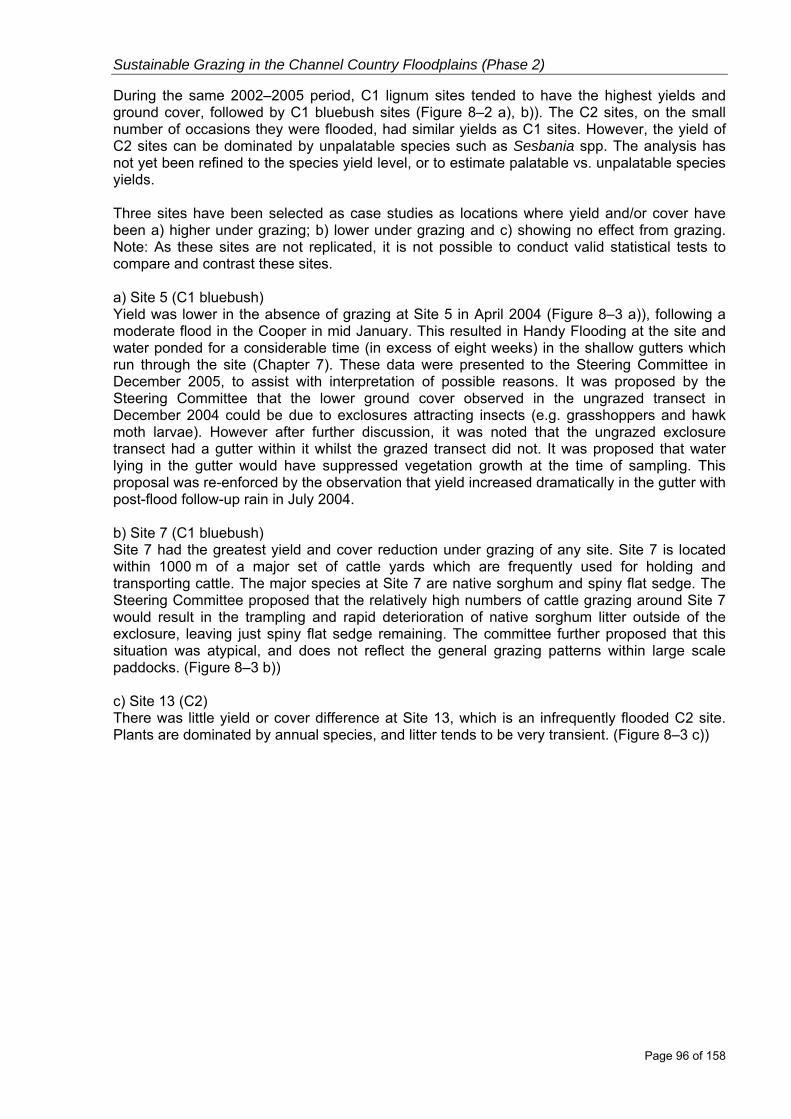
Sustainable Grazing in the Channel Country Floodplains (Phase 2)
Page 96 of 158
During the same 2002–2005 period, C1 lignum sites tended to have the highest yields and ground cover, followed by C1 bluebush sites (Figure 8–2 a), b)). The C2 sites, on the small number of occasions they were flooded, had similar yields as C1 sites. However, the yield of C2 sites can be dominated by unpalatable species such as Sesbania spp. The analysis has not yet been refined to the species yield level, or to estimate palatable vs. unpalatable species yields. Three sites have been selected as case studies as locations where yield and/or cover have been a) higher under grazing; b) lower under grazing and c) showing no effect from grazing. Note: As these sites are not replicated, it is not possible to conduct valid statistical tests to compare and contrast these sites. a) Site 5 (C1 bluebush) Yield was lower in the absence of grazing at Site 5 in April 2004 (Figure 8–3 a)), following a moderate flood in the Cooper in mid January. This resulted in Handy Flooding at the site and water ponded for a considerable time (in excess of eight weeks) in the shallow gutters which run through the site (Chapter 7). These data were presented to the Steering Committee in December 2005, to assist with interpretation of possible reasons. It was proposed by the Steering Committee that the lower ground cover observed in the ungrazed transect in December 2004 could be due to exclosures attracting insects (e.g. grasshoppers and hawk moth larvae). However after further discussion, it was noted that the ungrazed exclosure transect had a gutter within it whilst the grazed transect did not. It was proposed that water lying in the gutter would have suppressed vegetation growth at the time of sampling. This proposal was re-enforced by the observation that yield increased dramatically in the gutter with post-flood follow-up rain in July 2004. b) Site 7 (C1 bluebush) Site 7 had the greatest yield and cover reduction under grazing of any site. Site 7 is located within 1000 m of a major set of cattle yards which are frequently used for holding and transporting cattle. The major species at Site 7 are native sorghum and spiny flat sedge. The Steering Committee proposed that the relatively high numbers of cattle grazing around Site 7 would result in the trampling and rapid deterioration of native sorghum litter outside of the exclosure, leaving just spiny flat sedge remaining. The committee further proposed that this situation was atypical, and does not reflect the general grazing patterns within large scale paddocks. (Figure 8–3 b)) c) Site 13 (C2) There was little yield or cover difference at Site 13, which is an infrequently flooded C2 site. Plants are dominated by annual species, and litter tends to be very transient. (Figure 8–3 c))

Sustainable Grazing in the Channel Country Floodplains (Phase 2)
Page 97 of 158
0
500
1000
1500
2000
2500
3000
3500
4000
4500
5000
7 4 5 7 4 7 12 4 8 11
2002 2003 2004 2005
Month & year of sampling
Dry
mat
ter y
ield
(kg/
ha)
CooperDiamantinaGeorgina
0
5
10
15
20
25
30
35
12 4 8 11
2004 2005
Month & Year of sampling
Gro
und
cove
r (%
)
CooperDiamantinaGeorgina
Figure 8–1. Comparative a) yield (kg/ha) and b) cover (%) values between river systems (Cooper, Diamantina and Georgina), as measured by visual estimation between July 2002 and November 2005
P=0.07
P<0.001
P=0.022
P=0.017
P=0.040
P<0.001
P=0.034
P=0.002
a) yield (kg/ha)
b) cover (%)

Sustainable Grazing in the Channel Country Floodplains (Phase 2)
Page 98 of 158
0
500
1000
1500
2000
2500
3000
3500
4000
4500
7 4 5 7 4 7 12 4 8 11
2002 2003 2004 2005
Month & year of sampling
Dry
mat
ter y
ield
(kg/
ha)
C1BC1LC2C3
0
5
10
15
20
25
30
12 4 8 11
2004 2005
Month & Year of sampling
Gro
und
cove
r (%
)
C1BC1LC2C3
Figure 8–2. Comparative a) yield (kg/ha) and b) cover (%) values between land systems (C1 bluebush, C1 lignum, C2 and C3), as measured by visual estimation between July 2002 and November 2005
P<0.001
P=0.089
P<0.001 P=0.007 P<0.001
P=0.022
a) yield (kg/ha)
b) cover (%)

Sustainable Grazing in the Channel Country Floodplains (Phase 2)
Page 99 of 158
0
500
1000
1500
2000
2500
3000
3500
4000
4500
5000
7 4 5 7 4 7 12 3 4 8 11
2002 2003 2004 2005
Month & year of sampling
Dry
mat
ter y
ield
(kg/
ha)
UGRGR
0
5
10
15
20
25
30
12 4 8 11
2004 2005
Month & Year of sampling
Gro
und
cove
r (%
)
UGRGR
Example quadrat photographs (see discussion of this site on page 94)
a) Site 5 (C1 bluebush) Yield (kg/ha)
Ground cover (%)

Sustainable Grazing in the Channel Country Floodplains (Phase 2)
Page 100 of 158
0
500
1000
1500
2000
2500
3000
3500
4000
4500
5000
5500
6000
6500
7000
7500
8000
8500
9000
9500
7 4 5 7 4 7 12 3 4 8 11
2002 2003 2004 2005
Month & year of sampling
Dry
mat
ter y
ield
(kg/
ha)
UGRGR
0
10
20
30
40
50
60
70
80
90
100
12 4 8 11
2004 2005
Month & Year of sampling
Gro
und
cove
r (%
)
UGRGR
Example quadrat photographs
b) Site 7 (C1 lignum) Yield (kg/ha)
Ground cover (%)

Sustainable Grazing in the Channel Country Floodplains (Phase 2)
Page 101 of 158
0
500
1000
1500
2000
2500
3000
3500
4000
4500
5000
7 4 5 7 4 7 12 4 8 11
2002 2003 2004 2005
Month & year of sampling
Dry
mat
ter y
ield
(kg/
ha)
GRUGR
0
2
4
6
8
10
12
14
16
18
20
12 4 8 11
2004 2005
Month & Year of sampling
Gro
und
cove
r (%
)
UGRGR
Figure 8–3. Pasture yield (kg/ha), ground cover (%) and example quadrat photographs in ungrazed and grazed site transects at a) Site 5 (C3 bluebush), b) Site 7 (C1 lignum) and c) Site 13 (C2)
c) Site 13 (C2) Yield (kg/ha)
Ground cover (%)

Sustainable Grazing in the Channel Country Floodplains (Phase 2)
Page 102 of 158
8.3.1 Infrastructure influences on grazing pressure
Where grazing does reduce yield or cover, the Steering Committee has proposed that it might be closer to yards and watering points and consequently subjected to atypically high grazing pressure. The relative proximity of paired sites to property infrastructure has been assessed using existing property mapping, Geoscience Australia 250K topographic maps and Landsat imagery. Field observations, confirmed by the Steering Committee, suggest that some sites may be subjected to higher grazing pressure due to their specific location in relation to property infrastructure. A simple analysis of site location in proximity to property infrastructure was completed and is detailed in Table 8–3. It is proposed that a site that is in relative close proximity (e.g. within 1 km) to areas that livestock frequent or are concentrated, such as watering points and handling facilities, or where cattle are likely to follow old roads or tracks out from water points or yards, would be subjected to a differential grazing regime compared to a site that is not in relative close proximity to such property infrastructure. Within an approximate radius of five kilometres of Site 2, there are four constructed watering points. Given that animals (domestic or otherwise) tend to congregate on, and graze out from water points, one may conclude that this site would be subjected to a higher proportion of livestock activity than Site 17 in which there are only two nearby ephemeral waterholes at a distance of 7.0 km and 9.5 km respectively. Due to the inquisitive nature of cattle, a site that is between two water points may be subjected to investigation as the livestock traverse the area. Some sites show evidence of frequent visitation in the form of cattle pads leading to and from the exclosure, nearby scalds from congregating cattle and rub and lick marks on exclosure posts. Hence the very presence of the exclosure fencing may attract the curiosity of cattle if it is in their visible range such as adjacent to property roads and/or tracks or fence lines that cattle follow to traverse the property. Similarly, if a site is in relative close proximity to cattle handling facilities the area surrounding the exclosure may be subjected to high trampling rates as cattle are mustered and moved in large concentrated mobs. Cattle retained on-property and put back to pasture in large mobs may well then subject the site to higher grazing and trampling pressure as they move, or are moved, away from the facility. Table 8–3. Grazing pressure (low, moderate or high) inferred by the proximity of water points, roads and yards to the 17 floodplain grazing monitoring sites. Site Structure Distance (km) Inferred grazing pressure* 1 Road
Waterpoints Adjacent 5.2; 10.6 Low
2 Road Waterpoint
0.60 2.8; 2.8; 4.9; 5.3 Moderate–high
3 House and yards Yards
4.0 6.5 Low
4 Fence Yards
0.20 9.3 Low
5 Bore 2.8 Moderate 6 Road
Yards Waterpoint Fence
0.30 8.1; 8.7 8.9 0.45
Low
7 Old main road Yards
Adjacent 5.5; 10.3 Moderate–high
8 Holding paddock Main road and causeway Fence Yards
Within adjacent 0.30 9.4
Moderate–high
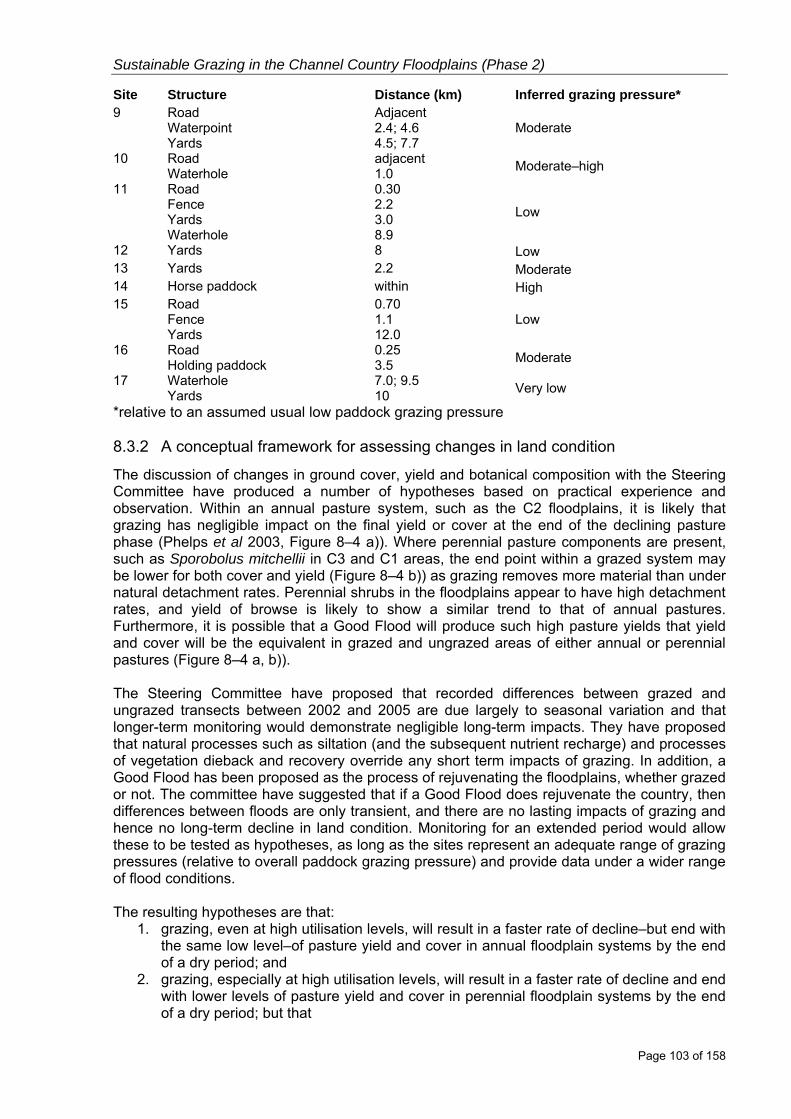
Sustainable Grazing in the Channel Country Floodplains (Phase 2)
Page 103 of 158
Site Structure Distance (km) Inferred grazing pressure* 9 Road
Waterpoint Yards
Adjacent 2.4; 4.6 4.5; 7.7
Moderate
10 Road Waterhole
adjacent 1.0 Moderate–high
11 Road Fence Yards Waterhole
0.30 2.2 3.0 8.9
Low
12 Yards 8 Low 13 Yards 2.2 Moderate 14 Horse paddock within High 15 Road
Fence Yards
0.70 1.1 12.0
Low
16 Road Holding paddock
0.25 3.5 Moderate
17 Waterhole Yards
7.0; 9.5 10 Very low
*relative to an assumed usual low paddock grazing pressure 8.3.2 A conceptual framework for assessing changes in land condition
The discussion of changes in ground cover, yield and botanical composition with the Steering Committee have produced a number of hypotheses based on practical experience and observation. Within an annual pasture system, such as the C2 floodplains, it is likely that grazing has negligible impact on the final yield or cover at the end of the declining pasture phase (Phelps et al 2003, Figure 8–4 a)). Where perennial pasture components are present, such as Sporobolus mitchellii in C3 and C1 areas, the end point within a grazed system may be lower for both cover and yield (Figure 8–4 b)) as grazing removes more material than under natural detachment rates. Perennial shrubs in the floodplains appear to have high detachment rates, and yield of browse is likely to show a similar trend to that of annual pastures. Furthermore, it is possible that a Good Flood will produce such high pasture yields that yield and cover will be the equivalent in grazed and ungrazed areas of either annual or perennial pastures (Figure 8–4 a, b)). The Steering Committee have proposed that recorded differences between grazed and ungrazed transects between 2002 and 2005 are due largely to seasonal variation and that longer-term monitoring would demonstrate negligible long-term impacts. They have proposed that natural processes such as siltation (and the subsequent nutrient recharge) and processes of vegetation dieback and recovery override any short term impacts of grazing. In addition, a Good Flood has been proposed as the process of rejuvenating the floodplains, whether grazed or not. The committee have suggested that if a Good Flood does rejuvenate the country, then differences between floods are only transient, and there are no lasting impacts of grazing and hence no long-term decline in land condition. Monitoring for an extended period would allow these to be tested as hypotheses, as long as the sites represent an adequate range of grazing pressures (relative to overall paddock grazing pressure) and provide data under a wider range of flood conditions. The resulting hypotheses are that:
1. grazing, even at high utilisation levels, will result in a faster rate of decline–but end with the same low level–of pasture yield and cover in annual floodplain systems by the end of a dry period; and
2. grazing, especially at high utilisation levels, will result in a faster rate of decline and end with lower levels of pasture yield and cover in perennial floodplain systems by the end of a dry period; but that

Sustainable Grazing in the Channel Country Floodplains (Phase 2)
Page 104 of 158
3. a Good flood will override differences in pasture yield, composition and cover induced by grazing through providing fresh silt, renewing seed sources and hence inducing high levels of pasture growth.
Figure 8–4. Theoretical impact of grazing on the rate of pasture decline and growth in a) an annual pasture and b) a perennial pasture. 8.3.3 Monitoring land condition
The monitoring currently undertaken includes yield, cover and botanical composition. Such parameters have been successfully used to define models of land condition in other parts of western Queensland (e.g. Phelps and Bosch 2002) and provide an objective basis for the ABCD framework. Within annual floodplains, caution should be exercised in interpreting data from drought periods or from small flood events. The data collected so far demonstrate the difficulties in assessing land condition in the floodplains, especially in the absence of benchmark data. The only Good Flood across the study areas was in 1999/2000, prior to the monitoring of the grazing impact transects. The currently accepted framework for monitoring land condition within grazed ecosystems is the ABCD framework, which relies on determining the potential of a land type to produce useful fodder. If the land type has the potential to produce pasture to carry 100 percent of the expected stock numbers in a sustainable manner, then it is in A condition. But what is the potential to use this framework within a flood-fed annual pasture system? Assessments during drought are especially difficult, as yield and cover decline to negligible levels under natural detachment rates (Phelps et al 2003, Figure 8–4 a)) and species are difficult to identify. It would appear that if the framework can be applied, then it would be following a good (or perhaps handy) flood event, when pasture species can be identified and pastures are expressing their potential yield. However, the difficulties in
Time
Pasture Yield
b)
a)
Good Flood
Pasture Decline Pasture Growth Grazed Ungrazed

Sustainable Grazing in the Channel Country Floodplains (Phase 2)
Page 105 of 158
predicting botanical composition were discussed (Chapter 7), and it was proposed that the first response following drought would be from hard seeded species, followed by soft seeded species once their seed reserves had built up. The first Good Flood following drought may thus not be a valid representation of the capacity for the pasture to produce useful forage. At this stage, further data is needed to test the application of the land type framework within the annual pasture systems of the floodplains. One step towards being able to use the ABCD framework within the floodplains would be to define what ABC and D conditions look like. For instance in good condition, the following broad descriptions may apply:
• C1–moderate density of bluebush and lignum in swampy areas, good nardoo and cow–vine response following flooding;
• C2–good response of palatable annual species e.g. Flinders grass; tar vine, and • C3–moderate density of bluebush and lignum in swampy areas, good sorghum
response to Handy and Good Flooding. Floodplains in poor condition may be starved of floodwaters (not to be confused with drought conditions) and demonstrate limited response from any species. What response there is may be limited to unpalatable species such as Sclerolaena with no return to palatable species after two to three flood events. Poor condition of floodplains could show signs such as increased areas of scalding in C2 land systems or in C1 and C3 land systems thinning of bluebush, or substantial thickening of lignum which substantially restricts pasture growth, or invasion of exotic species (e.g. Parkinsonia, Parthenium). Loss of patches of Sporobolus mitchellii may be evident in C1 and C3 areas in poor condition. It may be necessary to incorporate soil seed bank surveys (e.g. Capon 2003) into a land condition framework for floodplains, or LFA (Landscape Function Analysis) measurements to determine soil surface condition. However, this topic requires further exploration by refining the analysis of existing data and reviewing the literature from other flooded areas such as the Okavango Delta and annual pasture systems such as central Australia. Whilst it is plausible that the ABCD framework can apply within the floodplains, more effort is needed to devise a practical and robust approach that is not open to misinterpretation through monitoring standing vegetation at inappropriate times. A potential ABCD land condition framework for the floodplains, listing botanical composition and flooding and erosion processes, is summarised in Table 8–4. Should further monitoring of potential grazing impacts be warranted in the Channel Country, consideration should be given to up-scaling the monitoring and linking ground-based sites with remote sensing tools. Table 8–4. Potential ABCD land condition framework for the Channel Country floodplains indicating botanical composition and landscape processes in floodplains in A, B, C or D condition within a) C1 and C3 land systems and b) C2 land systems a) C1 and C3 land systems Condition
Score Extant botanical
composition Soil seed bank composition
Flooding and erosion process
A Moderate density of bluebush and lignum in swampy areas; lignum present along watercourses; bluebush shrubs are large and healthy; rats tail couch obvious along gutters in swampy areas
Nardoo and sedges in swampy areas; other areas dominated by sorghum, millet, cowvine and clover
Dominated by deposition (siltation), with rare in-channel scouring events which maintain waterholes
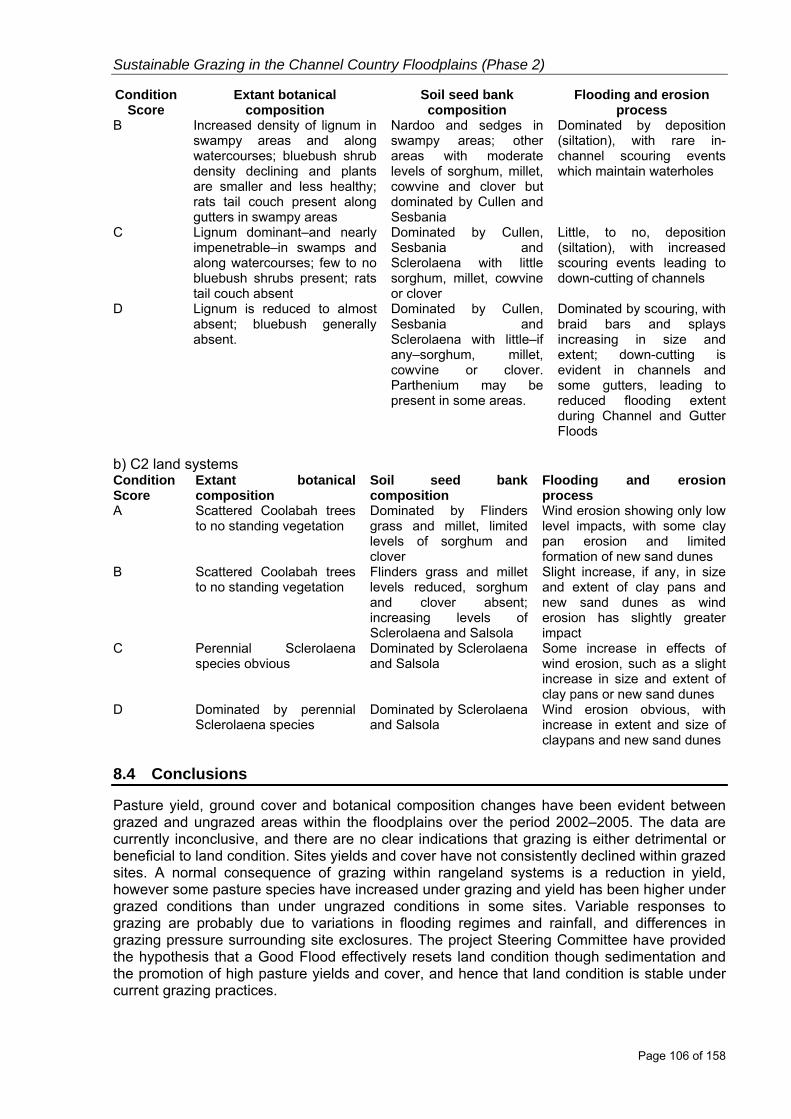
Sustainable Grazing in the Channel Country Floodplains (Phase 2)
Page 106 of 158
Condition Score
Extant botanical composition
Soil seed bank composition
Flooding and erosion process
B Increased density of lignum in swampy areas and along watercourses; bluebush shrub density declining and plants are smaller and less healthy; rats tail couch present along gutters in swampy areas
Nardoo and sedges in swampy areas; other areas with moderate levels of sorghum, millet, cowvine and clover but dominated by Cullen and Sesbania
Dominated by deposition (siltation), with rare in-channel scouring events which maintain waterholes
C Lignum dominant–and nearly impenetrable–in swamps and along watercourses; few to no bluebush shrubs present; rats tail couch absent
Dominated by Cullen, Sesbania and Sclerolaena with little sorghum, millet, cowvine or clover
Little, to no, deposition (siltation), with increased scouring events leading to down-cutting of channels
D Lignum is reduced to almost absent; bluebush generally absent.
Dominated by Cullen, Sesbania and Sclerolaena with little–if any–sorghum, millet, cowvine or clover. Parthenium may be present in some areas.
Dominated by scouring, with braid bars and splays increasing in size and extent; down-cutting is evident in channels and some gutters, leading to reduced flooding extent during Channel and Gutter Floods
b) C2 land systems Condition Score
Extant botanical composition
Soil seed bank composition
Flooding and erosion process
A Scattered Coolabah trees to no standing vegetation
Dominated by Flinders grass and millet, limited levels of sorghum and clover
Wind erosion showing only low level impacts, with some clay pan erosion and limited formation of new sand dunes
B Scattered Coolabah trees to no standing vegetation
Flinders grass and millet levels reduced, sorghum and clover absent; increasing levels of Sclerolaena and Salsola
Slight increase, if any, in size and extent of clay pans and new sand dunes as wind erosion has slightly greater impact
C Perennial Sclerolaena species obvious
Dominated by Sclerolaena and Salsola
Some increase in effects of wind erosion, such as a slight increase in size and extent of clay pans or new sand dunes
D Dominated by perennial Sclerolaena species
Dominated by Sclerolaena and Salsola
Wind erosion obvious, with increase in extent and size of claypans and new sand dunes
8.4 Conclusions
Pasture yield, ground cover and botanical composition changes have been evident between grazed and ungrazed areas within the floodplains over the period 2002–2005. The data are currently inconclusive, and there are no clear indications that grazing is either detrimental or beneficial to land condition. Sites yields and cover have not consistently declined within grazed sites. A normal consequence of grazing within rangeland systems is a reduction in yield, however some pasture species have increased under grazing and yield has been higher under grazed conditions than under ungrazed conditions in some sites. Variable responses to grazing are probably due to variations in flooding regimes and rainfall, and differences in grazing pressure surrounding site exclosures. The project Steering Committee have provided the hypothesis that a Good Flood effectively resets land condition though sedimentation and the promotion of high pasture yields and cover, and hence that land condition is stable under current grazing practices.

Sustainable Grazing in the Channel Country Floodplains (Phase 2)
Page 107 of 158
9 Success in Achieving Objectives The project objectives have been successfully met. Over the last three years, we have maintained a high level of interaction with the Steering Committee and industry in general through formal meetings, informal discussions and speaking at catchment committee meetings and field days. We have used historical data, computer modelling, local knowledge and the latest research results to establish a framework (Objective 1) and simple guidelines for predicting flood extent and value (Objectives 2 and 3). We have been able to predict pasture growth with greater than 70% accuracy during the calibration phase of modelling, although we do not yet have sufficient data to validate the predictions (Objective 2). Management guidelines and field tools (‘Forage value in the Channel Country. A photographic guide’, Phelps et al. 2007c) are available to determine pasture yield, pasture quality, expected cattle growth rates and grazing pressure to enhance sustainable floodplain management (Objective 4), and will be delivered through the EDGENetwork® Grazing Land Management package. The impact of grazing on floodplain pasture condition and trend has been documented for the four years between 2002 and 2006 (Objective 5), and the practical application of these data through the ABCD land condition framework explored. The project has contributed to a balanced debate on environmental issues relating to sustainable floodplain management within the general and scientific communities (Objective 6c). This is evidenced by the number of conference publications, through the distribution of a project newsletter to over 200 community, industry and scientific recipients, through the involvement of the main author (DGP) in multi-agency consultancies and being invited to speak at field days and regional body and catchment committee meetings, and through the distribution of approximately 1000 copies of the first two project publications and 100 copies of the final report from the first phase of the project. The wide distribution of publications and the project newsletter is also evidence that at least 80% of Channel Country landholders and a majority of the general community in the Channel Country will be aware of the project and its outputs (Objective 6a). To date, about 40% of landholders in the Channel Country have been involved in testing the decision support guidelines and tools in their floodplain grazing management, slightly short of the 50% target. Copies of the forage guides will be distributed to all landholders as well as the flooding rules of thumb guides to Cooper and Diamantina landholders, in early 2007, making these products available for all Channel Country landholders to use. 10 Impact on Meat and Livestock Industry–Now and in Five
Years Time The ‘Sustainable Grazing in the Channel Country Floodplains’ project was initiated by industry to redress the lack of objective information for sustainable management in the floodplains of Cooper Creek and of the Diamantina and Georgina Rivers. So far the project has provided tools for managers to better anticipate the size of beneficial flooding arising from rains in the upper catchment and to more objectively assess the value of the pasture resulting from flooding. The latest information from the project has enabled customisation of the EDGENetwork® Grazing Land Management training package for the Channel Country. Pastoral companies and private landholders can now access a feed budget approach based on objective guidelines to estimate the numbers of cattle to be carried in the long and short term. A framework for estimating longer term carrying capacities based on flood types has been developed, providing the capacity for longer-term planning to be implemented. Short-term carrying capacity can be anticipated earlier and more objectively than in the past, through the use of flood rules of thumb, flood types and pasture growth tables for the three floodplain land systems. Feed budgeting based on visual assessment of pasture yield and quality following a flood event will then act as a check when setting actual numbers.
Sustainable Grazing in the Channel Country Floodplains (Phase 2)
Page 108 of 158
More effective long and short term planning can now be achieved in the Channel Country. For companies which use a cattle budget approach for moving cattle between properties, they now have a more objective basis for cattle movements, and are able to make decisions earlier in their planning cycle. In combination, these tools will assist in making earlier cattle stocking decisions, including when cattle may need to be mustered out of floodplain paddocks, how many additional cattle will be required to take advantage of the flood-grown pasture and the timing of cattle turn-off. These will reduce costs by providing a greater lead time to plan cattle movements and purchases, and enhance the sustainability of the resource base by objectively matching cattle numbers with the feed on offer. At the start of the first phase of ‘Sustainable Grazing in the Channel Country Floodplains’ in 1998 there were no publications aimed at land managers. This second phase of the project, which commenced in 2003, has added more resources–books, maps, and training packages–to promote practices which help consolidate sustainable natural resource management in the Channel Country. Many of the current managers have recently retired, or are nearing retirement age. In five years time it is thus likely that Channel Country properties will be managed by a new generation. Current, relevant and timely information will be of even greater importance as new managers seek to gain experience and training in the successful management of the boom and bust cycles of the floodplains. 11 Conclusions and Recommendations Production within the Channel Country floodplains is reliant on flood pulses to germinate and grow annual pasture species. Local rainfall contributes only when it follows flood-induced pasture growth, or when it acts to pre-wet the soil thus spreading the floodwaters further (Phelps et al. 2003). Perennial pasture components contribute only small levels of available forage for cattle. The composition of the pasture appears to be determined more by the season of flooding (e.g. Cooper clover germinates on a winter flood and native sorghum/ channel millet germinates from summer flooding), the length of time since the previous flood, the duration of the current flood and the level of desiccation resulting from current air temperatures and winds, than it is by grazing history. Rains of 75–100 mm over 24 hours are required in the upper catchment to initiate flooding. The size of the resultant flood at downstream locations depends on flood type modifiers such as evaporation, diversion of floodwater into waterholes, lakes and swamps and soakage into channel banks and floodplain soils. For instance, even if sufficient rains fall to produce a Good Flood, often only a Handy Flood results due to high evaporation or diversion of floodwaters into dry waterholes. It is unlikely that sufficient falls to produce a Good flood could result in only a Gutter or Channel Flood. The modifiers of flood type act to reduce, or upgrade, floods by one category. This means that the minimum size of a flood can be anticipated. Managers within the Channel Country follow flood events as soon as rains begin in the upper catchment. If the rains are too low (e.g. only 50 mm, or not generalised), then a decision is made that cattle do not need to be mustered from flood prone areas, or that no additional cattle will be needed, as there will be no pasture growth. However, where there are widespread falls of 75–100 mm, then the size and potential effectiveness of the flood needs to be anticipated. The number of cattle required to make use of the pasture depends on pasture yield, composition (i.e. if the pasture will be dominated by palatable or unpalatable species) and for how long the pasture is likely to maintain high protein and energy levels. The main aim of cattle production within the Channel Country is to maximise liveweight gain (i.e. the quantity of beef produced). Once cattle are grazing, further decisions are made as to how long they can be grazed for. This can be as simple as starting to turn-off the heaviest animals two to three months after the flood, and allowing numbers to decline according to liveweight gains. Under circumstances of an extended pasture growing season, however, it must also be

Sustainable Grazing in the Channel Country Floodplains (Phase 2)
Page 109 of 158
decided how many head of cattle are needed to replace those being turned-off initially. Implicit in this decision making process are the questions of when the cattle will reach target weights, and if all the cattle will reach target weights based on the forage value? Information on pasture yield and quality is thus needed to assist with these feed budget decisions throughout the year. The cycle of setting and re-setting floodplain cattle numbers continues for 12–18 months following a flood, until it is apparent that the pasture yield or quality is too low for cattle to gain weight. By this stage, cattle numbers are generally at 10–20% of the peak numbers carried following the flood. Pasture growth resulting from a flood pulse can estimated through ‘modelling using the GRASP’ package. Pasture growth tables have been produced within grazier relevant publications. However, it is not yet possible to predict the composition of the resultant pasture e.g. whether it will be dominated by palatable species such as sorghum, or by unpalatable species such as peabush. A theory proposing that hard-seeded plants, such as peabush, are more likely to dominate the seed bank following drought, and hence dominate pastures in the first flood after extended dry periods, has been put forward, but remains to be tested. The key processes involved in determining the value of a flood are presented in Figure 11–1 which is a simple conceptual diagram of the broad processes determining flooding and pasture growth in the Channel Country floodplains.

Sustainable Grazing in the Channel Country Floodplains (Phase 2)
Page 110 of 158
Figure 11–1. A simple conceptual diagram of the broad processes determining flooding and pasture growth in the Channel Country floodplains. Blue boxes and lines relate to flooding processes, green to pasture growth processes and yellow to losses from the ground based system. Dashed lines represent modifiers of the main processes. For simplicity, many relationships are not shown.
RAINFALL • Amount • Intensity • duration
Landscape processes • Soil type • Slope • Ground cover
In-stream flow
FLOODING
Soakage into floodplain soils
Channel bank soakage
Filling of waterholes, lakes and swamps
RUNOFF
Evaporation
Downstream flooding
C1 pasture growth
C3 pasture growth
C2 pasture growth
Evapo-transpiration
Germination conditions • Soil temperature • Duration of
flooding • Surface soil
Growth conditions • Air temperature • Soil moisture • Local rainfall
SOIL SEED BANK LEVEL AND COMPOSITION
Sustainable Grazing in the Channel Country Floodplains (Phase 2)
Page 111 of 158
A number of theories, hypotheses and questions have been raised throughout this report which requires clarification or testing. For instance, remote sensing and hydrology modelling could be used through a GIS approach to determine the spatial extent of Good, Handy, Gutter and Channel Floods. This could provide a catalogue of flood types back to 1889, and provide a more accurate estimate of flooding frequency, especially at reach or property scales. This would, in turn, provide for improved predictions of flood size. The relationship between flood duration and depth is still not understood well enough to predict soil moisture resulting from different flood types, although a full soil moisture profile was assumed for ‘GRASP’ modelling. It is possible that moisture penetration is limited by soil chloride ions. Further testing of soil samples in storage would provide insights into this possibility. In addition, floodwater infiltration rates and the flood depth and duration required to reach field capacity throughout the soil profile could be determined through in situ or laboratory testing. Pasture growth resulting from a flood pulse can be estimated by modelling using the ‘GRASP’ package. However, it is not yet possible to predict the composition of the resultant pasture e.g. whether it will be dominated by palatable species such as sorghum, or by unpalatable species such as peabush. A theory proposing that hard-seeded plants, such as peabush, are more likely to dominate the seed bank following drought, and hence dominate pastures in the first flood after extended dry periods, has been put forward, but remains to be tested. Further data collection is also needed to validate the calibrated ‘GRASP’ model. Further work is needed to define practical ways of using the ABCD land condition framework in floodplains dominated by annual species. There is the potential to include soil seed banks, but it may be more practical to limit sampling of extant vegetation until after a Handy or Good flood. Three hypothesis relating to the impacts of grazing were developed. These are:
1. grazing, even at high utilisation rates, will result in a faster rate of decline–but end with the same low level–of pasture yield and cover in annual floodplain systems by the end of a dry period, and
2. grazing, especially at high utilisation levels, will result in a faster rate of decline and end with lower levels of pasture yield and cover in perennial floodplain systems by the end of a dry period, but that
3. a Good flood will override differences in pasture yield, composition and cover induced by grazing through providing fresh silt, renewing seed sources and hence inducing high levels of pasture growth.
‘Sustainable Grazing in the Channel Country Floodplains’ has maintained a focus on industry consultation and developing education and extension products throughout each phase of the project. The first phase, funded by NHT, published ‘Managing the Channel Country Sustainably. Producers’ Experiences’ (Edmondston 2001) and ‘With Reference to the Channel Country. Review of available information’ (White 2001). The current phase has developed guides to predict flood type for the Cooper and Diamantina (Phelps et al. 2007a, b), and ‘Forage value in the Channel Country. A photographic guide’ (Phelps et al. 2007 c) to assist with feed budgeting in the floodplains. This approach has evolved into a continuous learning cycle for the members of the Steering Committee–scientists and land managers alike. Further extension tools could make use of MODIS satellite imagery in an easy to understand front end that allows flood progress to be tracked in near-real time. A low-tech option could be to develop sets of flip charts of flooding MODIS satellite images of the flooding at the property or paddock scale as a guide to the spatial extent associated with the four flood types. In addition, a flood rule of thumb guide has yet to be developed for the Georgina River.
Sustainable Grazing in the Channel Country Floodplains (Phase 2)
Page 112 of 158
The most important of these possible areas of further research need to relate to enhancing the current range of products, and need to relate to building on the most important aspects of the research. As such, future studies within the Channel Country should concentrate on:
1. research to validate the accuracy of modelled pasture growth; 2. research to investigate if high grazing pressure can lead to land condition change, or if
flooding is the overriding process; 3. developing the flood rules of thumb for the Georgina River; 4. developing the ABCD framework for use within the floodplains; 5. incorporating soil seed bank surveys into future land condition monitoring, and 6. further exploring the potential use of MODIS satellite imagery to classify the spatial
extent of Good, Handy, Gutter and Channel Floods. 12 References Alley, N. F. (1998). Cainozoic stratigraphy, palaeoenvironments and geological evolution of Lake Eyre Basin. Palaeogeography, Palaeoclimatology, Palaeoecology 144: 239–263. Allan R.J. (1988) Meteorology an hydrology, in Reid J.R.W. and Gillen J.S. (eds) The Coongie Lakes Study, Consultancy Report to the Department of Environment and Planning, Adelaide, South Australia. Allan, R.J. (1990) Climate. In: Tyler, M.J., Twidale, C.R., Davies, M. & Wells, C.B. (Eds) Natural History of the North East Deserts. Royal Society of South Australia, 81–4. Andrew, M. H., I. R. Noble and Lange, R.T. (1979). A non-destructive method for estimating the weight of forage on shrubs. Australian Rangeland Journal 1: 225–231. Andrew, M. H., I. R. Noble, Lange, R.T., Johnson, A.W. (1981). "The measurement of shrub forage weight: three methods compared." Australian Rangeland Journal 3(1): 74–82. A.O.A.C. (1980). “Official Methods of Analysis of the Association of Official Analytical Chemists”. 13th Edition (Washington): Sections 3.098-3.100. AUSLIG (1990). “Atlas of Australian Resources. Third Series. Volume 6. Vegetation”. Australian Government Publishing Service, Canberra. Badman, F.J. (1989) The birds of middle and lower Cooper Creek in South Australia. Nature Conservation Society of South Australia, Adelaide. Bobek, B. and R. Bergstrom (1978). "A rapid method of browse biomass estimation in a forest habitat." Journal of Range Management 31(6): 456–458. Boyland, D.E. (1984) Vegetation Survey of Queensland. South western Queensland. Queensland Botany Bulletin No. 4. DPI, Queensland. Brady, N. C. (1984). The Nature and Properties of Soils (Ninth Edition). New York, Macmillan Publishing Company. Bunn, S.E, Davies, P.M. and Winning, M. (2003). Sources of organic carbon supporting the food web of an arid zone floodplain river. Freshwater Biology 48(4), 619–635. BoI (Bureau of Investigation) (1947). The Channel Country of South–West Queensland, Dept. of Public Lands, Qld.

Sustainable Grazing in the Channel Country Floodplains (Phase 2)
Page 113 of 158
Bureau of Meteorology (1997). “Flooding in Western Queensland”. August 1997, <http://www.bom.gov.au/hydro/flood/qld/fld_reports/western_qld_feb1997.pdf> Accessed 2002 September 23. Bureau of Meteorology (2000a). “Winton Flood February 2000.” 23 March 2000, <http://www.bom.gov.au/hydro/flood/qld/fld_reports/winton_feb2000.pdf> Accessed 2002 September 23. Bureau of Meteorology (2000b). “Thomson River Floods February 2000”. 3 August 2000, <http://www.bom.gov.au/hydro/flood/qld/fld_reports/cooper_feb2000.pdf> Accessed 2002 September 23. Bureau of Meteorology (2002a). “Queensland Flood Summary 1990–1999”. 2002, <http://www.bom.gov.au/hydro/flood/qld/fld_history/floodsum_1990.shtml> Accessed 2002 September 23. Bureau of Meteorology (2002b). “Queensland Flood Summary 2000 onwards”. 2002, <http://www.bom.gov.au/hydro/flood/qld/fld_history/floodsum_2000.shtml> Accessed 2002 September 23. Bye, J.A.T., Dillon, P.J., Vandenberg, J.C. & Will, G.D. (1978) Bathymetry of Lake Eyre. Trans. R. Soc. S. Aust. 102(4), 85–9. Capon, S. (1999). Zonation of Floodplain Vegetation On a Flood Frequency Gradient In a Variable, Arid–zone Catchment. Bachelor of Science Honours thesis, Faculty of Environmental Sciences, Griffith University, Nathan campus. 59 pp plus appendices. Capon, S. (2003). Flow variability and vegetation dynamics in a large arid floodplain: Cooper Creek, Australia by Samantha Capon. PhD thesis, Faculty of Environmental Sciences, Griffith University, Nathan campus. 226 pp plus appendices Capon, S. J. (2005). "Flood variability and spatial variation in plant community composition and structure on a large arid floodplain." Journal of Arid Environments 60(2): 283-302. Chilcott, C.R., Milson J.A. and Phelps D.G. (2004) Grazing Land Management: Mitchell Grass Downs Version, Workshop Notes. Meat and Livestock Australia, Brisbane. Chilcott, C.R., Nash G., Phelps D. and Paton C.J. (2007), Grazing Land Management: Channel Country Version, Workshop Notes. Meat and Livestock Australia, Brisbane. Clewett, J.F. (1985). “Shallow Storage Irrigation for Sorghum Production in North–West Queensland.” Bulletin QB85002, Department of Primary Industries, Brisbane. 229 pp. Clewett, J.F., Smith, P.G., Partridge, I.J., George, D.A. & Peacock, A. (1999) Australian Rainman Version 3: An integrated software package of rainfall information for better management. QI98071. Department of Primary Industries, Queensland. Clewett, J. F., N. M. Clarkson, et al. (2003). Rainman StreamFlow (version 4.3): A comprehensive climate and streamflow analysis package on CD to assess seasonal forecasts and manage climatic risk. Brisbane, Department of Primary Industries Queensland. CMPS&F (1996) Environmental and Cultural Impact Assessment of Ballera to Mt Isa Gas Pipeline. Environmental Impact Statement Draft. Australian Gas Light Company.

Sustainable Grazing in the Channel Country Floodplains (Phase 2)
Page 114 of 158
Costelloe, J. F. (1998). Modelling of Flood Patterns, using Remote Sensing, in the Coongie Lakes Wetlands, Northeastern South Australia. Department of Geomatics. Melbourne, University of Melbourne: 223–254. Costelloe, J. F., J. T. Puckridge, Reid, J.R.W., Pritchard, J., Hudson, P., Bailey, V., Good, M. (2003 a) Environmental flow requirements in arid zone rivers-a case study from the Lake Eyre basin, central Australia. Water Science and Technology 48(7): 65-72. Costelloe J. F., Grayson R. B., Argent R. M. and McMahon T. A. (2003 b) Modelling the flow regime of an arid zone floodplain river, Diamantina River, Australia. Environmental Modelling & Software 18(8-9): 693-703. Costelloe J.F. (2004) Modelling the flow regime of arid zone, floodplain rivers. PhD thesis. The Department of Civil and Environmental Engineering. Melbourne, The University of Melbourne. Costelloe, J. F., Powling J., Reid, J. R. W., Shiel, R. J., Hudson, P. (2005). Algal diversity and assemblages in arid zone rivers of the Lake Eyre Basin, Australia. River Research and Applications 21(2/3): 337-349. Costelloe J. F., Grayson R. B., McMahon T.A. (2006) Modelling streamflow in a large anastomising river of the arid zone, Diamantina River, Australia. Journal of Hydrology 323(1-4):138-153 Dawson, N.M. (1974) Geology and Landform. In: Western Arid Region Land Use Study–Part 1. Technical Bulletin No. 12. DPI, Queensland. Dawson, N.M. & Ahern, C.R. (1974) Soils. In: Western Arid Region Land Use Study–Part 1. Technical Bulletin No. 12. DPI, Queensland. Day, K.A. and Philp, M.W. (1997). “Appendix 3. Swiftsynd Methodology. A methodology for measuring a minimum data set for calibrating pasture and soil parameters of the pasture growth model GRASP”. In K A Day, G M McKeon and J O Carter (1997). “Evaluating The Risks Of Pasture And Land Degradation In Native Pastures In Queensland” Final Report to RIRDC DAQ–124A. Department of Primary Industries, Brisbane. DNR (Department of Natural Resources) (1996) Cooper System Flow management plan and ‘Currareva’ proposal. Central Western Newsletter, July 8–9. DNR (Department of Natural Resources) (1997) Lake Eyre Basin Queensland Water Resource Assessment Report. DNR Resource Sciences Centre, Queensland. DNR (Department of Natural Resources) (1998a) Draft Water Management Plan for Cooper Creek. DNR, Queensland. DNR (Department of Natural Resources) (1998b) Draft Water Management Plan for Cooper Creek–Information Paper. DNR, Queensland. Edmondston, V. (2001). "Managing the Channel Country Sustainably. Producers’ Experiences". Information Series QI01022. Department of Primary Industries, Brisbane. 48 pp. Étienne, M. (1989). "Non destructive methods for evaluating shrub biomass: a review." Acta Oecologica, Oecologia Applicata 10(2): 115-128. Fagan, S.D. and Nanson, G.C. (2004). The morphology and formation of floodplain–surface channels, Cooper Creek, Australia. Geomorphology. 60(1–2): 107–126.
Sustainable Grazing in the Channel Country Floodplains (Phase 2)
Page 115 of 158
Faichney, G. J. and G. A. White (1983). Methods for the Analysis of Feeds Eaten by Ruminants. Melbourne, CSIRO, Division of Animal Production. GHD (Gutteridge, Haskins & Davey) (1994) Water Supply Augmentation Progress Report. Longreach City Council. Gibling, M.R., Nanson, G.C. and Maroulis, J.C. (1998) Anastomosing river sedimentation in the Channel Country of central Australia. Sedimentology. 45: 595–619 Goodall, H. (1999). Contesting Changes on the Paroo and Its Sister Rivers (Chpt 12). A Free–flowing River: The Ecology of the Paroo River. R. T. Kingsford. Sydney, National Parks and Wildlife Service: 179–200. Graetz, R. D. (1980). “The Potential Application of Landsat Imagery to Land Resource Management in the Channel Country”. CSIRO Division of Land Resource Management: 26 pp. Hierro, J. L., L. C. Branch, et al. (2000). "Predictive equations for biomass and fuel characteristics of Argentine shrubs." Journal of Range Management 53: 617–621. Hughes, K.K. (1980) Physiography and geology. In: Western Arid Land Use Study Part 2. Technical Bulletin No.22. Division of Land Utilisation, Queensland. Jansen, J. D. and G. C. Nanson (2004). "Anabranching and maximum flow efficiency in Magela Creek, northern Australia." Water Resources Research 40(4): W04503. Jeffrey, S.J., Carter, J.O., Moodie, K.B. and Beswick, A.R. (2001). Using spatial interpolation to construct a comprehensive archive of Australian climate data. Environmental Modelling Software 16: 309–30. Jensen, C. H. and G. W. Scotter (1977). "A comparison of twig-length and browsed-twig methods of determining browse utilization." Journal of Range Management 30(1): 64–67. Johnson, M. (1980) The origin of Australia’s salt lakes. N.S.W. Geol. Surv. Records 19(2), 221–266. Junk, W. J., P. B. Bayley, Sparks, R.E. (1989). "The Flood Pulse Concept in River-Floodplain Systems." Canadian Special Publication of Fisheries and Aquatic Science 106: 110–127. Kingsford, R.T. (ed) (2006) Ecology of desert rivers, Cambridge University Press, Cambridge. Kingsford, R.T. (1996) The impact of irrigation on wetlands and waterbirds: ominous warnings for the future of Cooper Creek. In: Noonan, D (Ed) An ecological perspective on Cooper’s Creek. Summary proceedings, Windorah Scientific Workshop, September 3–5, 1996. Australian Conservation Foundation, Adelaide, 5. Kingsford, R.T. & Porter, J.L. (1994) Waterbirds on an adjacent freshwater lake and salt lake in arid Australia. Biological Conservation. 69: 219–28. Knighton, A.D. and Nanson, G.C. (1994b) Flow transmission along an arid zone anastomosing river, Cooper Creek, Australia. Hydrological Processes. 8: 137–54. Knighton, A.D. and Nanson, G.C. (1994a) Waterhole and their significance in the anastomosing channel system of Cooper Creek, Australia. Geomorphology. 9: 311–24.

Sustainable Grazing in the Channel Country Floodplains (Phase 2)
Page 116 of 158
Knighton, A.D. and Nanson, G.C. (2000) Waterhole form and process in the anastomosing channel system of Cooper Creek, Australia. Geomorphology. 35: 101–17. Kotwicki, V. (1989) Floods in the western Lake Eyre Basin and their impact on Dalhousie Springs. In: Zeidler, W. & Ponder, W.F. (Eds) Natural History of Dalhousie Springs, South Australian Museum, Adelaide, 41–5. Kotwicki, V. (1986) Floods of Lake Eyre. E&WS Dept., Adelaide. Kotwicki, V. & Allan, R. (1998) La Niňa de Australia–contemporary and palaeo–hydrology of Lake Eyre. Palaeogeography, Palaeoclimatology, Palaeoecology. 144: 265–280. Laut, P., Keig, G., Lazarides, M., Loffler, E., Margules, C., Scott, R.M. & Sullivan, M.E. (1977) Environments of South Australia. Province 8 Northern Arid. Division of Land Use Research, CSIRO, Canberra. Long Paddock (2002). “Rainfall and Pasture Growth Maps of Australia (1990s and 2000s). 1 September 2002, <http://www.longpaddock.qld.gov.au/RainfallAndPastureGrowth/Aus/>. Accessed 2002 September 23. Magee, J.W. & Miller, G.H. (1998) Lake Eyre Palaeohydrology from 60 ka to the present: beach ridges and glacial maximum aridity. Palaeogeography, Palaeoclimatology, Palaeoecology. 144: 307–329. Makaske, B. (2001) Anastomosing rivers: a review of their classification, origin and sedimentary products. Earth–Science Reviews. 53: 149–96. Marree Soil Conservation Board (1996) Marree Soil Conservation Board District Plan 1996. Draft for Public Comment. Primary Industries South Australia. Martin P. (1998) Flood Frequencies in the Diamantina River Catchment. Undergrad report. Australian School of Environmental Studies, Griffith University, Brisbane. Mawson, W.F.Y., Hunter, H.C.B., Robinson, I.B. & Dawson, N.M. (1974) Current Land Use. In: Western Arid Region Land Use Study–Part 1. Technical Bulletin No. 12. DPI, Queensland. McDonald, W. J. F. and M. B. Thomas (1993). "Vegetation." Department of Primary Industries Technical Bulletin 30: 49–76. McGraw-Hill (2003). McGraw-Hill Dictionary of Environmental Science. McGraw-Hill Companies Inc. New York. 496 pp. McKeon, G.M., Day, K.A., Howden, S.M., Mott, J.J., Orr, D.M., Scattini, W.I. and Weston, E.J. (1990). Northern Australian savannas’ management for pastoral production. Journal of Biogeography 17: 355–72. McKeon, G.M., Hall, W.B., Crimp, S.J., Howden, S.M., Stone, R.C. and Jones, D.A. (1998). Climate change in Queensland’s grazing lands. I. Approaches and climatic trends. Rangeland Journal 20: 151–76. Mills J. R. (1980). Land Systems In “Western Arid Region Land Use Study–Part II”. Technical Bulletin No. 22 Division of Land Utilisation, Department of Primary Industries, Brisbane. 142 pp plus appendices.
Sustainable Grazing in the Channel Country Floodplains (Phase 2)
Page 117 of 158
Mills, J.R. and Ahern, C.R. (1980). Soils. In “Western Arid Region Land Use Study–Part II”. Technical Bulletin No. 22 Division of Land Utilisation, Department of Primary Industries, Brisbane. 142 pp plus appendices. Minson, D. J. and M. N. McLeod (1972). The in vitro technique: Its modification for estimating digestibility of large numbers of tropical pasture samples, Division of Tropical Pastures, Tech. Paper No. 8, CSIRO, Aust. Mollemans, F.H., Reid, J.R.W., Thompson, M.B., Alexander, L. & Pedler, L.P. (1984) Biological survey of the Cooper Creek environmental association 8.4.4, north–eastern South Australia. NP&WS, Dept. Environment & Planning, South Australia. Morton, S.R., Doherty, M.D. and Barker, R.D. (1995) Natural Heritage Values of the Lake Eyre Basin in South Australia World Heritage Assessment. CSIRO report for Department of Environment, Sport and Territories, Canberra. Murray, R. B. and M. Q. Jacobson (1982). An evaluation of dimension anaylsis for predicting shrub biomass. Journal of Range Management 35(4): 451–454. Murray, R. M. and D. L. Purcell (1967). Pastures in the sheep country. Queensland Agricultural Journal 93: 284–293. Nanson, G.C. and Knighton, A.D. (1996) Anabranching rivers: their cause, character and classification. Earth Surface Processes and Landforms. 21: 217–239. Nanson, G.C., Rust, B.R. and Taylor, G. (1986) Coexistent mud braids and anastomosing channels in an arid–zone river: Cooper Creek, Australia. Geology. 14: 175–178. Nanson, G.C., Young, R.W., Price, D.M. and Rust, B.R. (1988) Stratigraphy, Sedimentology and Late–Quaternary Chronology of the Channel Country of western Queensland. In: Warner, R.F. (Ed) Fluvial geomorphology of Australia. 151–175. Nanson, G. C., Callen R. A., Price, D.M. (1998). Hydroclimatic interpretation of Quaternary shorelines on South Australian playas. Palaeogeography, Palaeoclimatology, Palaeoecology 144: 281-305. National Land and Water Resources Atlas, Australian Natural Resources Atlas V2.0 http://audit.deh.gov.au/ANRA/rangelands/rangelands_frame.cfm?region_type=QLD®ion_code=CHC OESR (Office of Economic and Statistical Research, 2001). “Local Government Area profiles”. 27 November 2001. <http://ournet/_ContentRoot/(10)Useful%20Links/GovNet.asp>. Accessed 2002 August 5. Orr, D. M. (1975). A review of Astrebla (Mitchell grass) pastures in Australia. Tropical Grasslands 9(1): 21–36. Orr, D. M. and W. E. Holmes (1984). Mitchell Grasslands. in Management of Australia's Rangelands. G. N. Harrington, M. D. Young and A. D. Wilson. (eds) Melbourne, CSIRO: 241–254. Phelps, D. G. and Gregg, P. C. (1991). Effects of moisture stress on curly Mitchell grass, the common armyworm and the Australian plague locust. Australian Journal of Experimental Agriculture 31: 325–31.

Sustainable Grazing in the Channel Country Floodplains (Phase 2)
Page 118 of 158
Phelps, D. G. and O. J. H. Bosch (2002). A quantitative state and transition model for the Mitchell grasslands of central western Queensland. The Rangeland Journal 24(2): 242-267. Phelps, D.G. (2003). Pasture Response to Flooding and Rainfall In Australia's Arid Channel Country. Proceedings of the 7th International Rangelands Congress, Durban, South Africa. Phelps, D.G., Day K.A., Jeffery M.R., Connelly P.T., Fraser G.W., McCallum B.S., Sullivan M.T., White I.A., Roberston S.A. and Cobon D.H. (2003). Sustainable Grazing in the Channel Country Floodplains. A technical report on findings between June 1999 and August 2002. North Sydney, Meat and Livestock Australia: 134pp. Phelps, D.G., Lynes, B.C., Connelly, P.T. and Horrocks, D.J. (in press for 2007a). Cooper Creek catchment flood rules of thumb. DPI&F, Longreach. Phelps, D.G., Lynes, B.C., Connelly, P.T. and Horrocks, D.J. (in press for 2007b). Diamantina River catchment flood rules of thumb. DPI&F, Longreach. Phelps, D.G., Lynes, B.C., Connelly, P.T. and Horrocks, D.J. (in press for 2007c). Forage value in the Channel Country. A photographic guide. Pu, G., P. G. Saffigna, et al. (1999). Potential for denitrification in cereal soils of northern Australia after legume or grass–legume pastures. Soil Biology and Biochemistry 31: 667–675. Puckridge, J.T., Costelloe, J.F. & Walker, K.F. (1998a) DRY/WET: Effects of changed water regime on the fauna of arid zone wetlands (CD–ROM model and documentation). Report to National Wetlands Research & Development Program. Environment Australia and Land and Water Resources Research & Development Corporation, Canberra. Puckridge, J.T., Sheldon, F., Walker, K.F. & Boulton, A.J. (1998b) Flow variability and the ecology of large rivers. Mar. Freshwater Res. 49: 55–72. Purdie, R.W. (1984) Land Systems of the Simpson Desert region. Natural Resource Series No 2. Division of Water and Land Resources, CSIRO. Reid, J. & Gillen, J. (1988) The Coongie Lakes Study. Department of Environment and Planning, Adelaide. Roberts, J. (1999) Taking the pulse. In: Kingsford, R.T. (Ed) A free–flowing river: the ecology of the Paroo River. NSW NPWS, 233–42. Rosgen, D. L. (1994). A classification of natural rivers. Catena. 22: 169–199. Rust, B.R. (1981) Sedimentation in an arid–zone anastomosing fluvial system: Cooper’s Creek, central Australia. J. Sedimentary Petrology. 51: 745–755. Rust, B.R. and Nanson, G.C. (1986) Contemporary and palaeo channel patterns and the late Quaternary stratigraphy of Cooper Creek, southwest Queensland, Australia. Earth surface processes and landforms. 11: 581–590. Russell, J. S. and E. L. Greacen (1977). “Soil Factors in crop production in a semi-arid environment”, University of Queensland Press. Sattler, P.S. & Williams, R.D. (Eds) (1999) The Conservation status of Queensland’s Bioregional ecosystems. Environmental Protection Agency, Brisbane.
Sustainable Grazing in the Channel Country Floodplains (Phase 2)
Page 119 of 158
Sheldon F. and Thoms M.C. (2006) Relationships Between Flow Variability and Macroinvertebrate Assemblage Composition: Data From Four Australian Dryland Rivers. River Research and Applications 22, 219-238. Skerman, P.J. (1947) The soils of the Cooper Country. in: The Channel Country of South-west Queensland with special reference to Cooper’s Creek. Tech Bulletin 1. Bureau of Investigation. Queensland Dept. of Lands, Brisbane. State Public Relations Bureau (1977) Channel Country. Premier’s Department, Brisbane, Queensland. Sturt, C.M. (1847). A condensed account of an exploration in the interior of Australia. Royal Geographical Society of London: 17; 85–129. Sweeney R.A (1989). Generic Combustion Method for Determination of Crude Protein in Feeds. J. Assoc. Off. Anal. Chem. 72: 770-774. Technical Bulletin 33 (1975). Energy Allowances and Feeding Systems for Ruminants. Ministry of Agriculture, Fisheries and Food: London. 65 pp Thackway, R. & Cresswell, I.D. (1995) An Interim Biogeographic Regionalisation for Australia: a framework for establishing the national system of reserves, Version 4. Australian Nature Conservation Agency, Canberra. Tockner, K., Malard F., Ward, J. V. (2000). An extension of the flood pulse concept. Hydrological Processes 14(16/17): 2861-2883. Tothill J.C., Hargreaves J.N.G., Jones R.M., McDonald, C.K. (1992). BOTANAL–A comprehensive sampling and computing procedure for estimating pasture yield and composition 1. Field sampling, CSIRO Australia Division of Tropical Crops & Pastures, Tropical Agronomy Technical Memorandum No.78. Turner, E. J., McDonald W.J.F., Ahern, C.R., Thomas, M.B. (1993). Western arid region land use study part V. Brisbane, Department of Primary Industries Division of Land Utilisation Technical Bulletin no. 30. Twidale, C.R. & Wopfner, H. (1990) Dune Fields. in: Tyler, M.J., Twidale, C.R., Davies, M. & Wells, C.B. (Eds) Natural History of the North East Deserts. Royal Society of South Australia, 45–60. Turner, E.J., McDonald, W.J.F., Ahern, C.R. and Thomas, M.B. (1993). “Western Arid Region Land Use Study Part V”. Department of Primary Industries Technical Bulletin no. 30, published by the Division of Land Utilisation. 205 pp. Walker K.F., Sheldon F. & Puckridge J.T. (1995). A Perspective on Dryland River Ecosystems. Regulated Rivers: Research & Management 11: 85–104. Walker K.F., Puckridge J.T. & Blanch, S.J. (1997). Viewpoint: Irrigation development on Cooper Creek, central Australia–prospects for a regulated economy in a boom-and-bust ecology. Aquatic Conservation: Marine and Freshwater Ecosystems 7: 63–73. Weston, E.J. (1988). “Native pasture communities”. In: Burrows, W.H., Scanlan, J.C. and Rutherford, M.T. (Eds). Native Pastures in Queensland. Department of Primary Industries, Queensland. Information Series QI87023. 284 pp.

Sustainable Grazing in the Channel Country Floodplains (Phase 2)
Page 120 of 158
White, I. A. (2001). "With Reference to the Channel Country. Review of available information". Information Series QI01068. Department of Primary Industries, Brisbane. 108 pp. Wilson, B.A. (1999) Channel Country. In: Sattler, P.S. & Williams, R.D. (Eds) The Conservation Status of Queensland’s Bioregional Ecosystems. Environmental Protection Agency, Brisbane. Wilson, P. R., R. W. Purdie, et al. (1990). Western arid region land use survey part VI. Brisbane, Department of Primary Industries Technical Bulletin 28. Young, W.J. (1999) Hydrologic descriptions of semi-arid rivers: an ecological perspective. In: Kingsford, R.T. (Ed) A free-flowing river: the ecology of the Paroo River. NSW NPWS, 77–96. Young W.J. and Kingsford R.T. (2006) Flow Variability in Large Unregulated Rivers in Kingsford R.T. (Ed) Ecology of Desert Rivers. Cambridge University Press, Cambridge, 11-47.
Sustainable Grazing in the Channel Country Floodplains (Phase 2)
Page 121 of 158
13 Appendices 13.1 Glossary of Terms
Anabranch a diverging branch of a stream or river that loses itself in sandy soils or rejoins the main flow downstream. Anastomosis the division of a river into two or more channels with large, stable islands between the channels. Bankfull discharge the discharge of a river which is just contained within the banks. It is difficult to measure bankfull discharge in the field since not all rivers have clearly defined, crested banks. Bankfull stage the condition of a river which is only just contained by its banks. Catchment area see drainage basin. Discharge the quantity of water flowing through any cross section of a stream or river in unit time. Discharge is usually measured in cubit metres per second–cumecs–and can be calculated as A x V where A is the cross-sectional area of a stream and V is the velocity. Drainage basin an area in which surface runoff collects and from which it is carried by a drainage system, as a river and it tributaries. Also know as a catchment area; drainage area; feeding ground; gathering ground; hydrographic basin. Drainage pattern the configuration of a natural or artificial drainage system; stream patterns reflect the topography and rock patterns of the area. Drainage system a surface stream or a body of impounded surface water, together with all other such streams and bodies that are a tributary, by which a geographic area is drained. Flash flood usually in a semi-arid area, a sudden and very violent flood, often caused by unusually heavy rain. Flashy in hydrology, applied to a natural watercourse which responds rapidly to a storm event. Flocculation in soil science, the process whereby very small particles aggregate to form crumbs. The term is usually applied to clays. Flood frequency analysis the calculation of the statistical probability that a flood of a certain magnitude for a given river will occur in a certain period of time. Each flood of the river is recorded and ranked in order of magnitude with the highest rank being assigned to the largest flood. The return period here is the likely time interval between floods of a given magnitude and can be calculated as follows:
(number of years of river records + 1)/rank of a given flood Floodplain the relatively flat land stretching from either side of a river to the bottom of the valley walls. Floodplains are periodically inundated by the river water: hence the name. Flood plane the position of stream’s water surface during a particular flood. Flood stage the stage of the river when it overflows its banks.

Sustainable Grazing in the Channel Country Floodplains (Phase 2)
Page 122 of 158
Hortonian overland flow an overland flow of water occurring more or less simultaneously over a drainage basin when rainfall exceeds the infiltration capacity of the basin. Horton maintained that such overland flow was a major contribution to the rapid rise of river flow levels, and was the prime cause of soil erosion. Hortonian flow is distinct from return flow since it involves no movement of underground water back to the surface. Recent research indicates that the Hortonian model is not widely applicable. Hydraulic conductivity the ability of a soil or rock to conduct water. The conductivity of dry soil or rock is low (dry hydraulic conductivity); little water is conducted since water entering a soil must form a film of water surrounding the soil particles. Until these films are formed, little conduction occurs. Saturated hydraulic conductivity refers to the maximum rate of water movement in a soil. Hydraulic geometry the study of the interrelationships exhibited along the course of a river. Discharge is linked with the mean width of the channel, the mean depth and slope of the channel, the suspended load, and the mean water velocity. Further links are thought to exist within meanders where the wavelength of the meander is related to the radius of curvature. Hydrograph 1. a graph of discharge or of the level of water in a river throughout a period of time. The latter, known as a stage hydrograph, can be converted into a discharge hydrograph by the use of a stage–discharge rating curve. Hydrographs can be plotted for hours, days, or even months. 2. a graphical representation of stage, flow, velocity or other characteristics of water at a given point as a function of time. Lacustrine of, or relating to, a lake. Over-bank stage the stage of a river as it floods over its banks. Overland flow water flows overland either because the rainfall intensity is greater than the infiltration rate of the soil, or because the soil or rock over which it flows, has become saturated, i.e. because the water table has come to the surface. Playa describes flat topographic depressions that flood occasionally, from the Spanish playa for shore or beach. Radius of curvature in a meander, the mean distance from the centre of the curve to points at the edge of the meander. Reach a straight, continuous, or extended part of a river, stream or restricted waterway. Stage the level of water in a channel. Stage recorders monitor the depth of water at a gauging station . Because there is a relationship between discharge and stage at any point, stage can be used to calculate discharge. Stream a body of running water moving under the influence of gravity to lower levels in a narrow, clearly defined channel. Stream-length ratio the ratio of the mean length of a stream of a given order to the mean length of the next lower order stream in the same basin. Stream order the designation by a dimensionless integer series [1, 2, 3, …. ] of the relative position of stream segments in the network of a drainage basin. Also known as channel order.

Sustainable Grazing in the Channel Country Floodplains (Phase 2)
Page 123 of 158
Stream segment the part of a stream extending between designated tributary junctions. Also known as channel segment. Stream stage 1. the height of a stream in relation to its banks, variously described as bankfull stage, flood stage and over-bank stage. 2. the elevation of the water surface in a stream as measured by a river gauge with reference to some arbitrarily selected zero datum. Also known as stage. Suspended load refers to undissolved particles which are held in a stream. Thalweg 1. the line of deepest flow along the course of a river. This usually crosses and recrosses the stream channel. 2. water seeping through the ground below the surface in the same direction as a surface stream course.

Sustainable Grazing in the Channel Country Floodplains (Phase 2)
Page 124 of 158
13.2 Summary of Catchment Scale Rainfall Events and Reports on Subsequent Flooding
Table A–1. Summary of official flood events and associated rainfall patterns for Cooper Creek, Diamantina and Georgina Rivers between January 1999 and November 2005 (Bureau of Meteorology 1997, 2000a, 2000b, 2002a, 2002b, www.bom.gov.au/hydro/flood/; Long Paddock 2002, www.longpaddock.qld.gov.au/)
Date Cooper Creek Diamantina River Georgina River/Eyre Creek Associated rainfall pattern January 1999 The 1999 flood was generally Handy
Rainfall in the upper reaches of the Thomson and Barcoo Rivers and in the lower reaches of the Thomson River between Longreach and Windorah resulted in river rises throughout the system and flooding by the 2nd. A major flood ensued at Windorah from the 7th for one week, falling to moderate flood levels by the 20th.
Heavy rainfall in the upper reaches of the Diamantina River caused significant rises and flooding by the 2nd around Diamantina Lakes. River levels peaked at Diamantina Lakes on the 4th at 6.40 m, 1.4 m above the major flood level. Moderate to major flooding slowly developed downstream with the main floodwaters peaking at 7.4 m at Birdsville on the 22nd with moderate flooding receding by the 27th.
Heavy rainfall in the Avon Downs (NT) to Mount Isa area resulted in river rises to minor flood level in the upper reaches of the Georgina River from Urandangie to Marion Downs on the 5th. Minor to moderate flooding continued in the Georgina River downstream to Glengyle on Eyre Creek for several weeks with a number of different peaks as the floodwaters travelled downstream. The main floodwaters were downstream of Glengyle by February 1st.

Sustainable Grazing in the Channel Country Floodplains (Phase 2)
Page 125 of 158
Date Cooper Creek Diamantina River Georgina River/Eyre Creek Associated rainfall pattern February 1999
No significant flooding. No significant flooding. No significant flooding.
March 1999 Rainfall at the beginning of the
month caused rises in the lower Thomson River and Barcoo River with minor to moderate flooding. River levels in the downstream reaches of the Thomson and Barcoo Rivers peaked initially from local runoff, but renewed rises with continued minor to moderate flooding occurred as floodwaters from the upper catchments arrived. Moderate flooding developed at Windorah on the Cooper Creek on the 9th and high river levels were maintained for the following week as floodwaters travelled downstream.
No significant flooding. No significant flooding.

Sustainable Grazing in the Channel Country Floodplains (Phase 2)
Page 126 of 158
Date Cooper Creek Diamantina River Georgina River/Eyre Creek Associated rainfall pattern April to October 1999
No significant flooding. No significant flooding. No significant flooding.
November 1999
Rainfall over the weekend of the 20th, together with further scattered showers during the following week resulted in rises and moderate flooding in the Thomson River. Minor flooding occurred in the lower Barcoo River as a result of the initial rain, with renewed rises peaking as major flooding on the 30th at Retreat. By the end of the month river levels downstream at Windorah on Cooper Creek had reached the moderate flood level.
No significant flooding. No significant flooding.

Sustainable Grazing in the Channel Country Floodplains (Phase 2)
Page 127 of 158
Date Cooper Creek Diamantina River Georgina River/Eyre Creek Associated rainfall pattern December 1999
November waters reached major flood levels at Windorah by the 3rd, but were subsiding by the 6th. Renewed rises in the lower Thomson and Barcoo Rivers followed rainfalls of the 28th and again caused major flooding in the Windorah area which continued into the new year.
No significant flooding. No significant flooding.
January 2000 The 2000 flood was generally Good
The main floodwaters in the Cooper Creek system were downstream of Windorah by the 1st. However major flooding was still occurring in Cooper Creek at Windorah and moderate flooding in the Thomson River at Jundah. Flood levels had subsided by the 5th.
Minor to moderate flooding throughout the month, with a moderate flood peaking at Birdsville (Diamantina) on the 20th, and at Glengyle (Eyre Creek) on the 17th.
No significant flooding.
February 2000
Very heavy rainfall over a few days in mid February resulted in major flooding in the Thomson River which continued downstream in Cooper Creek into March. The level of the Thomson River at Muttaburra was one of the highest flood peaks on record and this was reflected in the major flood levels reached at the downstream river height stations, including Longreach.
The township of Winton in the upper Diamantina River catchment was subjected to some of its most severe flooding on record mid month. The monsoonal trough that caused this rainfall resulted in widespread moderate to major flooding downstream along the Diamantina River that continued into March.
Moderate to major flooding commenced in the upper reaches of the Georgina River mid month and continued in the lower reaches into March.

Sustainable Grazing in the Channel Country Floodplains (Phase 2)
Page 128 of 158
Date Cooper Creek Diamantina River Georgina River/Eyre Creek Associated rainfall pattern March 2000 At the beginning of the month,
major flooding was easing in the Thomson River at Longreach, with the main floodwaters downstream in the Jundah area. Major flooding continued into Cooper Creek during the month, with the floodwaters peaking at Windorah on the 3rd. River levels peaked at Durham Downs on the 17th and by the end of the month, the floodwaters were approaching Nappa Merrie. Floodwaters in Cooper Creek were receding by the 19th.
Moderate flooding on the Diamantina eased at Diamantina Lakes at the beginning of the month. A moderate flood at Monkira peaked over the 4th/5th and at Birdsville on the 23rd. Renewed rises occurred upstream during the middle of the month, but these did not have an impact on downstream levels.
Minor to moderate flooding occurred throughout the Georgina River and Eyre Creek system at the beginning of the month, with the main floodwaters still being in the upper reaches of the Georgina River in the Urandangie area. The floodwaters moved very slowly downstream during the month, peaking at Marion Downs on the 12th with major flooding, and Glengyle on the 22nd, with moderate flooding.
April to October 2000
No significant flooding. No significant flooding. No significant flooding.
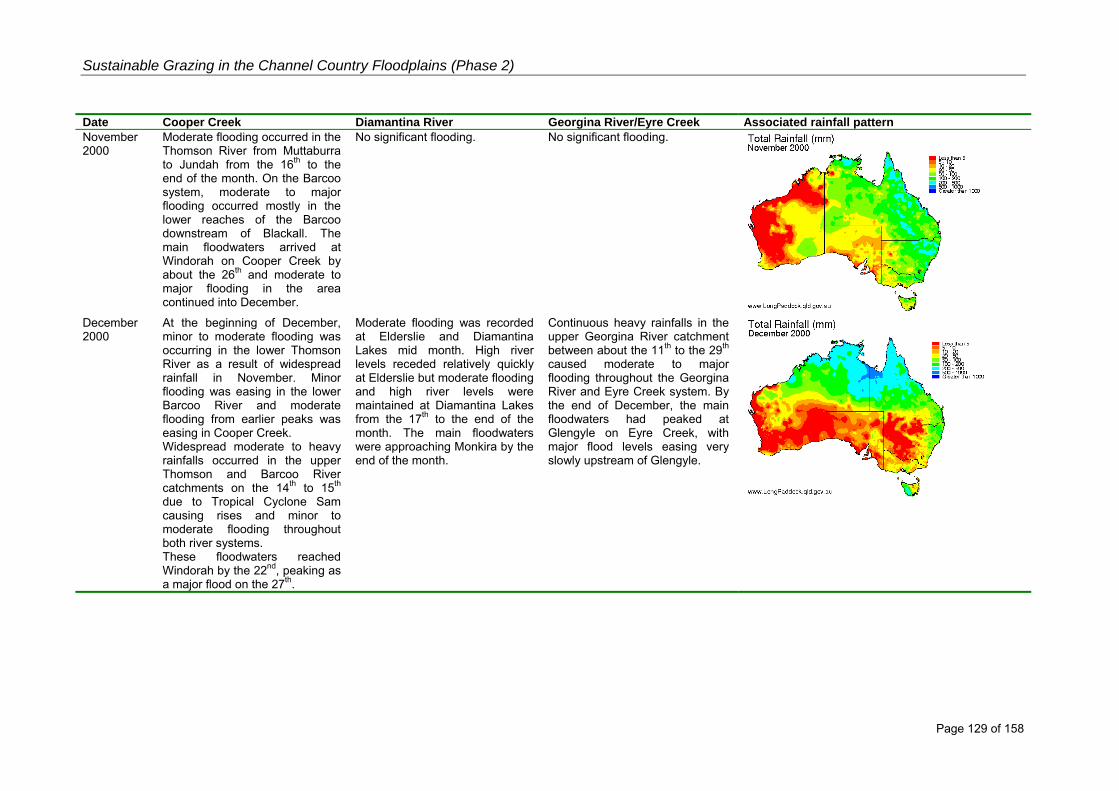
Sustainable Grazing in the Channel Country Floodplains (Phase 2)
Page 129 of 158
Date Cooper Creek Diamantina River Georgina River/Eyre Creek Associated rainfall pattern November 2000
Moderate flooding occurred in the Thomson River from Muttaburra to Jundah from the 16th to the end of the month. On the Barcoo system, moderate to major flooding occurred mostly in the lower reaches of the Barcoo downstream of Blackall. The main floodwaters arrived at Windorah on Cooper Creek by about the 26th and moderate to major flooding in the area continued into December.
No significant flooding. No significant flooding.
December 2000
At the beginning of December, minor to moderate flooding was occurring in the lower Thomson River as a result of widespread rainfall in November. Minor flooding was easing in the lower Barcoo River and moderate flooding from earlier peaks was easing in Cooper Creek. Widespread moderate to heavy rainfalls occurred in the upper Thomson and Barcoo River catchments on the 14th to 15th due to Tropical Cyclone Sam causing rises and minor to moderate flooding throughout both river systems. These floodwaters reached Windorah by the 22nd, peaking as a major flood on the 27th.
Moderate flooding was recorded at Elderslie and Diamantina Lakes mid month. High river levels receded relatively quickly at Elderslie but moderate flooding and high river levels were maintained at Diamantina Lakes from the 17th to the end of the month. The main floodwaters were approaching Monkira by the end of the month.
Continuous heavy rainfalls in the upper Georgina River catchment between about the 11th to the 29th caused moderate to major flooding throughout the Georgina River and Eyre Creek system. By the end of December, the main floodwaters had peaked at Glengyle on Eyre Creek, with major flood levels easing very slowly upstream of Glengyle.

Sustainable Grazing in the Channel Country Floodplains (Phase 2)
Page 130 of 158
Date Cooper Creek Diamantina River Georgina River/Eyre Creek Associated rainfall pattern January 2001 The 2001 flood ranged from Gutter to Handy
December flooding continued well into January as a result of widespread rainfall in the upper Thomson and Barcoo River catchments through mid December and early January. A second, lower, peak reached Windorah on the 19th with the resulting minor flooding receding by the 23rd.
Flooding continued in the Diamantina River as a result of rain in December and by the end of December the main floodwaters were approaching Monkira. Moderate flooding continued in the system until the 23rd.
By the end of December, the main floodwaters had peaked at Glengyle on Eyre Creek, with major flood levels easing very slowly upstream of Glengyle. By the end of January moderate flooding in the lower reaches was easing.
February to November 2001
No significant flooding. No significant flooding. No significant flooding.
December 2001
On the 15th heavy falls of rain of up to 125 mm were recorded in the middle reaches of the Thomson and Barcoo Rivers. As a result, moderate flooding occurred in the lower reaches of the Thomson River and also in the lower reaches of the Barcoo River. A peak, just over the major flood level, was recorded at Windorah on the 26th.
No significant flooding. No significant flooding.

Sustainable Grazing in the Channel Country Floodplains (Phase 2)
Page 131 of 158
Date Cooper Creek Diamantina River Georgina River/Eyre Creek Associated rainfall pattern January 2002 The 2002 flood ranged from Gutter to Handy
Heavy rainfall on the 5th, 6th and 7th caused minor flooding in the upper Barcoo and moderate flooding downstream. Heavy rainfall on the 5th and 6th caused minor flooding in the Thomson river between the 6th and 19th of the month. The floodwaters from the Barcoo and Thomson combined to cause moderate flooding at Windorah, with a peak recorded on the 19th.
Isolated occurrences of minor flooding in the Diamantina River at Diamantina Lakes during the middle of January.
Isolated occurrences of minor flooding in the Georgina River at Urandangie during the middle of January.
February 2002 to January 2003
No significant flooding. No significant flooding. No significant flooding.

Sustainable Grazing in the Channel Country Floodplains (Phase 2)
Page 132 of 158
Date Cooper Creek Diamantina River Georgina River/Eyre Creek Associated rainfall pattern February 2003 The 2003 flood was a Gutter flood
Very heavy isolated rainfall was reported in the upper reaches of the Alice and Barcoo Rivers on 9th and 10th February. Minor flooding occurred in the Barcoo River and Blackall and moderate flooding in the Alice River at Jericho. No significant flooding was recorded in the lower reaches of the Barcoo River. The initial flood warning was issued on the 10th February and the warning finalized on the 16th February.
No significant flooding reported by BoM, although local reports indicate Handy flooding.
No significant flooding.
March to December 2003
No significant flooding. No significant flooding. No significant flooding.
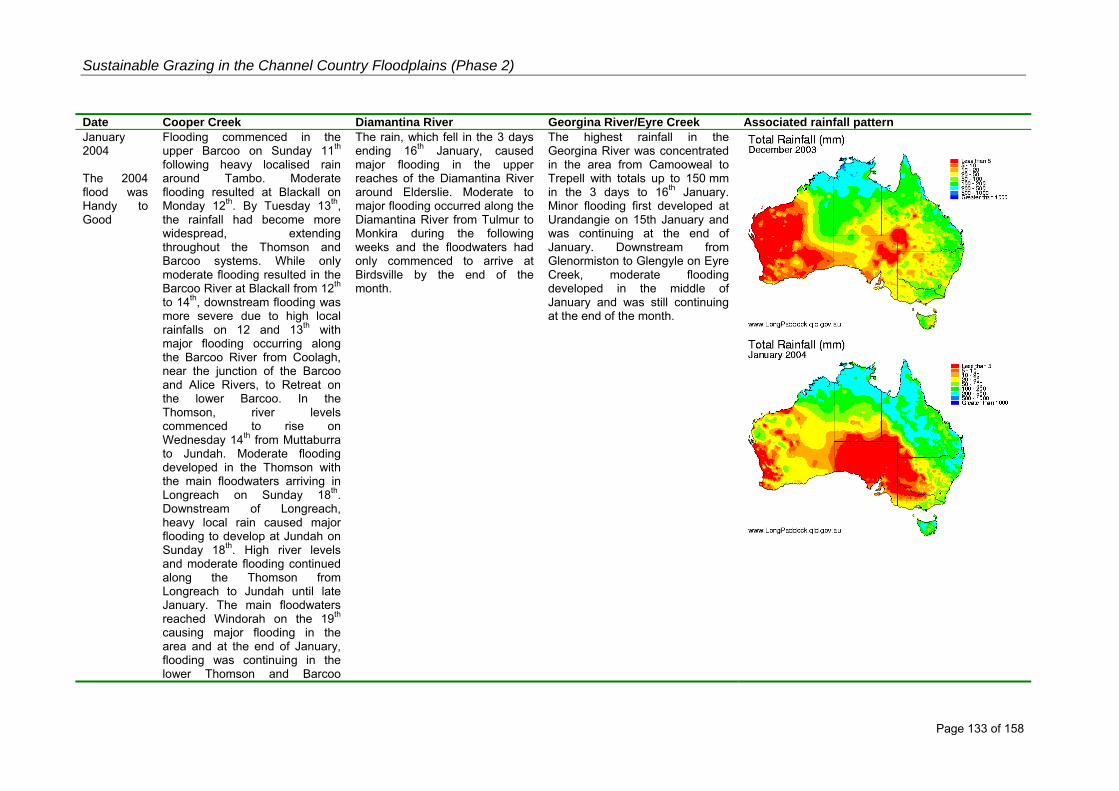
Sustainable Grazing in the Channel Country Floodplains (Phase 2)
Page 133 of 158
Date Cooper Creek Diamantina River Georgina River/Eyre Creek Associated rainfall pattern January 2004 The 2004 flood was Handy to Good
Flooding commenced in the upper Barcoo on Sunday 11th following heavy localised rain around Tambo. Moderate flooding resulted at Blackall on Monday 12th. By Tuesday 13th, the rainfall had become more widespread, extending throughout the Thomson and Barcoo systems. While only moderate flooding resulted in the Barcoo River at Blackall from 12th to 14th, downstream flooding was more severe due to high local rainfalls on 12 and 13th with major flooding occurring along the Barcoo River from Coolagh, near the junction of the Barcoo and Alice Rivers, to Retreat on the lower Barcoo. In the Thomson, river levels commenced to rise on Wednesday 14th from Muttaburra to Jundah. Moderate flooding developed in the Thomson with the main floodwaters arriving in Longreach on Sunday 18th. Downstream of Longreach, heavy local rain caused major flooding to develop at Jundah on Sunday 18th. High river levels and moderate flooding continued along the Thomson from Longreach to Jundah until late January. The main floodwaters reached Windorah on the 19th causing major flooding in the area and at the end of January, flooding was continuing in the lower Thomson and Barcoo
The rain, which fell in the 3 days ending 16th January, caused major flooding in the upper reaches of the Diamantina River around Elderslie. Moderate to major flooding occurred along the Diamantina River from Tulmur to Monkira during the following weeks and the floodwaters had only commenced to arrive at Birdsville by the end of the month.
The highest rainfall in the Georgina River was concentrated in the area from Camooweal to Trepell with totals up to 150 mm in the 3 days to 16th January. Minor flooding first developed at Urandangie on 15th January and was continuing at the end of January. Downstream from Glenormiston to Glengyle on Eyre Creek, moderate flooding developed in the middle of January and was still continuing at the end of the month.

Sustainable Grazing in the Channel Country Floodplains (Phase 2)
Page 134 of 158
Date Cooper Creek Diamantina River Georgina River/Eyre Creek Associated rainfall pattern Rivers and in Cooper Creek.
February 2004
January floodwaters moved through the lower reaches of Cooper Creek during February, resulting in minor flooding at Nappa Merrie. Renewed rises occurred in the Thomson and Barcoo Rivers as a result of isolated storm activity. Renewed flood levels in the upper Barcoo River to Blackall in February exceeded those recorded in January.
Moderate flooding continued throughout most of February in the Diamantina River as floodwaters lingered around the Birdsville area.
Several flood peaks caused by storm activity moved through the Georgina system throughout February. This ensured that river levels and moderate flooding at Monkira continued throughout the month. Floodwaters from catchments in western Queensland have now moved across the border and into Lake Eyre.
March 2004 No significant flooding. No significant flooding. Flooding in the lower reaches of
Eyre Creek, which commenced in January, had eased by the first week of March.

Sustainable Grazing in the Channel Country Floodplains (Phase 2)
Page 135 of 158
Date Cooper Creek Diamantina River Georgina River/Eyre Creek Associated rainfall pattern April to November 2004
No significant flooding. No significant flooding. No significant flooding.
December 2004
During the period 10th to 16th December, there was minor flooding along the Barcoo River to Isisford.
No significant flooding. No significant flooding.

Sustainable Grazing in the Channel Country Floodplains (Phase 2)
Page 136 of 158
Date Cooper Creek Diamantina River Georgina River/Eyre Creek Associated rainfall pattern January 2005
No significant flooding. No significant flooding. Widespread rainfall occurred in the Georgina River catchment from the 5th to the 6th with the heavier rainfall in the upstream catchment around Camooweal. River rises occurred at Urandangie and minor flooding peaked on the 9th. Minor to moderate flooding continued downstream with the main floodwaters reaching Marion Downs by the 22nd, although an earlier moderate flood peak had been recorded at Marion Downs from local area rainfall. Moderate flooding continued downstream into Eyre Creek with floodwaters peaking at Glengyle at the end of the month.
February 2005
No significant flooding. No significant flooding. Moderate flooding, which resulted from rainfall during January, continued in Eyre Creek around Glengyle during the first week of February but had eased by the middle of the month.
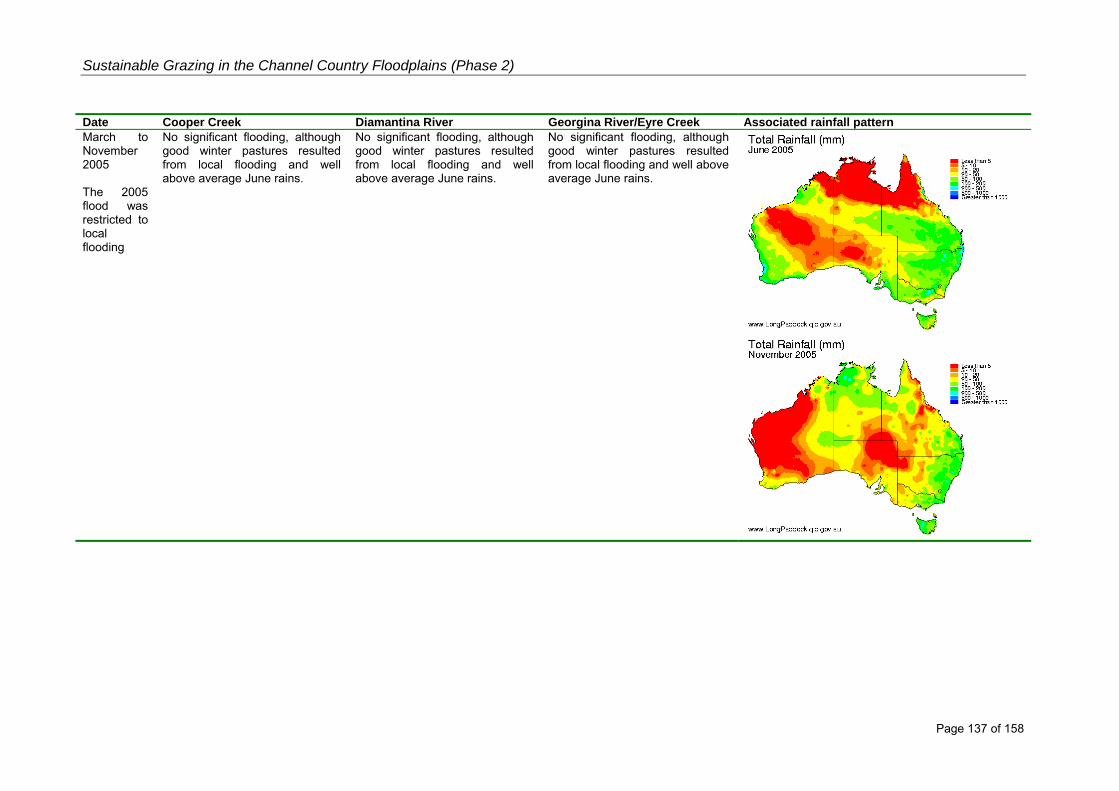
Sustainable Grazing in the Channel Country Floodplains (Phase 2)
Page 137 of 158
Date Cooper Creek Diamantina River Georgina River/Eyre Creek Associated rainfall pattern March to November 2005 The 2005 flood was restricted to local flooding
No significant flooding, although good winter pastures resulted from local flooding and well above average June rains.
No significant flooding, although good winter pastures resulted from local flooding and well above average June rains.
No significant flooding, although good winter pastures resulted from local flooding and well above average June rains.

Page 138 of 158
13.3 Summary of Flood Categories for Major Published Events for a) Cooper Creek and b) Diamantina River
Table A–2. BoM and SGCCF flood ratings for a) Cooper Creek and b) the Diamantina River based on the data sources indicated a) Cooper Creek Year Flood Size (BoM) Flood type (SGCCF) Data source 1882 Moderate–Major Handy Kotwicki 2003 1885 Moderate–Major Handy Kotwicki 2003 1887 Moderate–Major Handy Kotwicki 2003 1890 Major Good Kotwicki 2003 1892 Minor–Moderate Handy Kotwicki 2003 1893 Major Good Kotwicki 2003 1894 Moderate–Major Handy Kotwicki 2003 1898 Major Good Kotwicki 2003; Kingsford (1999) 1903 Minor Gutter Kotwicki 2003 1906 Major Good Kotwicki 2003; Kingsford (1999) 1907 Major Good Kotwicki 2003 1908 Moderate Handy Kotwicki 2003 1910 Moderate Handy Kotwicki 2003 1911 Minor–Moderate Gutter Kotwicki 2003 1913 Minor–Moderate Gutter Kotwicki 2003 1917 Moderate Handy Kotwicki 2003; Kingsford (1999) 1918 Moderate Handy Kotwicki 2003; Kingsford (1999) 1920 Moderate Handy Kotwicki 2003; Kingsford (1999) 1921 Minor Gutter Kotwicki 2003 1922 Major Good Kotwicki 2003 1923 Moderate Handy Kotwicki 2003; Kingsford (1999) 1924 Minor Handy Kotwicki 2003 1925 Minor Channel Kotwicki 2003 1928 Minor Channel Kotwicki 2003 1930 Minor Channel 1948 Bureau of Investigation report; Kotwicki 2003;
Kingsford (1999) 1931 Minor Gutter 1948 Bureau of Investigation report; Kotwicki 2003;
Kingsford (1999) 1932 Minor Gutter 1948 Bureau of Investigation report; Kotwicki 2003 1933 Minor Handy 1948 Bureau of Investigation report; Kotwicki 2003 1934 Moderate Handy 1948 Bureau of Investigation report 1935 Minor Channel 1948 Bureau of Investigation report; Kotwicki 2003 1936 Moderate Handy 1948 Bureau of Investigation report; Kotwicki 2003;
Kingsford (1999) 1937 Minor Gutter 1948 Bureau of Investigation report 1938 Minor Gutter 1948 Bureau of Investigation report 1940 Major Good 1948 Bureau of Investigation report 1941 Major Good 1948 Bureau of Investigation report 1943 Minor Gutter 1948 Bureau of Investigation report 1944 Major Good 1948 Bureau of Investigation report 1945 Minor Gutter 1948 Bureau of Investigation report 1946 Moderate Handy 1948 Bureau of Investigation report 1949 Moderate Handy BoM data; Kingsford (1999) 1950 Major Good BoM data; Kingsford (1999) 1951 Major Good BoM data; Kingsford (1999) 1953 Major Handy BoM data 1954 Major Handy BoM data; Kingsford (1999) 1955 Major Good BoM data; Kingsford (1999) 1956 Major Handy BoM data; Kingsford (1999)
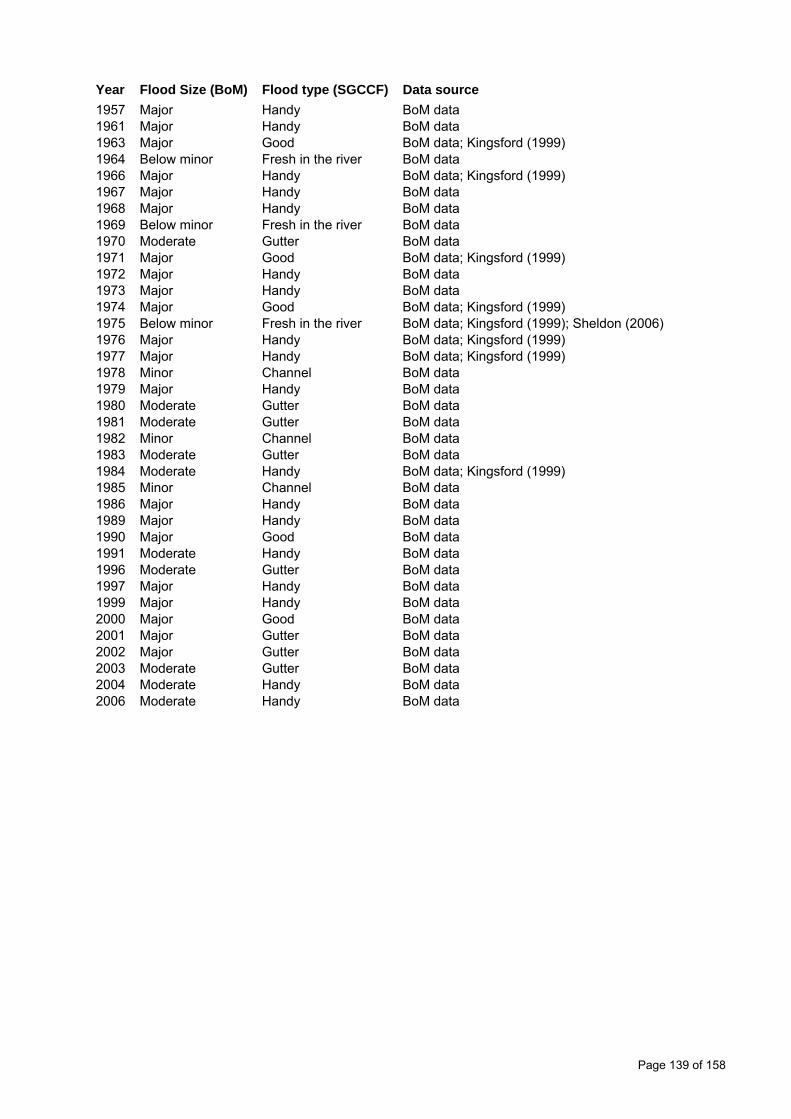
Page 139 of 158
Year Flood Size (BoM) Flood type (SGCCF) Data source 1957 Major Handy BoM data 1961 Major Handy BoM data 1963 Major Good BoM data; Kingsford (1999) 1964 Below minor Fresh in the river BoM data 1966 Major Handy BoM data; Kingsford (1999) 1967 Major Handy BoM data 1968 Major Handy BoM data 1969 Below minor Fresh in the river BoM data 1970 Moderate Gutter BoM data 1971 Major Good BoM data; Kingsford (1999) 1972 Major Handy BoM data 1973 Major Handy BoM data 1974 Major Good BoM data; Kingsford (1999) 1975 Below minor Fresh in the river BoM data; Kingsford (1999); Sheldon (2006) 1976 Major Handy BoM data; Kingsford (1999) 1977 Major Handy BoM data; Kingsford (1999) 1978 Minor Channel BoM data 1979 Major Handy BoM data 1980 Moderate Gutter BoM data 1981 Moderate Gutter BoM data 1982 Minor Channel BoM data 1983 Moderate Gutter BoM data 1984 Moderate Handy BoM data; Kingsford (1999) 1985 Minor Channel BoM data 1986 Major Handy BoM data 1989 Major Handy BoM data 1990 Major Good BoM data 1991 Moderate Handy BoM data 1996 Moderate Gutter BoM data 1997 Major Handy BoM data 1999 Major Handy BoM data 2000 Major Good BoM data 2001 Major Gutter BoM data 2002 Major Gutter BoM data 2003 Moderate Gutter BoM data 2004 Moderate Handy BoM data 2006 Moderate Handy BoM data

Page 140 of 158
b) Diamantina Year Flood Size (BoM) Flood type (SGCCF) Data source 1876 Moderate Handy Martin 1998 1879 Moderate Handy Martin 1998 1880 Moderate Handy Martin 1998 1882 Moderate Handy Kotwicki 2003 1887 Moderate Handy Martin 1998 1890 Moderate Handy Martin 1998 1893 Moderate Handy Kotwicki 2003 1894 Major Good Kotwicki 2003 1899 Minor Channel Kotwicki 2003 1903 Minor Channel Kotwicki 2003 1904 Major Good Kotwicki 2003 1906 Moderate Handy Martin 1998 1907 Moderate Handy Kotwicki 2003 1908 Major Good Kotwicki 2003 1910 Moderate Handy Kotwicki 2003 1912 Moderate Handy Kotwicki 2003 1913 Minor Channel Kotwicki 2003 1914 Minor Channel Kotwicki 2003 1916 Minor Channel Kotwicki 2003 1917 Moderate Handy Martin 1998 1918 Major Good Martin 1998 1920 Moderate Handy Martin 1998 1922 Moderate Handy Kotwicki 2003; Martin 1998 1925 Moderate Handy Martin 1998 1928 Minor Channel Kotwicki 2003 1930 Moderate Handy Kotwicki 2003; Martin 1998 1932 Moderate Handy Kotwicki 2003 1933 Minor Channel Kotwicki 2003 1935 Moderate Handy Kotwicki 2003; Martin 1998 1937 Major Good Martin 1998 1939 Moderate Handy Martin 1998 1940 Moderate Handy Martin 1998 1941 Moderate Handy Martin 1998 1949 Moderate Handy Martin 1998 1950 Major Good Martin 1998 1953 Major Handy Martin 1998 1955 Major Handy Martin 1998 1956 Moderate Handy Martin 1998 1963 Major Good Martin 1998 1967 Moderate Handy BoM data; Costelloe 2004; Martin 1998 1968 Major Good BoM data; Costelloe 2004; Martin 1998 1969 Below minor Handy BoM data; Costelloe 2004 1970 Major Good BoM data; Costelloe 2004 1971 Major Good BoM data; Costelloe 2004; Martin 1998 1972 Moderate Handy BoM data; Costelloe 2004 1973 Major Good BoM data; Costelloe 2004; Martin 1998 1974 Major Good BoM data; Costelloe 2004; Martin 1998 1975 Moderate Handy BoM data; Costelloe 2004 1976 Major Good BoM data; Costelloe 2004; Martin 1998 1977 Major Good BoM data; Costelloe 2004; Martin 1998 1978 Below minor Handy BoM data; Costelloe 2004 1979 Minor Channel BoM data; Costelloe 2004 1980 Moderate Handy BoM data; Costelloe 2004; Martin 1998 1981 Major Good BoM data; Costelloe 2004; Martin 1998 1982 Below minor Handy BoM data; Costelloe 2004

Page 141 of 158
Year Flood Size (BoM) Flood type (SGCCF) Data source 1983 Below minor Handy BoM data; Costelloe 2004 1984 Moderate Good BoM data; Costelloe 2004; Martin 1998 1985 Moderate Handy BoM data; Costelloe 2004; Martin 1998 1986 Moderate Handy BoM data; Costelloe 2004; Martin 1998 1987 Moderate Handy BoM data; Costelloe 2004; Martin 1998 1988 Moderate Handy BoM data; Costelloe 2004 1989 Moderate Handy BoM data; Martin 1998 1990 Moderate Handy BoM data; Martin 1998 1991 Moderate Handy BoM data; Martin 1998 1992 Moderate Handy BoM data; Martin 1998 1993 Moderate Handy BoM data; Martin 1998 1994 Moderate Handy BoM data; Martin 1998 1995 Moderate Handy BoM data; Martin 1998 1997 Moderate Handy BoM data; Martin 1998 1998 Major Handy BoM data; Martin 1998 1999 Major Good BoM data 2000 Major Good BoM data 2001 Below minor Handy BoM data; Costelloe 2004 2002 Below minor Handy BoM data; Costelloe 2004 2003 Moderate Handy BoM data 2004 Moderate Good BoM data 2006 Moderate Handy BoM data

Page 142 of 158
13.4 Automated gauge depth (m) and resultant soil moisture levels (%) from selected sites following the 2004 flood pulse
a) Site 1 (C1 bluebush) i) flood depth
0.0
0.0
0.0
0.1
0.1
0.1
0.1
0.1
0.2
26/0
1/04
27/0
1/04
27/0
1/04
27/0
1/04
27/0
1/04
27/0
1/04
27/0
1/04
28/0
1/04
28/0
1/04
28/0
1/04
28/0
1/04
28/0
1/04
29/0
1/04
29/0
1/04
29/0
1/04
29/0
1/04
30/0
1/04
30/0
1/04
30/0
1/04
30/0
1/04
31/0
1/04
31/0
1/04
31/0
1/04
31/0
1/04
2/01
/200
4
2/01
/200
4
2/01
/200
4
2/01
/200
4
2/01
/200
4
2/01
/200
4
2/02
/200
4
2/02
/200
4
2/02
/200
4
2/02
/200
4
2/02
/200
4
2/02
/200
4
2/02
/200
4
2/02
/200
4
2/02
/200
4
2/02
/200
4
2/02
/200
4
Date
Floo
d de
pth
(m)
ii) resultant soil moisture profile
0
10
20
30
40
50
60
70
80
90
100
0 5 10 15 20 25 30 35 40 45 50
Soil moisture (%)
Soil
dept
h (c
m)
2-Dec-0326-Apr-042-Aug-043-Apr-01
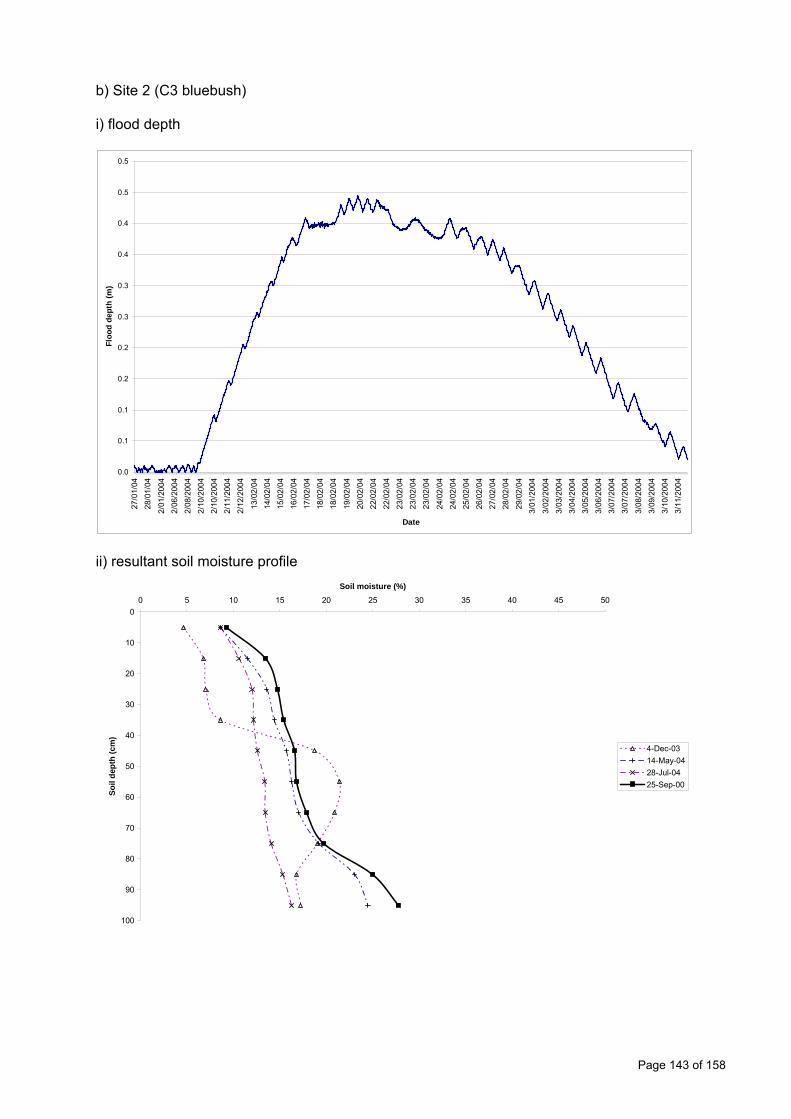
Page 143 of 158
b) Site 2 (C3 bluebush) i) flood depth
0.0
0.1
0.1
0.2
0.2
0.3
0.3
0.4
0.4
0.5
0.5
27/0
1/04
28/0
1/04
2/01
/200
42/
06/2
004
2/08
/200
42/
10/2
004
2/10
/200
42/
11/2
004
2/12
/200
4
13/0
2/04
14/0
2/04
15/0
2/04
16/0
2/04
17/0
2/04
18/0
2/04
18/0
2/04
19/0
2/04
20/0
2/04
22/0
2/04
22/0
2/04
23/0
2/04
23/0
2/04
23/0
2/04
24/0
2/04
24/0
2/04
25/0
2/04
26/0
2/04
27/0
2/04
28/0
2/04
29/0
2/04
3/01
/200
4
3/02
/200
43/
03/2
004
3/04
/200
43/
05/2
004
3/06
/200
43/
07/2
004
3/07
/200
4
3/08
/200
43/
09/2
004
3/10
/200
43/
11/2
004
Date
Floo
d de
pth
(m)
ii) resultant soil moisture profile
0
10
20
30
40
50
60
70
80
90
100
0 5 10 15 20 25 30 35 40 45 50
Soil moisture (%)
Soil
dept
h (c
m)
4-Dec-0314-May-0428-Jul-0425-Sep-00
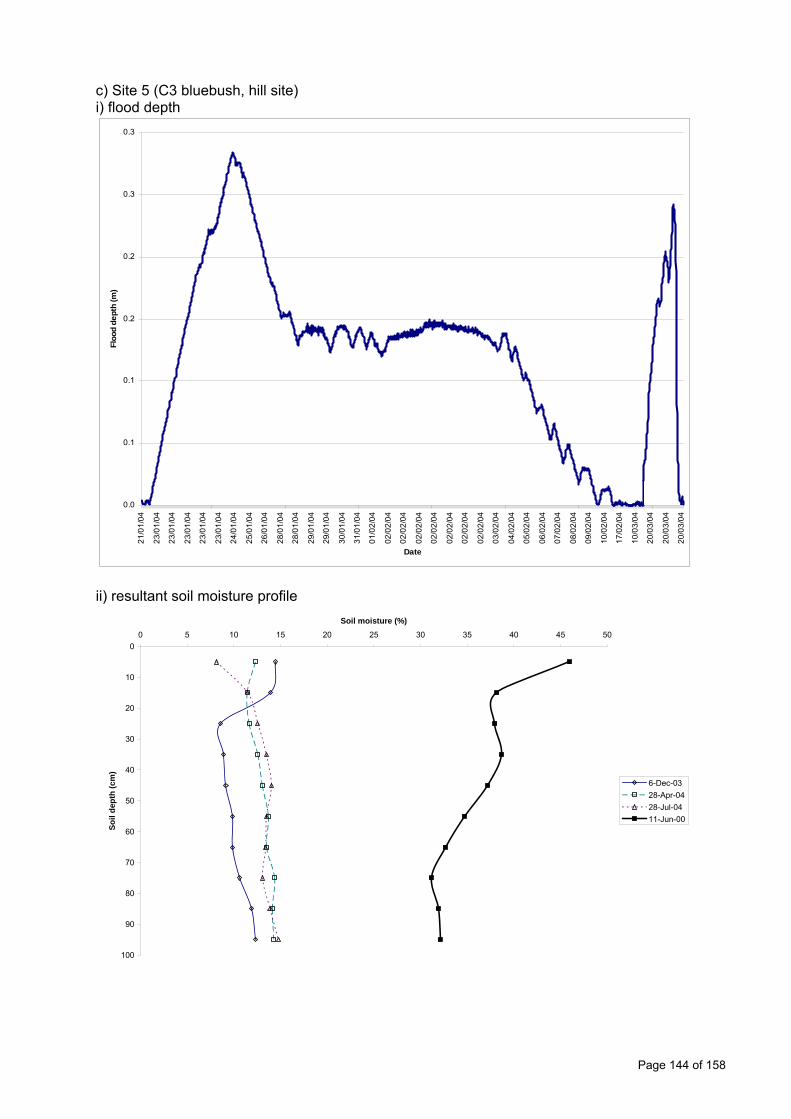
Page 144 of 158
c) Site 5 (C3 bluebush, hill site) i) flood depth
0.0
0.1
0.1
0.2
0.2
0.3
0.321
/01/
04
23/0
1/04
23/0
1/04
23/0
1/04
23/0
1/04
23/0
1/04
24/0
1/04
25/0
1/04
26/0
1/04
28/0
1/04
28/0
1/04
29/0
1/04
29/0
1/04
30/0
1/04
31/0
1/04
01/0
2/04
02/0
2/04
02/0
2/04
02/0
2/04
02/0
2/04
02/0
2/04
02/0
2/04
02/0
2/04
03/0
2/04
04/0
2/04
05/0
2/04
06/0
2/04
07/0
2/04
08/0
2/04
09/0
2/04
10/0
2/04
17/0
2/04
10/0
3/04
20/0
3/04
20/0
3/04
20/0
3/04
Date
Floo
d de
pth
(m)
ii) resultant soil moisture profile
0
10
20
30
40
50
60
70
80
90
100
0 5 10 15 20 25 30 35 40 45 50
Soil moisture (%)
Soil
dept
h (c
m)
6-Dec-0328-Apr-0428-Jul-0411-Jun-00
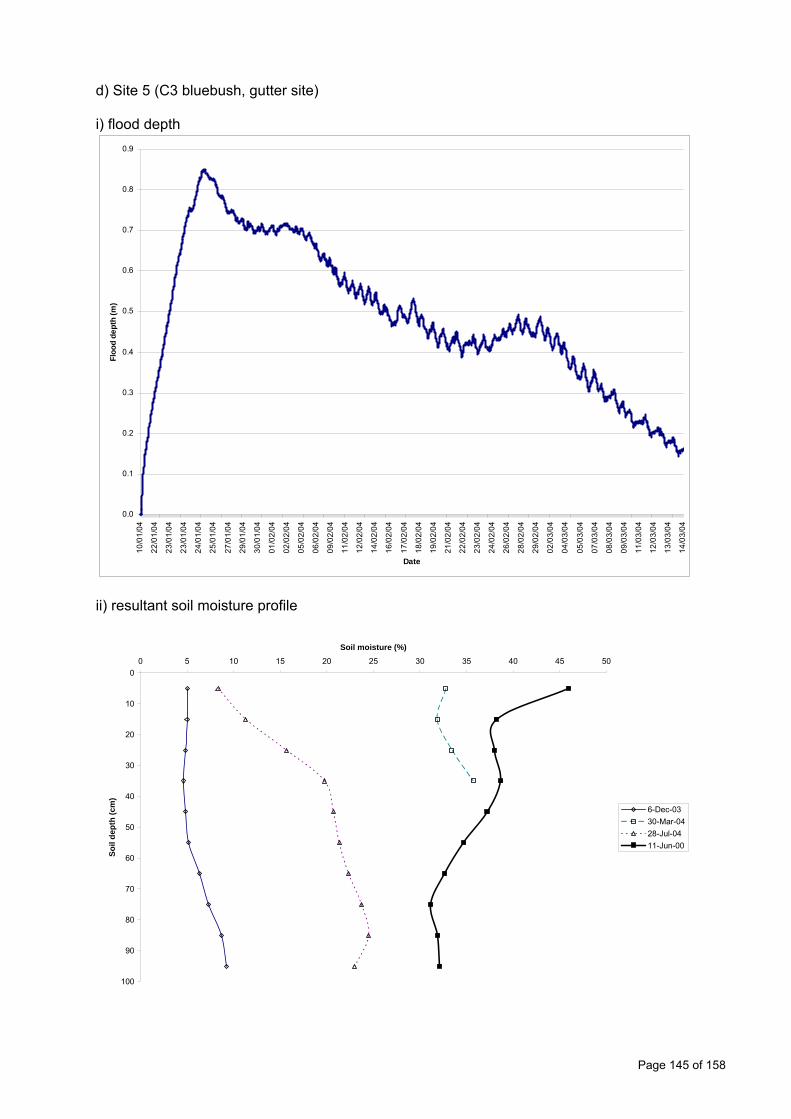
Page 145 of 158
d) Site 5 (C3 bluebush, gutter site) i) flood depth
0.0
0.1
0.2
0.3
0.4
0.5
0.6
0.7
0.8
0.910
/01/
04
22/0
1/04
23/0
1/04
23/0
1/04
24/0
1/04
25/0
1/04
27/0
1/04
29/0
1/04
30/0
1/04
01/0
2/04
02/0
2/04
05/0
2/04
06/0
2/04
09/0
2/04
11/0
2/04
12/0
2/04
14/0
2/04
16/0
2/04
17/0
2/04
18/0
2/04
19/0
2/04
21/0
2/04
22/0
2/04
23/0
2/04
24/0
2/04
26/0
2/04
28/0
2/04
29/0
2/04
02/0
3/04
04/0
3/04
05/0
3/04
07/0
3/04
08/0
3/04
09/0
3/04
11/0
3/04
12/0
3/04
13/0
3/04
14/0
3/04
Date
Floo
d de
pth
(m)
ii) resultant soil moisture profile
0
10
20
30
40
50
60
70
80
90
100
0 5 10 15 20 25 30 35 40 45 50
Soil moisture (%)
Soil
dept
h (c
m)
6-Dec-0330-Mar-0428-Jul-0411-Jun-00

Page 146 of 158
e) Site 7 (C1 lignum) i) flood depth
0.0
0.0
0.0
0.1
0.1
0.1
0.1
0.1
0.2
0.2
0.226
/01/
07
27/0
1/07
28/0
1/07
29/0
1/07
30/0
1/07
2/01
/200
7
2/01
/200
7
2/02
/200
7
2/02
/200
7
2/02
/200
7
2/02
/200
7
2/02
/200
7
2/03
/200
7
2/05
/200
7
2/07
/200
7
2/09
/200
7
2/11
/200
7
2/12
/200
7
14/0
2/07
15/0
2/07
17/0
2/07
18/0
2/07
20/0
2/07
21/0
2/07
23/0
2/07
24/0
2/07
27/0
2/07
3/01
/200
7
3/03
/200
7
3/05
/200
7
3/06
/200
7
3/07
/200
7
3/09
/200
7
3/10
/200
7
3/12
/200
7
13/0
3/07
14/0
3/07
16/0
3/07
18/0
3/07
19/0
3/07
21/0
3/07
22/0
3/07
24/0
3/07
26/0
3/07
Date
Floo
d de
pth
(m)
ii) resultant soil moisture profile
0
10
20
30
40
50
60
70
80
90
100
0 5 10 15 20 25 30 35 40 45 50
Soil moisture (%)
Soil
dept
h (c
m)
3-Dec-0327-Apr-041-Aug-0413-Jun-00

Page 147 of 158
f) Site 8 (C1 lignum) i) flood depth
0.0
0.2
0.4
0.6
0.8
1.0
1.21/
10/2
004
1/11
/200
4
1/12
/200
413
/01/
0414
/01/
0415
/01/
0416
/01/
04
17/0
1/04
18/0
1/04
19/0
1/04
20/0
1/04
20/0
1/04
21/0
1/04
21/0
1/04
21/0
1/04
21/0
1/04
21/0
1/04
21/0
1/04
22/0
1/04
22/0
1/04
23/0
1/04
25/0
1/04
27/0
1/04
28/0
1/04
28/0
1/04
28/0
1/04
29/0
1/04
29/0
1/04
29/0
1/04
30/0
1/04
30/0
1/04
30/0
1/04
31/0
1/04
31/0
1/04
2/01
/200
42/
01/2
004
2/01
/200
42/
02/2
004
2/02
/200
4
2/02
/200
42/
02/2
004
2/02
/200
42/
03/2
004
2/04
/200
42/
05/2
004
2/06
/200
42/
06/2
004
2/07
/200
4
Date
Floo
d de
pth
(m)
ii) resultant soil moisture profile
0
10
20
30
40
50
60
70
80
90
100
0 5 10 15 20 25 30 35 40 45 50
Soil moisture (%)
Soil
dept
h (c
m)
1-Dec-0324-Apr-0425-Jun-0425-May-00

Page 148 of 158
g) Site 10 (C1 lignum) i) flood depth
0.0
0.1
0.1
0.2
0.2
0.3
0.3
0.4
0.4
22/0
1/04
23/0
1/04
24/0
1/04
26/0
1/04
28/0
1/04
30/0
1/04
2/02
/200
4
2/05
/200
4
2/07
/200
4
2/08
/200
4
2/10
/200
4
2/11
/200
4
13/0
2/04
14/0
2/04
16/0
2/04
17/0
2/04
18/0
2/04
19/0
2/04
21/0
2/04
22/0
2/04
23/0
2/04
25/0
2/04
26/0
2/04
27/0
2/04
29/0
2/04
3/01
/200
4
3/02
/200
4
3/04
/200
4
3/05
/200
4
3/06
/200
4
3/07
/200
4
3/08
/200
4
3/09
/200
4
3/10
/200
4
3/11
/200
4
3/11
/200
4
3/12
/200
4
14/0
3/04
Date
Floo
d de
pth
(m)
ii) resultant soil moisture profile
0
10
20
30
40
50
60
70
80
90
100
0 5 10 15 20 25 30 35 40 45 50
Soil moisture (%)
Soil
dept
h (c
m)
6-Dec-0331-Mar-0430-Jul-0410-Jun-99
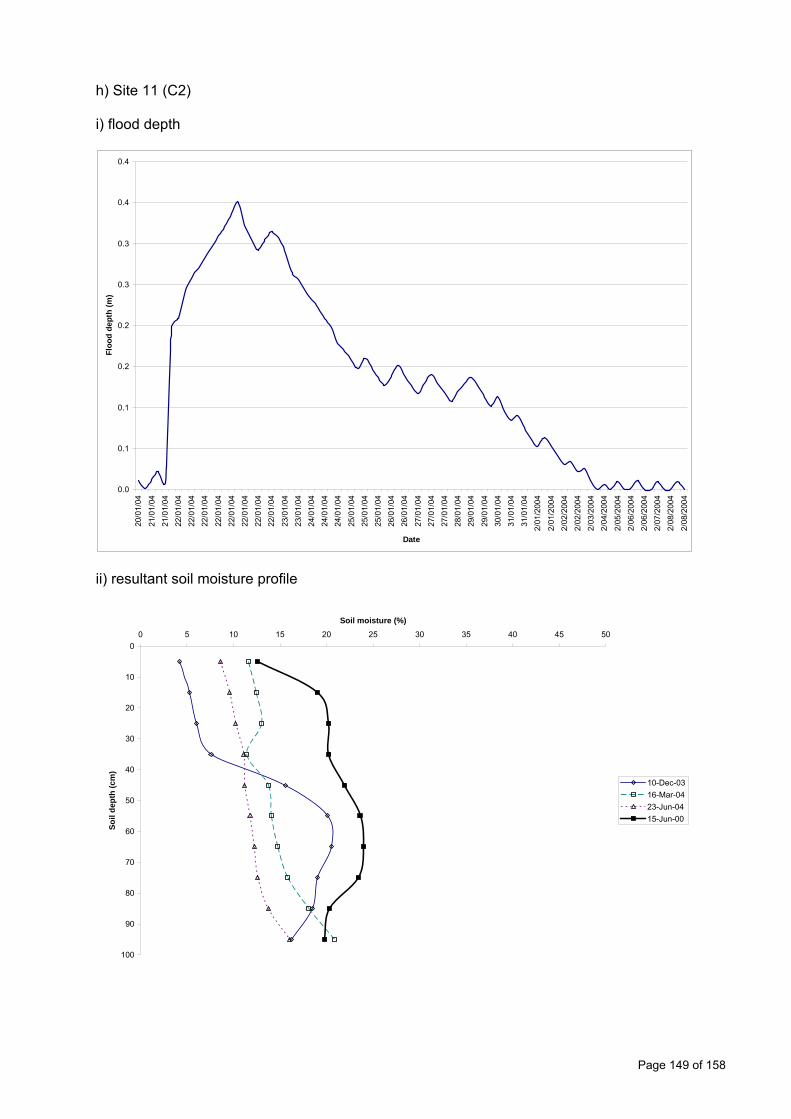
Page 149 of 158
h) Site 11 (C2) i) flood depth
0.0
0.1
0.1
0.2
0.2
0.3
0.3
0.4
0.4
20/0
1/04
21/0
1/04
21/0
1/04
22/0
1/04
22/0
1/04
22/0
1/04
22/0
1/04
22/0
1/04
22/0
1/04
22/0
1/04
22/0
1/04
23/0
1/04
23/0
1/04
24/0
1/04
24/0
1/04
24/0
1/04
25/0
1/04
25/0
1/04
25/0
1/04
26/0
1/04
26/0
1/04
27/0
1/04
27/0
1/04
27/0
1/04
28/0
1/04
29/0
1/04
29/0
1/04
30/0
1/04
31/0
1/04
31/0
1/04
2/01
/200
4
2/01
/200
42/
02/2
004
2/02
/200
42/
03/2
004
2/04
/200
4
2/05
/200
42/
06/2
004
2/06
/200
42/
07/2
004
2/08
/200
4
2/08
/200
4
Date
Floo
d de
pth
(m)
ii) resultant soil moisture profile
0
10
20
30
40
50
60
70
80
90
100
0 5 10 15 20 25 30 35 40 45 50
Soil moisture (%)
Soil
dept
h (c
m)
10-Dec-0316-Mar-0423-Jun-0415-Jun-00
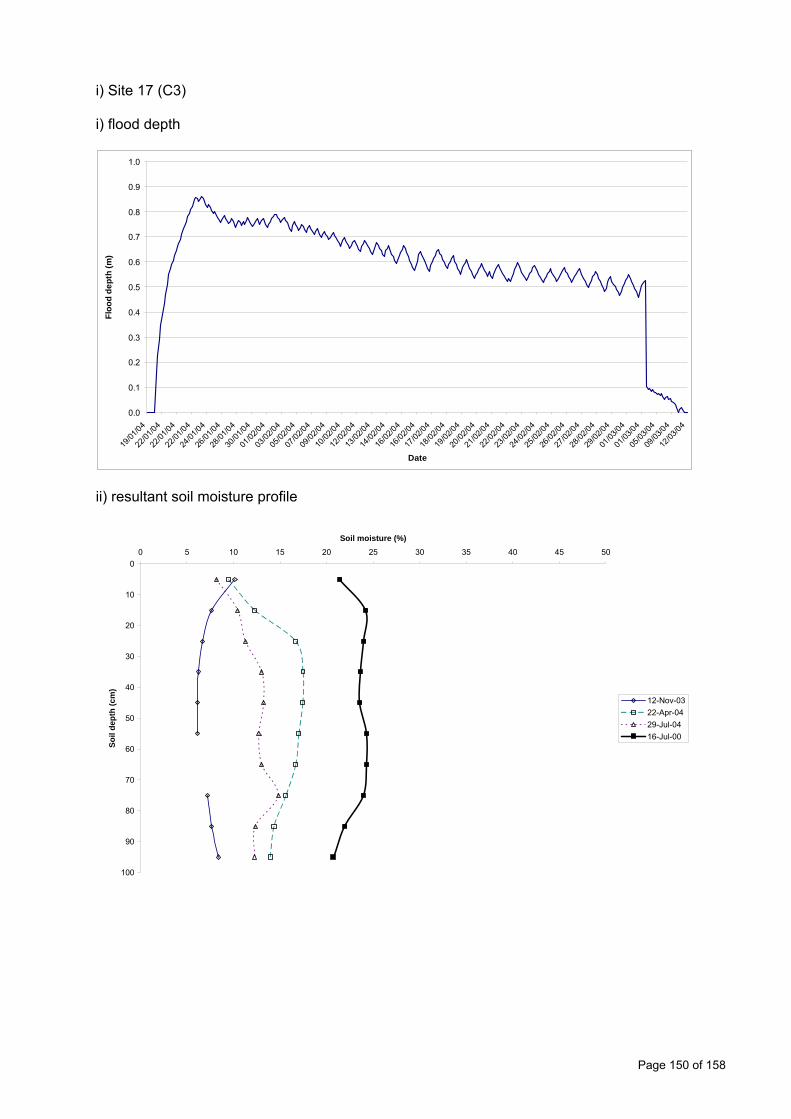
Page 150 of 158
i) Site 17 (C3) i) flood depth
0.0
0.1
0.2
0.3
0.4
0.5
0.6
0.7
0.8
0.9
1.0
19/01
/04
22/01
/04
22/01
/04
22/01
/04
24/01
/04
26/01
/04
28/01
/04
30/01
/04
01/02
/04
03/02
/04
05/02
/04
07/02
/04
09/02
/04
10/02
/04
12/02
/04
13/02
/04
14/02
/04
16/02
/04
16/02
/04
17/02
/04
18/02
/04
19/02
/04
20/02
/04
21/02
/04
22/02
/04
23/02
/04
24/02
/04
25/02
/04
26/02
/04
27/02
/04
28/02
/04
29/02
/04
01/03
/04
01/03
/04
05/03
/04
09/03
/04
12/03
/04
Date
Floo
d de
pth
(m)
ii) resultant soil moisture profile
0
10
20
30
40
50
60
70
80
90
100
0 5 10 15 20 25 30 35 40 45 50
Soil moisture (%)
Soil
dept
h (c
m)
12-Nov-0322-Apr-0429-Jul-0416-Jul-00

Page 151 of 158
13.5 Site Overview–Aerial Photographs from the 2004 Flood Pulse. Table A–3. Aerial photograph series of all 17 SGCCF sites, taken over the 20th –21st February 2004 during a handy to Good Flood
Site 1: a C1 bluebush site (Georgina River), demonstrating Hortonian overland flow within the active channel zone.
Site 2: a C3 bluebush site within Goyder’s Lagoon (Diamantina River), demonstrating floodwaters being spread by swamp gutters.
Site 3: a C1 bluebush site (Diamantina River), demonstrating floodwaters being spread out by braid gutters within the active channel zone.
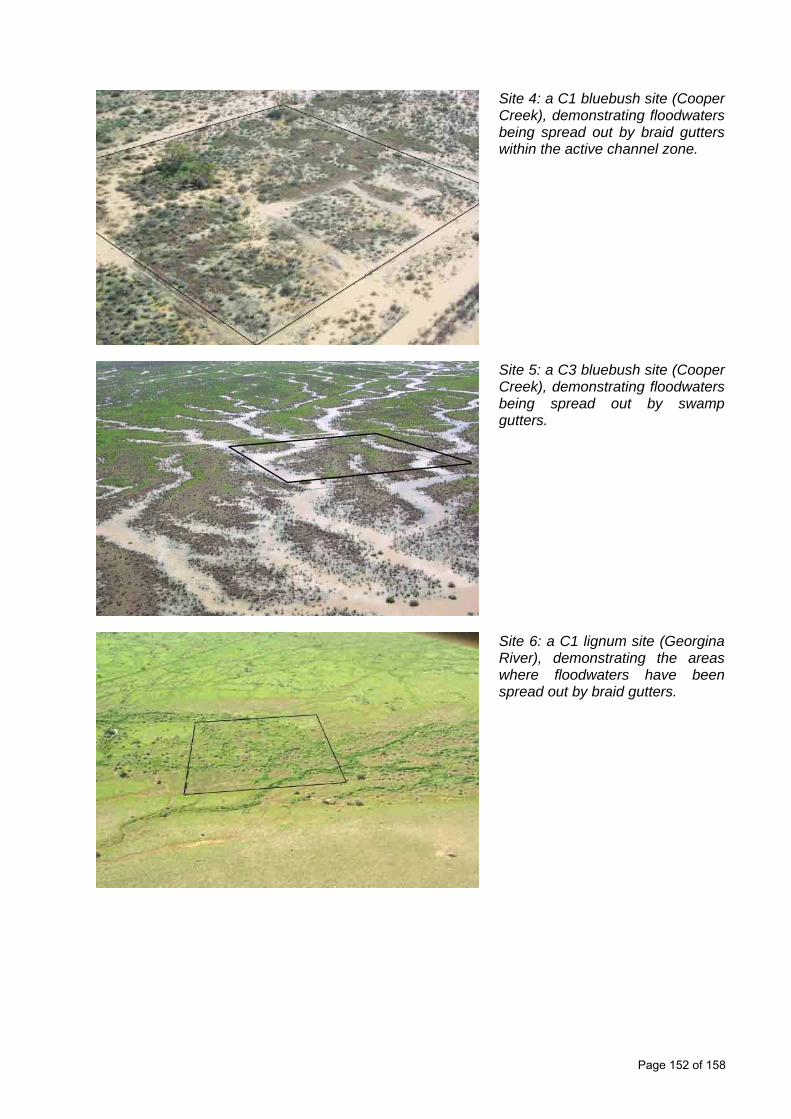
Page 152 of 158
Site 4: a C1 bluebush site (Cooper Creek), demonstrating floodwaters being spread out by braid gutters within the active channel zone.
Site 5: a C3 bluebush site (Cooper Creek), demonstrating floodwaters being spread out by swamp gutters.
Site 6: a C1 lignum site (Georgina River), demonstrating the areas where floodwaters have been spread out by braid gutters.

Page 153 of 158
Site 7 a C1 lignum site (Georgina River), demonstrating floodwaters being spread out by braid gutters and Hortonian overland flow within the active channel zone.
Site 8: a C1 lignum site (Diamantina River), demonstrating floodwaters being spread out by braid gutters within the active channel zone.
Site 9. a C1 lignum site (Diamantina River), with rising floodwaters about to be spread out by braid gutters within the active channel zone.

Page 154 of 158
Site 10: a C3 lignum site (Cooper Creek), demonstrating floodwaters being spread out by braid gutters.
Site 11: a C2 (Open Plains) site (Diamantina River), showing where floodwaters had been transported as Hortonian overland flow between swamp gutters.
Site 12: a C2 (Open Plains) site (Diamantina River), showing where floodwaters had been transported as Hortonian overland flow between swamp gutters.
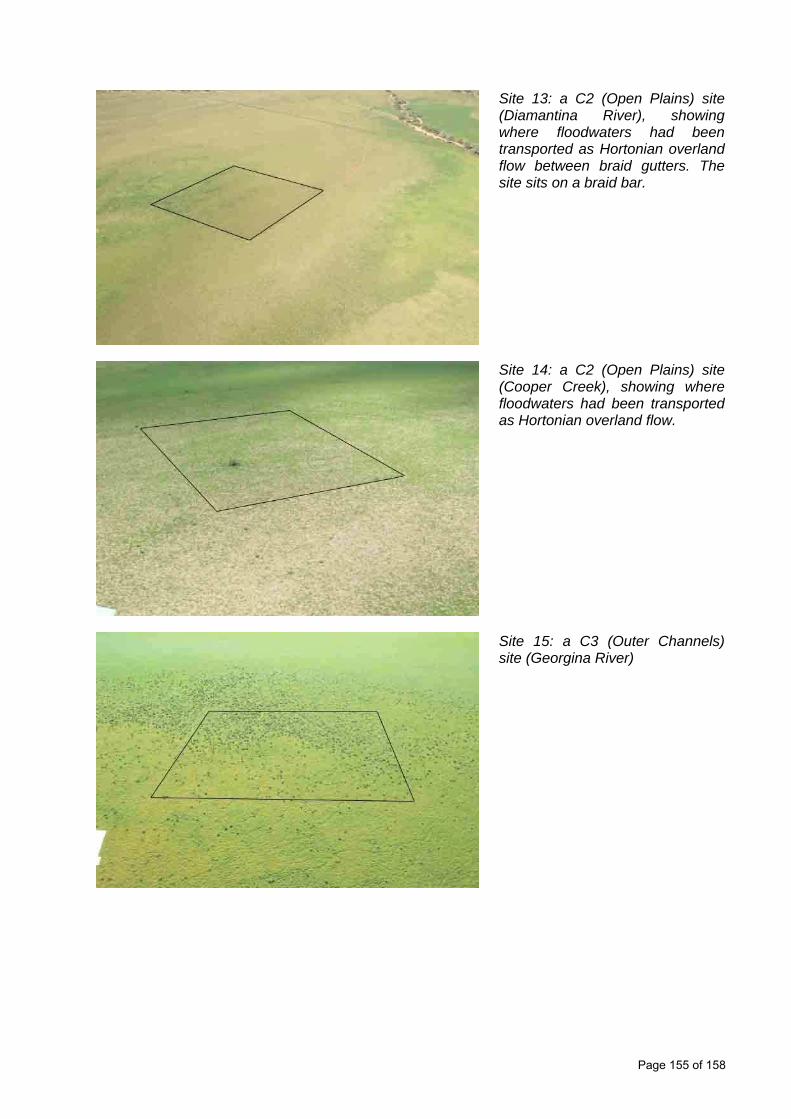
Page 155 of 158
Site 13: a C2 (Open Plains) site (Diamantina River), showing where floodwaters had been transported as Hortonian overland flow between braid gutters. The site sits on a braid bar.
Site 14: a C2 (Open Plains) site (Cooper Creek), showing where floodwaters had been transported as Hortonian overland flow.
Site 15: a C3 (Outer Channels) site (Georgina River)

Page 156 of 158
Site 16: a C3 (Outer Channels) site (Diamantina River)
Site 17: a C3 (Outer Channels) site (Cooper Creek)
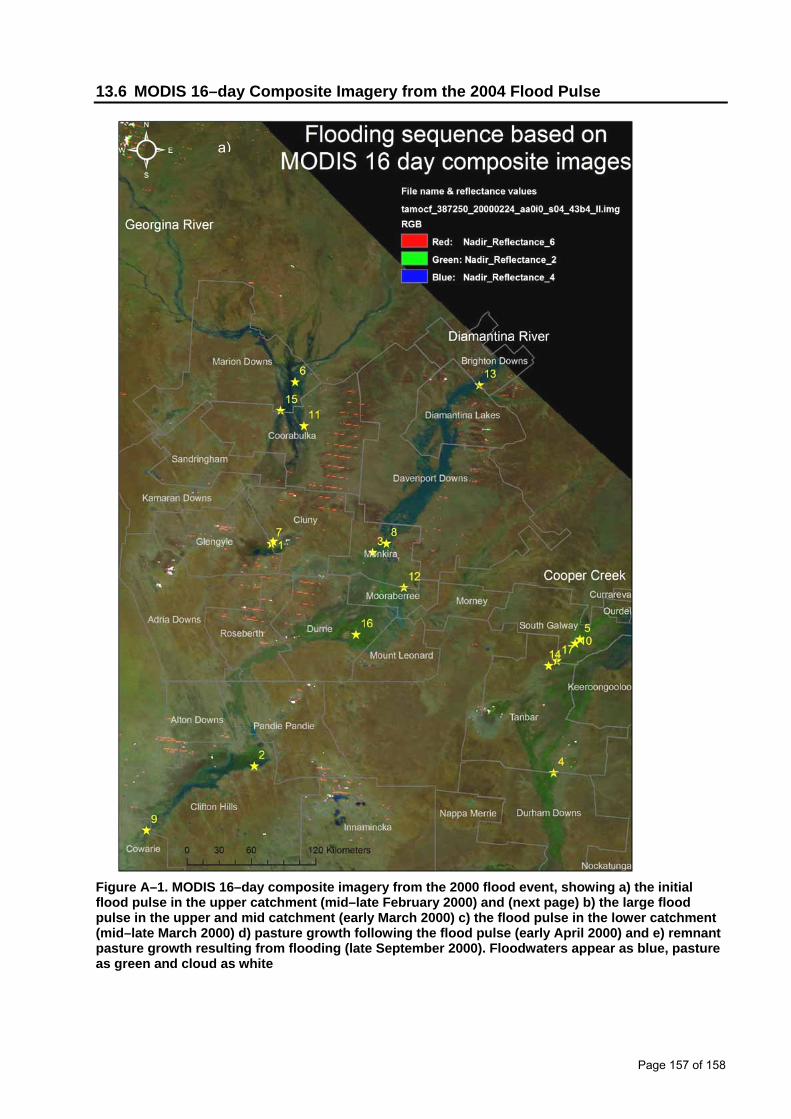
Page 157 of 158
13.6 MODIS 16–day Composite Imagery from the 2004 Flood Pulse
Figure A–1. MODIS 16–day composite imagery from the 2000 flood event, showing a) the initial flood pulse in the upper catchment (mid–late February 2000) and (next page) b) the large flood pulse in the upper and mid catchment (early March 2000) c) the flood pulse in the lower catchment (mid–late March 2000) d) pasture growth following the flood pulse (early April 2000) and e) remnant pasture growth resulting from flooding (late September 2000). Floodwaters appear as blue, pasture as green and cloud as white
a)
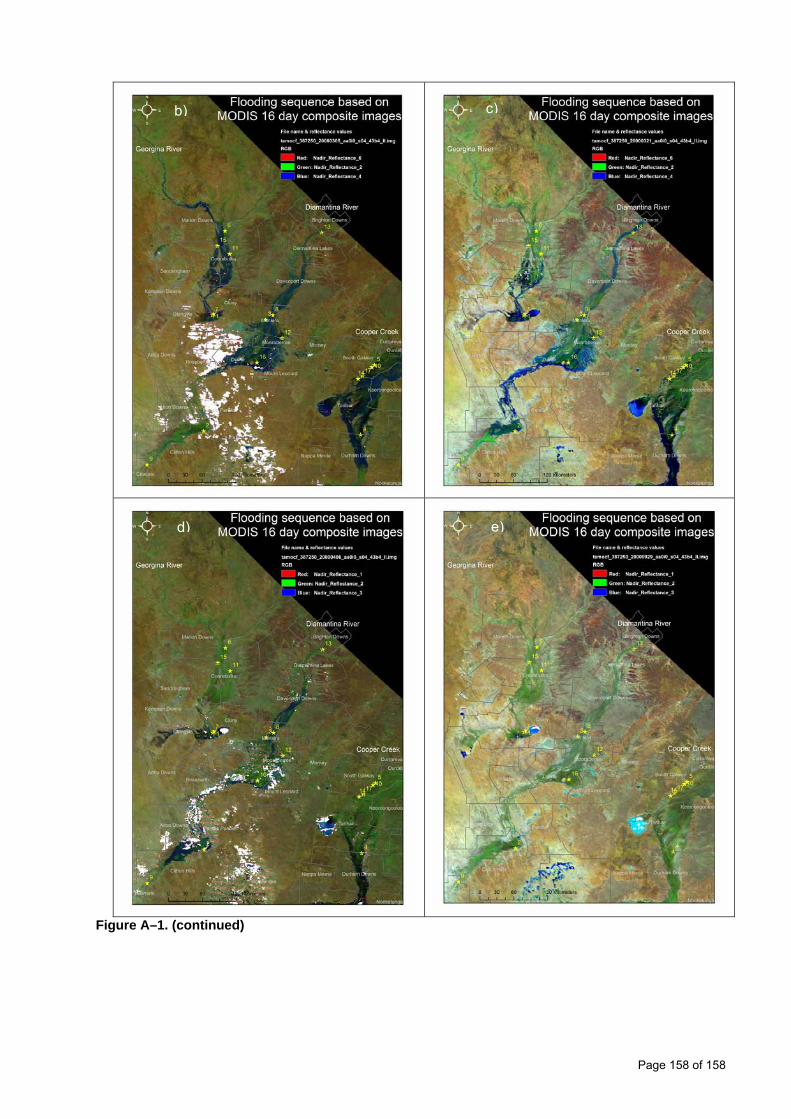
Page 158 of 158
Figure A–1. (continued)
b)
e)d)
c)