nchrp 3-65: applying roundabouts in the united states · nchrp 3-65: applying roundabouts in the...
TRANSCRIPT

NCHRP 3-65: Applying Roundabouts in the United States
Status Report to the Committee on Highway Capacity and Quality of Service
Prepared by Lee Rodegerdts
July 2004
NOTE: The material in this information packet for the Highway Capacity and Quality of Service Committee is based on materials reviewed by our project panel through March 2004, including the Interim Report of November 2002 and various Quarterly Progress Reports. The information here is for Committee information only and is subject to change pending further panel review and publication as a final report in June 2005.

Information for the Highway Capacity and Quality of Service Committee NCHRP 3-65 July 2004
1.0 INTRODUCTION
This section provides the research problem statement for this project, the research objectives, and the project team/panel organization.
1.1 RESEARCH PROBLEM STATEMENT
Although traffic circles have been used in the United States since 1905, their use has been limited since the 1950s because they were found to work neither efficiently or safely. The modern roundabout was developed in the United Kingdom in the 1960s to address these problems. Two key characteristics of the modern roundabout are (1) entering traffic that yields to circulating traffic and (2) geometric constraints that slow entering vehicles. Many studies have shown that modern roundabouts (hereafter referred to as roundabouts) can be safe and effective, and they are now widely used internationally.
Because modern roundabout design is relatively new to the United States, there has been some reluctance to apply it. Perceived differences in driver behavior raise questions about how appropriate some international research and practices are for the United States. Therefore, additional information on the safety and operation of roundabouts in the United States will be very helpful to planners and designers in determining where roundabouts would reduce intersection crashes and congestion and in refining the design criteria currently being used.
Although available information suggests that roundabouts are relatively safe, there is concern about the effects of different design configurations on the safety of bicycles and pedestrians, particularly pedestrians with disabilities. For example, pedestrians with blindness and low vision use cues from traffic sounds to determine when to cross the roadway. The free-flowing traffic at a roundabout can sometimes make this task extremely difficult.
1.2 RESEARCH OBJECTIVES
NCHRP and FHWA have identified the need to develop tools based on actual U.S. roundabout performance, rather than using foreign procedures as surrogates. New issues have also been raised that require further research, such as the navigability of roundabouts by visually impaired pedestrians. Hence, the primary objective of this research is to produce a set of operational, safety and design tools, calibrated to U.S. roundabout field data. These tools will enable a person who is already competent in analysis or geometric design of typical at-grade intersections to be able to specify a roundabout that is safe, performs well, and conforms to applicable or refined U.S. engineering codes.
Stated succinctly, the objectives of this project are to (1) develop methods of estimating the safety and operational impacts of U.S. roundabouts and (2) refine the design criteria used for them.
The original scope comprised ten distinct tasks to achieve the project objectives. In March 2004, the AASHTO Standing Committee on Research approved additional funding to cover increased data collection costs and a new task to develop marketing materials for roundabouts. The overall list of tasks is as follows:
2

Information for the Highway Capacity and Quality of Service Committee NCHRP 3-65 July 2004
• Task 1: Summarize existing relationships
• Task 2: Model formulation
• Task 3: Data collection plan
• Task 4: Interim Report and Panel meeting
• Task 5: Execute approved data collection plan
• Task 6: Inventory U.S. roundabout sites
• Task 7: Operational performance methods
• Task 8: Safety performance methods
• Task 9: Design criteria
• Task 10: Final Report
• Task 11: Marketing materials
1.3 Project Team and Panel Organization
Exhibit 1 presents the project team and project panel membership for this project.
3

Information for the Highway Capacity and Quality of Service Committee NCHRP 3-65 July 2004
Exhibit 1: Project Team and Panel Membership Role Member
Principal Investigator: Lee Rodegerdts, Kittelson & Associates, Inc. (KAI) (Bruce Robinson, co-Principal Investigator Emeritus)
Principal Team Members:
Aimee Flannery, George Mason University John Mason, Pennsylvania State University Rod Troutbeck, Queensland University of Technology, Australia George List, Rensellaer Polytechnic Institute Werner Brilon and Ning Wu, Ruhr-University Bochum, Germany Bhagwant Persaud, Ryerson University, Canada David Harkey, University of North Carolina Highway Safety Research Center Mike Kyte, Mike Dixon, University of Idaho Richard Hall, University of Southampton, UK
Panel Members: Beatriz Caicedo-Maddison, Florida DOT (chair) Maria Burke, Texas DOT Jerry Champa, California DOT Leonard Evans, Science Serving Society Steve King, Kansas DOT Robert Limoges, New York State DOT Richard Long, Western Michigan University Ron Pfefer, HSM liaison Brian Walsh, Washington State DOT Mohsin Zaidi, City of Kansas City, MO Joe Bared, FHWA Hari Kalla, FHWA Rich Cunard, TRB
NCHRP coordinator: Ray Derr, NCHRP
4

Information for the Highway Capacity and Quality of Service Committee NCHRP 3-65 July 2004
2.0 BACKGROUND
This section provides general background information on roundabouts. Roundabouts represent a unique blending of operations, safety, and design, where changes to one element appear to have a significant effect on the others. While the following materials focus on the operational characteristics of roundabouts, safety is an equally important element that is being addressed in parallel within NCHRP 3-65. The following sections present the general characteristics of roundabouts, followed by an introduction to the key operational models currently being used around the world to analyze their performance.
2.1 General Characteristics
A roundabout intersection brings together conflicting traffic streams, allows the streams to safely merge and transverse the roundabout, and exit to their desired direction. Drivers approaching a roundabout must slow to a speed that will allow them to safely interact with other users, and to negotiate the roundabout. As drivers approach the yield line, they must check for conflicting vehicles already on the circulating roadway, and determine when it is safe to enter the one-way circulating stream.
The capacity of each entry to a roundabout is the maximum rate at which vehicles can reasonably be expected to enter the roundabout from an approach during a given time period under prevailing traffic and roadway (geometric conditions). Typically the capacity is calculated as a function of traffic on the other (conflicting) approaches, the interaction of these traffic streams and the intersection geometry. A number of typical relationships can be drawn:
• Circulating flow: When the circulating flow is low, drivers at the entry are able to enter the roundabout without significant delays. The larger gaps in the circulating flow are more useful to the entering drivers and more than one vehicle may enter each gap. As the circulating flow increases, the size of the gaps in the circulating flow decreases, and the rate at which vehicles can enter also decreases.
• Geometric factors: Various geometric factors may affect the capacity such as the width of the entry and circulating roadway, number of lanes, entry radius and the inscribed circle diameter. Under low circulatory flow conditions, two entry lanes permit nearly twice the rate of entry flow, as does one lane. Wider circulatory roadways allow vehicles to travel alongside, or follow each other in a tighter bunch and so provide longer gaps between bunches of vehicles. Geometric dimensions are illustrated in Exhibit 2.
• Speed: The faster the circulating traffic, the larger the gaps that entering traffic will comfortably accept. This translates to fewer acceptable gaps and therefore more instances of entering vehicles stopping at the yield line. Furthermore, entering traffic, which is first stopped at the yield line, requires even larger gaps in the circulating traffic in order to accelerate and merge with the circulating traffic. The faster the circulating traffic, the larger this gap must be. This again translates into fewer acceptable gaps and therefore longer delays. The speeds at a roundabout are a function of the geometric conditions. To determine the speeds at a roundabout, the fastest path allowed by the geometry is drawn. This is
5

Information for the Highway Capacity and Quality of Service Committee NCHRP 3-65 July 2004
usually the through movement and will be dependent on such factors as the diameter, and entry and exit radius.
Three performance measures are typically used to estimate the operational performance of a roundabout: degree of saturation, delay and queue length. Each measure provides a unique perspective on the quality of service at which a roundabout will perform under a given set of traffic and geometric conditions. When roundabouts operate at their capacity, there are typically lower vehicle delays than at other intersection forms and control types. With a roundabout, it is unnecessary for traffic to come to a complete stop when no conflicts are present. Unlike signal or stop controls, queues that do form will continue to move, which is more tolerable to drivers.
6

Information for the Highway Capacity and Quality of Service Committee NCHRP 3-65 July 2004
Exhibit 2: Geometric Dimensions
Dimension Description
Inscribed circle diameter
The inscribed circle diameter is the basic parameter used to define the size of a roundabout. It is measured between the outer edges of the circulatory roadway.
Circulatory roadway width
The circulatory roadway width defines the roadway width for vehicle circulation around the central island. It is measured as the width between the outer edge of this roadway and the central island. It does not include the width of any mountable apron, which is defined to be part of the central island.
Approach width The approach width is the width of the roadway used by approaching traffic upstream of any changes in width associated with the roundabout. The approach width is typically no more than half of the total width of the roadway.
Departure width
The departure width is the width of the roadway used by departing traffic downstream of any changes in width associated with the roundabout. The departure width is typically less than or equal to half of the total width of the roadway.
Entry width The entry width defines the width of the entry where it meets the inscribed circle. It is measured perpendicularly from the right edge of the entry to the intersection point of the left edge line and the inscribed circle.
Exit width The exit width defines the width of the exit where it meets the inscribed circle. It is measured perpendicularly from the right edge of the exit to the intersection point of the left edge line and the inscribed circle.
Entry radius The entry radius is the minimum radius of curvature of the outside curb at the entry.
Exit radius The exit radius is the minimum radius of curvature of the outside curb at the exit.
7

Information for the Highway Capacity and Quality of Service Committee NCHRP 3-65 July 2004
2.2 Fundamental Capacity Methods
A number of fundamental methods applicable to two-way stop-controlled and two-way yield controlled intersection capacity analysis serve as a foundation for roundabout operational performance. There are currently two methods that have been used to develop such models:
• Gap Acceptance
• Linear or Exponential Empirical Regression
In a gap acceptance model, the driver on the minor (entering) stream is required to select an acceptable gap on the major (circulating) stream, to perform the desired maneuver. The “gap” is defined as the headway maintained between two consecutive vehicles in the conflicting stream. The minimum gap that is acceptable to the minor stream driver is their critical gap, tc. The critical gap is not a constant and is typically represented by a distribution of values based on the variation of driver behavior. Estimation procedures exist for critical gap that do not require sties with oversaturated conditions. The follow-on time, tf, is defined as the time headway between two consecutively entering vehicles, utilizing the same gap in the circulating stream. The follow-on time can be directly measured in the field without utilizing complicated mathematical equations.
According to Tanner (1962), from the point of view of the traffic on the minor road, the traffic on the major road forms alternate “blocks” and “gaps.” Bunched vehicles, each of which is separated by a minimum gap tm, form a block. During such a block no vehicles can enter the major stream flow. When the gap after the last vehicle in the block is equal to or greater than the critical gap, vehicles are able to enter the major stream flow. Vehicles can enter the larger gaps with a follow-on time of tf. Exhibit 3 illustrates the formation of blocks and gaps in the major-road traffic.
Exhibit 3: Formation of blocks and gaps in the major-road traffic.
1 2 3 4 5 6Block Ae
Distanctf1 4 532
Time
tc
6
Based on the gap acceptance model, the capacity of the simple 2-stream situation can be evaluated by elementary probability theory for the assumptions:
• constant tc and tf values
• exponential distribution for priority stream gaps
• constant traffic volumes for each traffic stream
8

Information for the Highway Capacity and Quality of Service Committee NCHRP 3-65 July 2004
Harders (1968) developed one of the first models; this is used in the current Highway Capacity Manual (HCM). These idealized assumptions are considered somewhat unrealistic; however, various evaluations have suggested that it is not significantly more accurate to use more realistic headway distributions. Furthermore, the resulting generalized solutions are not easy to apply in practice.
In addition to the concern related to realistic distributions of headways and other gap acceptance parameters, there are a number of other theoretical limitations. These are described below:
• Inconsistent gap acceptance occurs in practice but has not been accounted for in theory. These include (a) rejecting a large gap before accepting a smaller gap, (b) driver on the roundabout giving up the right of way, (c) forced right of way when the traffic is congested, and (d) different vehicle types accepting different gaps.
• Estimation of the critical gap is difficult. Maximum likelihood was found to be one of the most consistent methods (Kyte et.al (1996) and Brilon, Troutbeck and Koenig (1997)); however, the evaluation is quite complicated.
• Geometric factors are not directly taken into account.
Linear or exponential empirical regression models are based on traffic volumes at one-minute intervals observed during periods of oversaturation. A linear or exponential regression equation is then fitted to the data, as shown in Exhibit 4. Variation in the data is often created by driver behavior or geometric design. A multivariate regression equation could also be developed to include the influence of geometric design.
Exhibit 4: General outline for the use of linear regression theory. The figure shows a comparison of a linear regression with an exponential
regression curve.
0 200 400 600 800
1000 1200 1400
0 200 400 600 800 1000 1200 1400
Ent
ry C
apac
ity, (
veh/
hr)
Conflicting Traffic (veh/hr) Compared to gap acceptance, empirical regression models take into account the influence of geometric design and priority automatically, provided that these effects have been observed in the
9

Information for the Highway Capacity and Quality of Service Committee NCHRP 3-65 July 2004
subject data. Furthermore, there is no need for a detailed description of driver merging behavior. Limitations of this technique include the following:
• Empirical regression models may have poor transferability to other countries or at other times (e.g. new USA drivers versus experienced UK drivers).
• Regression models provide no real understanding of the underlying traffic flow theory of determining and accepting gaps upon entering the intersection.
• The models are typically based on driver behavior in oversaturated conditions, thus requiring sites with continuous queuing.
• Each situation (traffic volume pattern and/or geometric conditions) must be observed in order to develop an appropriate model. This requires a large data collection effort.
A review prepared by Troutbeck as a part of this project argues that there are no strong reasons for adopting either the linear model or the gap acceptance approach over the other. In response to concerns related to gap acceptance, Troutbeck and Kako have developed a theory for incorporating a “limited priority” process, in which the major stream vehicle slows down to allow the minor street vehicle to enter the circulating stream. Therefore, both types of models are being considered with this project.
2.3 Performance Measures
In general, the performance of traffic operations at an intersection can be represented by the following measures of effectiveness:
• Degree of saturation (volume/capacity)
• Average delay
• Average queue length
• Distribution of delays
• Distribution of queue lengths (i.e. number of vehicles queuing on the minor road)
• Number of stopped vehicles
• Acceleration or deceleration between stop and normal velocity
2.3.1 Delay
Authors such as Kremser (1664), Brilon (1988) and Yeo (1962) have developed average delay equations based on queuing theory. These models are only applicable to undersaturated conditions where the traffic is considered constant over time.
10

Information for the Highway Capacity and Quality of Service Committee NCHRP 3-65 July 2004
Kimber and Hollis (1979) developed time-dependent delay solutions that consider oversaturated conditions. These were later simplified by Akçelik and Troutbeck (1991) and are presented in the HCM. The simplified equations do not take into account time dependency or initial queues. The Kimber and Hollis method is preferred, though more complicated.
2.3.2 Queue Length
The average traffic queue length, while readily observed, is of limited practical value, whereas maximum queue length can be useful for design purposes. Maximum queue length/95th percentile queue relationships have been developed by Wu (1994) in the form of graphs, and are presented in the 2000 HCM. These are illustrated in Exhibit 5. The graph is only valid where the volume-to-capacity ratio immediately before and after the study period is no greater than 0.85, such that the queue length is negligible.
Exhibit 5: 95th Percentile Queue Length
0 0.2 0.4 0.6 0.8 1.0 1.2 1.41
2
3
4
5678910
20
30
40
5060708090100
∞
Exp
ecte
d M
axim
um N
umbe
r of V
ehic
les
in Q
ueue
, Q95
[veh
]
v/c Ratio [-]
11

Information for the Highway Capacity and Quality of Service Committee NCHRP 3-65 July 2004
2.3.3 Capacity
Capacity is a required input to delay and queuing models. In terms of existing US capacity methodologies, the HCM includes a gap acceptance model limited to single-lane roundabouts, and does not provide any guidance on delay, queues, or level of service. The methods in FHWA’s Roundabouts: An Informational Guide for single- and double-lane roundabout capacities were derived using the UK empirical model with assumed values for the six geometric input parameters. The German empirical capacity relationship is recommended for the operational analysis of an urban compact roundabout. These models were intended to be a reasonable design tool until further research could be performed on U.S. roundabouts.
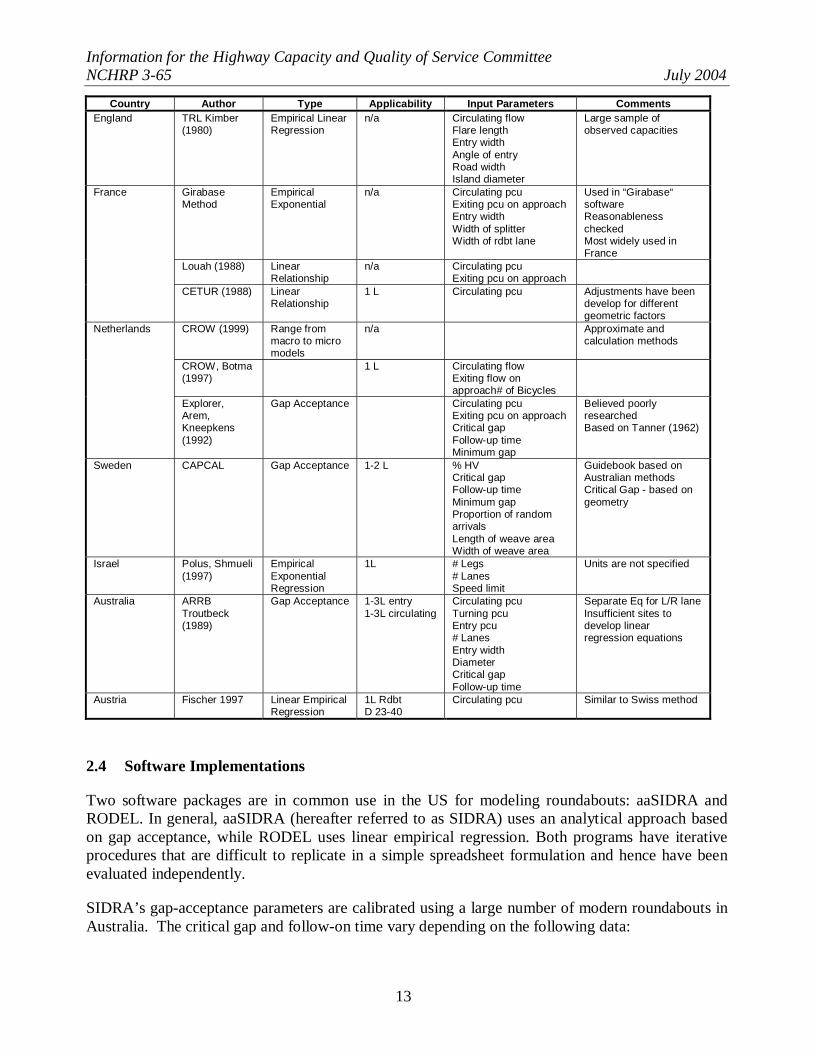
A summary of the international capacity models is shown in Exhibit 6. The capacity is based on either gap acceptance or linear/exponential empirical relationships. Except for the British model, there are limited significant geometric parameters. In several cases, the models and methods of other counties have been used to develop capacity equations.
Consideration of the effect of pedestrian modes on entry capacity has been of limited concern in previous research efforts. Stuwe (1992) observed three roundabouts with heavy pedestrian flow and developed an empirical entry capacity equation for single- and double-lane roundabouts. The method is included in the FHWA Guidelines. Marlow and Maycock (1982) also developed entry capacity models with pedestrian considerations, based on queuing theory. The capacity of roundabout exits with significant pedestrian flows has not been investigated to date.
Exhibit 6: Summary of Operational Models Country Author Type Applicability Input Parameters Comments
Wu (1996) Gap Acceptance Multiple Lanes Circulating pcu # Lanes Critical gap Follow-up time Minimum gap
Represents observed capacity well. Recommended model in Germany Based on Tanner (1962
Brilon, Bondzio (1996)
Empirical Linear Regression
1-3 L Circulating pcu Refined for 1L Rdbts
Brilon, Stuwe, Drews (1993)
Empirical Linear Regression
1-3 L Circulating pcu No longer applicable for 1L Rdbts
Germany
Stuwe (1992) Exponential regression
1-3 L Circulating pcu # Lanes # of Approaches Diameter Travel distance
Limited geometric range applicable
Simon (1991) Empirical Linear Regression
1 L Bus-Lane
Circulating pcu Not applicable to 2+L Rdts
Switzerland
Lausanne (1991)
Empirical Linear Regression
1 L – 3 L Circulating pcu Entering pcu Conflict length
Three unique formulae1L limited D=22-32m
HCM (2000) Gap Acceptance 1L Circulating flow Critical gap Follow-up time
Provisional method because of limited data Based on Harders Eq
Empirical Linear Regression
Urban Compact 1L
Circulating pcu See Brilon & Bondzio (1996)
Empirical Linear Regression
1 L D=30-40m Circulating pcu See English TRRL
USA
FHWA Roundabout Guide
Empirical Linear Regression
2L D=55-60 Circulating pcu See English TRRL
12
Information for the Highway Capacity and Quality of Service Committee NCHRP 3-65 July 2004
Country Author Type Applicability Input Parameters Comments England TRL Kimber
(1980) Empirical Linear Regression
n/a Circulating flow Flare length Entry width Angle of entry Road width Island diameter
Large sample of observed capacities
Girabase Method
Empirical Exponential
n/a Circulating pcu Exiting pcu on approach Entry width Width of splitter Width of rdbt lane
Used in “Girabase“ software Reasonableness checked Most widely used in France
Louah (1988) Linear Relationship
n/a Circulating pcu Exiting pcu on approach
France
CETUR (1988) Linear Relationship
1 L Circulating pcu Adjustments have been develop for different geometric factors
CROW (1999) Range from macro to micro models
n/a Approximate and calculation methods
CROW, Botma (1997)
1 L Circulating flow Exiting flow on approach# of Bicycles
Netherlands
Explorer, Arem, Kneepkens (1992)
Gap Acceptance Circulating pcu Exiting pcu on approach Critical gap Follow-up time Minimum gap
Believed poorly researched Based on Tanner (1962)
Sweden CAPCAL Gap Acceptance 1-2 L % HV Critical gap Follow-up time Minimum gap Proportion of random arrivals Length of weave area Width of weave area
Guidebook based on Australian methods Critical Gap - based on geometry
Israel Polus, Shmueli (1997)
Empirical Exponential Regression
1L # Legs # Lanes Speed limit
Units are not specified
Australia ARRB Troutbeck (1989)
Gap Acceptance 1-3L entry 1-3L circulating
Circulating pcu Turning pcu Entry pcu # Lanes Entry width Diameter Critical gap Follow-up time
Separate Eq for L/R lane Insufficient sites to develop linear regression equations
Austria Fischer 1997 Linear Empirical Regression
1L Rdbt D 23-40
Circulating pcu Similar to Swiss method
2.4 Software Implementations
Two software packages are in common use in the US for modeling roundabouts: aaSIDRA and RODEL. In general, aaSIDRA (hereafter referred to as SIDRA) uses an analytical approach based on gap acceptance, while RODEL uses linear empirical regression. Both programs have iterative procedures that are difficult to replicate in a simple spreadsheet formulation and hence have been evaluated independently.
SIDRA’s gap-acceptance parameters are calibrated using a large number of modern roundabouts in Australia. The critical gap and follow-on time vary depending on the following data:
13

Information for the Highway Capacity and Quality of Service Committee NCHRP 3-65 July 2004
o geometry o demand flow (approach and circulating) o approach and circulating lane utilization (lane sensitive), o origin and destination demand o queuing on roads before entering the circulating road o bunching in the circulating stream
RODEL was developed based on data from large and small roundabouts in the UK; it uses the empirical regression equations developed by Kimber as described previously. The intercept and slope of the linear model vary based on the geometry of the roundabout. The total circulating volumes is used to determine the entry capacity on an approach basis. In addition, the model is not sensitive directly to the number of lanes, but instead captures the effect of the number of lanes through the approach half-width and entry width.
14
Information for the Highway Capacity and Quality of Service Committee NCHRP 3-65 July 2004
3.0 DATA COLLECTION AND INVENTORY OF U.S. ROUNDABOUT SITES
The data collection effort and inventory of U.S. roundabout sites for this project has been led by the University of Idaho (UI), with Rensselaer Polytechnic Institute (RPI) and George Mason University (GMU) providing close support.
3.1 Site Inventory
The research team built upon inventory work conducted by team members for the New York State Department of Transportation in a separate research contract led by RPI, as well as a database that KAI has hosted since the development of FHWA’s Roundabouts: An Informational Guide. That project conducted an extensive survey of jurisdictions throughout the U.S. to obtain safety, operations, and geometric data.
One outcome of this effort was the realization that much of the information the team received voluntarily from others was incomplete or, at worst, inaccurate. Despite many months of surveys and follow-up phone calls, the team had solid information for only a fraction of the known sites, and we were uncertain whether some of the known sites are in fact true roundabouts. Therefore, the team undertook a scouting effort to (1) confirm that the site exhibits the characteristics of a roundabout, (2) has characteristics of interest to the team, and (3) is physically suitable for accommodating our field data collection equipment.
3.2 Data Collection Process
Data collection equipment: The team obtained video data for each site through the use of two different types of cameras. The first type is a standard digital camcorder, used to record the operations of a given approach. Depending on the design of the roundabout, this field of view captures the entire entry and exit area of a given roundabout approach and generally (but not always) captures the back of queue. The second type is an omni-directional camera, used to record the operation of the entire roundabout. This field of view was used primarily to determine turning movements and to assess the interaction between successive entries and exits. These cameras were supported on the University of Idaho’s camera masts (the same masts used for the NCHRP 3-46 project that led to the new TWSC and AWSC procedures in the HCM). All video has been recorded onto DVD to provide the best platform for archiving and future research efforts.
Pilot study: The research team completed a successful pilot study at two sites in Washington State: a four-leg, single-lane roundabout at 27th Avenue/Union Street/Union Loop Road in Kennewick, and a six-leg, double-lane roundabout at SR 16 NB Ramps/Borgen Blvd./Burnham Drive in Gig Harbor. This effort confirmed a number of key items:
• The camera setup selected for this project has proven to be suitable. The use of an omni-directional camera provides an excellent overview of the entire roundabout operation. The use of standard video cameras has proven useful in providing views of the operations on key approaches. In addition, the mast system used for NCHRP 3-46 has proven to be well suited for the data collection needs for NCHRP 3-65.
15

Information for the Highway Capacity and Quality of Service Committee NCHRP 3-65 July 2004
• The use of all-digital recording (DVDs) has proven to be excellent as the recording medium and should aid significantly during data reduction. The digital format will also be invaluable for creating the data library for use by researchers beyond this project.
• The amount of equipment and associated personnel needed to instrument a roundabout was more extensive than previously anticipated and more intensive than what was required for NCHRP 3-46. A minimum of three people on site is needed to set up and take down the equipment. When combined with other field data collection (speed measurements, safety data, and geometric data), a team of four persons is needed to adequately collect the data needed for the various aspects of Tasks 7, 8, and 9. This prompted the need for additional funding, which was approved by AASHTO Standing Committee on Research in March 2004.
Data collection: Graduate and undergraduate students from the University of Idaho, Rensellaer Polytechnic Institute, and George Mason University conducted a ten-week tour across the United States, braving everything from torrid heat in Las Vegas to tornado-like winds in Colorado (which damaged one mast and destroyed two cameras) to afternoon thunderstorms just about everywhere that limited p.m. peak hour data collection. As a result, the original ambitious data collection plan was necessarily scaled back a bit.
Exhibit 7 summarizes the key elements of the data collection and extraction process through March 2004 for all aspects of the project: operations, safety, geometric, and bicycles and pedestrians. As can be seen, the exhibit includes an assessment of the number of sites for each type of data, as well as an assessment of the number of sites available for each analysis effort for which a certain combination of data is required (e.g., operational data AND geometric data for the same site). This assessment is admittedly simplified, as a more detailed review of the quality of data for each site is necessary to assess the degree of its usefulness in the modeling or assessment exercise. The summary, however, is still a useful indicator of the relative feasibility of each effort. Exhibit 8 lists the specific sites for which usable operational data has been or is being extracted.
16

Information for the Highway Capacity and Quality of Service Committee NCHRP 3-65 July 2004
Exhibit 7: Summary of Field Data Collection/Extraction Status (through March 17, 2004)
Characteristic Number of sites Total documented sites in database 308 Total number of sites with at least one piece of data identified below 151 Total sites by type of data ADT Volumes Crash Data Collected Before Period After Period Geometric Data Collected (plans, sketches, etc.) Extracted (plans only) Video Data Collected Operational Data Extracted (queues present) Speed Data Collected
94
82 108
129 83
34 15
26 Analysis efforts: Total sites with necessary combination of data (data types in parentheses) Operational model (extracted operational data, extracted geometric data) Before/after safety model (ADT, before crash, after crash) Crash prediction model (ADT, after crash, geometry) Predicted versus actual speeds (geometry, speed data) Bike/ped observations (video data)
14* 65 29* 23* 34*
*Effort is approach-based; therefore, there are expected to be a higher number of combinations of data for model assessment/development
Exhibit 8: Listing of Operational Data Sites Single-lane sites
(10 sites, 16 approaches) Multilane sites
(6 sites, 10 approaches) Lothian, MD MD06 - N MD06 - S Taneytown, MD MD07 - E Gorham, ME ME01 -E ME01 -S Bend, OR OR01 - S Bainbridge Isl., WA WA03 - E WA03 - S Gig Harbor, WA WA01- N WA01 - W Kennewick, WA WA08 - S Port Orchard, WA WA04 - E WA04 - N WA04 - S Sammamish, WA WA05 - W Lacey, WA WA07 – E
Clearwater, FL FL11 – E FL11 – NW Baltimore Co., MD MD04-E Towson, MD MD05-NW MD05-W Okemos, MI MI01-E Brattleboro, VT VT01-E VT01-S VT01-W Gig Harbor, WA WA09 - E
17

Information for the Highway Capacity and Quality of Service Committee NCHRP 3-65 July 2004
3.3 Operational Data
Appendix A (Working Paper 13) presents a summary of the operations data that have been extracted from the DVDs recorded during the Summer 2003 data collection tour along with some potential trends. As noted in Appendix A, the time segments with some degree of persistent queuing include nearly 16 hours of data at 15 unique approaches at nine single-lane sites and 18.5 hours of data at nine unique approaches at four double-lane sites. Exhibit 9, reproduced from Appendix B, includes some of the highlights of the data sets that were produced based on the 34 hours of traffic operations. (Note that operational data for the two sites used in the pilot study—a single-lane roundabout in Kennewick, WA, and a double-lane roundabout in Gig Harbor, WA—and data from the double-lane roundabout in Clearwater, FL, have since been added to the dataset. These are not documented in the working paper.)
After the production of the working paper in Appendix A, the operational data was further refined to exclude all partially queuing conditions for the capacity analysis. For the one-lane roundabouts, the examination of the full-minute queuing reduces the data sample from 884 one-minute time periods to the following:
• 282 time periods with visually-verified queues during the entire one minute period,
• 80 time periods with no queues during any part of the minute, and
• 486 time periods with periods of both queuing and no queuing.
The complete data set was also investigated for additional minute queuing periods. There are 172 time periods, totaling 7 hours and 31 minutes that have not been extracted. These time periods are generally isolated minutes.
In Appendix A, the proportion time queued was used to identify continuous minutes of queuing. A proportion time queued of 0.9 resulted in approximately 344 minutes of data (compared to the 282 minutes of data full minute queuing observed on the DVDs). These finding suggest that the proportion time queued parameter is a reasonable screening tool to identify periods of queuing. Further details are provided in Appendix A.
The identification of continuous queuing at the two-lane sites has not been completed at this time. Of the 923 minutes of data, and estimated 135 (left lane) and 218 (right lane) samples where the proportion time queued exceeded 0.9, it is anticipated that there will be fewer minutes of data with visually observed continuous queuing.
18

Information for the Highway Capacity and Quality of Service Committee NCHRP 3-65 July 2004
Exhibit 9: Operational Dataset Highlights Parameter One-lane sites Two-lane sites
Number of one-minute data points extracted • Number in which proportion time queued exceeded
0.90 • Visually verified queue during entire minute • No queues during any part of the minute • Time periods with both queuing and no queuing
884 344 282 80 486
923 135 (left lane) 218 (right lane) Not completed Not completed Not completed
Maximum one minute measurements • Entry flow, veh/min • Conflicting flow, veh/min • Mean delay, sec/veh
24 18 47.1
19 48 121.7
Mean proportion time queued 0.78 0.55 (left lane) 0.65 (right lane)
Gap sequences • Total • Number involving an accepted gap • Number involving a rejected lag followed by an
accepted gap • Number involving a rejected lag, followed by one or
more rejected gaps, followed by an accepted gap
10,785 8,282 1,318 1,151
13,530 5,295 1,067 7,168
Turning movement proportions, means for sites • Left turns • Through movements • Right turns
0.28 0.46 0.31
0.23 0.22 0.11
Travel time through roundabout (sec) • Left turns • Through movements • Right turns • U-turns
10.8 6.6 3.1 16.2
11.8 7.4 2.7 18.8
The data collected included flow rates, delays, turning movements, gaps, service times, travel times between each entry and exit point, and proportion of time that a queue existed on each approach. The queue data will be used to determine a maximum rate of flow or capacity flow. Appendix A details the data extracted, provides definitions of the characteristics, and presents preliminary trends seen in the data.
The data was kept in its raw data format with summary files produced for flow rate, delay, and other similar data for each roundabout approach. Finally, the data was reduced even further into one-minute summaries and assembled into a small number of spreadsheet files that will be processed by the modeling team.
19

Information for the Highway Capacity and Quality of Service Committee NCHRP 3-65 July 2004
3.4 Geometric Data
In addition to operational data, a variety of geometric data have been extracted from the plans. The geometric data are principally various distance measurements, radii, and angles that affect the way in which vehicles traverse the roundabout. Some of the data items can be read directly from the drawings, while others have to be derived from paths or trajectories that are traced through the roundabout based on the manner in which an experienced design engineer thinks the vehicles will travel from entry points to exit points.
Based on the operational and safety models developed to date, data for the roundabouts were extracted for three categories: entry and exit characteristics, circulating roadway characteristics, and trajectories of vehicle paths through the roundabout.
Exhibit 10: Geometric Parameters Entry and Exit Characteristics
Circulating Roadway Characteristics
Trajectory and Vehicle Path Radii
• Inscribed circle diameter • Entry width • Approach half width • Effective flare length • Entry radius • Entry angle • Exit width • Departure width • Exit radius • Angle to the next entry
leg • Type of pedestrian
crosswalk • Splitter island width • Splitter island length
• Circulating roadway width • Truck apron width • Central island diameter • Striping on the circulating
roadway • Lane configuration (lane 1,
lane 2, lane 3, bypass lane)
• Type of vertical geometry (entering, exiting, circulating)
• R0: Approach radius • R1: Entry through path
radius • R2: Circulating through
path radius • R3: Exit through path
radius • R4: Left-turn path radius • R5: Right-turn path radius
The available operation data were matched with the geometric data to ensure that a range of geometric conditions is available for study. Four parameters were examined (illustrated in Exhibit 11): entry width, diameter, entry angle, and effective flare length. From these graphs it can be seen that there are a number of gaps in the range of geometric data; however, considering the number of applicable sites, these are minimal. Note that the graphs compare the various geometric parameters to entry + circulating flow as a surrogate for capacity for the purposes of illustration.
20

Information for the Highway Capacity and Quality of Service Committee NCHRP 3-65 July 2004
Exhibit 11: Comparison of Various Geometric Parameters Against Entry+Circulating Flows.
0.00
10.00
20.00
30.00
40.00
50.00
60.00
70.00
80.00
0 2 4 6 8 10 12
Entry width (m)
Entr
y +
Circ
ulat
ing
Flow
(veh
/min
)
14
0.00
10.00
20.00
30.00
40.00
50.00
60.00
70.00
80.00
0 10 20 30 40 50 6
Diameter (m)
Entr
y +
Circ
ulat
ing
Flow
(veh
/min
)
0
21

Information for the Highway Capacity and Quality of Service Committee NCHRP 3-65 July 2004
Exhibit 11: Comparison of Various Geometric Parameters Against Entry+Circulating Flows (cont.)
0
10
20
30
40
50
60
70
80
0 10 20 30 40 50 6
Entry Angle (degrees)
Entr
y +
Con
flict
ing
Flow
(veh
/min
s
0
)
0.00
10.00
20.00
30.00
40.00
50.00
60.00
70.00
80.00
0 1 2 3 4 5 6 7 8 9Effective flare length (m)
Entr
y +
Circ
ulat
ing
Flow
(veh
/min
)
22

Information for the Highway Capacity and Quality of Service Committee NCHRP 3-65 July 2004
4.0 PRELIMINARY OPERATIONAL FINDINGS
As part of Task 7, an enhanced and improved HCM procedure for estimating capacity, delay and queue lengths for single and multi-lane roundabouts will be developed. The approach to the operational model development is divided into a number of tasks, the first of which includes the evaluation of existing models and software. Preliminary investigation of RODEL and SIDRA’s ability to predict the capacity and delay under a variety of geometric and traffic flow conditions has been completed. The analytical process and the preliminary findings are discussed below.
Two draft papers have been prepared that investigate the following:
1. An initial comparison of the data (entry minute flow data converted to hourly flow) and the SIDRA and RODEL hourly capacity estimates from the market software. In addition to the capacity, the delay (sec/veh) has also been extracted and compared with the actual delay data. This working paper, prepared by KAI and Troutbeck, can be found in Appendix B.
2. An initial comparison of the minute entry-flow data and the minute capacity approximations using the capacity models found in RODEL and SIDRA, and others. This working paper, prepared by Brilon and Wu, can be found in Appendix C.
In Appendix B, the capacity (veh/hr) estimates for RODEL and SIDRA at the individual sites have been examined. A sample of site approach data, linear trendlines of the data, and the SIDRA and RODEL capacity estimates are shown below.
In Appendix C, the capacity (veh/min) at the individual sites have been examined using Australian (AUS), German, and English (UK) theory, linear regression of the observed data, and the formulas developed by Tanner-Wu. (Note this has since been updated to also include French, Swiss, and Israeli models.)
The comparison data used in each of these papers is slightly different. Appendix B only includes minute observation with continuous queuing (282 1-lane, 1-min data), while Appendix C uses the minute observations with a “proportion time queued” of 0.8 or higher (439 1-lane, 1-min data). The Appendix C data is further reduced to ensure the sum of the traffic flow rate qe,max+qc does not fall below or exceed certain thresholds. After this plausibility check there is approximately 434 1-min data points.
4.1 Comparison of RODEL and SIDRA against the Operations Data
The following graphs in Exhibit 12 present the observed capacity data from six single-lane approaches with the predicted capacities for RODEL and SIDRA.
23

Information for the Highway Capacity and Quality of Service Committee NCHRP 3-65 July 2004
Exhibit 12: Comparison of Observed Capacity versus Predicted Capacity from RODEL and SIDRA for Six Single-Lane Approaches.
Taneytown East Approach Gorham East Approach
0
250
500
750
1000
1250
1500
1750
2000
2250
2500
0 100 200 300 400 500 600Conflicting Flow (veh/hr)
Max
Ent
erin
g Fl
ow (v
eh/h
r)
SIDRA
Raw Data
RODEL
R2 = 0.39460
200
400
600
800
1000
1200
1400
1600
1800
2000
0 100 200 300 400 500 600 700 800 900Conf licting Flow (veh/hr)
Max
Ent
erin
g Fl
ow (v
eh/h
r)
Raw Data
SIDRA
RODEL
Bend South Approach Bainbridge South Approach
0200
400600800
1000
120014001600
18002000
0 100 200 300 400 500 600 700 800 900Conf licting Flow (veh/hr)
Max
Ent
erin
g Fl
ow (v
eh/h
r) SIDRA
Raw Data
RODEL
0
200400
600800
1000
12001400
16001800
2000
0 100 200 300 400 500 600 700Conflicting Flow (veh/hr)
Max
Ent
erin
g Fl
ow (v
eh/h
r)
SIDRA
Raw Data
RODEL
Port Orchard East Approach Port Orchard North Approach
0
200
400
600
800
1000
1200
1400
1600
1800
2000
0 100 200 300 400 500 600Conf licting Flow (veh/hr)
Max
Ent
erin
g Fl
ow (v
eh/h
r)
SIDRA
Raw Data
RODEL
0
200
400
600
800
10001200
1400
1600
1800
2000
0 100 200 300 400 500 600 700 800Conf licting Flow (veh/hr)
Max
Ent
erin
g Fl
ow (v
eh/h
r)
Raw Data
SIDRA
RODEL
24

Information for the Highway Capacity and Quality of Service Committee NCHRP 3-65 July 2004
Similar findings have been made in both Appendix B and C. The observations for the capacity at single-lane entries roundabouts are as follows:
o The observed entry capacities are lower than any of the international models predict. The UK method (RODEL) as well as the Australian model (SIDRA) tends to overestimate the capacity.
o Both a simple linear regression and the analytical Tanner-Wu model reveal a comparable statistical quality of the results when compared against all site data.
o The slope of the RODEL (UK model) capacity estimates better reflect the data, and hence the UK model might be calibrated by adjusting the intercept to reduce the magnitude of the estimate.
o Assuming that these foreign models do represent the conditions in their countries and assuming that the method of data analysis is valid, one interpretation is that drivers at the US roundabouts behave more carefully or cautiously. Similarly, calibration of the SIDRA model to include the influence of “exiting” drivers (assuming it is not clear to an entering driver that a vehicle is exiting versus circulating) tends to give a better estimate of the capacity.
Two-lane entry findings have been completed as part of Appendix C:
o Using the filter “proportion time queued” of ≥0.8 results in 178 1-min observations. A plausibility check reduces the data to 136 1-min observations.
o When compared against all site data, the attempt to represent the data by linear analysis did not reveal adequate results since there is a remarkable non-linearity. With an exponential regression model a good representation of the observed data was achieved.
o The UK (RODEL) and Australian model (SIDRA) lead to a significant overestimation of capacity.
A preliminary investigation of delay is included in Appendix B. The general finding is that observed delays are higher than predicted delays. Given that the capacities predicted by the models are much higher than observed, this observation is a natural consequence. The team is concentrating effort on improving the capacity prediction and will assess delay after that time.
25

Information for the Highway Capacity and Quality of Service Committee NCHRP 3-65 July 2004
5.0 NEXT STEPS
The project is scheduled to be completed in June 2005, and a considerable amount of analytical work is taking place through the end of 2004. The team is or will be undertaking three tasks:
• Develop a model or models that best represents U.S. operational performance.
• Develop a draft HCM procedure for possible inclusion in the next update of the HCM.
• Develop a software engine that implements the HCM procedure to assist the HCQS unsignalized subcommittee in developing and maintaining the new procedure.
As part of the effort to calibrate existing models, several issues are being studied:
1) Driver behavior: One possibility for the low observed capacities is that U.S. drivers are simply more cautious than international drivers, at least at this point in our roundabout history. For example, we have numerous observations of drivers yielding for no apparent reason. If this is the only cause, then capacities may improve over time as drivers become more familiar; our data from this project for observations in 2003 will be vital to future research efforts in this regard. Capacities may also improve with increased duration of capacity conditions, as has been noted in other studies. In addition, many drivers appear to be treating exiting vehicles as if they were circulating vehicles, possibly due to the general lack of use of turn indicators in the U.S.
2) The impact of geometry. We have mixed opinions within the team regarding the impact that geometry has on the operation of the roundabout. On the one hand, our small sample size makes it difficult to make definitive assessments about the effect of individual geometric parameters. On the other hand, experience in some countries (principally the UK) and in some parts of the U.S. suggests that geometry has a significant effect. To this end, we are exploring several factors of value to designers for which we may be able to make an assessment, even with our limited data. One example is the apparent role that the width of the splitter island may be having, particularly given the observed lack of use of turn indicators on exit. Another possibility is that the geometry at some of our roundabouts with queuing contains elements not easily quantified or even considered in existing models (for example, the use of “effective” geometry or the interrelationship of geometric elements that result in path overlap). These factors, based on observed U.S. behavior, may result in calibration elements to improve the fit of an international model to U.S. data. This maintains the larger experience base of the international model but improves the fit to U.S. conditions, at least at this point in time of our experience.
26