ndot statewide integrated transportation reliability program
TRANSCRIPT

______________________________________________
NDOTStatewideIntegrated
TransportationReliability Program_____________________
Technical Memorandum 1System Identification
Prepared by:
December 15, 2008092202011
Copyright © 2008, Kimley-Horn and Associates, Inc.

TABLE OF CONTENTSTechnical Memorandum #1: System Identification
092202011 NDOT Statewide ITRPTM1 System ID (rev draft 12-15-08).doc System Identification
i December 15, 2008
1. INTRODUCTION AND PROJECT OVERVIEW .................................................................................. 11.1 Project Background .............................................................................................................. 11.2 Project Phasing and Methodology ........................................................................................ 21.3 Phase I Project Outcomes ..................................................................................................... 3
2. CONGESTION AND RELIABILITY ................................................................................................... 42.1 Sources of Congestion ........................................................................................................... 42.2 The Reliability Connection ................................................................................................... 62.3 The Costs of Congestion........................................................................................................ 6
3. ITRP DEVELOPMENT PROCESS AND METHODOLOGY ................................................................. 83.1 Methodology .......................................................................................................................... 83.2 Geographic Areas of Focus for Reliability Planning and Coordination in Nevada .......... 103.3 Stakeholder Involvement .................................................................................................... 11
4. REGION 1 – LAS VEGAS METROPOLITAN AREA ......................................................................... 134.1 Region Overview ................................................................................................................. 134.2 Stakeholder Agencies .......................................................................................................... 134.3 Transportation Networks ................................................................................................... 13
4.3.1 I-15 .................................................................................................................................. 144.3.2 US-95............................................................................................................................... 144.3.3 US-93............................................................................................................................... 144.3.4 I-215 (Bruce Woodbury Beltway) ..................................................................................... 154.3.5 Arterial Street Network .................................................................................................... 154.3.6 Transit Network ............................................................................................................... 15
4.4 Existing Infrastructure and Operations ............................................................................. 164.5 Regional Planning for Congestion ...................................................................................... 174.6 Incident and Emergency Management ............................................................................... 174.7 Future Projects.................................................................................................................... 194.8 Interaction with Other Regions .......................................................................................... 20
5. REGION 2 – RENO/SPARKS/CARSON CITY/LAKE TAHOE AREA................................................. 215.1 Region Overview ................................................................................................................. 215.2 Stakeholder Agencies .......................................................................................................... 215.3 Transportation Networks ................................................................................................... 22
5.3.1 I-80 .................................................................................................................................. 225.3.2 US-395(I-580) .................................................................................................................. 225.3.3 McCarran Boulevard (SR 650/651) .................................................................................. 225.3.4 US-50 and SR-28.............................................................................................................. 235.3.5 SR-431 (Mt. Rose Highway) ............................................................................................. 235.3.6 Arterial Street Network .................................................................................................... 235.3.7 Transit Network ............................................................................................................... 24
TABLE OF CONTENTSTechnical Memorandum #1: System Identification
092202011 NDOT Statewide ITRPTM1 System ID (rev draft 12-15-08).doc System Identification
ii December 15, 2008
5.4 Existing Infrastructure and Operations ............................................................................. 245.5 Regional Planning for Congestion ...................................................................................... 255.6 Incident/Emergency Management ...................................................................................... 255.7 Future Projects.................................................................................................................... 285.8 Interaction with Other Regions .......................................................................................... 28
6. REGION 3 – I-80 CORRIDOR AREA ............................................................................................. 296.1 Region Overview ................................................................................................................. 296.2 Stakeholder Agencies .......................................................................................................... 296.3 Transportation Network and Existing Infrastructure ....................................................... 296.4 Traffic and Freight Travel .................................................................................................. 306.5 Incident/Emergency Management ...................................................................................... 30
7. REGION 4 – RURAL CORRIDORS AREA ....................................................................................... 327.1 Region Overview ................................................................................................................. 327.2 Stakeholder Agencies .......................................................................................................... 327.3 Transportation Network and Existing Infrastructure ....................................................... 327.4 Traffic and Freight Travel .................................................................................................. 33
LIST OF FIGURES
Figure 1 – NDOT ITRP Phase I Project Overview ................................................................................. 2Figure 2 – Sources of Congestion (from FHWA) ................................................................................... 5Figure 3 – NDOT ITRP Planning and Implementation Intersection Diagram ......................................... 9Figure 4 – Reliability Planning Areas in Nevada ................................................................................. 10Figure 5 – Las Vegas Metropolitan Area Infrastructure ....................................................................... 18Figure 6 – Reno/Sparks/Carson City/Lake Tahoe Area Infrastructure .................................................. 27Figure 7 – I-80 Corridor Infrastructure ................................................................................................ 31Figure 8 – Rural Corridors Infrastructure............................................................................................. 34
LIST OF TABLES
Table 1 – Comparison of the Costs of Congestion (Las Vegas and National Average) ........................... 7Table 2 – Reliability Regions in Nevada (Descriptions) ....................................................................... 11

LIST OF ACRONYMS
092202011 NDOT Statewide ITRPTM1 System ID (rev draft 12-15-08).doc System Identification
i December 15, 2008
CAMPO Carson Area Metropolitan Planning Organization
CAS Congestion Analysis System
CCTV Closed-Circuit Television
CMAQ Congestion Mitigation and Air Quality
CMP Congestion Management Plan
CMS Congestion Management System
DMS Dynamic Message Sign
DOT Department of Transportation
EOC Emergency Operations Center
FAST Freeway and Arterial System of Transportation
FHWA Federal Highway Administration
FSP Freeway Service Patrol
HAR Highway Advisory Radio
HOV High Occupancy Vehicle
ITRP Integrated Transportation Reliability Program
ITS Intelligent Transportation Systems
LVACTS Las Vegas Area Computerized Traffic System
MPO Metropolitan Planning Organization
NDOT Nevada Department of Transportation
NHP Nevada Highway Patrol
OMC Operations Management Committee
ReTRAC Reno Transportation Rail Access Corridor
ROC Road Operations Center
RTC Regional Transportation Commission
RTIP Regional Transportation Improvement Plan
RTP Regional Transportation Plan
RWIS Road Weather Information System
TIM Traffic Incident Management
TIP Transportation Improvement Program
TMC Traffic Management Center
TMRPA Truckee Meadows Regional Planning Agency

092202011 NDOT Statewide ITRPTM1 System ID (rev draft 12-15-08).doc System Identification
1 December 15, 2008
1. INTRODUCTION AND PROJECT OVERVIEW
1.1 Project Background
The Nevada Department of Transportation (NDOT) is taking a proactive approach tocoordinating among NDOT Districts (Elko, Las Vegas and Reno) and with regional and localagencies throughout the state for transportation reliability and congestion management. There aremany causes of congestion on Nevada roadways. “Recurring” congestion is often characteristic oflarge urban areas where there are significant peak demands during morning and afternoon rushhours; most commuters who use the roads and freeways during those peak travel periods expectand experience some level of congestion and delay. There are events, however, that lead tocongestion when travelers may not expect it, or add additional delay to an already congestedcommute. These ‘non-recurring’ congestion factors, such as an incident, lane restrictions througha work zone, or unusually heavy traffic as a result of a special event, often mean increased andunexpected delay for travelers. The impacts of congestion, both recurring and non-recurring, aretremendous. Not only does congestion cost the travelers in terms of delay time and lostproductivity, but there are also environmental costs, safety impacts, and shorter lifecycle oftransportation infrastructure due to increased wear and tear.
Reliability in a transportation context is the ability of the traveler to rely on the travel time it willtake to get to their destination. Some factors that challenge and change the reliability of travelfrom the users’ perspective include incidents, construction, peak hour congestion, and otherdynamics that can change during travel. The ability of the state and local agencies to respond tothose factors in real-time to help the traveler get to their destination are intended to maximize thereliability of the transportation network to provide a more reliable and consistent travel time thatthe traveler expects.
NDOT is looking at the impacts of congestion and how integrating a reliability focus into agencyplanning will help agencies better respond to those factors that cause unreliable travel times.Recognizing that there will likely need to be a wide range of approaches to meet the unique needsof different parts of the state, NDOT is focusing on both statewide and regional strategies. Thisproject is called the Integrated Transportation Reliability Program (ITRP), and will create aframework for NDOT and partner agencies to incorporate reliability-focused strategies intotransportation programs.
This is perhaps one of the first statewide studies of its kind because it puts a ‘reliability’ focus onhow agencies approach congestion management and planning for strategies that will result inmore reliable and predictable travel times for motorists. The Regional TransportationCommissions (RTCs) in Washoe County and Southern Nevada are responsible for the CongestionManagement Plans for their respective regions; where ITRP is focusing is on how to integratevarious programs within and across regions to address specific reliability issues and concerns atthe local, regional and even statewide levels. For the purposes of this project, there is a greaterfocus on ‘reliability’ rather than ‘congestion’ in order to capture the overall goal of providing thetraveler with a trip duration and route that can be relied upon with some level of accuracy nomatter what may disrupt travel along the way. Congestion is one component of reliability, butthere is definitely a broader goal of ITRP to also look at the impacts that events such as hazardousweather, incidents, work zones, and other factors have on travel time delay. Another goal is tointegrate transportation needs into land use policies and planning to ensure the most effective landuse model that will not disrupt transportation services as the population or development grows.Another goal is to identify where potential policies or perhaps even legislation may be needed tobe able to advance specific strategies that will have a definite and positive impact on providing

092202011 NDOT Statewide ITRPTM1 System ID (rev draft 12-15-08).doc System Identification
2 December 15, 2008
more reliable travel and travel times. Nevada agencies recognize they may not be able to solve allof the congestion issues as part of this project, but this process will identify how to better plan foroperations that will improve overall trip reliability for the travelers in the state.
1.2 Project Phasing and Methodology
This ITRP project will be developed in two phases:
Phase I focuses on outreach and involvement of key stakeholders and the analysis oftransportation reliability and congestion management/mitigation needs throughout the state ofNevada.Phase II will focus on developing performance measures, detailing strategies, and developingan implementation plan to guide the deployment of transportation reliability and congestionmanagement strategies and technologies to address specific issues.
The process for Phase I of the ITRP plan is shown in Figure 1.
Figure 1 – NDOT ITRP Phase I Project Overview
Key elements of the ITRP study and process include:
Identify those key stakeholder agencies that currently, or in the future, will participate intransportation reliability and congestion mitigation processes and gain consensus ongeographic and transportation network focus areas for project;Work with stakeholders to establish goals for the Integrated Transportation ReliabilityProgram at a statewide level, as well as identify how these statewide goals align with localgoals, plans and processes;

092202011 NDOT Statewide ITRPTM1 System ID (rev draft 12-15-08).doc System Identification
3 December 15, 2008
Research current transportation reliability and congestion management processes, policies,and interactions occurring in Nevada on the local, regional, and state level, as well as howtransportation reliability and congestion management is addressed within current planningprocesses in the state;Research best practices from states similar in size and metropolitan area makeup, as well asnational trends/guidance, to evaluate opportunities for NDOT to implement transportationreliability and congestion management applications;Assess gaps in current Nevada agency plans or policies that could pose a barrier to integratingvarious projects, programs or plans to further the transportation reliability and congestionmanagement goals; andProvide a basis for ITRP Phase II, which will develop performance measures and morecomprehensive implementation and integration strategies.
1.3 Phase I Project Outcomes
Phase 1 of ITRP will include the following key deliverables:
Technical Memorandum #1 – System Identification. The objective of this technicalmemorandum is to introduce the ITRP project and identify key stakeholders that will have animportant role in ITRP strategy development and ultimately implementation. Technicalmemorandum #1 also identifies the primary transportation networks in Nevada and discussessome of the congestion and reliability issues experienced on those networks. More specificprocesses and programs, as well as agency roles and responsibilities will be documented inTechnical Memorandum #2.Technical Memorandum #2 – Current Nevada Practices. This technical memorandum willdiscuss current practices related to transportation reliability and congestion managementprocesses, policies, and interactions occurring in Nevada at the regional and statewide levels.It summarizes the current plans and programs underway by state, regional and local agenciesin Nevada, as well as identifies specific issues raised by stakeholders during the interviews.This information will be used to identify where there may be gaps in current processes orplans relative to reliability goals that stakeholders will establish during Phase 1.Technical Memorandum #3 – Best Practices. Based on some of the reliability issuesidentified in Nevada, a best practices scan is being conducted to identify where other regionsand programs are implementing innovative approaches to improving reliability. This bestpractices scan is looking at incident management, agency coordination, traveler information,performance monitoring, and other elements that can contribute to improved operations andenhanced travel time reliability. Case studies will be included and will detail measurableresults, lessons learned, challenges, and identify how regions or agencies were able tosuccessfully implement high-impact strategies. Where some of these best practices orinnovative approaches could be applied to specific Nevada reliability issues also will beidentified.Technical Memorandum #4 – Gap Analysis. The gap analysis is an important precursor todeveloping any strategies or implementation plans. Using input from stakeholders, theassessment of current programs and processes, as well as identifying where differentapproaches in other areas (best practices) have been able to make a tangible impact onreliability, the team will outline specific gaps in Nevada’s programs. Gaps could includepolicies or even legislative requirements to help advance reliability and congestion programs;they could potentially include gaps in current coordination efforts, procedures, or technology.

092202011 NDOT Statewide ITRPTM1 System ID (rev draft 12-15-08).doc System Identification
4 December 15, 2008
2. CONGESTION AND RELIABILITYCongestion is generally categorized as being recurring (predictable or anticipated) or non-recurring(unplanned and not anticipated). Travelers often associate the term ‘congestion’ with traffic delays thatare recurring and are therefore expected: e.g., morning and afternoon rush hours in a metropolitan area,near major event venues during an event, or known bottlenecks that typically have congestion becauseof capacity issues.
Recurring congestion is generally predictable, so travelers typically plan their travel (how long will ittake to get there, what time will I need to leave, typical conditions on their route) accounting for somelevel of expected congestion based on their own experiences. For example, a commuter who uses thesame route at approximately the same times during the week to get to school or work will have a fairlygood idea of what ‘typical’ conditions and travel times to expect. These may vary slightly if they leaveearlier or later than they normally do, or perhaps they have noticed that travel times and congestionlevels seem to vary slightly whether it is a Tuesday or a Friday.
Non-recurring congestion – as a result of an incident, work zone, or other impact - accounts for morethan half of the delay and unreliability of the transportation system. This type of congestion is notexpected and often has immediate effects on traffic. Non-recurring congestion includes sudden changesin conditions or capacity resulting from things such as incidents on the roadway, weather events causinghazardous driving conditions or closures, or work zones that change traffic control closures on a weeklyor sometimes daily basis. The planning and integration to manage this type of congestion stands to havethe greatest impact to users in terms of influencing their travel and the time it takes for them to get totheir destination.
There is a lot of focus on congestion and its impacts at the national level. Congestion continues toworsen throughout the country, and costs the United States an estimated $78 billion per year – delay onthe nation’s road networks accounts for 4.2 billion lost hours of productivity and almost three billiongallons of wasted fuel (2007 Urban Mobility Report, Texas Transportation Institute). The FederalCongestion Initiative is directing several million in funds toward congestion management strategies andpublic agency planning for those strategies.
Through the Corridors of the Future Program, I-15 was identified as a high priority freight and travelcorridor and is receiving $15 million in federal funding to fast-track capacity and operationalimprovements. Urban Partnerships in major metropolitan areas are looking at aggressive strategiesincluding congestion pricing, multi-modal options for travelers, public-private partnerships, andcoordination in planning for infrastructure. A separate program is providing federal funds forCongestion-Reduction Demonstrations in two additional urban areas. There is strong recognition andleadership at the national level that more needs to be done to address the growing problems ofcongestion and its impacts on travel, infrastructure investments and agency operations.
2.1 Sources of Congestion
The Federal Highway Administration (FHWA) has quantified the various sources of congestion.Local conditions vary widely and developing methods for estimating congestion sources onindividual highways would be highly useful to stakeholders in order to craft mitigation strategies.These sources of congestion are shown in Figure 2.

092202011 NDOT Statewide ITRPTM1 System ID (rev draft 12-15-08).doc System Identification
5 December 15, 2008
Figure 2 – Sources of Congestion (from FHWA)
Congestion is more than just a capacity issue. According to a 2004 FHWA report, TrafficCongestion and Reliability: Trends and Advanced Strategies for Congestion Mitigation,congestion is a result of seven root causes, often interacting with one another.
Physical Bottlenecks (Capacity) – Capacity is the maximum amount of traffic capable ofbeing handled by a given highway section. Capacity is determined by a number of factors: thenumber and width of lanes and shoulders; merge areas at interchanges; and roadwayalignment (grades and curves). Physical bottlenecks typically cause recurring congestion.Traffic Incidents – These are unplanned events that disrupt the normal flow of traffic,usually by physically blocking travel lanes. Events such as vehicular crashes, breakdowns,and debris in travel lanes are the most common form of incidents.Work Zones – Are construction activities on the roadway that result in physical changes tothe highway environment. These changes may include a reduction in the number or width oftravel lanes, lane shifts, lane diversions, reduction, or elimination of shoulders, and eventemporary roadway closures.Weather – Environmental conditions can lead to changes in driver behavior that affect trafficflow. Weather impacts that can cause delay or a reduction in mobility include blowing dust,snow and ice, or precipitation.Traffic Control Devices – Intermittent disruption of traffic flow by control devices such asrailroad grade crossings or traffic signals that are poorly timed or not coordinated alsocontribute to congestion and travel time variability. Traffic control devices typically causerecurring congestion.Special Events – These represent a special case of demand fluctuations whereby traffic flowin the vicinity of the event venue will be radically different from ‘typical’ patterns. Specialevents occasionally cause ‘surges’ in traffic demand that overwhelm the system, often duringevent ingress and egress. Special events typically cause non-recurring congestion.Fluctuations in Normal Traffic – Day-to-day variability in demand leads to some days withhigher traffic volumes than others. Varying demand volumes superimposed on a system with

092202011 NDOT Statewide ITRPTM1 System ID (rev draft 12-15-08).doc System Identification
6 December 15, 2008
fixed capacity also results in variable (unreliable) travel times. Fluctuations in normal traffictypically cause non-recurring congestion.
2.2 The Reliability Connection
Operating agencies often measure congestion and effects of congestion in terms of Level ofService, traffic volumes, speed/mobility as well as delay. Travel time is gaining popularity amongagencies as a measure, because it allows traffic managers to capture trends over time as well asprovides an important indicator as to how well the transportation network is able to respond to thedemands placed on it every day. Travel time has a direct relationship to reliability – more so thanthe other mentioned performance measures – and as such, can provide agencies with a better ideaof whether congestion is decreasing or increasing over time on a particular route.
For the traveler, travel time is probably one of the most tangible measures of their travelexperience. The travelers’ perception of travel time is based on the reliability of those traveltimes for their trips. Five of the seven sources of congestion identified above often result inunreliable travel times due to unanticipated events or as a result of planned events causingtemporary restrictions in capacity.
Recurring congestion can quickly be compounded by unplanned or unanticipated impacts. Forexample, at a signalized intersection, the delay experienced by travelers can increase substantiallyif an incident temporarily blocks one of the travel lanes. Once the incident is cleared, it may takethe intersection multiple cycles (and time) to “recover” back to pre-incident throughput levels. Asan example of travel time reliability not associated with typical urban congestion conditions, asevere incident on a rural highway that blocks travel could result in traffic being detoured severalmiles to circumvent the incident location, and could potentially result in several hours of delay fortravelers as a result of limited alternate routes and significant distance between alternate routes aswell as the increased response time for crews to reach the actual incident location. The reliabilityof a traveler’s trip is directly related to the variability in the performance of the route that is taken.
Travelers’ reliability measures usually consist of one or more of the following:
How long does my trip typically take? (accounts for recurring congestion and the traveler’shistorical experience); andHow much extra time will my trip take if unexpected delays happen? (accounts for non-recurring congestion):
What is causing the unexpected delays?Do I need to change my plans or route to improve the reliability of my travel time?
NDOT’s ITRP program may not be able to solve all of the congestion problems facing Nevadaagencies and travelers, but it is anticipated that there are some key initiatives that can be put inplace within the existing Nevada processes or programs to help improve the reliability of travelon Nevada roads and highways.
2.3 The Costs of Congestion
Every hour of traffic delay for every person traveling in Nevada has an associated cost. Costscome in the form of lost time and productivity during traffic delay, wasted fuel, and increases inair pollution and carbon dioxide emissions. Each year, the Texas Transportation Instituteconducts a comprehensive assessment of the current ‘state of congestion’ around the country in437 areas classified as ‘urban, and provides more detailed data for the largest 85 metropolitanareas (which includes Las Vegas). Table 1 provides a comparison of congestion conditions in Las

092202011 NDOT Statewide ITRPTM1 System ID (rev draft 12-15-08).doc System Identification
7 December 15, 2008
Vegas with the national average from the 2007 Urban Mobility Report. Travelers in the LasVegas area experience almost one week worth of delay each year, which is time spent above andbeyond the actual or ‘typical’ commute travel times.
Table 1 – Comparison of the Costs of Congestion (Las Vegas and National Average)
Las Vegas National AveragePer Traveler Region Per Traveler Nation
Additional delay 39 hours 29 million hours 38 hours 4.2 billion hoursExcess Fuel Consumption 27 gallons 20 million gallons 26 gallons 2.9 billion gallonsCosts of Delay $720 $543,000,000 $710 $78,000,000,000
In the 2007 report, these values were calculated using $2.50/gallon for fuel costs. Using today’scost of fuel, the total cost for the Las Vegas region could actually be in excess of $650-$700million. Outside of the urban areas, delay also has significant cost and time impacts, althoughthese may not be readily or easily quantified. Delays on corridors in the rural areas of Nevada areoften the result of incidents or weather. The high volume of freight traffic that utilizes the I-80and I-15 corridors stands to experience significant delay if detouring is required or if there areweather delays that impact the safety or operations of the corridor.

092202011 NDOT Statewide ITRPTM1 System ID (rev draft 12-15-08).doc System Identification
8 December 15, 2008
3. ITRP DEVELOPMENT PROCESS AND METHODOLOGYReliability and congestion management can have different meanings and different implications to eachstakeholder agency that has been included in stakeholder workshops or one-on-one meetings. To thestakeholder that is representative of a smaller local agency, the concept of reliability may be focused onconcerns related to land use planning, transportation network challenges, and future planning forcoordination with other agencies. For a stakeholder with jurisdiction over a major corridor crossing thestate between metropolitan areas, reliability might involve discussions of travel times, incidentmanagement, interaction of emergency management and traffic agencies to coordinate along thecorridor, and freight and goods movement coordination across the entire corridor.
This project focus is to encapsulate as many of the challenges/issues that affect travel and reliability onthe roadways in Nevada as possible. This requires involvement from the various stakeholder agenciesthat could potentially provide input regarding these challenges/issues. This section will describe theproject methodology and stakeholder involvement that has been key to establishing the foundation ofinformation necessary to proceed with the next project tasks.
3.1 Methodology
Stakeholder input is necessary to help identify the gaps in existing plans, processes, procedures,systems, and practices that impact traveler reliability in Nevada. The information that is importantto capture as part of the initial tasks of the project includes:
Statewide processes/procedures – This information is related to congestion mitigation,planning, funding allocation, interactions with other states, and roles and responsibilities ofstatewide interactions with more localized agencies within Nevada.Existing systems – There are different types of planning/integration occurring throughoutNevada depending on the urban or rural context of the area. Information obtained on alocalized basis includes land use planning, arterial/freeway interactions, arterial networks,transportation planning for the arterial networks, existing or planned projects that could affecttravel reliability, and infrastructure to support congestion management.Existing processes and interactions within Nevada – Coordination between the variousefforts that are occurring throughout the state are key to developing an effectiveimplementation plan as one of the later tasks of this project. Establishing which processes andplans are occurring today on an individual stakeholder agency basis and which of those arecurrently shared or coordinated with other agencies that those efforts may affect will guide thegap analysis phase of this project.Best practices research – Research of other regional, state, and federal processes foraddressing transportation reliability and congestion outside of Nevada will be used inconjunction with knowledge of what is happening within Nevada will guide therecommendations that are developed for this project.
NDOT has developed a chart for the ITRP program that summarizes the potential assets andimpacts that exist which affect the transportation network and the reliability of the network. Thischart, shown in Figure 3, serves as a framework to begin the process of evaluating how systemsand processes overlap to cause or mitigate congestion.

092202011 NDOT Statewide ITRPTM1 System ID (rev draft 12-15-08).doc System Identification
9 December 15, 2008
Figure 3 – NDOT ITRP Planning and Implementation Intersection Diagram
The information summarized in Figure 3 focuses on the interaction between planning andimplementation that could affect reliability on the roadways. Planning that occurs for reliabilityissues such as non-recurring congestion, recurring congestion, and homeland security in the topsection of the chart utilize the various infrastructure components at the left edge of the chart tohelp address those reliability issues. Intersections of planning and implementation topic areasrepresent opportunities for research and applications development to leverage existing data andinformation.
For recurring congestion, there are various infrastructure components and programs such asIntelligent Transportation Systems (ITS), transit systems, traveler information systems, and landuse planning that could be coordinated to improve day-to-day problems such as bottlenecks andsignal timing that cause the recurring congestion. Non-recurring congestion (weather, incidentmanagement, emergency response, work zones, and events), which is not typically a result ofcapacity or land use planning issues, can be mitigated through the use of traveler informationsystems, ITS monitoring devices, and transit capabilities. This chart effectively summarizes therelationship that planning for congestion has to the monitoring capabilities and assets that areavailable for congestion management and reliability. This diagram will be refined as the projectprogresses.

092202011 NDOT Statewide ITRPTM1 System ID (rev draft 12-15-08).doc System Identification
10 December 15, 2008
3.2 Geographic Areas of Focus for Reliability Planning and Coordination in Nevada
Nevada represents a wide range of potential reliability issues, ranging from congested urbanmetropolitan areas, to rural corridors that provide intrastate routes. In order to effectively identifyspecific congestion and reliability issues (and future strategies), dividing the state into geographicregions would allow for identifying more corridor-specific and localized issues. These areas weredefined by the type of congestion management and reliability planning that could or should occurbetween agencies. Rural strategies that can be applied to planning and operations may besubstantially different than urban strategies that offer a more detailed focus of localizedimprovements.
Four geographic regions, or “zones”, were developed to encompass as much of the transportationnetwork as is feasible in this project while still addressing the differences between rural and urbantransportation network reliability. These regions are shown in Figure 4, with a more detaileddescription in Table 2. In addition to these specific regions, a statewide component is also part ofITRP; although much of the day-to-day operations are carried out at the district or regional levels,NDOT has responsibility at the statewide level for implementing programs and policies that willprovide a level of consistency in reliability strategies for major corridors. More detail aboutstatewide processes and procedures are addressed in Technical Memorandum 2.
Figure 4 – Reliability Planning Areas in Nevada
092202011 NDOT Statewide ITRPTM1 System ID (rev draft 12-15-08).doc System Identification
11 December 15, 2008
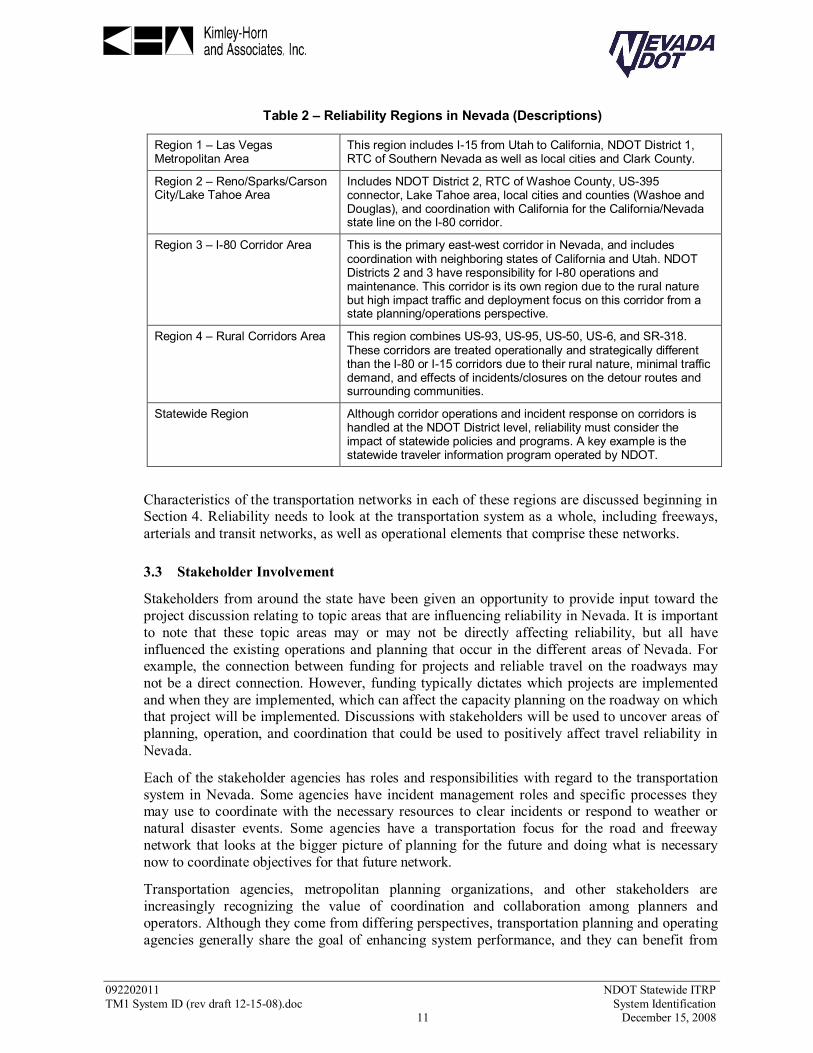
Table 2 – Reliability Regions in Nevada (Descriptions)
Region 1 – Las VegasMetropolitan Area
This region includes I-15 from Utah to California, NDOT District 1,RTC of Southern Nevada as well as local cities and Clark County.
Region 2 – Reno/Sparks/CarsonCity/Lake Tahoe Area
Includes NDOT District 2, RTC of Washoe County, US-395connector, Lake Tahoe area, local cities and counties (Washoe andDouglas), and coordination with California for the California/Nevadastate line on the I-80 corridor.
Region 3 – I-80 Corridor Area This is the primary east-west corridor in Nevada, and includescoordination with neighboring states of California and Utah. NDOTDistricts 2 and 3 have responsibility for I-80 operations andmaintenance. This corridor is its own region due to the rural naturebut high impact traffic and deployment focus on this corridor from astate planning/operations perspective.
Region 4 – Rural Corridors Area This region combines US-93, US-95, US-50, US-6, and SR-318.These corridors are treated operationally and strategically differentthan the I-80 or I-15 corridors due to their rural nature, minimal trafficdemand, and effects of incidents/closures on the detour routes andsurrounding communities.
Statewide Region Although corridor operations and incident response on corridors ishandled at the NDOT District level, reliability must consider theimpact of statewide policies and programs. A key example is thestatewide traveler information program operated by NDOT.
Characteristics of the transportation networks in each of these regions are discussed beginning inSection 4. Reliability needs to look at the transportation system as a whole, including freeways,arterials and transit networks, as well as operational elements that comprise these networks.
3.3 Stakeholder Involvement
Stakeholders from around the state have been given an opportunity to provide input toward theproject discussion relating to topic areas that are influencing reliability in Nevada. It is importantto note that these topic areas may or may not be directly affecting reliability, but all haveinfluenced the existing operations and planning that occur in the different areas of Nevada. Forexample, the connection between funding for projects and reliable travel on the roadways maynot be a direct connection. However, funding typically dictates which projects are implementedand when they are implemented, which can affect the capacity planning on the roadway on whichthat project will be implemented. Discussions with stakeholders will be used to uncover areas ofplanning, operation, and coordination that could be used to positively affect travel reliability inNevada.
Each of the stakeholder agencies has roles and responsibilities with regard to the transportationsystem in Nevada. Some agencies have incident management roles and specific processes theymay use to coordinate with the necessary resources to clear incidents or respond to weather ornatural disaster events. Some agencies have a transportation focus for the road and freewaynetwork that looks at the bigger picture of planning for the future and doing what is necessarynow to coordinate objectives for that future network.
Transportation agencies, metropolitan planning organizations, and other stakeholders areincreasingly recognizing the value of coordination and collaboration among planners andoperators. Although they come from differing perspectives, transportation planning and operatingagencies generally share the goal of enhancing system performance, and they can benefit from

092202011 NDOT Statewide ITRPTM1 System ID (rev draft 12-15-08).doc System Identification
12 December 15, 2008
stronger linkages. The major point is that while each group has its own priorities, both plannersand operators need to be involved in all phases of the project development timeline.
Keeping stakeholders engaged in the ITRP project as well as obtaining their input to keystrategies is a mission-critical component of the ITRP project. Stakeholders involved in thisproject are providing valuable input on their agency’s perspective of what is happening in Nevadaand are offering insight into potential ways to mitigate congestion and improve reliability throughcoordinating efforts.
The following specific stakeholder involvement strategies are being used in Phase 1 to maintainconsistent focus on the projects’ objectives:
Introductory presentations to stakeholders in northern and southern Nevada as part ofalready established meetings to initially inform stakeholders that this project is beingdeveloped and to request their participation and input;One-on-one meetings with the various stakeholder agencies throughout the state to betterunderstand the current plans and processes relating to travel reliability and congestionplanning;Two stakeholder workshops to gather stakeholders together to review existing conditions,best practices, and strategize about potential integration needs within Nevada; andA project website to provide a one-stop resource for project deliverables, meeting dates, andimportant links to other web sites. This project can be accessed from The website URL is:http://www.kimley-horn.com/projects/NevadaITRP/index.shtml.
The following is a summary of stakeholder agencies that have been contacted to gather input ofexisting processes and strategies as well as interaction with other planning/implementationstrategies happening with other agencies. These stakeholders will be requested to participate instakeholder workshops and review deliverables as the project progresses.
Clark CountyCity of HendersonCity of Las VegasCity of North Las VegasCity of RenoCity of SparksRTC of Southern NevadaFASTDouglas County
Washoe CountyWashoe County SheriffWashoe County RTCNevada DOT HeadquartersNevada DOT District 1Nevada DOT District 2Nevada DOT District 3Nevada Highway Patrol

092202011 NDOT Statewide ITRPTM1 System ID (rev draft 12-15-08).doc System Identification
13 December 15, 2008
4. REGION 1 – LAS VEGAS METROPOLITAN AREA
4.1 Region Overview
The Las Vegas metropolitan area and surrounding suburban areas contain the largestconcentration of people in the state of Nevada. It is currently one of the fastest growingmetropolitan areas in the nation, with a population of approximately two million people. Evenwith the recent economic downturn, the region is expected to double to nearly four million peopleover the next 20 years.
This region is characterized by high density residential development supporting a robusthospitality industry and a diverse commercial base. The Las Vegas metropolitan area is unliketraditional urban cities in that it does not have a centralized business district. A large portion ofthe valley’s employment base is focused along several miles of Las Vegas Boulevard within theResort Corridor. According to the Southern Nevada Transportation Study completed in 2003 byNDOT District 1, there are upwards of 250,000 people employed in the Resort Corridor whichrepresents approximately 50% of the employment in the Las Vegas valley. The 24/7 operation ofgaming properties and their supporting service industries creates peak travel periods that areunlike other metropolitan areas of similar size; the afternoon peak often begins around 1:30 or2:00 PM.
Agencies in the region have struggled to keep pace with growth and with the expansion ofpopulation centers further from the urban core. Even with continuous investment, developing keyfreeway and arterial infrastructure that serve the growing demand is a challenge. In many areas,right-of-way is limited due to dense development. The costs associated with acquiring right-of-way have also escalated making capacity enhancements difficult, especially enhancements toaddress near-term capacity needs.
4.2 Stakeholder Agencies
Several agencies have participated in one-on-one discussions about reliability and congestion inthe Las Vegas metropolitan region. These include:
City of Las Vegas;City of North Las Vegas;City of Henderson;RTC of Southern Nevada;Freeway and Arterial System of Transportation (FAST);Clark County;NDOT District 1; andNevada Highway Patrol (NHP) Southern Command.
4.3 Transportation Networks
The transportation networks serving the Las Vegas valley are comprised of the freeway network,arterial road network, and the transit network that together encompass travel in the Las Vegasmetropolitan area. This section will describe each of the main freeways impacting congestion andreliability in this region as well as the other transportation networks impacting the arterialnetworks. Some of the freeways discussed in this section, including US-93 and US-95, extend far
092202011 NDOT Statewide ITRPTM1 System ID (rev draft 12-15-08).doc System Identification
14 December 15, 2008
beyond the urban area; portions of these corridors outside of the urban area are addressed as partof the rural corridors section.
4.3.1 I-15
I-15 extends in a northeasterly direction from the California state line through the LasVegas valley and the northwest corner of Arizona into Utah. I-15 is a vital north-southconnection for travel within the Las Vegas valley. I-15 parallels and provides primaryaccess to the majority of gaming properties within the Resort Corridor. It also serves as aprimary route for interstate travel and commerce between southern California and Canada.The I-15 corridor was recently identified by the United States Department of Transportation(DOT) as a “Corridor of the Future”, one of six multi-state transportation corridors that willbe eligible for the accelerated designation of federal funds and project development.
I-15, from its intersection with US Highway 93 in Las Vegas to the Canadian border, is partof the CANAMEX Trade Corridor which extends from Canada to Mexico through fivestates. The CANAMEX Trade Corridor was defined as a high priority corridor by Congressin the 1995 National Highway Systems Designation Act. Due to the local, regional andnational importance of the I-15 corridor, it has been the focus of major investment by theState of Nevada. These investments include:
Construction of the system-to-system interchange with US 93/95 and I-515;Numerous improvements to arterial interchanges;Development and implementation of a freeway management system;Large scale planning studies; andConstruction of express lanes and the initiation of the I-15 North design-build project.
4.3.2 US-95
US-95 traverses the western edge of the State of Nevada and connects I-15 in the City ofLas Vegas to I-80 near the Cities of Reno and Sparks. US-95 shares an alignment with US-93 and I-515 west of I-15 through the eastern portion of the Las Vegas valley to BoulderCity. US-95 diverges from US-93 west of Boulder City and continues south throughNevada and into California to its termination at I-40. US-95 also connects to the BruceWoodbury Beltway (I-215) in the northern portion of the Las Vegas Valley.
NDOT recently completed a large-scale reconstruction project on US-95 west of I-15 toimprove access, increase lane capacity and develop High Occupancy Vehicle (HOV) lanes.NDOT is currently working with the RTC of Southern Nevada to investigate the feasibilityof extending the HOV lanes north to a newly developed park-and-ride facility in thenorthern portion of the Las Vegas Valley. US-95 is a heavily traveled commuter corridorthat connects high-density residential development is the north and west portions of the LasVegas valley with I-15 and the major employment centers within the valley.
4.3.3 US-93
US-93 traverses the eastern edge of the State of Nevada and connects I-15 in the City of LasVegas to I-80 in Wells. Within the Las Vegas urban area, US-93 is a heavily traveledcommuter corridor that connects high-density residential development is the north, east andsouth portions of the Las Vegas valley with I-15, I-215 and the major employment centerswithin the valley.

092202011 NDOT Statewide ITRPTM1 System ID (rev draft 12-15-08).doc System Identification
15 December 15, 2008
US-93 shares an alignment with US-95 and I-515 west of I-15 through the eastern portionof the Las Vegas valley to Boulder City. US-93 diverges from US-95 west of Boulder Cityand continues south and east through Boulder City, over Hoover Dam, and south to I-40 andcentral Arizona. US-93, from its intersection with I-15 in Las Vegas to Phoenix, Arizona, isalso part of the CANAMEX Trade Corridor. Key activities along the US-93 corridorinclude:
NDOT and the City of Henderson recently completed a system interchange betweenUS-93 and I-215.NDOT is constructing the Colorado River Bridge and Hoover Dam Bypass to improvesafety and increase commerce and travel between Nevada and Arizona along US-93.NDOT has also initiated the I-515 corridor study to identify improvements to the I-515/US-93/95 corridor between I-15 in the City of Las Vegas to Foot Hills Drive in theCity of Henderson. The study looks to address short-term and long-term needs toreduce congestion and improve safety, capacity and system operation.
4.3.4 I-215 (Bruce Woodbury Beltway)
The 215 Beltway is a circumferential route that connects I-15 in the northeast portion of theLas Vegas Valley to US-93/95 in the southeast portion of the Las Vegas valley.Construction on the Beltway has been on-going for over ten years, with the majority of thesouthern and western segments being fully constructed with grade separated interchanges.The 215 Beltway is a vital commuter route within the Las Vegas valley that providesconnectivity to large residential developments on the outer edges of the Valley with anumber of primary arterial routes, I-15 and US-93/95.
4.3.5 Arterial Street Network
The majority of arterial streets outside of downtown Las Vegas are oriented on a section-line grid network. Primary arterial streets are located at approximately one mile increments,with secondary arterial streets generally located at quarter mile increments between primaryarterial streets. Primary arterials within the Las Vegas valley can carry in excess of 50,000vehicles per day, with arterials such as Tropicana Avenue, Flamingo Road and SaharaAvenue in the heart of the Resort Corridor serving close to 80,000 vehicles per day.
FAST operates the regional arterial traffic management system from the FAST operationscenter. This includes traffic signal operations, corridor timing strategy implementation, andcoordinating with cities for signal communications and coordination. Several key arterialsalso are instrumented with closed-circuit television (CCTV) cameras which can be viewedby the FAST operators.
4.3.6 Transit Network
RTC Transit (formerly Citizens Area Transit) is a regional transit service that covers aservice area of approximately 266 square miles and carrying more than 190,000 passengersper average weekday in the greater Las Vegas valley according to the 2007 National TransitDatabase. Since 2002, the growth in ridership with the RTC has increased by more than 40percent. RTC continues to expand fixed-route service, as well as adding express lines,Flexible Demand Response routes, paratransit and other mobility-based routes. The RTC asdeveloped a Bus Rapid Transit (BRT) service called MAX which operates along Las VegasBoulevard North. The RTC is currently in the planning and development stage of the ACE

092202011 NDOT Statewide ITRPTM1 System ID (rev draft 12-15-08).doc System Identification
16 December 15, 2008
rapid transit system. This system has been described as the RTC’s showcase publictransportation initiative for the Las Vegas valley, and will be an express service with fewerstops than fixed-route service moving more people in shorter periods of time. ACE willconnect downtown Las Vegas, the Las Vegas Convention Center, the Strip, Henderson andNorth Las Vegas.
Reliability of the transit system is not only impacted by internal procedures and operations,but highly influenced by the congestion level of operation of the roadway network on whichit operates. RTC of Southern Nevada operates their transit system through a centralizeddispatch. Transit operators work with FAST staff on a daily basis to share informationregarding operational and equipment issues and congestion. FAST in turn uses a portion ofthe transit fleet as probe vehicles to gauge travel time, arterial speed and levels ofcongestion.
In addition to RTC Transit services, a number of other transit-related alternative modeprojects are operational or in the planning stages in southern Nevada. One transit service ofnote is the Las Vegas Monorail which operates a seven-station, four mile, monorail systemthat operates on an elevated guideway and provides access to gaming properties on the eastside of Las Vegas Boulevard. A proposed expansion would extend this service to McCarranInternational Airport, and potentially reduce congestion on routes from the Airport to theResort Corridor.
4.4 Existing Infrastructure and Operations
FAST is an operational division within the RTC of Southern Nevada. FAST is a uniqueoperations entity in that it manages and controls both the freeway and arterial networks from theFAST Traffic Management Center (TMC). NDOT and the RTC of Southern Nevada are fundingpartners, both contributing to the operations and management of FAST. FAST evolved from theLas Vegas Area Computerized Traffic System (LVACTS), which was a multi-agency arterialmanagement program previously administered by the City of Las Vegas. The components of theFAST network and operations include:
FAST operates all of the arterial and interchange traffic signals, dynamic message signs(DMS), CCTV, ramp meters and other ITS devices in the Las Vegas metropolitan area.The FAST TMC is collocated with NHP’s Southern Command dispatch. These agencies sharea video wall whereby FAST operators can display specific freeway cameras to supportincident and event management.In addition to data obtained through the FAST FMS instrumentation, FAST also obtains datafrom field devices installed by Traffic.com. This data comes into the TMC through the FMSsystem. FAST is currently evaluating the use of Traffic.com data to bolster the FASTdatabase and expand the current travel time program.There are currently about 1,120 traffic signals on the FAST network, of which approximately600 of those have coordinated control and communications. Arterial CCTV cameras are inplace on several key arterials, including Las Vegas Boulevard, Charleston Boulevard, DecaturBoulevard, Tropicana Avenue, Flamingo Road, and Craig Road, among others.FAST operates the traffic signals on a regional basis, and establishes corridor timing planswhich often encompass multiple jurisdictions along the same corridor. In general, localagencies are responsible for the signal hardware maintenance, although FAST may makesome adjustments to controllers or communications as part of signal timing/coordinationupdates.

092202011 NDOT Statewide ITRPTM1 System ID (rev draft 12-15-08).doc System Identification
17 December 15, 2008
RTC of Southern Nevada has an established program to allocate $300,000 annually for trafficsignal synchronization/coordination projects. FAST’s goal is to re-time the entire valley everyone to two years.FAST is currently testing adaptive signal control at ten signals. If the results of this testprogram are positive, significant changes could be enacted to deploy large-scale adaptivesystems on major corridors throughout the valley.
A multi-agency Operations Management Committee (OMC) provides oversight and direction forthe FAST program, including identifying project priorities, reviewing performance statistics, andresolving operational issues. In addition to the RTC and NDOT, the FAST OMC also includesClark County and the Cities of Las Vegas, North Las Vegas and Henderson.
Existing infrastructure in this region including CCTV cameras, DMS, highway advisory radio(HAR), road weather information system (RWIS), and detection are shown in Figure 5.
4.5 Regional Planning for Congestion
The RTC of Southern Nevada is the designated metropolitan planning organization (MPO) for theLas Vegas valley and surrounding communities. The RTC develops and maintains the region’scongestion management system (CMS) which was initiated in 2002. The CMS is a support toolfor local transportation officials to implement strategies to improve operations on identifiedcorridors. As part of the CMS for the Las Vegas valley, a Congestion Analysis System (CAS)was developed which identified the most highly congested areas in the Las Vegas valley.Corridors selected for testing the CAS included Charleston Boulevard, Cheyenne Avenue, CivicCenter Drive, Lake Mead Drive, Sunset Road, Boulder Highway, Tropicana Avenue, Las VegasBoulevard, and Flamingo Road. The CAS provides a consolidated congestion score utilizing fourcomponents of congestion (intensity, extent, reliability, and duration) provides a comprehensiveview of congestion in the valley.
SAFETEA-LU now requires a Congestion Management Program (CMP) as part of an MPO’sregional transportation plan, which differs from the previous Congestion Management System.The federal CMP requirement means agencies now need to identify causes of recurring and non-recurring congestion, identify and evaluate alternative strategies to construction, and defineperformances measures. The RTC of Southern Nevada has just initiated a working group toformalize the CMP. The CMP will outline a process that will be applied to projects in the 4-yearTransportation Improvement Program (TIP) that will be utilizing federal funding mechanisms.
4.6 Incident and Emergency Management
Recognizing that incidents are among the leading cause of non-recurring congestion,transportation and public safety/law enforcement agencies embarked on a Southern NevadaTraffic Incident Management (TIM) coalition in November of 2007. This coalition includes NHP,NDOT, Clark County maintenance, Las Vegas and Clark County Fire, ambulance serviceproviders, Coroner’s office, environmental clean-up service providers, and the Las Vegas PoliceDepartment (Metro). The TIM program is bringing together key partners to improve freewayincident response and clearance, improve coordination among agencies during incidents, andidentify key strategies and processes that will minimize the impact to the freeway networks as aresult of both minor and major crashes.

092202011 NDOT Statewide ITRPTM1 System ID (rev draft 12-15-08).doc System Identification
18 December 15, 2008
Figure 5 – Las Vegas Metropolitan Area Infrastructure

092202011 NDOT Statewide ITRPTM1 System ID (rev draft 12-15-08).doc System Identification
19 December 15, 2008
Several local agencies identified freeway incidents as being a significant contributor tocongestion on their arterials (outside of congestion typically experienced during AM and PMcommute periods). Local agencies also indicated that there could be better communicationbetween local police and local traffic agencies when there are incidents or crashes on the arterials.The exception is a fatality, in which case there is more concerted coordinated between lawenforcement and city traffic and public works; both Clark County and North Las Vegas have aprocedure to send out a team to investigate all fatal crashes in their jurisdictions.
Other important incident/emergency management operations occurring in the Las Vegasmetropolitan area include:
NHP Southern Command Dispatch is collocated with FAST operators in the FAST TMC,which provides NHP with direct access to FAST freeway CCTV video.NDOT operates a Freeway Service Patrol (FSP) service that patrol continuous routes usingspecially equipped vans to provide assistance to disabled vehicles, lost or injured motorists,pedestrians, travel lane or shoulder debris, accident scenes, vehicle fires and fuel leaks. FSPpatrols I-15, I-515, I-215 in the Las Vegas metropolitan area. The TIM program is looking toexpand the FSP program to include traffic control and other services for freeway incidents.
4.7 Future Projects
Projects that will change the dynamics of travel on the roadways in this region include:
Express Lanes are being built in both directions along I-15 in the Las Vegas valley to helpease traffic congestion and allow commuters a time-efficient alternative when traveling non-stop between Russell Road and Sahara Avenue (5.5 miles). This project is anticipated to becompleted in the fall of 2009.The I-15/US-95 Demonstration Project is an initiative by NDOT to examine the effectiveness,value and functionality of managed lanes in Nevada. Managed lanes are designed andoperated to manage access via user group, pricing, and other criteria. The demonstrationproject will convert the existing HOV lanes on US-95 and the express lanes underconstruction on I-15 into managed lanes. Managed Lanes are anticipated to be open to trafficby 2012, pending legislative approval of the project.There are a number of major construction projects that are in the planning and constructionstages for NDOT that will increase capacity on some of the most congested corridors in theLas Vegas valley. The I-15 North design-build project is under construction and will includecorridor widening and interchange improvements between the US-93/95 interchange andCraig Road. The I-15 South Transportation Planning Study is moving into the design-buildstage with a number of planned capacity improvements between Tropicana Avenue and SloanRoad. NDOT is also in the final planning stages of Project Neon. Project Neon is expected toprovide capacity-related improvements to I-15 and a number of adjacent arterial streetsbetween US-93/95 and Tropicana Avenue.NDOT is expanding their FAST communication infrastructure with the FAST Package Bproject. This project will install fiber optic communications (no field elements) on I-15between Charleston Boulevard and the southern I-215 Beltway and on Lake Mead Parkwaybetween the I-215/US 93/95 interchange and Boulder Highway. NDOT has also identifiedfuture FAST communication enhancements along the southern I-215 Beltway but has notmoved the project into the design phase.NDOT is working with Clark County and McCarran International Airport on designs toreconstruct the existing airport tunnel and its connection to I-215. NDOT is also is theplanning phase to identify capacity related improvements to the I-215/I-15 system interchange

092202011 NDOT Statewide ITRPTM1 System ID (rev draft 12-15-08).doc System Identification
20 December 15, 2008
as part of the I-15 South project. These improvements are anticipated to significantly changetraffic operations on the I-15 corridor.There is a high-speed passenger rail project called Maglev (magnetic-levitation) which isproposing the construction of a 269-mile Maglev train line from Las Vegas, Nevada toAnaheim, California. Maglev is an advanced technology in which magnetic forces lift, propel,and guide a vehicle over a guideway. The first 40-mile segment was appropriated $45 millionin 2005 for the planning phase. This segment would run from Las Vegas to Primm, Nevada,with proposed service to the new Las Vegas Airport. The top speed would be 310 mph.NDOT is working closely with the Federal Railroad Administration, the California-NevadaSuper Speed Train Commission, and the California Department of Transportation (Caltrans)on preparing a Program Environmental Impact Statement/Program Environmental ImpactReport for a Maglev system along the Las Vegas-Los Angeles corridor.
4.8 Interaction with Other Regions
The Las Vegas region sees the confluence of US-93 and US-95 (both Region 4) as they passthrough the Las Vegas valley and continue south into Arizona and California. Impacts ofcongestion within the Las Vegas valley can have significant impacts on US-93/95 in theirimmediate vicinity of the valley, but these impacts diminish quickly as these routes leave theurbanized area. Strategies developed for this region should take into account the effects on itsneighboring regions to ensure that a strategy does not increase reliability in one region and reduceit in another.

092202011 NDOT Statewide ITRPTM1 System ID (rev draft 12-15-08).doc System Identification
21 December 15, 2008
5. REGION 2 – RENO/SPARKS/CARSON CITY/LAKE TAHOE AREA
5.1 Region Overview
The Reno/Sparks/Carson City/Lake Tahoe area contains the second largest concentration ofpeople within the state of Nevada. Washoe County, including the Cities of Reno and Sparks,along with Carson City, Douglas and Lyon Counties have a total combined population ofapproximately 500,000 people. Seasonal influx in both summer and winter means tourismthroughout the region is both a strong economic factor as well as introduces new challenges toeffectively managing and operating the area’s transportation networks. The economy of the areais principally based in the trade and service sector, with approximately 65% of the work forceemployed in these occupations. Although gaming and other recreational activities represent asignificant portion of the growing economy, the area is experiencing gradual diversification of itsbusiness base with the expansion of distribution, warehousing, and manufacturing facilities.Approximately 25% of the workforce is employed in the fields of construction, manufacturing,transportation, communications, public utilities, and finance related services.
This region also includes the corridors leading to the Lake Tahoe area, which includes SR-431(Mt. Rose Highway), US-50, and SR-207. There are few corridors leading to the Lake Tahoearea, and they experience high volumes of traffic during both summer and winter seasons.Furthermore, these corridors traverse mountainous terrain, which complicates winter drivingconditions to and from key recreational areas. With few alternate routes, closures of any of thesefacilities result in significant detours. Although considered to be rural corridors, they arediscussed here due to their connectivity of the Reno and Carson City areas with Lake Tahoe tothe west. US-50 is discussed in more detail in Region 4.
This region is located on the western edge of the Great Basin, just east of the Sierra NevadaMountain Range; its geographical location brings additional weather related challenges notusually experienced in southern Nevada. With an average of 25 inches of snow in some locationsand 7.5 inches of rain per year, the area experiences weather related incidents that candramatically affect traffic operations.
Agencies in this region, just as in southern Nevada, have struggled to keep pace with growth andwith the expansion of population centers further from the urban core. Obtaining right-of-way andsecuring funding for transportation improvements is an on-going challenge.
5.2 Stakeholder Agencies
Several agencies participated in one-on-one discussions about reliability and congestion in theReno/Sparks/Carson City/Lake Tahoe area. These include:
Washoe County;RTC of Washoe County;Washoe County Sheriff;NDOT HeadquartersNDOT District 2;NDOT District 3;City of Reno;City of Sparks; andDouglas County.

092202011 NDOT Statewide ITRPTM1 System ID (rev draft 12-15-08).doc System Identification
22 December 15, 2008
5.3 Transportation Networks
The transportation networks serving the Reno/Sparks/Carson City/Lake Tahoe area are comprisedof the freeway network, arterial road network, and the transit network that together encompasstravel in the region. This section will describe each of the main corridors impacting congestionand reliability in this region as well as the other transportation networks impacting the arterialnetworks.
5.3.1 I-80
I-80 extends generally in an east/west direction from the California state line through theReno/Sparks area and east to Utah. This corridor is subject to weather-related closuresduring winter months, as well as congestion as a result of tourism traffic heading to the skiareas in the Sierras. I-80 is a vital east-west connection for travel within the Reno/Sparksarea, and I-80 experiences daily recurring congestion during the morning and afternooncommute hours; the I-80/US-395 interchange in the heart of Reno is the highest volumeinterchange in Northern Nevada according to NDOT annual traffic statistics. Due to thelocal, regional and national importance of the I-80 corridor, it has been the focus ofinvestment by the State of Nevada in both infrastructure and operational improvements.These investments include the construction and modification of interchanges andcoordination with neighboring states to provide improved notification of construction andweather related activities. NDOT, in cooperation with the Federal Highway administration,is also close to completing the I-80 Reno Area Corridor Study. The study wascommissioned to address the rapid population growth and associated demands to thecorridor.
5.3.2 US-395(I-580)
US-395 is a heavily traveled north-south corridor within this metropolitan area. US-395extends north from the California state line through Carson City and Reno and back intoCalifornia; it is the primary travel route between Carson City and the Reno/Sparks area.This portion of the US-395 corridor through Carson City and Douglas County travelsgenerally undeveloped areas that are characterized by sparse residential and highwaycommercial development. US-395 has seen volumes increase to levels that areincompatible with the surrounding environment and its desired functional classification. Toaddress these issues, NDOT has initiated the I-580 freeway extension project. This projectwill extend between Mt. Rose Highway (SR 431) from the existing US-395 (I-580)terminus to Bowers Mountain Cutoff. US-395 experiences daily recurring congestionduring the morning and afternoon commute hours. This corridor provides direct access tothe Reno Tahoe International Airport and experiences seasonal peaks with Stategovernment activities in Carson City, as well as recreational activities in both summer andwinter.
5.3.3 McCarran Boulevard (SR 650/651)
McCarran Boulevard is a primary arterial route that circles the greater Reno/Sparks area.This circumferential corridor was envisioned to be a high-speed controlled access facility.However, development trends and access demands have limited its effectiveness.McCarran Boulevard passes through areas of unincorporated Washoe County, City of Renoand City of Sparks. Maintenance and operations responsibilities are shared among theseagencies as well as NDOT for the portions identified as SR 650 and SR 651.
092202011 NDOT Statewide ITRPTM1 System ID (rev draft 12-15-08).doc System Identification
23 December 15, 2008
5.3.4 US-50 and SR-28
US-50 extends from the South Lake Tahoe area, through Carson City, and then east throughthe center of the state into Utah. This corridor is one of three east/west corridors throughNevada and is used as an alternative for traffic from I-80 during incidents/closures on I-80.In the Carson City area, US-50 is surrounded by housing and retail developmentsconcentrated on the corridor which is a major contributor to the congestion in Carson City.East of Carson City, US-50 travels through desert and mountains and has minimal devicesfrom which to manage or provide information to travelers.
West of Carson City, US-50 is one of the main corridors leading to the Lake Tahoe area,and continues as the primary corridor around the southwestern portion of the lake to theNevada/California state line. There are few access points to this corridor, and limitedalternate routes in the event of an incident or evacuation.
SR-28 traverses the northwest portion of Lake Tahoe on the Nevada side, and continueswest past the state line into California. Similar to US-50, there are few alternate routes oraccess points from this corridor in the event of an incident, closure or evacuation. Snowplow operations also make winter driving a challenge on these corridors.
5.3.5 SR-431 (Mt. Rose Highway)
This corridor traverses the Sierra Nevada mountain range, and connects North Lake Tahoe(Incline Village and Crystal Bay) with Reno. Several major ski and recreation areas areaccessible from the Mt. Rose Highway, and as a result, it experiences high volumes oftraffic during the winter driving season. NDOT is responsible for winter maintenance andhas a snow plow program in place to respond to road weather conditions. Travelers arenotified both en-route (flashing beacon signs) and with DMS about chain requirementsduring winter; Nevada’s 511 phone and web site also contain current information aboutwinter driving conditions for this corridor. There are few alternates to this corridor in theevent of a major closure; travelers would need to use SR-50 further south, or access theLake Tahoe Area using I-80 and SR-89 through Truckee, California.
5.3.6 Arterial Street Network
The majority of the street network in the Reno/Sparks area as well as Carson City does notfollow a typical grid pattern. Large portions of these two areas are oriented on a grid, butthe arterials in these areas generally do not provide continuous connectivity to other regionsas would a typical grid network. The Reno/Sparks arterial street network is comprised offour and six lane streets. The arterial network is generally capable of processing dailydemand with the exception of peak hour congestion at major arterial intersections andfreeway interchanges.
The City of Reno recently completed the Reno Transportation Rail Access Corridor(ReTRAC) project as a new travel mode. This project was initiated out of concerns fortraffic congestion and safety in downtown Reno. The ReTRAC project depressed over twomiles of train track that ran through Downtown Reno. Eliminating the vehicle/pedestrianconflicts with rail activities has greatly improved safety, traffic flow, emergency vehicleaccess and property values.

092202011 NDOT Statewide ITRPTM1 System ID (rev draft 12-15-08).doc System Identification
24 December 15, 2008
5.3.7 Transit Network
The RTC of Washoe County operates all transit services within Washoe County. Fixed-route service is provided in the greater Reno/Sparks areas with circulator bus service in thedowntown and university areas. The fixed route service includes 30 routes and a fleet ofapproximately 75 coaches. Public transportation in the rural areas is generally demand-responsive. These transit services provide nearly nine million rides each year. In the 2040draft Regional Transportation Plan, RTC has established a key goal of 6% mode split fortransit, and is making key investments in enhancing transit services in the metro area tomake transit a more viable and desirable option for commuters. These enhancementsinclude transit signal priority on Virginia Street and new transit centers.
There are a variety of public transit services operating within the Carson Area MetropolitanPlanning Organization (CAMPO) planning area which include fixed route and paratransitroute services. The fixed route service utilizes four distinct routes serving much of CarsonCity and a dial-a-ride program provides an individual transportation option.
Within Douglas County, transit is primarily provided by Douglas Area Rural Transit(includes both fixed-route and flex route), and BlueGO which serves the southern LakeTahoe area (Zephyr Cove to the state line).
There are a number of trolley, demand-response and shuttle services that providetransportation around the Lake Tahoe area, although some of these services are seasonal.
5.4 Existing Infrastructure and Operations
The Reno/Sparks/Carson City area currently has existing traffic signal systems and a limitednumber of ITS devices that support traffic management. These ITS systems and communicationsare not integrated and controlled by one centralized facility and therefore introduces someinteragency coordination challenges across jurisdictions. The region has begun looking atoperations and management, and the potential benefits of coordinating operations on a regionalbasis. Existing infrastructure and operations are summarized in the following:
In the Reno/Sparks urban area, there are two agencies that operate traffic signal systems tomanage the traffic signal timing along key corridors in the area. Reno is operating a VMS 330system and Sparks is operating an Eagle system. Reno currently is working towardsimplementing a new Naztec system which is an updated and more conducive system forimplementing additional timing and adaptive strategies in the future.The City of Reno has installed CCTV cameras to be able to monitor key intersections.Additional cameras will be implemented as funding is available. There are discussions ofsharing a video feed between City of Reno Traffic and the Reno Police Department.Reno and Sparks share a handful of primary travel corridors and they work together to makesure signal timing is coordinated at the boundaries of their jurisdictions. Reno has developed afull Synchro model of the City and they intend to eventually begin retiming efforts in-houseusing the model developed by the Congestion Mitigation and Air Quality (CMAQ) fundedsignal timing project through the RTC. This program includes Washoe County, Reno andSparks.NDOT and the RTC of Washoe County have begun discussions with the local agencies onstandardization and the development of a physical or virtual Traffic Management Center. ThisTMC will allow enhanced communication and control of each agency system.

092202011 NDOT Statewide ITRPTM1 System ID (rev draft 12-15-08).doc System Identification
25 December 15, 2008
NDOT has a District 2 Road Operations Center (ROC) in the City of Sparks which is staffedtwenty-four hours a day. Staff in the operations center is able to enter information intoNDOT’s statewide database, which then is sent to populate the web site and 511 travelerinformation services. From the ROC, operations staff can monitor winter weather conditionsvia RWIS, activate DMS signs and coordinate operations with District 3 and Caltrans.
Existing ITS infrastructure in this region, including CCTV cameras, DMS, HAR, RWIS, anddetection are shown in Figure 6. Some of these corridor segments are also included in the Region3 and 4 discussions on I-80 and rural corridors.
5.5 Regional Planning for Congestion
The RTC of Washoe County is the designated MPO for all of Washoe County, including theReno/Sparks metropolitan area. The RTC develops and maintains the regional congestionmanagement system. The RTC of Washoe County is responsible for planning, development andpreparation of the region's long-range Regional Transportation Plan (RTP) and the short-rangeRegional Transportation Improvement Program (RTIP). The 2040 RTP has been recentlycompleted and is in the review and approval stages.
Douglas County developed a Transportation Plan in 2007 that has a 2030 horizon for potentialtransportation projects and enhancements. Future population forecasts and travel demand patternsshowed a strong need to identify where capacity and safety improvements were most needed,with particular emphasis on US-395 in Gardnerville and Minden. This is a multi-modal plan thatalso addresses public transportation and non-motorized transportation.
The Truckee Meadows Regional Planning Agency (TMRPA) was created to foster coordinationamong the three local governments: City of Reno, City of Sparks and Washoe County. TheTMRPA develops a Truckee Meadows Regional Plan which encompasses all of Washoe Countyexcluding the drainage basin of Lake Tahoe and federally-recognized tribal lands.
CAMPO is the MPO for the Carson City urbanized area. The MPO for the Lake Tahoe area is theTahoe Metropolitan Planning Organization. These entities are responsible for the multimodaltransportation planning process for their respective urbanized areas which includes thedevelopment of an RTP (20-year planning horizon) and a TIP (4-year horizon).
5.6 Incident/Emergency Management
Incident management in this region includes not only crashes on freeways and arterials, but alsoincludes emergency operations during hazardous winter weather, floods or fires. City police andfire, as well as County sheriffs handle incident response and management for arterials. NevadaHighway Patrol is responsible for law enforcement on State facilities. A Traffic IncidentManagement Coalition soon will be getting underway in northern Nevada.
Other incident and emergency operations occurring in this region includes:
There are local Emergency Operations Centers (EOC) including city and county. Duringmajor events the local EOC will have a representative at the regional EOC. All dispatchassociated with the major event goes through the local EOC.High-priority preemption is already being used for fire and REMSA emergency responders onmajor corridor traffic signals in the region. The Reno Fire Department is not able to preempttraffic signals in Sparks because of incompatible equipment.Communication regarding incidents and work zone closures/restrictions is limited betweenfirst responders and the local City and Police Departments.
092202011 NDOT Statewide ITRPTM1 System ID (rev draft 12-15-08).doc System Identification
26 December 15, 2008
Fire and police patrol in the Reno/Sparks area currently are installing computers in theirvehicles to receive silent dispatch and data.The NDOT FSP operated by NDOT patrols I-80 in the Reno/Sparks area and also theI-580/US-395 corridor between Carson City and the Reno/Sparks area.

092202011 NDOT Statewide ITRPTM1 System ID (rev draft 12-15-08).doc System Identification
27 December 15, 2008
Figure 6 – Reno/Sparks/Carson City/Lake Tahoe Area Infrastructure

092202011 NDOT Statewide ITRPTM1 System ID (rev draft 12-15-08).doc System Identification
28 December 15, 2008
5.7 Future Projects
Projects that will change the dynamics of travel on the roadways in this region include:
The I-580 Freeway Extension project will improve travel between the Reno/Sparks area andCarson City. This NDOT project will decrease travel time and improve safety by shiftingtraffic from the existing US-395 corridor. Major portions of this project have been completedbut opening of the facility is still several years away.The Carson City Freeway project will also improve travel between the Reno/Sparks area andthe Carson City/Tahoe area. This NDOT project will decrease travel time and improve safetyby shifting traffic from the existing US-395 corridor through downtown Carson City. Thisproject is being constructed in stages. The final stage of this project is anticipated to becompleted in by 2014, pending the availability of funding.NDOT is in the planning and development stages of the Northbound US-395 ImprovementProject. This project is approximately 3.2 miles in length and will develop additional travellanes and include other operational improvements, including the implementation of ITSdevices that will improve travel on US-395 between I-80 and Moana Lane. The project hasnot been funded.The RTC of Washoe County is in the planning stages for the SouthEast Connector. Thisproject is intended to relieve congestion on adjacent north-south arterials and freeways andprovide for improved connection between the southern and eastern portions of the TruckeeMeadows. The SouthEast Connector is planned as a high access control roadway that ismobility focused.The RTC of Washoe County, the City of Reno, City of Sparks, Washoe County, and NevadaDepartment of Transportation have partnered together on the Traffic Signals OperationsImprovement Project. This is a comprehensive project aimed at improving traffic signaloperation and enhancing traffic mobility throughout Washoe County by coordinating trafficsignals and limiting the delays. The goal of the project is to evaluate every signal withinWashoe County at least once every three years. This project is funded with federal CMAQfunds on a yearly basis.
5.8 Interaction with Other Regions
The Reno/Sparks/Carson City/Lake Tahoe area sees the influence of I-80 (Region 3) as it passesthrough the Reno/Sparks area and is impacted by I-80 operations near the Nevada/California stateline. Impacts of congestion and weather-related incidents on I-80, US-50 or US-93 and US-95can impact travel throughout northern Nevada. Closures or delays on these corridors can have aripple effect throughout the area as travelers and freight movements are diverted to alternateroutes. Strategies developed for this region should take into account the effects on itsneighboring regions to ensure that a strategy does not impact reliability in one region and reduceit in another.

092202011 NDOT Statewide ITRPTM1 System ID (rev draft 12-15-08).doc System Identification
29 December 15, 2008
6. REGION 3 – I-80 CORRIDOR AREA
6.1 Region Overview
Region 3 (I-80) includes the primary east-west travel corridor in northern Nevada. I-80 providesintra as well as interstate movement of people and goods over varied terrain. I-80 consistsprimarily of four-lane divided roadway, with the exception of segments in the Reno/Sparks area.This corridor is operated, managed and maintained by NDOT District 2 and District 3, and theseDistricts routinely coordinate on winter weather management strategies, detours, and otheroperational requirements. NDOT also coordinates closely with Caltrans and the Utah Departmentof Transportation for incidents and closures that have multi-state impacts.
6.2 Stakeholder Agencies
The agencies involved in discussions regarding the I-80 corridor include:
NDOT District 2;NDOT District 3;NDOT Headquarters;Elko County Sheriff;City of Elko; andNHP Central Command.
6.3 Transportation Network and Existing Infrastructure
The stretch of I-80 through Nevada is largely desolate and mountainous. Services are limitedthroughout the corridor, although cities and towns (including Fernley, Winnemucca, Elko, Wellsand others) do provide for some services and amenities for passenger and freight traffic. Existinginfrastructure and operations are summarized below:
Both NDOT District 2 and District 3 have been making significant investments in ITS devicesalong the I-80 corridor to provide traveler information at key points and in advance ofpotential alternate routes. Warning signs for chain areas, state line closures and DMS inadvance of key decision points are important strategies for rural corridor operations. NDOTplans to make more use of HAR to warn of incidents, weather hazards, detours, or closure ofI-80 at the California state line. There are additional DMS planned for I-80 in District 2.There are limited evacuation or detour routes in the event that segments of I-80 are closed.NDOT’s Road Operations Center in District 2 and District 3 are open 24/7, and routinelycoordinate for traffic operations and corridor monitoring. From the ROC, NDOT staff canmonitor RWIS along the corridor and view CCTV cameras that are strategically located atRWIS sites, key interchanges, summits and the tunnel. The ROCs also operate DMS andHAR on these corridors and also enters information about incidents/closures into NDOT’s511 database. NDOT estimates that 70-80% of the functions that the District 2 and District 3ROCs perform can be controlled from the other ROC through shared operations.NDOT coordinates with both Caltrans and Utah DOT for efficient operations on I-80. Utahhas placed a DMS on the Nevada side of I-80 which Utah DOT operates. NDOT is currentlyin discussions about potential joint operations of that DMS.

092202011 NDOT Statewide ITRPTM1 System ID (rev draft 12-15-08).doc System Identification
30 December 15, 2008
ITS funds have been used primarily to upgrade communications/dispatch centers, althoughthere has been a strong focus in this region to build redundancy into the communicationsnetwork.
Existing infrastructure along these corridors including CCTV cameras, DMS, HAR, and RWISare shown in Figure 7.
6.4 Traffic and Freight Travel
According to the NDOT 2007 Annual Traffic Report, trucks contribute nearly 31% of the trafficvolumes on I-80 in Nevada. NDOT District 3 estimates that truck volumes could account for asmuch as 70% of the total traffic on I-80 during the nighttime hours. Factors that contribute to thecongestion and impacts on reliability include:
There are limited facilities or services along the I-80 corridor to accommodate large volumesof trucks parking or lengthy back-ups due to an incident on the corridor or closure at the stateline. This is typically not an issue, but can cause significant congestion and recovery periodsduring incidents and closures.There are no formal detour routes or detour plans for the I-80 corridor. Detour routes typicallyutilize state facilities as well as county roads. When truck traffic needs to be rerouted, countyfacilities may not be able to handle the high volumes of truck traffic produced by a majorinterstate along the detour route.Staffing for a large closure/detour is not available in the rural areas of this region somaintaining and verifying the integrity of the detour route is often challenging. Multipleagencies are often involved, including state, county and federal (such as Bureau of LandManagement).
6.5 Incident/Emergency Management
Major reliability issues for NDOT District 3 are incidents/crashes, wildfires, and weather. Factorsthat contribute to the congestion along these corridors include:
Weather is often a short-term event that can be planned for in advance. For fireevacuation/response, there are pre-planning meetings in the spring/summer each year betweenNDOT, Fire responders, NHP, County and other agencies in preparation for future incidents.Closures on I-80 at the Nevada/California state line (such as during a major winter storm) setin motion a process to notify agencies along the corridor about the extent and expectedtimeframe. Depending on the anticipated length of the closure, the notifications could go asfar east as Wyoming to alert westbound truckers to use an alternate route.There is a strong need to get better interoperability among agencies – NHP and NDOT are onthe 800MHz radio system, but other local agencies use VHF channels. NHP have worked toput an 800MHZ radio in each major dispatch center to help with local agency coordination forincident management needs.

092202011 NDOT Statewide ITRPTM1 System ID (rev draft 12-15-08).doc System Identification
31 December 15, 2008
Figure 7 – I-80 Corridor Infrastructure

092202011 NDOT Statewide ITRPTM1 System ID (rev draft 12-15-08).doc System Identification
32 December 15, 2008
7. REGION 4 – RURAL CORRIDORS AREA
7.1 Region Overview
This region includes the rural corridors of US-93, US-95, US-50, US-6, and SR-318. Descriptionsof the corridors are provided in this section.
US-50 extends between California and Utah. US-50 provides intra and interstate movements ofpeople and goods, but primarily serves to connect rural areas of eastern Nevada and also serves asa vital alternate to I-80 in the event traffic needs to be detoured. US-50 connects Carson City andUS-395 to the south Lake Tahoe area and is heavily utilized in both winter and summer. US-50is the main alternate route for I-80 for freight movement and interstate travelers. This corridor isoperated, managed and maintained by NDOT District 2 and District 3, and these Districtsroutinely coordinate on winter weather management strategies, detours, and other operationalrequirements.
US-93 and US-95 are the only contiguous north/south corridors that traverse the entire length ofthe state. US-93 is in eastern Nevada and extends from the Nevada/Idaho state line south throughthe Las Vegas metropolitan area and the Hoover Dam and into Arizona. Portions of this corridoralign with I-15 in the Las Vegas metropolitan area as well as US-6/US-50 near Ely in the east-central part of Nevada. US-95 travels the western portion of Nevada and extends from theNevada/Oregon state line and follows the alignment of I-80 (at Winnemucca) until just south ofthe Pershing/Churchill County line just west of Humbolt Lake. There is a unique split of US-95and ALT US-95 accessible via US-50 between Fernley and Fallon. Further south, US-95 followsa westerly alignment of US-6 from approximately Coaldale to Tonopah, and then continues southinto the Las Vegas valley. NDOT District 1 identified that there is a limited amount of tourismtraffic accessing recreational areas just north of the Las Vegas metropolitan area (including skiareas), but did not identify any issues beyond that point. SR-318 was identified as a high prioritycorridor as the primary connector between US-6 and US-93.
Portions of US-95 and US-93 are also located in the Las Vegas metropolitan area, and the urbansegments of these corridors are discussed in Section 4; similarly, some portions of US-50 areaddressed in Section 5 with its proximity to the Carson City area. This section of the technicalmemorandum focuses on the rural portions of these corridors.
These corridors are treated operationally and strategically different than the I-80 or I-15 corridorsdue to their rural nature, minimal traffic demand, and effects of incidents/closures on the detourroutes and surrounding communities.
7.2 Stakeholder Agencies
All three Nevada DOT districts are involved in these rural corridor operations and management.In stakeholder discussions with these districts, there were very few issues identified for thesecorridors outside of the Las Vegas and Reno/Sparks/Carson City metropolitan areas.
7.3 Transportation Network and Existing Infrastructure
US-50 crosses the center of Nevada traversing large desolate areas with no or few motoristservices. The US-93 and US-95 corridors have limited ITS infrastructure to monitor traffic or toprovide traveler information. Two RWIS sites have been deployed on US-95 near Hawthorne andShurz. Two RWIS sites have been deployed on US-6 that runs concurrent with US-50 and US-93at Connors Summit and at the US-6/US-50 Sacramento Pass. There are three DMS planned for

092202011 NDOT Statewide ITRPTM1 System ID (rev draft 12-15-08).doc System Identification
33 December 15, 2008
US-95: northbound direction south of Luning, southbound direction south of US-95A, andnorthbound direction north of Hawthorne. NDOT operates flashing beacons to provide warningsto travelers. There was no ITS infrastructure identified on US-93.
Existing infrastructure along these corridors are shown in Figure 8. Previous sections havehighlighted infrastructure that it within more urbanized areas.
7.4 Traffic and Freight Travel
As with the I-80 corridor, these rural corridors do not have any formal detour routes or detourplans. Although not primary freight corridors, the US-95 corridor does provide a key link fromsouthern Nevada to I-80 in the north. These are also key alternate routes that east-west traffic mayuse to detour onto another route in the event of an incident or closure on I-80, US-50 or US-6.SR-318 is frequently used as a bypass between US-6 and US-93 and is in need of operationalstrategies to increase operations and management along the corridor.

092202011 NDOT Statewide ITRPTM1 System ID (rev draft 12-15-08).doc System Identification
34 December 15, 2008
Figure 8 – Rural Corridors Infrastructure