ne - defense technical information center · ne _n_ surface contamination on ldef ... __ "6 2...
TRANSCRIPT

SMC-TR-94-21 AEROSPACE REPORT NO.' •lmTR-92(2935)-11
NE
_N_ Surface Contamination on LDEFExposed Materials
DTIC15 June 1992 ELECTE1992 • JUN 03 199411
Prepared by F ,N0314
C. S. HEMMINGERMechanics and Materials Technology CenterTechnology Operations
Prepared for
SPACE AND MISSILE SYSTEMS CENTERAIR FORCE MATERIEL COMMAND2430 E. El Segundo BoulevardLos Angeles Air Force Base, CA 90245
94-16510
Engineering and Technology Group
THE AEROAPPROVED FOR PUBLIC RELEASE;
CORPORATION DISTRIBUTION UNLIMITED
__ "6 2 067

This report was submitted by The Aerospace Corporation, El Segundo, CA 90245-4691, underContract No. R)4701-88-C-0089 with the Space and Missile Systems Center, 2430 E. El SegundoBlvd., Los Angeles Air Force Base, CA 90245. It was reviewed and approved for The AerospaceCorporation by S. Feuerstein, Principal Director, Mechanics and Materials Technology Center.
This report has been reviewed by the Public Affairs Office (PAS) and is releasable to the NationalTechnical Information Service (NTIS). At NTIS, it will be available to the general public,including foreign nationals.
This technical report has been reviewed and is approved for publication. Publication of thisreport does not constitute Air Force approval of the report's findings or conclusions. It ispublished only for the exchange and stimulation of ideas.
Win. ylem. Captain USAFDeputy, nuara & International Division

REPORT DOCUMENTATION PAGE FormApoedOMB No. 0704.0188
I~d m~lbN~ Wts ••md irepletui -b Is~iin Ur wcalsieq 11~mi i n Se, nd•m ohonue~ reudig U~r bmdmt .ef,m or wjti durinped 'eq* u, aam~ e
susesedlfor "*md, a i Uthis'• . b soW,,'Aig he nW S id es.,4rk n- for b*mv r o piwiae w*a knd Repouft 1215J Joeson Da* Hfigi wny. SAes1204 AWAftn. VA M=4SWk mdl Utod Omoffiee Maw"gemeeta 9n udgee.PeuWut Redudin PmjedV7040o186), Wmfun, C=Wl
1. AGENCY USE ONLY (L.ve b/aI) 2. REPORT DATE 3. REPORT TYPE AND DATES COVERED1 15 June 1992
4. TITLE AND SUBTITLE 5. FUNDING NUMBERS
Surface Contamination on LDEF Exposed MaterialsF04701-88-C-0089
6. AUTHOR(S)
Hemminger, Carol S.
7. PERFORMING ORGANIZATION NAME(S) AND ADDRESS(ES) S. PERFORMING ORGANIZATION
The Aerospace Corporation REPORT NUMBER
Technology Operations TR-92(2935)-11El Segundo, CA 90245-4691
9. SPONSORING/IMONITORING AGENCY NAME(S) AND ADDRESS(ES) 10. SPONSORING/MONITORINGSpace and Missile Systems Center AGENCY REPORT NUMBERAir Force Materiel Command2430 E. El Segundo Boulevard SMC-TR-94-21Los Angeles Air Force Base, CA 90245
11. SUPPLEMENTARY NOTES
12L. DISTRIBUTIONIAVAILABILITY STATEMENT 12b. DISTRIBUTION CODE
Approved for public release; distribution unlimited
13. ABSTRACT (Maximum 200 word)
X-ray photoelectron spectroscopy (XPS) has been used to study the surface composition andchemistry of Long Duration Exposure Facility (LDEF) exposed materials. In each set of samples,silicones were the major contributors to the molecular film accumulated on the LDEF exposedsurfaces. All surfaces analyzed have been contaminated with Si, 0, and C; most have low levels(<1 atom%) of N, S, and F. The contaminant overlayer is thought to be patchy, with significantareas covered by less than 100 A of molecular film. For most materials analyzed, Si contaminationlevels were higher on the leading-edge surfaces than on the trailing-edge surfaces. It is probablethat the return flux associated with atmospheric backscatter resulted in enhanced deposition ofsilicones and other contaminants on the leading-edge flight surfaces relative to the trailing edge.XPS analyses, however, did not conclusively show different relative total thicknesses of flight-deposited contamination for leading- and trailing-edge surfaces. Unlike other materials, exposedpolymers, such as Kapton and FEP-type Teflon, had very low contamination on the leading-edgesurfaces. SEM evidence showed that undercutting of the contaminant overlayer and damagedpolymer layers occurred during atomic oxygen erosion, which would enhance loss of material fromthe exposed surface.
14. SUBJECT TERMS 15. NUMBER OF PAGES25
LDEF, Contamination, XPS inIC QUALITY INSPECTED 2 16. PRICE CODE
17. SECURITY CLASSIFICATION 18. SECURITY CLASSIFICATION 19. SECURITY CLASSIFICATION 20. LIMITATION OF ABSTRACTOF REPORT OF THIS PAGE OF ABSTRACTUNCLASSIFIED UNCLASSIFIED UNCLASSIFIED
NSN 7540-01-280-5500 Standard Form 298 (Rev. 2-89)Prescribed by ANSI Std. Z39-18298-102

PREFACE
The authdr would like to acknowledge the many cmtrutors to this work within The AerospaceCorporation, including T. Giants, S. Gyevay, C. Jaggers, T. Le, J. Mallao, N. Marquez, Mi Meghislmek,G. Gaha man 0. Steckel, W. Stuckey, C. Su, and J. Uht. In addition, I would like to thank IL G.Pippin of Boeing Arospace & Electronics, W. Slemp of NASA Langley Research Center, E. Lin of
cDonnell Douglas A Company, and D. Wallace of QCM Research for making samplesavailable to us. I also thank D. Wheeler of NASA Lewis Research Center for his helpful discussions onTeflkm rdiation damage.
"Accesion ForNTIS CRA&I
DTIC TABUnanrnounced 0Justification
By..Distribution I
Availability Codes
Dist Avail aiidjor
A-1 Special

CONTENTS
PRRCA ......................... C............................................................................................................... 1
L INTRODUCTION ................................................................................................................... 5
IL E XPMERMTAL ................................................................................................................. 7
EL. RESULTS AND DISCUSSION ............ ............................................................................... 9
A. t on Composite, Paint, and QCM S urfcs ............................................... 9
B. Contamination on Polymer Surfaces .............................................................................. 13
IV. SUMMARY ............................................................................................................................ 23
REFERENCES ................................................................................................................................ 25
FIGURES
1. SEM images and surface composition of FEP ........................................................................ 15
2. XPS spectrm of the Cls peaL ................................................................................................ 16
3. SEM images of surface morphology changes observed on a section of thetrailing edge F4 blanket surface ........ .................................................... ....................... 18
4. SEM images of a tasition zoe on the A10 blanket edge ............ ......... .. .. . . ....... .... 20
5. SEM images of submicron particles of SiO2 on a masked edge surface of the CS b ...... 21
3

TABLES
1. LDEF Exposed Material and Reference Samples Investigated ......................... . . 8
2. LDEF Exposed Material Information . ... ..................... ........................................................ 8
3. XPS Data for Carbon Fiber/Aluminum Alloy Composites .................................................... 9
4. XPS Data for WDEF Fiber/Organic Matix Composites ....................................................... 10
5. X PS Data for S13LO Paint ........................ ......................................................................... 11
6. XPS Data for QCM C aminaio ........ ........... ........................................ ........... 12
7. Summary of SEM and XPS Results .................................................................................. 14
8. XPS Data fr K.pton ............................................................................................................. 19
4

L INTRODUCTION
In the course of LDEF post-retreval investigations, XPS has been used to study the surfacecompostion and chmistry of exposed materials, inclung AzjFE, Kapton, S13GLO pain, QCMs,carbon fiber/rgaic matrix composies, and carbon fiber/Al alloy composites. One objective of this studywas to compare typical surface 7 ni types and coverages On leading and trailing edge LDEFexposed surfaces for a variety of materials. Analysis of anomalies and oten "nohepresenmae areas wasgenerally avoided in an attempt to maximize dam acquisition for areas with average excposure to the spaceesrrnent. XPS is an excellent surface analysis techmique for the study of commnwm ovedayers. EachXPS nalysis provides an average semi-quantitative surface composition over an ame approximately 4 x 5
imm, with an analysis depth of 50 to 100 A. All elements can be detected except hydrogen and helium.The deils of electron energies and peak shapes give mformaton about the chemical ste of manyelements in the sample surface. Minimal sample preparation of LDEF exposed materials was required forXPS analysis, and the analysis was nondestructive mile. the surface components we• radiati sensitive.Surface charging of isulators and semiconductor does not pose a major pmrblem for the XPS techique,allowing straightforward analysis of surface oxides and contamination layers. Comple SEM/EDSanalysis was used to look at many of the same samples. EDS analysis provides an average semi-quantitative surface composition over the area rastered by the electron beam, with an analysis depth of 5 1PM.
5

IL EXPERIMENTAL
The LDEF exposed materials and their reference samples investigated in this study are listed in Table1. The LDEF experiment and exposure position of the samples is included in the table, where the notation"D9" indicates bay D/row 9 of IDEF. Some materials were analyzed with no sample preparation otherthan nmounting on an appropriate sample stub. Most, as indicated in Table 1, were cut to provide samplesthat could be introduced into the analysis system. Additional information about the materials is given inTable 2.
The LDEF exposed and reference samples were analyzed by XPS using a VG Scientific LTDESCALAB MK II instrument. The samples were mounted on sample stubs with strips of tantalum foil orwith double-sided tape. Survey scans from 0 to 1100 eV binding energy were acquired to qualitativelydeternmie the sample surface composition. Analysis area were about 4 x 5 mm in size and analysis depthwas about 50 to 100,A. Data acquisition with a Mg Ka nd an Al Ka source was used to check for all theelemets of inteM. High o on elemental scans were subsequme rum to obtain semi-quantitativeelemental analyses fxrom peak area measurements and chemical state information from the details ofbiding energy and shape. Measured peak areas for all detected elements were corrected by elementalsensitivity factors before nmaliaion to give surface mole %. The quanfitation error on a relative basis is
10% of the measuremeMt for components with a smuface concentration >1 mole %. Larg uncertainties inthe relative eemnt sensitivity factors can inloduce absolute errors of a factor of 2 or even greater. Thedetection limit is about 0.1 srface mole %, but spectral overlaps between large peaks and small peaks canmake it impossible to detect minor components, particularly when more than one cemica state is presentfor a given element
A JEOL 840 SEM with an EDAX 9900 EDS system was used for the SEM/EDS analyses.Nonconductive surfaces were coated by carbon evaporaton to minimize surface charging effects.
7

Table 1. LDEF Exposed Materal and Reference Samples Investigated
LIDBF exposed material Exubuzand location _--- searton Refeec ape
Carbon fiber/Al alloy M0003; DS and D4 I12 inch squares cut Flighcontrolscomposite Laboratory controlsCarbon fiber/orgamic matrix M0003; D9 and D3 1V2 inch squares cut Backside flight controlscompositesS3GLO paint M0003; D9 and D3 As-received Labomaty renfereacQuartz crystals from QCMs M0003; D9 and D3 Crystals dismounted from Refrence QCM crystals
QCMs and acetonwashedat QCM Research
Kapmon A0076; F9 112 inch squar cut Laboory referenceAg/E, thermal control A0004-1; F2 12 inch sqpas cut Laboratory controlsblankets A0178; DI, A2, A4, F4, BS, Masked edge flight controls
C5, D5, C6, B7, D7, C8,AIO, CI, DlI
Ag/PEP, adhesively mounted M0003; D9 1/2 inch squares cut Laboratory r efcesthermal control she A0076; F9 Masked edge flight controls
Table 2. LDEF Exposed Material Information
LDEP exposed material Supplier Additiona inmationCar fiber/Al alloy Fiber Materials, Inc. GY70 graphite fibers, mamfactured by BASFComposite Structural Materials Inc., reinforcing Al alloy 201 matrix
with 2024 Al alloy surface foils. Major components of2024 alloy are 93% Al, 4.4% Ca, 1.5% Mg and 0.6%
Carbon fir/organic matrix The Aerospace Corporation T300 woven faic, manufactured by Amococomposites Performance Products, Inc., reinforcing
poly(arylacetylene) materials that wer underdevelopment at The Aerospace Corporation in 1984.
S13GLO paint L 1. T. Research Institute; White thermal control paint Zinc oxide pigmentcoupons made by TRW encaMpslate in potassium silicate with a methyl silicone
binder.Quartz crystals from QCMs QCM Research Active QCWS used crystals with 9000A Al + A120 3
plus 150 A In2Oj top layer. The top layer on passiveQCMs was 150A ZnS.
Kapton E. I du Pont de Nemours & A polyimide.Co., Inc.
Ag/PEP, thermal control Sheldahl 5 mil EP Teflon, manufactured by E. I du Pont deblankets Nemours & Co., Inc.Ag/PEP, adhesively Sheldahl 2 mil FEP Teflon, manufactured by p. I du Pont demounted thermal control Nemours & Co., Inc.sheets
8

1iL RESULTS AND DISCUSSION
A. CONTAMINATION ON COMPOSITE, PAINT, AND QCM SURFACES
The XPS data for the carbon fiberl/Al alloy composite samples are shown in Table 3. The entire XPSsignal should come from the 2024 Al alloy surface foil, which was shown to be intact by SEM, and its
-mationoverlayer. The flight surfaces had visible discoloration. The exposed side of the tailingedge sample had a pale brown stain. The exposed side of the leading edge sample had a rainbow-like lightdispersion in some areas, and its backside had a very pale brown stain. The laboratory and flight controlsurfaces did not have visible discoloration. The flight control sample had been mounted on the backside ofthe D4 cassette.
The laboratory control surfaces were contaminated with C, Si, N, Na, K, Ca, F, Ca, P, and S. Pre-launch contamin was clearly significant. This points out how laboratory control samples can be criticalotheassesment ofoc-flight conaand material modification. The flight control surfaces and
sample backsides (another commonly used "flight control") had higher rios of Si contaminationthan the lab control surfaces by more than a factor of 2. The observed variability for Si (7 to 28%) on thesefour surfaces was a factor of 4, showing the inherent inaccuracy of using only flight controls forcomparison to the exposed surfaces. The contamimatin on the leading edge sample backside surface wasparticularly high, possibly due to preflight or postflight contamination The Si concentration on the exposedsurfaces was a factor of 2 higher than on the flight controls. Si conmination was about 25% higher on theleading edge exposed surface than on the trailing edge exposed surface. Si was detected predomin ly asSiO2 on both exposed flight surfaces and on the leading edge sample backside; this assignment was basedon a Si2p binding energy of 103.5 + 0.2 eV after charge correction. On the other surfaces, the Si2p peakwas detected at lower binding eanegy, 102.9 + 0.3 eV, which indicated surface silicone or possibly mixedsRsilicate/sica. It was not possible to determine the source of carbon on the flight surfaces: it couldcome from silicone and/or hydrocarbon deposition and/or from the preflight contaminant overlayer.
Table 3. XPS Data for Carbon Fiber/Aliminum Alloy Composites
Surface Mole %, Normalizedsml & MK O i• N a E a P_ a N &n Q
AL3-3,LeadingEdge Exposed 0.4 nds 65 29 6 tr tr ids nds tr nds dnd nrids nds
Backside 0.2 rid 65 28 4 2 nd tr tr tr nd 0.2 0.1 tr tr
AL5-11,TrailingEdge Exposed 0.7 nds 59 23 13 3 0.1 rids 0.3 0.2 nds 0.2 0.4 0.1 ndsBackside 11 2 51 7 20 3 0.7 0.3 0.8 0.3 0.5 2 1 0.2 0.1
AL5-13, Flight Control Side 1 5 0.8 43 11 37 0.7 0.2 0.3 0.6 0.4 0.2 0.3 1 0.2 trSide2 3 0.5 41 11 40 1 0.3 0.2 0.3 0.4 0.1 0.3 2 0.2 tr
AL3-14, Lab Control Side l 9 0.8 35 2 49 1 0.2 0.3 0.1 0.3 tr 0.4 2 nd nds
Side2 8 1 35 3 49 1 0.2 0.3 0.1 0.2 0.3 0.3 2 nd nds
tr = trace (<0.1)nd = not detectednds = not detected survey scan; no high resolution scan run
9

Aluminum was detected as the oxide, A120 3, on all sample surfaces, as would be expected for air-exposed alloy. It is possible that postflight air oxidation could mask on-flight changes. Only thepredominant chemical state of the alloy surface could be detected in the presence of the contaminantoverlayer. The weak Al signal (<1%) on the exposed flight surfaces implies a contaminant coverage at leastcomparable to the depth probed by XPS, 50 to 100 AL In the case of noncontinuous or nonuniformcoverage, the average thickness of the contaminant overlayer could be substantially greater. Stronger Alsignals (3 to 11%) on the control and trailing edge backside surfaces indicate relatively lower contaminantthickness/coverage.
The XPS data for the carbon fiber/organic matrix composites are shown in Table 4. The composites weredesignated as A, B, and C, and had been fabricated with differences in the matrix. The "L" and "r" prefixesin Table 4 indicates leading and trailing edge, respectively. No laboratory control samples were availablefor these samples, and the sample backsides were used as the flight controls. These cafrbo/poly(arylacetylene) (PAA) materials were under development at The Aerospace Corporation in 1984 asreplacements for more traditional composites such as carbon/epoxy. The exposed leading edge surfaceswere visibly eroded. SEM and optical microscopy showed the erosion to be irregular to a depth of about 5mils.1 The erosion morphology was dominated by crevasses parallel to the fibers, with triangular crosssections. The edges of the crevasses were well-defined, and penetrated through both matrix and fibers. Theexposed trailing edge samples and sample backsides exhibited no physical appearance changes due toexposure.
Table 4. XPS Data for LDEF Fiber/Organic Matrix Composites
Surface Mole %, Normalized
Imaged? . Q I Ni E Q u Zn Ni Sn Na EL-A Exposed Yes 45 42 10 2 0.6 0.3
Exposed No 44 44 8 1 0.4 0.5 tr 2 0.3Backside No 71 20 2 2 3 0.1 0.1 1 tr
T-A Exposed No 51 36 6 2 3 tr 0.1 3 0.2 0.1Backside No 66 26 2 1 3 0.2 0.1 1
L-B Exposed Yes 17 59 19 0.6 nd 0.3 0.1 2 tr 1 nd 0.3Backside Yes 59 31 3 2 2 0.2 0.2 2 nd 1 nd
T-B Exposed Yes 45 23 4 0.9 25 0.1 0.1 1 0.1 0.1Exposed No 46 27 3 1 19 0.1 0.2 2 0.2 1Backside Yes 70 22 2 1 3 0.1 0.2 0.7 nd 0.2 nd
L-C Exposed Yes 61 31 3 3 0.1 0.5 nd 0.3 nd 0.4 0.3 0.6Backside Yes 67 23 4 2 3 0.1 0.2 2 nd nd 0.1 nd
T-C Exposed Yes 47 39 7 2 0.4 0.2 0.4 5 0.4 tr 0.1 ndBackside Yes 65 24 4 1 0.3 nd 0.3 1 0.2 tr nd nd
Release No 39 4 0.7 56Cloth
tr =raCend = not ( itected in elemental scanblank = not detected in survey scan and no elemental scan acquired
10

Comparison of Si concentration on leading and trailing edge surfaces showed a much broader rangeof values on the leading edge: 3 to 19% Si on the leading vs. 4 to 7% on the trailing edge. A comparisonof the Si concentration on pairs of leading and tailing edge composites gave the widely varied ratios of 1.7,4.8, and 0.4. Si contamination was highest on sample L-B, which had lower erosion than L-A and L-C.Composite B had the lowest resin content of the three: 22% by weight compared to 37% and 33% forcomposites A and C, respectively. It is unknown if the surfa contamination plays a role in erosioncrevasse initiation and enlargement. Si concentration on the sample backsides ranged froma 2 to 4%. Siratios for exposed leading edge surfaces to their backsides were 5.0,6.3, and 0.8. Si ratios for exposedtrailing edge surfaces to their backsides were 3.0, 2.0, and 1.8. The predominant chemical state of Sidetected was SiO2 on all of the exposed surfaces, both leading and nailing edges. The Si detected on thesamples backsides was predominantly from silicone or mixed siliconelsilicate/ silica. The lack oflaboratory controls prevents conclusions about changes in the composite surface chemistry and about thewide range of minor contaminants, including N, F, S, a, Cu, Zn, Ni, Sn, Na, and P. One surface had 25%F; release cloth used in fabrication is the most likely source of fluorocarbon tamination. It is likely thatpreflight contamnination is significant as a source of minor contaminants.
The XPS data for S13GLO paint are shown in Table 5. There were no flight control or backsidesurfaces, nor were laboratory controls maintained. A laboratory reference was prepared for comparisonfrom a current batch of S13GLO. Visible changes were seen in the flight surfaces. The trailing edgesurfaces had brown discoloration, with some lighter lines and spots. Little discoloration was observed onthe leading edge surfaces. Interpretation of surface contamination was complicated because the binder ismethyl silicone, and by the lack of a same-batch laboratory control. On all flight exposed surfaces, the Csignal decreased and the 0 signal increased, relative to Si. The Si2p binding energy and 0 to Siconcentration ratio changed from silicone to SiO2 on leading and trailing edge surfaces. Exposure to UVradiation and atomic oxygen in the space environment caused silicone degradation, with resulting formationof SiO2 and loss of carbon through volatiles. This investigation was inconclusive on the question ofsilicone binder decomposition vs. silicone contaminants deposition/decomposition as the source ofmeasured surface Si. It was observed that the leading edge surfaces had greater loss of carbon than trailingedge surfaces. The SEM analysis was inconclusive on whether a significant amount of binder was lostfrom leading edge surfaces due to atomic oxygen erosion. K and Zn from the pigment was detected on allflight samples, but not on the reference. This may indicate some binder loss, but it may also be due to adifference between batches of S13GLO.
Table 5. XPS Data for S13GLO Paint
Surface Mole % (Normalized)
S13GLO Paint Sample _C Q Si K 7i N S CI Na F
Reference 44 30 26 0.2 nd nd nd nd nd nd
L31V-18-17-1 Leading 12 56 27 1 0.5 2 0.3 0.5 0.3 0.1
L31V-18-18-2 Leading 13 56 27 1 0.5 2 0.2 0.5 0.3 0.1
T31V-18-17 Trailing 28 46 21 0.8 0.3 2 0.4 0.4 0.7 0.5
T31V-18-18 Trailing 27 47 21 1 0.2 2 0.4 0.4 0.8 0.4
11

The XPS data for the QCM crystals are shown in Table 6. The reference crystals served as flightcontrol samples for the sense crystals. Laboratory control samples have not been made available. Theflight surfaces were not visibly altered by space environment exposure. The QCMs were disassembled atQCM research and all the crystals were cleaned in acetone at that time, before delivery to The AerospaceCorporation for analysis. Solvent washing can remove some surface contaminants and leave new residues.It is possible that these residues explain the observation that most of the crystal surfaces were contaminatedwith > 50% carbon. SEM/EDS analysis showed the thin 150i top layers to still be present on all thecrystals. Thus, the low signals for In, Zn, and AL, < 1.5% for all crystal surfaces, indicate averagecontamination coverage comparable to the depth of analysis. Si coi tion was detected on all but onesurface, a reference crystal. The Si surface contamination was higher on the leading edge surfaces relativeto the trailing edge surfaces for both sense and reference crystals, but was highest for the leading edge sensecrystals at 10 and 23%. The Si concentration leading edge/trailing edge ratio for the flight exposed sensecrystals was 4 for the passive QCMs and 15 for the active QCMs. The predominant Si species on bothleading edge exposed surfaces was SiO 2. On all other crystal surfaces, Si was detected as silicone or a mixof silicone/silicatelsilica. Some of the surface contamination observed on the crystal surfaces may be due toother components of the QCMs, such as Sn and Pb from solder, or N and Ag from conductive epoxy.
Table 6. XPS Data for QCM Contamination Monitors
Surface Mole %, Nomalized
QCM Crystal Top Q2 0 Sin 3A za S Eb E Na X a Al AgLayer
7P 329, Active I Sense In203 17 58 23 0.7 02 nd 0.1 nd t 03 0.8 tr nd ndLeading Edge 2 Refence In203 53 31 1.9 6.4 1.0 0.1 0.1 0.5 0.1 1.0 4.5 0.2 nd nd
TP 330, Passive 3 Sense ZnS 48 35 10 nd 0.2 0.9 0.5 0.1 w 0.4 3.5 0.1 1.4 nd
Leading Edge 4 Reference ZnS 61 23 1.0 nd 0.2 2.0 5.5 0.3 tr 0.7 4.7 OA rid 1.2
TP 318, Active 5 Sense In203 68 25 1.5 nd 0.3 nd 0.1 0.3 nd 0.1 4.7 0.2 0.4 nd
Trailing Edge 6 Rdeeence In203 65 24 0.2 23 0.7 0.1 0.2 0.4 nd 0.1 63 0.1 nd nd
TP 353, Passive 7 Sense ZnS 67 25 2.3 nd 0.4 0.1 0.1 0.4 nd 0.1 4.5 0.3 nd nd
Trailing Edge 8 Reference ZnS 68 20 nd nd 0.3 1.4 3.9 0.3 tr 0.3 4.1 0.3 nd 0.6
tr=trae (<O.i)ad = inot detected
1. Codsin
An overview of the XPS analyses of LDEF exposed composite, paint, and QCM crystal surfacesshows their surface contamination to be nonuniform and complex. Interpretation of the data is hindered bythe uncertainty of preflight and postflight contaminants, and by the lack of comparable laboratory and flightcontrols for each type of material. However, the following observations are consistent for all of thesesamples. Silicones were a major contributor to the accumulated molecular film. The predominant surface
12

species of Si was identified as SiO2 on almost all of the exposed flight surfaces, and as silicone or a mix ofsilicone/silicate/ilica on flight controls including backside surfaces. It is thought that UV and atomicoxygen exposure causes decomposition of surface-deposited silicones, with SiO2 as one of the products.For most pairs of samples, the Si contamination level was higher on the leading edge surface than on thetrailing edge surface. Measured Si concentration leading edge/taling edge ratios varied from 0.4 to 15,with a median of about 1.5 and an average of about 4. Atmospheric backscatter could play a major role inenhancing non-line-of-sight deposition of outgassed species onto the leading edge exposed suriaces.
It was not possible to use the XPS data to distinguish hydrocarbons or other organic speciesdeposited during flight from the preflight, postflight, and substrate sources of surface carbon. The relativesurface carbon concntration is generally bigher on the trailing edge exposed surfaces than on the leadingedge surfaces. There could be significant contributions to this carbon coverage from preflight and/orpostflight contamination (available controls indicate that most samples have only minor Si preflightcontamination). It is also possible that atomic oxygen reactions on the leading edge result in greatvolatilization of the carbon component of the deposited silicones, effectively "thinning" the leading edgedeposited overlayer.
It was difficult to assess changes in the surface chemical states of these samples because of theirtendency to oxidize and hydrate in earth environment. Preflight and postflight surface chemical state coulddiffer from on-flight condition. The flight control samples, including backsides, have accumulated somecontaminaio. This - varied significantly in concentration from one control surface to thenext, but on average was significantly thinner than on space environment exposed surfaces. Lowercontaminant concenraons and higher substrate signals from the flight control surfaces are both consistentwith this conclusion. Element signals from the substte were weak, but were detected on every flightexposed surface where it was possible to differentiate between contaminant film and substrate components.This would be consistent with a contaminant film that has an average thickness of 50 to 100k Thecontamiant overlayer is probably patchy, with significant areas covered by less than 100 .. and other areasby greater than 100 A of molecuilr film. No pattern of signficant difference was noted between substratesignals for leading edge and trailing edge exposed surfaces. Thus, although the Si concentration datasuggests greater on-flight deposition of contaminants on the leading edge surfaces, the substrate signal datashows that the XPS data is not conclusive on the relative thicknesses of flight-deposited contamination forleading and trailing edge surfaces.
B. CONTAMINATION ON POLYMER SURFACES
Polymeric materials on LDEF were represented in this study by exposed surfaces of Kapton andfluorinated ethylene (FEP) Teflon from Ag/FEP thermal control blankets. In general, polymer surfaces areclean and reproducible and stable in the earth environment. This simplified postflight analysis of LDEFexposed polymers, and provided a good opportunity to observe carbon co nination and minor
minants deposited on-flight. Good controls were available for the polymers, and preflightcomplications were found to be minimal for FEP and'Kapton. Changes in the surface chemical state of thepolymer surfaces were readily observed. These have been attribtUed to space environment expsure,though postflight exposures to air may have as-yet undetermined effects on damaged polymer surfaces.
A variety of visible changes were observed in the Ag/PEP surfaces on both leading and traling edgesamples. The exposed leading edge blanket surfaces appeared uniformly foggy or clouded. The exposed
13

trailing edge blanket FEP surfaces were "patter" in some areas with alternating transparent and cloudedbands. Clouded areas were observed on many blanket edges, particularly near the bends between exposedand masked material ("transition zone"). Areas of orange/brown discoloration were notable near some ofthe keyhole-shaped vent slots along the edges of the Ag/PEP blankets.
The SEM and XPS results 2 for the exposed Ag/PE surfaces are summarized in Table 7. Theleading edge samples, from row 7 to 11, all had roughened surfaces typical of high velocity atomic oxygenerosion of PEP, as seen in Fig. I for "EP exposed on C1I compared to a featureless control surface. Thehighly textured surfaces gave rise to diffue light scattering and the consequent cloudy appearance. TheXPS data for the control surface showed carbon and fluormine only. The XPS analysis of the exposedsurfaces showed that the surface composition of the PEP remaining after the erosion was indg shablein carbon and fluorine composition from the control, with trace amounts of some (Si, N, S,and CI) and measurable oxygen present. This oxygen could be from the atomic oxygen interaction or fromwater adsoption from the atmosphere after retrieval. Water adsorption could be enhanced on the erosion-rouhened surfaces which have much higher surface area than the control. The surface chemistry of theseleading edge samples was identical to clean FEP Teflon, judged by a comparison of the F:C mole ratio andthe Cls peak shape. The Cls spectrnm from the D7 blanket surface is shown in Fig. 2a; curve-fittingrevealed the major CF 2 peak at 292 eV and moderate CF and CF 3 peaks (app-i ely 10% each) at 289.5eV and 294 eV, respectively. This matched the spectrum predicted for FEP with an approximateethylene/prpylene comonomr blend of 90%/10% It appeared that deposited contaminants and damagedpolymer were both removed during atomic oxygen erosion.
Table 7. Summary of SEM and XPS Results
LDEF Row SEM Morphology of Exposed Bay Surface Si% Surface 0% CIs EnvelopeFEP Surface
I Smooth; particulate contamination D 0.2 2 Degraded IEP2 A 0.7 6 Degraded FEP2 M(Boeing) 2-8 11-32 Contamination2 Puckered texture; more distinct in F(NASA) 8-19 30-51 Contamination
cloudy bands
3 (E)4 Puce=d and winkled textures in F 0.2-7 4-31 Contamination
bands4 A 0.1 3 Degraded FEP5 Slighty lumpy (B) B, C, 0.1 3-5 Degraded PEP6 Some ameas of puckered texture C <0.1 1-2 Degraded FEP7 Eroded, sharp pinnacles (B) B, D <0.1 0.6 Clean PEP8 Eroded, sharp pinnacles C <0.1 0.6 Clean IEP9 (LE) D, F ).1-0.8 0.8 Clean FEP10 Eroded, rounded peaks A 0.1 0.6 Clean PEP11 Eroded, sharp pinnacles (C) CD <0.1 0.4 Clean FEP
12Control PEP Smooth, featureless <0.1 <0.1 Clean PEP
14

o w w ozz
ofE0 -- -O__ULt0 I;
•E co -a0ca 0
UL~) 0w•r;
"'al
Imo
15

bro azI
S6 -D7: CLEAN FEPo0 2
278 280 282 284 286 288. 290:.292 294 296.BINDING ENERGY/eV
f2 4500w bz 13 5: DEGRADED FEP
25005001- 150 . , ,.. - I I I I I I •
278 280 282 284 286 288 290 292 294 296BINDING ENERGY/eV
5500 c
S)3500 F4 CNTAMINATD FPp 1500 F
278 280 282 284 286 288 290 292 294 296BINDING ENERGY/eV
S16 dF2: HEAVILY CONTAMINATED
0 .8 -FEP
2 1 1 -I- I 1278 280 282 284 286 288 290 292 294 296
BINDING ENERGY/eV
Pig. 2. XPS spectrum of the Cls peak; (a) of the D7 blanket surface represenative of clean FEP; (b) of theB5 blanket surface-representative of degraded PEP.; (c) of the F4 blanket surfa npresentative ofcontaminated PEP; (d) of the F2 blanket surface-representative of heavily contaminated FEP.
16

The FEP surfaces exposed on the trailing edge of LDEF underwent changes which were observedboth by SEM and XPS. The surfaces lost the smooth, featureless texture of the unexposed FEP, evenwhen the amount of coamnation remained low, as indicated by low silicon - on SEM showedan intriguing variety of new surface textures. Within Short distance on some tramlg edge sample boththe surface morphology and surface contaminaion levels were observed to change dramatically, as seen inFig. 3. The FEP surfaces nearest to the trailing edge row 3 were modrately to heavily contaminated andthe blanket surface areas which appear fogged or cloudy on the trailing edge had becom sufflcienly diffuseto change visibly. 1The conmi, was very nomnunform It is curwely not cea if any causrelationship exists between observed morphology type and surface contamimnton build-up. t is possiblethat some morphologies will have a higher probability of trapping or adsorbing outgassed or baockcatteredspecies, thereby leading to greater surface contamination buildup. Further from row 3, FEP surfacesshowed little textr development and no sigaftant o except , posil fromxposu fIt is possible that low atomic oxygen exposure on rows 1, 5, and 6 was sufficient to remove the
contaminant overlayer.
XPS data divided the trailing edge surfaces into two categories. The first was characteized by lowcontamination levels (Si < 1%) and a CIs spectrmn, as in Fig. 2b, that differs significantly from that ofclean FEP, but does not have a major peak at 285 eV. The second category was characterind by moderateto high levels of Surface cm inatio (Si, O, C, N, and S, and som imes Cl) and a Cls spectrumdominated by a peak at 285 eV, as seen in Pigs. 2c and d. Contaminant carbon was distnuishable fromFIP and degraded FEP carbon by binding energy, and was measured at _ 20% of the total urfacecomposition. The Cl peak at 285 eV is piedom InMy due to C-C bonds, and is thotoht to build up onthe railing edge sufaces from decomp= products of oupgassed silicom and hydrocarbons. TIh Clsspectrum in Fig. 2b arises from degradation of the PEP mrface, for which the ClI spectni is Shown inFig. 2a. Curve-fiting shows that the decrease in imuity Of the CF2 peak at 292 eV is accoMpaNie bymajor increases in intensity at 294 eV, 289.5 eV, and 287 eV, assigned to CF3, CF, and C-(CFn)4,respectively. These changes are conmistent with dmampe to die crb.m beckbone of die Teflon polymerresulting in molecular weight degmdation, new chain teramMtIN0u, brmtk,. and crosslinking through freeradical reactions. The solar ultaviolet (UV) radisiom c mae ofdie LDW Sodae is thou to havecaused this FEP surface degradation. The PEP mrams were aso exposed to the stress of about 34,000theral cycles, but the maximum temperatures calcdaed for A/W bleketa on ID aF we 1s= ta OPCand not sufficient to break chemical bon 3 Expomm of PlP to dte "S x-my omrce for several hoursinduced similar shifts in the Cls spectrum; almost all o die FIP ClIs spectra used for curve-fitting in thisstudy were acquired duinng the first mimt of sample expmn- to the x-ray source to minimize Surfacedegradation from the analysis itsel. A recPt study of the desradation of polyeta-fuorehylene (PTME)Teflon by 3 keV electrons showed very similar XPS CI spcra changes to those se in Fig. 2b as afunctio of electron irradiaio and Subsequent heaftig to drive Off volatll 4. Degradation ofldie FIFE wasattributed to the type of damage described above.
Th predomia chemical state of Si idenfW on the awling edge PEP surface was Si 2. Siconcentrations were measured to be <20 mole %, indicating up to about 60% as the oxi& Thecontaminant film was definitely nonuiiorm over large am , and was probably patchy on a submicronscale. Significant areas must be covered by < 100 A of deposited cohtumnation, because fluorocarbon wasdetected on each FEP surface analyzed. The damaged FEP layer is probably *icker than the depth ofanay•sis.
17

IIi
tli
ii
18

The AFEP thetmal control blanket edges were contaminated, in many cases Mare than the exposedsurfaces. Thereore, the masked edges did not provide good flight "control" samples. The transition zonefrn the exposed surface to the masked edge was paticularly prone to contamination build-up. This wasprobably the result of the combination of high out-gas flux and radiation. Th blankets were bent downaroumd the edges of the tray so that the blanket edges were not rigorously shielded from radiation SEMimages from one tranition zomn, se in Fig. 4, showed that during atomic oxygen eroion of the FEPsurface, undercutting of the contamination and damaged polymer layer played a role in fth development ofa clean, bighly textured surface. Area A, at the periphey of the exposed surface, had a clmacteristic atomicoxygen erosion paen. Area D, closer to the blanket edge, was a suface with contamination coverage andUV degraded FEP. Area C, in the censer of the transition zone, showed undercutting of the con-aminationand damaged polymer layer by atomic oxygen erosion. The development of subricron particles of SiO 2was observed on some edge surfaces by SEM/EDS, as seen in Fig. 5. Such particle development was notdetected on any of the other samples included in this study. Areas of orangedbownr wereobserved on some Ag/PEP edge surfaces near keyhole-shaped vent slots in the blanket edges. XPSanalysis showed these stains to be high in carbon, sulfur, and nitrogen relative to other contnanated are.Th son= of c was not identified but it appears to have contained an amino/amidefluctiouhty.
Only two samples of Kapam, from leading edge F9, have been analyzed to date, but the resultscomplemnted those for leading edge PEP Teflon. SM analysis showed the leading edge Kapton hadheavy atom•i oxygen erosion. Contamina build-up, as seen in Table 8, was low due to that erosio,totalling < 4 surface mole % excluding oxygen. The observed surface oxygen concentration increases wereassociated with these cotminan as well as with polymer oxidation. A 5% increase in oxygem-containingsurface functionalities was measured by Cls spectrum curve-fitting.
Table 8. XPS Data for Kapton
Surface Mole %, Normalized
Kapton Sample C IN Si hk S K E E
Reference 71 21 7A 0.2 nd 0.1 nd nd nd
Exposed #1 62 28 6.8 2 1 0.4 0.3 0.1 Ir
Exposed #2 64 27 6.8 1 1 0.3 0.2 0.1 ir
19

cc4
LU)L
cicc<1
C2
-- -- -- -
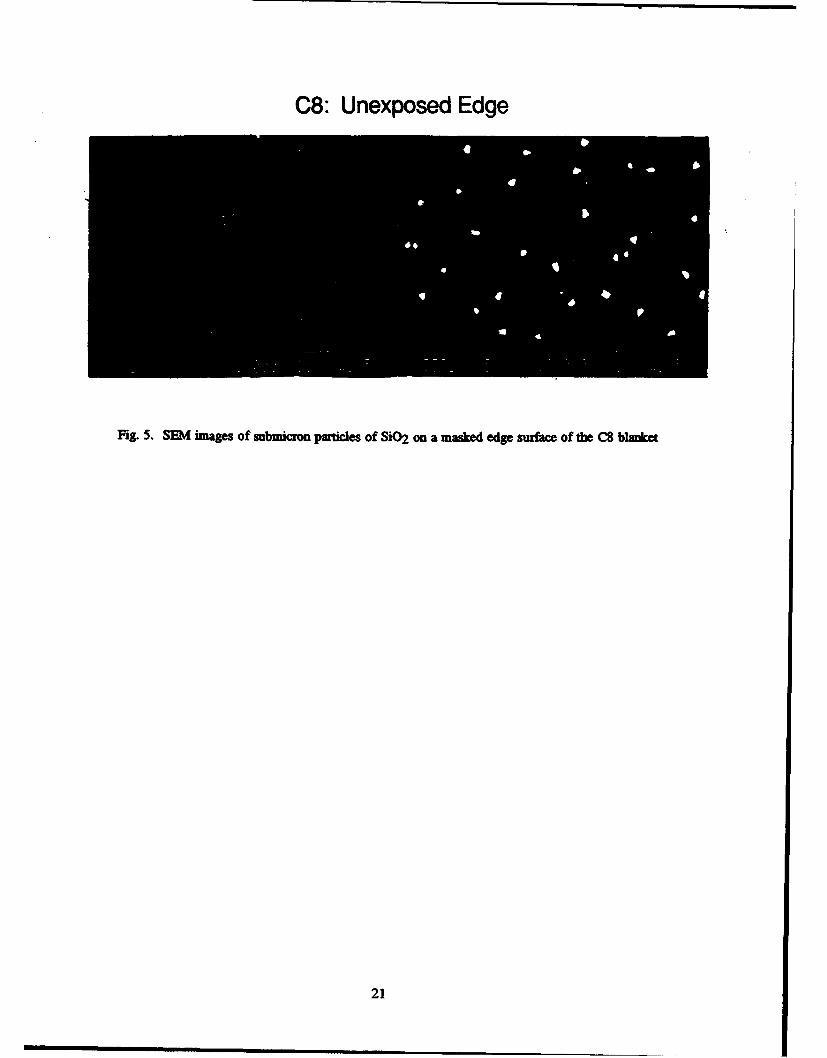
C8: Unexposed Edge
Fig. 5. SEM images of submicron particles of SiO2 on a masked edge surface of the C8 blanket
21

IV. SUMMARY
XPS was used to study the average surface composition and chemistry of a variety of LDEF exposedmaterials. XPS gives excellent surface sensitivity and element detection for contaminant analysis, withminimal sample alteration. SiO 2 and other decomposition products of silicones exposed to the spaceenvironment were identified as the predominant surface contminant for every type and location of materialDeposited carbon residues were distinguishable from preflight - on Ag/FE surfaces. Thiscarbon is thought to come from silicones decomposiion and organic contaminants, including the source ofthe orange/brown stains which had increased carbon, sulfur, and nitrogen cons relative to otherdeposits. Most of the minor (< 1 atom %) and occasionally observed contaminants on the ILDEF exposedsurfaces were attributed primarily to preflight contamination. This clearly demonstrated the need tomaintain good laboratory controls during the study of space vironmental effects on materials.
The flight controls (no direct line of sight to the space environment) were found to have accumulatedsome contamination, but generally less than exposed surfaces. The polymeric materials studied had lowcontamination on the leading edge surfaces due to atomic oxygen erosion. All ocher materials had higheraverage Si contamin on leading edge than on trailing edge surfaces, probably due to the return fluxassociated with atmospherc: backscatter. For individual pairs of samples, measured Si concentrationleading e /trailing edge ratios varied from 0.4 to 15, with a median of about 1.5 and an average of about4. Element signals from some substrates were weak, but were detected on every flight exposed surfacewhere it was possible to differentiate between coamant film and substrate components. This would beconsistent with a conmdnant film that has an average thickness of 50 to 100 k The contaminant overlayeris probably patchy, with significant areas covered by less than 100 A, and other areas by greater than 100 Aof molecular film No pattern of significant difference was noted between the intensity of substrate signalsfor leading edge and trailing edge exposed.surfaces. Thus, although the Si concentration data suggestedgreater on-flight deposition of contaminants on the leading edge surfaces, the XPS analysis was notconclusive on the relative total thicknesses of flight-deposited contamination for leading and trailing edgesurfaces.
23

REFERENCES
1. Mallon, J. J., Uht, J. C., and Hemminger, C. S., "Surface Analyses of Composites Exposed to theSpace Environment on LDEF." Submitted for publication, 1991.
2. Hemminger, C. S., Stuckey, W. K., and Uht, J. C., "Space Enviroamental Effects on Silvered TeflonThermal Suaces." First LDEF Post-Retrieval Symposium, June 1991. See also NASA CP3134, 1992.
3. Befrios, W. M. and Sampair, T. R., "LDEF Post Flight Thermal Analysis." LDEF Science Office,NASA Langley Research Center.
4. Wheeler, D. R. and Pepper, S. V., "X-ray Photoelectron and Mass Spectroscopic Study of ElecironIradiation and Thermal Stability of Polytetraluowrethylene." J. Vac. Sci. Technol. Vol AS, No. 6,Nov/Dec 1990, pp. 4046-4056.
25

TECHNOLOGY OPERATIONS
The Aerospace Corporation functions as an "archi c-engineer" for national securityprograms, specializing in advanced military space systems. The Corporation's TechnologyOperations supports the effective and timely development and operation of national securitysystems through scientific research and the application of advanced technology. Vital to thesuccess of the Corporation is the technical staffs wide-ranging expertise and its ability to stayabreast of new technological developments and program support issues associated with rapidlyevolving space systems. Contributing capabilities are provided by these individual Technology
Electronics Technology Center: Microelectronics, solid-state device physics,VLSI reliability, compound semiconductors, radiation hardening, data storagetechnologies, infrared detector devices and testing; electro-optics, quantum electronics,solid-state lasers, optical propagation and communications; cw and pulsed chemicallaser development, optical resonators, beam control, atmospheric propagation, andlaser effects and countermeasures; atomic frequency standards, applied laserspectroscopy, laser chemistry, laser optoelectronics, phase conjugation and coherentimaging, solar cell physics, battery electrochemistry, battery testing and evaluation.
Mechanics and Materials Technology Center: Evaluation and characterizationof new materials: metals, alloys, ceramics, polymers and their composites, and newforms of carbon; development and analysis of thin films and deposition techniques;nondestructive evaluation, component failure analysis and reliability; fracturemechanics and suess corrosion; development and evaluation of hardened components;analysis and evaluation of materials at cryogenic and elevated temperatures; launchvehicle and reentry fluid mechanics, heat transfer and flight dynamics; chemical andelectric propulsion; spacecraft structural mechanics, spacecraft survivability andvulnerability assessment; contamination, thermal and structural control; hightemperature thermomechanics, gas kinetics and radiation; lubrication and surfacephenomena.
Space and Environment Technology Center: Magnetospheric, auroral andcosmic ray physics, wave-particle interactions, magnetospheric plasma waves;atmospheric and ionospheric physics, density and composition of the upperatmosphere, remote sensing using atmospheric radiation; solar physics, infraredastronomy, infrared signature analysis; effects of solar activity, magnetic storms andnuclear explosions on the earth's atmosphere, ionosphere and magnetosphere; effectsof electromagnetic and particulate radiations on space systems; space instrumentation;propellant chemistry, chemical dynamics, environmental chemistry, trace detection;atmospheric chemical reactions, atmospheric optics, light scattering, state-specificchemical reactions and radiative signatures of missile plumes, and sensor out-of-field-of-view rejection.