nea annual report bk
TRANSCRIPT

1Environmental Protection Division
Annual Report 2005
CONTENTS
Highlights of 2005 2
Introduction 4
Environmental Planning and 7Building Development Control
Pollution Control 11
Environmental Monitoring 21
Resource Conservation 29
International Cooperation 41
Appendices 47
FOREWORDThe National Environment Agency (NEA) was established on 1 July 2002.
The NEA took over the operational functions of environmental protection
and public health from then Ministry of the Environment (ENV) so that
ENV could focus on strategic and policy planning. For better synergy,
the Meteorological Services Department, which used to be part of the
Ministry of Transport was integrated into NEA.
As a statutory board, NEA has greater administrative autonomy and
flexibility, making it more nimble and innovative in the discharge of its
responsibilities. NEA is also better placed to promote ownership of the
environment among the people, private and public (3P) sectors.
Within NEA, the Environmental Protection Division (EPD)’s role is to ensure
that Singaporeans continue to enjoy a quality living environment for
generations to come. It will continue to implement programmes to monitor,
reduce and prevent environmental pollution. In addition, it will spearhead
new initiatives to enhance sustainable development. Its key goals in
resource conservation will include waste minimisation, recycling and
energy efficiency.
This is the fourth Annual Report of EPD of NEA and it outlines the
programmes implemented and targets achieved in 2005.

2Environmental Protection Division Annual Report 2005
Highlights 2005
During the year, the levels of major pollutants
in the ambient air stayed within established
international standards and the air quality remained
good. This could be attributed to more power
stations and industries switching from fuel oil
to natural gas, greater co-regulation and stringent
enforcement action.
The water quality of inland and coastal waters
remained good and supported aquatic life.
With effect from 16 February 2005, NEA
handed over the control of 18 flammable
substance to Singapore Civil Defence Force
(SCDF) under the Fire Safety (Petroleum and
Flammable Materials) Regulations 2005.
Singapore acceded to the Stockholm Convention
on Persistent Organic Pollutants and the Rotterdam
Convention on the ‘Prior Informed Consent’
Procedure for Certain Hazardous Chemicals and
Pesticides in International Trade on 24 May 2005.
The two conventions became effective in Singapore
on 22 August 2005 (i.e. the 90th day after the date
of deposit of the instruments).
In March 2004, Minister for the Environment and
Water Resources announced the implementation of
Euro IV emission standard for new diesel vehicles
that would take effect from October 2006 to control
emission of Particulate Matter less than 2.5 microns
in size (PM2.5) from these vehicles. Ultra Low
Sulphur Diesel (ULSD) was mandated in December
2005 to pave the way for the smooth implementation
of Euro IV emission standard.
Waste recycling is a key thrust of the NEA’s strategy
to reduce waste. Participation rate by households in
the National Recycling Programme increased from
54% in 2004 to 56% (about 1 in 2 households)
in 2005. The percentage of condominiums with
waste recycling programmes increased from 24%
2Environmental Protection Division Annual Report 2005
in 2004 to 43% in 2005. Schools participating
in the Recycling Corner programme increased
from 50% in 2004 to 78% in 2005. The number
of recycling bins in public places increased from
5,100 in 2004 to 5,700 in 2005.
Following the inaugural Recycling Day 2004,
the NEA together with the People’s Association
(PA), Singapore Environment Council (SEC),
Waste Management and Recycling Association
of Singapore (WMRAS) in partnership with the
public waste collectors (PWCs), Altvater Jakob
Pte Ltd, FME Onyx Pte Ltd, SembWaste Pte Ltd,
and Dunman Secondary School organised the
second Recycling Day on 17 September 2005.
A unit was set up in RCD to formulate policies
and strategies on climate change issues. Several
energy efficiency and clean/renewable energy
initiatives were launched under the auspices
of the National Energy Efficiency Committee.
A $10 million Energy Efficiency Improvement
Assistance Scheme was launched in April 2005 as
an incentive for manufacturers and building owners
to carry out energy audits to improve energy effi ciency.
The Energy Smart Office Award, which was jointly
developed by NEA and the National University
of Singapore (NUS) to promote energy efficient
buildings, was launched in December 2005. A public
sector project was carried out to assist public
sector agencies to call tenders for the provision of
energy saving performance contracting services.
An accreditation scheme for energy services
companies (ESCOs) was also launched in April 2005
to serve as independent assessors for the Energy
Smart Office as well as to provide energy services
for the Energy Efficiency Improvement Assistance
Scheme (EASe).
The tender to provide refuse incineration services
under the Design-Build-Own and Operate (DBOO)
Highlights 2005
3Environmental Protection Division
Annual Report 2005 3Environmental Protection Division
Annual Report 2005
scheme was called on 11 March 2005 and closed on 8
September 2005. The tender attracted bids from pre-
qualified international bidders with good track
record in the incineration business. Keppel Seghers
Engineering (S) Pte Ltd was eventually awarded the
contract on 14 November 2005. The Keppel Seghers
Tuas Waste-To-Energy Plant is expected to be
ready for operation in 2009 to replace the Ulu
Pandan Incineration Plant. The plant will provide
NEA with an incineration capacity of 800 tonnes
per day for a 25-year period. This is NEA’s first
Public-Private-Partnership (PPP) project. The move
to open up the incineration industry to the private
sector is in line with NEA’s aim of becoming more
pro-business and service-oriented by leveraging
on the strengths of both the public and private
sectors.
In-line with NEA’s plans to restructure the refuse
incineration industry, an IP Industry Regulatory Unit
was set up under Waste Management Department
in May 2005. The unit is responsible for regulating
the incineration plant industry and planning
adequate waste incineration capacity to meet the
waste incineration demand.
Tuas Incineration Plant obtained ISO 14001
certification on 6 July 2005. With this
certification, TIP joined the ranks of other ISO
14001 certified plants in Senoko and Tuas South
as well as the Tuas Marine Transfer Station/
Semakau Landfill. This certification bears testimony
to the comprehensive environmental management
systems and best practices that were put in place
by NEA at the refuse disposal facilities.
The launching of the Semakau Landfill for nature-
based recreational activities took place on 16 July
2005. Minister for the Environment and Water
Resources, Dr Yaacob Ibrahim was the Guest-of–
Honour. Members of the public can now enjoy the
beauty of the landfill, with its wide-open spaces
and natural grassland, mangrove and shoreline
habitats. For a start, bird watching, inter-tidal
biodiversity surveys and sport fishing would be
organised and conducted by Nature Society of
Singapore, Raffles Museum for Biodiversity
Research and Sport Fishing Association Singapore
respectively.
NEA also collaborated with the tertiary institutions
to conduct R&D to support NEA’s strategic
objectives. To date, 54 joint R&D projects have been
approved under the Memorandum Of Understanding
(MOU) with the Nanyang Technological University
(NTU) and the National University of Singapore
(NUS). Of these 42 have been completed. In 2005,
5 projects were approved under the MOU with
local universities NTU/NUS in areas of waste
recycling, clean energy and energy efficiency and
public health.
Under the Innovation for Environmental Sustainability
(IES) Fund, over $5 million were committed in
2005 to support seven projects in areas of waste
management and recycling, clean energy and energy
efficiency, and waste water treatment. Examples
of the new projects are, (i) the introduction of
mother-daughter compressed natural gas (CNG)
refuelling stations, and (ii) a new desalination
technology based on membrane distillation with
the potential to reduce production cost of water.
In 2005, NEA continued its job re-creation efforts.
Through the “1000 for 1000” initiative, NEA matched
701 jobs paying more than $1,000 a month in the
environmental sectors, focusing on 5 environmental
sectors, namely Hawker Centre Cleaning, Street
Cleaning, Waste Recycling, Pest Management and
Pollution Control.
Highlights 2005

4Environmental Protection Division Annual Report 2005
Introduction
Introduction
Singapore developed its industrial base and achieved
high economic growth within a short span of three
decades. In tandem with Singapore’s rapid economic
growth and industrialisation, programmes were
also implemented, at a very early stage, to protect
the environment.
The success of these environmental protection
programmes is evident today and Singapore has
an environment that compares favourably with the
best cities in the world. Levels of major pollutants
in the ambient air are within the United States
Environmental Protection Agency (USEPA) standard.
All inland waters in Singapore support aquatic life.
To ensure that rapid economic growth and
industrialisation would not be at the expense of
the environment, the Anti-Pollution Unit (APU)
and the Ministry of the Environment (ENV) were
formed in 1970 and 1972 respectively to protect
the environment. APU was subsequently merged
with ENV in 1986. ENV was renamed as the
Ministry of the Environment and Water Resources
(MEWR) and its operational functions were taken
over by its two statutory boards viz. the National
Environment Agency (NEA) and the Public Utilities
Board (PUB). The two statutory boards protected
the environment and environmental health by
planning, developing and operating sewerage,
drainage and solid waste disposal facilities,
controlling air and water pollution, hazardous
chemicals and toxic wastes, and providing
environmental public health services and public
health education. The Environmental Protection
Division (EPD) of NEA has been tasked to formulate
programmes and chart NEA’s course into the next
decade. Since 1 October 2003, EPD has taken on
new responsibilities and the departments in EPD
have been restructured to carry out the new
functions. These responsibilities include areas such
as international, regional and bilateral cooperation
and industry and manpower development.
EPD comprises the following departments:
a) Pollution Control Department (PCD)
b) Planning and Development Department (PDD)
c) Resource Conservation Department (RCD)
d) Waste Management Department (WMD)
The organisation chart of EPD is in Appendix 1.
PCD is tasked with the overall responsibility
for air, water and noise pollution control; and
hazardous substances, toxic waste control. It has the
responsibility of monitoring ambient air and inland
and coastal water quality. It is also responsible
for the formulation and implementation of joint
programmes on transboundary pollution with the
neighbouring countries. The organisation chart of
PCD is in Appendix 2.
4Environmental Protection Division Annual Report 2005

5Environmental Protection Division
Annual Report 2005
Introduction
for initiatives that speed up environmentally
sustainable applications and innovative proposals
that have the potential to create new capabilities
in environmental technologies, as well as to
develop the local environmental technology sector
and attract investors to Singapore. PDD develops,
and reviews environmental policies, standards &
strategies as well as vehicular emission control
programmes and green vehicle programmes. The
organisation chart of PDD is in Appendix 3.
RCD is responsible for promoting waste minimisation
and recycling in order to reduce the waste disposed
of at the incineration plants and landfill. It is also
responsible for promoting energy efficiency and the
use of clean energy to minimise the emissions of
carbon dioxide and air pollutants. The organisation
chart of RCD is in Appendix 4.
WMD is tasked with the responsibility for providing
refuse disposal services (incineration plants and
landfill) and for licensing general waste collectors,
regulating refuse collection for the domestic and
trade premises. It also provides technical assistance
to Environmental Health Department (EHD) and
Hawkers Department (HD) and vehicle maintenance
services to all departments in NEA. The organisation
chart of WMD is in Appendix 5.
PDD carries out research programmes jointly with
tertiary institutions and research organisations, such
as the National University of Singapore (NUS) and
the Nanyang Technological University (NTU), and
on an ad hoc basis, the polytechnics, to support
NEA’s strategic objective of enhancing the physical
and general environment in Singapore. To further
streamline the environmental planning functions
of NEA, the Central Building Plan Unit (CBPU)
of PCD was transferred to PDD on 1 October
2003 in exchange for the Environmental Monitoring
Assessment Unit. In addition, PDD assumed the
new roles of external cooperation (bilateral, regional
and international environmental issues) and industry
and manpower development (promoting markets
and jobs in the environmental management field,
in research, etc.). It also facilitates and coordinates
job re-creation efforts in NEA by liaising with
NEA departments and external partners such as
National Trades Union Congress (NTUC), Singapore
Work Development Agency (WDA), Community
Development Councils (CDCs), environmental
companies/associations, to create and redesign
jobs and match the jobs to Singaporeans. As
Secretariat for the Innovation for Environmental
Sustainability (IES) Fund, it also administers the IES
Fund, whose objectives are to provide sponsorship
5Environmental Protection Division
Annual Report 2005

6Environmental Protection Division Annual Report 2005

7Environmental Protection Division
Annual Report 2005
Environmental Planning and Building Development Control
1

8Environmental Protection Division Annual Report 2005
Environmental Planning and Building Development Control
Major Planning Proposals
During the year, CBPU evaluated the Quantitative
Risk Assessment (QRA) studies of 11 chemical plants.
The proposals were supported as they could comply
with the siting and technical requirements.
Consultation on Building Developments
Technical requirements on environmental matters
are imposed at the Building Plan (BP) stage so that
the proposals would be designed to comply with
environmental requirements and guidelines.
For industries, the building plans are checked at
the BP stage to ensure that the necessary pollution
control equipment and facilities are incorporated.
Upon completion of a project, the Qualified Person
(QP) applies to CBPU for clearance of either the
Temporary Occupation Permit (TOP) or the
Certificate of Statutory Completion (CSC).
When compliance with the imposed technical
requirements has been confirmed through site
inspections, CBPU issues TOP/CSC clearance on
behalf of the technical departments (Sewerage,
Drainage, Environmental Health and Pollution
Control Departments).
During the year, CBPU processed 6,698 building
plans and detailed plans, and issued 3,191 TOP/CSC
clearances.
Provision of Drainage and Sewerage
Interpretation Plans
CBPU provides drainage and sewerage information
for property transactions and building developments.
During the year, CBPU processed 26,793 applications
for Drainage Interpretation Plans and Sewerage
Interpretation Plans.
Environmental Land Use Planning
Environmental problems can be prevented through
proper land use planning and the imposition of
appropriate controls. NEA, therefore, adopts an
integrated approach in the planning control of new
developments. This is to ensure that environmental
considerations and factors are incorporated at
the land use planning, development control and
building control stages, so as to minimise pollution
and to mitigate pollution impact on surrounding
land use.
The Urban Redevelopment Authority (URA), which
is the land use planning authority in Singapore,
consults the Central Building Plan Unit (CBPU) of
the Planning and Development Department (PDD)
on land use planning issues. The JTC Corporation
(JTC), Housing & Development Board (HDB) and
private sector developers also consult CBPU on the
allocation of industrial premises.
CBPU assesses and evaluates the hazard and
pollution impacts of the proposed industries to
ensure that they do not pose unmanageable health
and safety hazards and pollution problems. A
proposed factory will only be allowed to be set up
if it is sited in an appropriate industrial estate and
can comply with pollution control requirements.
During the year, CBPU processed 5,372 plans for
residential and industrial developments. In addition,
CBPU processed 4,151 applications for allocation
of industries in JTC, HDB and private industrial
estates. A breakdown of residential and industrial
development plans and applications for allocation
of industrial premises processed by CBPU is in
Tables 1, 2 and 3.

9Environmental Protection Division
Annual Report 2005
Classification Total
Proposed Site for Public Housing Development 125
Proposed Site for Private Housing Development 1554
Proposed Site for Industrial Development 253(1)
Proposed Site for Flatted Factory Development 4
Proposed Extension/Retention of Use of Existing Premises 135
Proposed Use/Change of Use of Trade/Industrial Premises 324(44)
Proposals for Petrol Stations 12
Additions and Alterations 1520(1)
Miscellaneous 1445(9)
Total 5372(55)
Note: Figures in brackets represent the number of consultations not supported by CBPU.
Environmental Planning and Building Development Control
Table 1 Planning Consultations on Land Use
Table 2 Planning Consultations for Scheduled Premises
Scheduled Premises Total
Concrete/Cement works 5
Chemical works 11
Plants using scheduled oil-fi red boilers (steam generating capacity of 2300 kg or more per hour) 4
Storage of more than 100 tonnes of one or more chemicals 3
Abrasive blasting works 4
Total 27

10Environmental Protection Division Annual Report 2005
Table 3 Breakdown of Consultations on Factory Allocation
Note: Figures in brackets represent the number of consultations not supported by CBPU.
Environmental Planning and Building Development Control
Type of Industry Total
Engineering works 1387(14)
Shipbuilding/repairing 18
Food 247(4)
Timber-based products 231(1)
Paper products 9
Electrical and electronic products 141
Textile and garment 31(1)
Plastic 52
Printing and publishing 37
Jewellery, watch and clock 12
Building and construction 68
Concrete and cement 9
Chemical 195
Rubber processing and rubber products 2
Photograph and optical goods 3
Ferrous and non-ferrous metal works 57
Leather goods and footwear 14
Miscellaneous 1623(3)
Total 4151(23)
11Environmental Protection Division
Annual Report 2005
PollutionControl
2

12Environmental Protection Division Annual Report 2005
Air Pollution Control
Overview
The ambient air quality in Singapore remained
good during the year. The levels of the major
air pollutants monitored were within the acceptable
limits prescribed by the United States Environmental
Protection Agency (USEPA).
The Environmental Pollution Control Act and
its Regulations
Air pollution in Singapore is regulated under
the Environmental Pollution Control Act and its
Regulations. The Environmental Pollution Control
(Air Impurities) Regulations 2000, which came
into force on 1 January 2001, stipulate revised air
emission standards for air pollutants. The revised
standards will reduce the air emissions from
industries and ensure that our ambient air quality
continues to remain good. The standards are listed
in Appendix 6.
Industries, which have the potential to cause serious
air pollution, are classified as Scheduled Premises
under the Environmental Pollution Control Act.
The list of Scheduled Premises is in Appendix 7.
The owner or occupier of Scheduled Premises is
required to obtain a Licence from PCD before
commencement of operation. PCD grants the
Licence only after all pollution control requirements
have been complied with.
Compliance Testing And Checking At Factories
PCD carries out regular inspections on industrial
and non-industrial premises to ensure compliance
with pollution control requirements.
During the year, 20,525 inspections were
conducted on industrial premises (e.g. factories,
trade premises, etc) and 2,404 inspections on
non-industrial premises (e.g. farms, domestic
premises, etc.).
Under PCD’s source emission testing scheme,
industries are required to conduct source emission
tests to ensure that they monitor their emissions
regularly, and take remedial measures to comply
with the prescribed air emission standards. During
the year, 198 companies were required to conduct
source emission tests. Altogether, they conducted
a total of 883 tests comprising 291 isokinetic
tests and 592 tests on gaseous emission. Of these,
four failed the prescribed standards. Enforcement
action was taken against the offenders and
they were required to take remedial action to
comply with the prescribed standards.
During the year, PCD also conducted 523 fuel
analyses and smoke observations of chimneys.
Of these, one failed to comply with the prescribed
standards.
The offender was prosecuted and required to take
remedial action.
Air Pollution Control Equipment
Industries are required to install air pollution control
equipment to comply with emission standards.
During the year, CBPU approved the installation
of 78 numbers of air pollution control equipment.
The types of control equipment approved are in
Table 4.
Pollution Control
Table 4Air Pollution Control Equipment Approved
Equipment No. Approved Total No. as at 2005
Bag filter dust collector 23 1294
Inertial collector 2 192
Electrostatic precipitator 3 29
Scrubber 22 839
Smoke density meter 5 124
Miscellaneous 23 1001
Total 78 3403

13Environmental Protection Division
Annual Report 2005
Control of Fuel-Burning Equipment
Fuel-burning equipment uses either gaseous fuel
or fuel oil. The main air pollutants arising from fuel-
burning are sulphur oxides and smoke. The emission
of sulphur oxides is controlled by limiting the
sulphur content in the fuel.
Industries located in designated industrial estates
are required to use fuels containing not more than
1% sulphur by weight. Industries on Jurong Island
and Tuas industrial estate can use natural gas, a
clean fuel which is available there. Those located
near housing estates or residential premises are
required to use cleaner fuels, e.g. diesel with 0.005%
or lower sulphur content, or town gas. In addition,
the height of chimneys and the exit velocity of the
flue gases are checked by PCD to ensure proper
dispersion of flue gases.
Operators of industrial boilers with a steam
generating capacity of 2,300 kg/h or more are
required to monitor their smoke emissions. Smoke
density meters are installed in the chimneys to
continuously monitor the smoke intensity to ensure
compliance with the Ringelmann No. 1 standard.
During the year, 18 numbers of new fuel-burning
equipment were approved by CBPU. They included
six boilers, two heaters, four ovens, two furnaces and
four incinerators.
Open Burning
Open burning of waste materials gives rise to serious
air pollution. In Singapore, open burning of trade
and industrial refuse such as construction wastes,
is prohibited under the Environmental Pollution
Control (Prohibition on the Use of Open Fires)
Order, 1999. Most open burning incidents occur at
construction sites where timber waste and
construction debris are burnt illegally to save on
disposal costs. During the year, a total of 16 open
burning incidents were detected and action was
taken to prosecute the offenders.
Control of Fugitive Odorous Emissions
Fugitive or residual emission of odorous substances
can be a major source of smell nuisance from
factories. These factories are required to install odour
control equipment to minimise the nuisance.
Complaints snd Incidents of Air Pollution
During the year, PCD received 780 complaints
on pollution, of which 100 were incidents of air
pollution. The main causes of these incidents were
poor maintenance, improper operation and/or
overloading of air pollution control equipment.
PCD required the owners or occupiers to take
immediate remedial action to ensure compliance
with the allowable emission limits. A breakdown
of air pollution complaints and incidents in 2004
and 2005 is given in Table 5.
Pollution Control
Table 5Complaints and Incidents of Air Pollution
Type of Air Pollution No. of Complaints No. of Incidents
2005 2004 2005 2004
Odour 445 391 17 38
Fumes/Dust 171 241 25 35
Smoke/Soot 162 151 17 25
Others 2 7 2 2
Total 780 790 61 100

14Environmental Protection Division Annual Report 2005
Control Of Vehicular Emissions
Control Of Smoky Vehicles
PCD is responsible for enforcement operation
against smoky vehicles on roads. In 2005, a total
of 6,356 motor vehicles and 7,650 motorcycles
were booked and fined for emitting excessive
smoke. A breakdown of the survey results of
smoky vehicles in Singapore in 2004 and 2005
is given in Table 6.
Vehicle Emission Standards
With the continuing growth of vehicle population
in Singapore, total emissions from vehicles have
to be kept in check through the implementation
of stringent emission standards for new vehicles.
Over the years, NEA has tightened the emission
standards in tandem with advances in vehicle
technology. With effect from 1 January 2001, all
new vehicles registered for use in Singapore must
comply with the Euro II emission standards. With
effect from 1 July 2003, all motorcycles/scooters
must comply with the exhaust emission standard as
specified in the European Directive 97/24/EC before
they can be registered for use in Singapore.
In Singapore, diesel vehicles contribute to about
50% of the total PM2.5 emissions. To bring down
the PM2.5 levels in Singapore to within acceptable
standards, the NEA will implement the Euro IV
emission standard for all new diesel vehicles
registered from 1 October 2006 onwards. The
emission standards are summarised in Table 7.
In addition, in-use vehicles are required to undergo
mandatory periodic inspections. These vehicles are
tested for compliance with regulations on in-use
vehicle emission. This is to ensure the proper
maintenance of engines and efficacy of catalytic
converters.
To provide vehicle owners with a better standard
of maintenance, PCD had initiated the formation
of an industry-led Motor Industry Certification
Board (MICB) (Singapore) for the administration of
the Certification Scheme for Motor Workshop on
1 September 2000. Under this scheme, certificates
are awarded only to motor workshops with trained
mechanics, proper equipment and procedures,
and quality assurance checks for the maintenance
of diesel-driven vehicles to prevent black smoke
emission. To date, more than 30 workshops have
been certified under the scheme.
PCD had also, from 1 September 2000, introduced
the Chassis Dynamometer Smoke Test (CDST) to
replace the free accelertion smoke test for
diesel-driven vehicles booked for emitting black
smoke. The CDST simulates the actual driving
conditions that a loaded vehicle is subjected to
while it is on the road. Hence, the CDST measures
the actual smoke emission from a vehicle under
load during testing. Up to 31 December 2005,
61,614 vehicles were sent for CDST testing and
an average of about 74% of the vehicles tested
was able to pass the CDST on the first attempt.
Control Of Automotive Fuel Quality
The quality of fuel used by vehicles in Singapore is
controlled because of its impact on vehicular
emissions. Unleaded petrol was introduced in
January 1991 and leaded petrol was phased out on
1 July 1998. To reduce smoke emission from diesel
vehicles, the permissible sulphur content in diesel was
reduced from 0.3% to 0.05% by weight on
1 March 1999. Smoke emission from diesel-driven
vehicles is harmful as the fine particulate matter
present in smoke has a significant health impact
on people. The reduction of the sulphur content in
diesel had paved the way for the introduction
of the more stringent Euro II emission standards
on 1 January 2001. A further reduction of the sulphur
content in diesel to 0.005% by weight was effected
in December 2005 to pave the way for the smooth
implementation of Euro IV emission standard for
new diesel vehicles, which will take effect from
1 October 2006.
CNG Vehicles
Natural gas is a cleaner source of energy than
petrol or diesel. Vehicles powered by natural gas
emit little or no pollutants such as fine particulates,
sulphur dioxide, carbon monoxide and hydrocarbons.
Natural gas vehicles also emit less carbon dioxide
than petrol-driven or diesel-driven vehicles. The use
Pollution Control

15Environmental Protection Division
Annual Report 2005
of natural gas vehicles will therefore reduce the
emission of air pollutants as well as carbon dioxide.
In April 2002, NEA and its project partners, SembGas
and SBS Transit, launched the first CNG refuelling
station on Jurong Island and the pilot project to
introduce CNG buses in Jurong.
Between March 2003 to March 2004, taxi
companies have also conducted a pilot project to
conduct road tests on 10 CNG taxis. SMART Taxi
Company registered and deployed 101 CNG
Mercedes taxis by December 2005, and planned
to operate a total of 500 CNG taxis by end 2006
or early 2007. NEA approved $2 million under IES
Fund to support SMART in its project to set up
one mother station and two daughter CNG
refuelling stations.
CNG refueling station in Jurong Island
Mercedes CNG Taxis
Tax IncentivesIn 2005, the government revised the various tax incentives to promote the early introduction of Euro IV diesel vehicles, CNG vehicles and green vehicles. The incentives are summarised in the table below:
Pollution Control
Vehicle Type Tax incentives for vehicles registered from 1 June 2004 to 1 January 2006 to 1 October 2006 to 31 December 2005 30 September 2006 31 December 2007
CNG, Hybrid Rebate of 20% Open Rebate of 40%OMV Rebate of 40% OMV and Electric Market Value (OMV) Passenger Cars 20% road tax rebate (CNG and electric cars) and 10% road tax rebate (hybrid cars) CNG Taxis Rebate of 100% OMV Rebate of 80% OMV Rebate of 40% OMV 20% road tax rebate Special tax exempt Special tax exempt Special tax exempt until until 31 December 2007 until 31 December 2007 31 December 2007
Euro IV Diesel Taxis Rebate of 100% OMV Rebate of 80% OMV Rebate of 40% OMV CNG Buses and Rebate of 5% OMV Rebate of 5% OMV Rebate of 5% OMV Commercial 20% road tax rebate Road tax payable would Road tax payable Vehicles (CNG and electric vehicles) be the same as their would be the same and 10% road tax rebate petrol-driven as their petrol- (hybrid vehicles) equivalents driven equivalents. Road tax payable would be the same as their petrol-driven equivalents. Euro IV Diesel Rebate of 5% OMV Rebate of 5% OMV Rebate of 5% OMV Buses and Commercial Vehicles

16Environmental Protection Division Annual Report 2005
Water Pollution Control
Overview
Water quality of the inland and coastal waters remained
good. All inland waters supported aquatic life.
Acts And Regulations
The Environmental Pollution Control Act (EPCA)
and the Sewerage and Drainage Act (SDA) and their
regulations are used to control the discharge of
wastewater from domestic, industrial, agricultural and
other premises into public sewers and watercourses.
The Environmental Pollution Control (Trade Effl uent)
Regulations (TER) and the Sewerage and Drainage
(Trade Effluent) Regulations stipulate the standards
for trade effluent discharged into watercourses and
Table 6Survey Results of Smoky Vehicles on Singapore Roads
Origin and Type % of Smoky Vehicles in % of Smoky Vehicles in of Smoky Vehicle 2004 2005
Singaporean (i) Motor vehicles 0.5% 0.4% (ii) Motorcycles 1.0% 0.7%
Malaysian (i) Motor vehicles 2.1% 1.7% (ii) Motorcycles 3.0 % 3.0%
Table 7Summary Of Emission Standards for Motor-Vehicles
Type of Vehicle Emission Standard Implementation
Petrol-driven vehicles All new petrol-driven vehicles are required to comply 1 January 2001 with the EC Directive 96/69/EEC.
Diesel-driven vehicles All new diesel-driven passenger cars are required to comply 1 January 2001 with the EC Directive 96/69/EEC.
All new light commercial vehicles 3.5 tonnes or below are 1 January 2001 required to comply with the EC Directive 96/69/EC.
All new heavy duty vehicles exceeding 3.5 tonnes are required 1 January 2001 to comply with the EC Directive 91/542/EEC Stage II.
EU Directive 98/69/EC-B(2005) for vehicle 3.5 tonnes 1 October 2006 or below (EURO IV) (Planned) EU Directive 1999/96/EC-B1(2005) for vehicles greater than 3.5 tonnes (EURO IV)
Motorcycles & scooters All new motorcycles and scooters are required to comply with 1 July 2003 the EC Directive 97/24/EC.
public sewers respectively. The discharge standards
stipulated in both the regulations are in Appendix 8.
Industries may apply for permission to discharge trade
effl uent, which contain biodegradable pollutants, as
measured by biochemical oxygen demand (BOD) and
total suspended solids (TSS), into the public sewers on
payment of a tariff when the BOD and TSS exceed the
stipulated limits in the TER. The current schedule of
trade effl uent tariffs is in Appendix 9. Apart from the
above two parameters (BOD and TSS), industries must
comply with the discharge standards of the TER for all
other parameters. Where necessary, they shall install
on-site treatment plants to treat their effl uent to the
stipulated standards.
Pollution Control

17Environmental Protection Division
Annual Report 2005
Industries generating large quantities of acidic effl uent
are required to install a pH monitoring and shut-off
control system to prevent the discharge of acidic
effl uent into the public sewer. This helps to protect
the sewerage system against corrosion and damage.
In general, industries with the potential to cause
pollution are located in designated industrial estates
such as Jurong/Tuas Industrial Estates, which are
outside water catchments and served by public sewers.
Only clean or light industries are allowed within water
catchments but must be sited in proper industrial
estates served by public sewers.
Sampling Of Trade Effl uent
During the year, PCD collected 858 trade effl uent
samples for analysis. Of these, 25 samples or about
2.9% failed to comply with the stipulated standards.
PCD required the offenders to take measures to
prevent recurrence and initiated enforcement action
against those found exceeding the standards.
Trade Effluent Treatment Facilities
Industries are required to install pre-treatment facilities
to treat their trade effl uent that exceeds the limits
of discharge stipulated in the TER. The pre-treatment
plants would have to be installed prior to the
commissioning of the factories.
During the year, CBPU approved 46 trade effl uent
Pollution Control
treatment facilities. A breakdown of the treatment
facilities approved is in Table 8.
Emergency Response Plan For Oil/Chemical
Spills On Land
During the year, there was 1 incident of chemical spill
on land. The NEA, PUB and the Singapore Civil Defence
Force (SCDF) dealt with the spill quickly to limit and
contain the environmental pollution arising from it.
Backyard Industries
There are still some backyard industries in undeveloped
areas not served by public sewers. These backyard
industries will be phased out when these areas are
developed. PCD continues to monitor these backyard
industries to ensure that adequate measures are
adopted by these industries to prevent pollution.
Complaints And Incidents Of Water Pollution
PCD received 131 complaints of water pollution during
the year, of which 17 were substantiated. Most of
the incidents were due to illegal discharge or spillage
of industrial wastewater or chemical/oil into drains.
PCD required the offenders to clean up the pollution
and legal action was taken against them for causing
pollution.
A breakdown of the water pollution complaints and
incidents in 2004 and 2005 is in Table 9.
Treatment Facility/Method No. Approved in 2004 Total No. as at 2004
Oil interceptor 8 1018
Balancing tank 2 397
Sedimentation 1 206
Neutralisation 14 294
Chemical 20 626
Activated sludge oxidation 0 19
Biological filtration 0 23
Ion exchanger/RO 0 1
Activated carbon adsorption 1 17
Total 46 2601
Table 8Trade Effluent Treatment Facilities Approved

18Environmental Protection Division Annual Report 2005
Table 9Complaints and Incidents of Water Pollution
Hazardous Substances and Toxic Wastes Control
Overview
PCD controls the import, transport, sale, storage and
use of hazardous substances. PCD also controls the
disposal of toxic industrial wastes. The controls
implemented ensure the safe and proper management
of hazardous substances and toxic industrial wastes
in Singapore.
Besides regulatory controls, PCD also works with
international organisations, relevant government
agencies and industry groups to organise seminars
and briefi ngs to help companies and traders manage
hazardous substances and toxic industrial wastes
safely.
Hazardous installations, which store hazardous
substances in bulk quantities, are also required to
carry out safety audits to systematically identify and
rectify weaknesses in their management systems
and practices of handling hazardous substances.
Hazardous Substances Control
The import/export, transport, sale, storage and use
of hazardous substances are controlled under
the Environmental Pollution Control Act and
the Environmental Pollution Control (Hazardous
Substances) Regulations.
Any person or company planning to engage in such
activities must obtain a Hazardous Substances Licence
or Permit from PCD. The chemicals controlled under
the Environmental Pollution Control Act are listed
in Appendix 10.
Type of Water Pollution No. of Complaints No. of Incidents 2005 2004 2005 2004
Chemical/Oil 62 56 12 17
Industrial wastewater 54 30 4 6
Farm wastes 0 0 0 0
Domestic wastewater 8 2 1 0
Others 7 7 0 3
Total 131 95 17 26
During the year, PCD issued 631 Hazardous Substances
Licences and 901 Hazardous Substances Permits. PCD
also processed electronically 46,966 inward/outward
declarations for the import/export of chemicals and
chemical products through the TradeNet computerised
network system.
Also, under the Environmental Pollution Control
(Hazardous Substances) Regulations, PCD’s approval
is required for the transportation of hazardous
substances in quantities exceeding the limits
stipulated in the Regulations. The specifi ed limits for
each hazardous substance are listed in Appendix 11.
During the year, PCD issued 166 transport approvals.
Requirements on packaging, maximum allowable
load, route, timing and emergency plans were imposed
to ensure the safe transportation of hazardous
substances.
Surprise road checks were also conducted jointly
with the Land Transport Authority and the Singapore
Civil Defence Force (SCDF) to ensure that companies
transporting hazardous substances complied with the
safety requirements imposed.
During the year, PCD conducted 886 surprise
inspections to audit the records of hazardous
substances kept by the holders of Hazardous
Substances Licences and Permits. Of these, 47 were
not in order. PCD issued written warnings to 46
offenders and gave verbal warning to 1offender.
Application of Hazardous Substances Licence/
Permit via the Internet
Applicants can submit an electronic application via
the Internet, and check the status of their electronic
Pollution Control

19Environmental Protection Division
Annual Report 2005
applications at their own convenience. The website
address is: http://app1.env.gov.sg/pcls/controller? event
=WELCOME
All the necessary guidance and information for fi lling
up the electronic application are available on-line
to applicants. Applicants need not travel to PCD to
collect application forms, seek clarifi cation or submit
application forms.
Training For Tanker Drivers
Drivers of road tankers and tank containers carrying
hazardous substances and dangerous petroleum
products are required to undergo a special one-day
training course jointly organised by Singapore Civil
Defence Force (SCDF) and PSA Institute. Those who
have successfully completed the course is granted
a HAZMAT Transportation Driver Permit (HTDP). All
drivers conveying controlled hazardous substances
listed in the Environmental Pollution Control (Hazardous
Substances) Regulations are required to possess a HTDP
that is valid for 2 years. They are required to undergo
a one-day course every 2 years as a form of refresher
training for the renewal of their HTDP.
Toxic Industrial Wastes Control
The Environmental Public Health (Toxic Industrial Waste)
Regulations require all toxic industrial waste collectors
to be licensed. Approval is also required to transport
toxic industrial wastes exceeding the quantities
stipulated in the Regulations.
The types of toxic industrial wastes controlled under
the Regulations are listed in Appendix 12.
During the year, PCD granted and renewed licences
to 147 toxic industrial waste collectors to carry out
treatment, reprocessing and disposal of toxic wastes.
PCD also required licensed toxic waste collectors to
obtain approval to transport toxic industrial wastes
that exceeded specifi ed quantities.
Control of Tanker Cleaning Activities
Since 4 April 1993, Singapore has implemented a
scheme to tighten control on tanker cleaning activities
and the disposal of sludge and slop oil generated
from tanker cleaning activities. Under the scheme,
the Maritime and Port Authority (MPA) will only issue
permits to contractors registered with PCD to carry
out tanker cleaning activities in designated areas.
Sludge and slop oil generated from tanker cleaning
activities are required to be sent to approved reception
facilities for treatment and disposal.
Also under the scheme, any ship or vessel entering
Singapore in a “clean condition” for repairs would
be allowed entry only if it could show proof that the
sludge from its tanker cleaning activities had been
disposed of at approved facilities.
During the year, 29 companies were registered to carry
out tanker cleaning activities. About 26,700 tonnes
of oily sludge were sent to the approved reception
facilities for treatment and disposal.
Collection Of Industrial Waste Chemicals
The main types of industrial waste chemicals include
waste solvents, spent etchants, acids, alkalis and
expired chemicals. PCD encourages the reuse, recycle
and recovery of waste chemicals to reduce the amount
of wastes that require treatment and disposal.
During the year, licensed collectors collected about
339,000 tonnes of waste chemicals from local
industries.
Control of Biohazardous Wastes
Biohazardous wastes from hospitals and polyclinics
are segregated at source and stored in colour-coded
plastic bags. The wastes are then put in secured
containers and collected by 2 licensed biohazardous
waste disposal companies for disposal in high
temperature incinerators.
For the year 2005, about 19,800 cubic metres of
biohazardous wastes were collected and disposed
of locally by licensed biohazardous waste disposal
companies.
Environmental Noise Management
Industrial Noise Control
PCD controls noise from factories by siting them in
designated industrial estates and where appropriate,
requiring them to implement noise abatement
measures to comply with allowable boundary noise
limits. PCD conducts regular checks on factories
to ensure noise control equipment is operated and
maintained properly. The boundary noise limits for
factory premises are in Appendix 13.
Pollution Control
20Environmental Protection Division Annual Report 2005
Construction Noise Control
PCD enforces the Environmental Pollution Control
(Control of Noise at Construction Sites) Regulations
to control noise pollution from construction sites. On
1 October 2001, the Regulations were amended to
incorporate more stringent permissible noise limits
for noise generated at night. The new noise limits
are applicable to construction sites that commenced
on or after 1 October 2001 and are within 150 m of
residential premises. The permissible noise limits for
construction sites are in Appendix 14.
The regulations require contractors to schedule their
construction activities and to take noise abatement
measures to comply with the permissible noise limits.
However, the Regulations do not restrict the working
days or hours of construction sites.
During the year, PCD received 4953 complaints of
noise pollution against construction sites. Of these,
207 complaints against 84 construction sites were
substantiated, i.e. the noise levels had exceeded the
permissible noise limits. The main cause of these
substantiated cases was from concreting work carried
out late at night. The contractors were prosecuted
and reminded to reschedule their activities to ensure
compliance with the permissible noise limits.
During the year, PCD received 334 complaints of
noise pollution from factories, of which 25 were
substantiated incidents. The main causes of these
incidents were improper siting of mechanical
equipment and/or poor maintenance of mechanical
equipment. The owners or occupiers were required
to take remedial action to reduce noise to comply
with the allowable noise limits.
Traffi c Noise from Expressways
NEA strategy is to reduce traffi c noise from expressways
through the use of cost-effective measures.
In land-scarce and highly urbanised Singapore, some
degree of traffi c noise pollution is inevitable. NEA,
together with the Ministry of Transport (MOT) and
the Ministry of National Development (MND), use
the following cost-effective measures to alleviate the
problem:
• tightening noise emission standards for vehicles;
• using noise-absorptive porous asphalt material for
road surfacing;
• siting multi-storey carparks, electrical substations
or other non-residential structures to screen traffi c
noise from new residential buildings;
• setting a minimum set back distance for new
residential buildings from expressways; and
• designing new fl at layouts such that living rooms
and bedrooms are located away from traffi c noise.
Pollution Control

21Environmental Protection Division
Annual Report 2005
Environmental Monitoring
33

22Environmental Protection Division Annual Report 2005
Overview
Singapore has, over the years, managed to maintain
an impressive environmental record despite the
increase in industrialisation and urbanisation.
Our success in keeping the environment clean and safe
is partly due to regular monitoring and assessment of
the quality of ambient air and water. The results have
helped in the development and review of pollution
control measures.
Ambient Air Monitoring
The ambient air quality in Singapore is routinely
monitored through the Telemetric Air Quality
Monitoring and Management System (TAQMMS).
The system, which comprises 13 remote air monitoring
stations linked to a Central Control System (CCS) via
dial-up telephone lines, provides an effi cient means
of obtaining air quality data. The locations of the
monitoring stations are shown in Chart 1.
Eleven of the stations monitor ambient air quality
and two stations measure roadside air quality.
Automatic analysers and equipment are deployed
at the stations to measure the concentrations of
major air pollutants such as sulphur dioxide, oxides
of nitrogen, carbon monoxide, ozone and respirable
suspended particles (PM10).
In 2005, the overall average levels of sulphur dioxide,
nitrogen dioxide, carbon monoxide, ozone and
PM10 were within the ambient air quality standards
established by the United States Environmental
Protection Agency (USEPA). The USEPA ambient air
quality standards are summarised in Appendix 15.
The Pollutant Standards Index (PSI), an indicator of
air quality developed by the USEPA, was ‘Good’ for
88% and ‘Moderate’ for 12% of the days measured
during 2005, as shown in Table 10.
Chart 1Location of Air Quality Monitoring Stations
Environmental Monitoring

23Environmental Protection Division
Annual Report 2005
Environmental Monitoring
Table 10Summary of Pollutant Standards Index (PSI)
Year Days No. of Days in which the PSI was Percentage Classifi ed as
Good Moderate Unhealthy Good Moderate Unhealthy (0-50) (51-100) (101-200) (0-50) (51-100) (101-200)
2005 365 322 43 0 88% 12% 0
2004 366 322 44 0 88% 12% 0
Chart 2
Annual Average Levels of Sulphur Dioxide
Sulphur Dioxide
Sulphur dioxide is an undesirable by-product from
the combustion of sulphur-containing fuels and to a
lesser extent, from petroleum refi ning processes.
Prolonged exposure to high concentrations of sulphur
dioxide increases the risk of contracting respiratory
diseases.
The annual average levels of sulphur dioxide are
shown in Chart 2. In 2005, the annual average level
was 14 µg/m3, which was within the USEPA standard
of 80 µg/m3.

24Environmental Protection Division Annual Report 2005
Environmental Monitoring
Chart 3Annual Average Levels of Nitrogen Dioxide
Nitrogen Dioxide
Nitric oxide accounts for most of the nitrogen oxides
emitted by man-made sources. Nitric oxide is oxidised
in the atmosphere to form nitrogen dioxide.
High levels of nitrogen dioxide increase the risk of
respiratory infection and impair lung functions in
asthmatics.
The annual average levels of nitrogen dioxide in the
ambient air are shown in Chart 3.
In 2005, the annual average level of nitrogen dioxide
was 25 µg/m3, well within the USEPA standard of 100
µg/m3.
Respirable Suspended Particles (PM10)
Respirable suspended particles (or PM10) refer
to particulate matter of size 10 µm and below.
These particles have health implications as they
are able to penetrate into the deeper regions
of the respiratory tract. When present in very
high amounts, the particles cause breathing
and respiratory problems, and aggravate existing
respiratory and cardiovascular diseases.
Low-Level Ozone
Ozone in the stratosphere is desirable as it protects
life on earth by absorbing much of the harmful
ultraviolet radiation from the sun.
However, ozone occurring in the lower atmosphere
is a health hazard. Ozone can severely irritate eyes,
mucous membranes and the respiratory system in
humans as well as cause damage to plants.
Low-level ozone may be produced by the complex
reactions of nitrogen oxides and volatile organic
compounds catalysed by actinic radiation, or may
result from the intrusion of stratospheric ozone into
the troposphere.
In 2005, the 8-hr average ozone level was within
the USEPA standard of 157 µg/m3. The trends of the
ozone levels are shown in Chart 5.
The 2005 PM10 level of 30 µg/m3 was within the
USEPA standard of 50 µg/m3. Chart 4 shows the
annual average levels of PM10 in the ambient air.

25Environmental Protection Division
Annual Report 2005
(Note: 1997 PM10 levels were affected by transboundary smoke haze from plantation and forest fi res in Indonesia)
Chart 4Annual Average Levels of Respirable Suspended Particles (PM10)
Chart 5Average Ozone Levels
Environmental Monitoring
(Note: Chart shows 4th highest daily maximum 8-hr averages}

26Environmental Protection Division Annual Report 2005
Environmental Monitoring
Carbon Monoxide
Carbon monoxide is a colourless and odourless gas
with a higher affi nity than oxygen for the haemoglobin
in the blood. Hence, when it is inhaled, it can deprive
body tissues of oxygen.
Exposure to moderate levels of carbon monoxide may
cause nausea and impair vigilance. In excessive doses,
it can cause death through asphyxiation.
The sources of carbon monoxide range from vehicular
emissions, cigarette smoke to incomplete combustion
of fuels. Vehicular emission usually accounts for most
of the carbon monoxide in the air.
Carbon monoxide is measured at both ambient
and roadside air monitoring stations. The ambient
8-hourly average level of carbon monoxide measured
in 2005 was 0.5 mg/m3. This level was well within the
USEPA standard of 10 mg/m3. The roadside levels of
carbon monoxide are shown in Table 11.
Pollution From Vehicles
Lead compounds, such as tetra-ethyl lead and
tetra-methyl lead, have for many years been added to
petrol as anti-knock agents. The combustion of leaded
petrol results in the emission of lead particulates into
the air. If imbibed in large quantities, lead can cause
irreversible damage to the brain and other organs.
Foetuses and children are particularly sensitive to the
deleterious effects of lead as their nervous systems are
still developing.
Lead levels in petrol had progressively been reduced
since the 1980s and, in January 1991, unleaded petrol
was introduced in Singapore. On 1 July 1998, leaded
petrol was phased out.
The efficacy of these measures in reducing lead
concentrations in the air is evident from Chart 6.
From roadside levels of as high as 1.4 µg/m3 in 1984,
the lead levels have stabilised at around 0.1 µg/m3
since 1992. The lead levels remained at < 0.1 µg/m3 in
2005. The USEPA standard for three-monthly average
lead level is 1.5 µg/m3.
Water Monitoring
Overview
PCD regularly monitors the water quality of various
inland water bodies and coastal areas. The monitoring
points are shown in Charts 7 and 8.
Water Quality in Water Catchment Areas
The water quality of 33 streams and 14 ponds in the
water catchment areas is monitored quarterly.
Water quality of the 14 reservoirs within the water
catchment areas is jointly monitored by PCD and
PUB.
The water quality, based on the measured levels of
dissolved oxygen (DO), biochemical oxygen demand
(BOD) and total suspended solids (TSS) remained
good in 2005. The monitoring data are shown in
Table 12.
Water Quality in Non-Water Catchment Areas
Water quality of the 20 rivers and streams in non-
water catchment areas is monitored quarterly.
Physical, chemical and microbiological parameters are
analysed to assess the water quality. Results of the
monitoring, as given in Table 12, revealed that the
rivers and streams were low in pollution and were
able to sustain aquatic life.
Table 11Roadside Average Carbon Monoxide Levels (mg/m3) in 2004/2005
Time Interval (Hours)
Monitoring Station 0000 - 0800 0800 - 1600 1600 – 2400
2004 2005 2004 2005 2004 2005
Chin Swee 1.0 0.8 1.1 0.8 1.2 0.9
Ngee Ann Polytechnic 1.2 1.1 1.1 0.9 1.3 1.0

27Environmental Protection Division
Annual Report 2005
Environmental Monitoring
Chart 6Lead Levels (1983 to 2005)
Chart 7Locations of Non-Catchment and Seawater Sampling Points

28Environmental Protection Division Annual Report 2005
Parameter Straits of Johor East Straits of Johor West Straits of Singapore (Percentage of Time) (Percentage of Time) (Percentage of Time)
Faecal Coliform Count 2005 93 % 79 % 100 %
(<1,000 per 100 ml) 2004 90 % 88 % 100 %
Environmental Monitoring
Chart 8Locations of Catchment Sampling Points
Parameter Monitored Water Catchment Streams Non-Water Catchment Rivers/Streams (Percentage of Time) (Percentage of Time)
Dissolved Oxygen 2005 100 % 95 %
(> 2 mg/l) 2004 98 % 97 %
Biochemical Oxygen 2005 95 % 92 %
Demand (< 10 mg/l) 2004 92 % 91 %
Total Suspended 2005 98 % 100 %
Solids (< 200 mg/l) 2004 100 % 99 %
Monitoring of Coastal Waters
Water samples are collected monthly from 16 sampling
points along the Straits of Johor and 12 sampling
points along the Straits of Singapore. These samples
Table 13Monitoring Results of Coastal Waters
are subjected to physical, chemical and microbiological
examinations. Table 13 gives the monitoring results
for the coastal waters.
Table 12Monitoring Results of Inland Waters

29Environmental Protection Division
Annual Report 2005
Resource Conservation
4

30Environmental Protection Division Annual Report 2005
Resource Conservation
Strategies
From 1970 to 2000, the amount of waste disposed of
increased six times. At that rate, we would need to build
a new incineration plant every 5-7 years and a new
landfi ll the size of Semakau Landfi ll (current offshore
landfi ll) every 25-30 years. This is not sustainable.
The sustainable solution is to close the solid waste
loop by minimising waste and maximising recycling. This
will help to bring us nearer our goal of “Towards Zero
Landfi ll”, prolong the lifespan of Semakau Landfi ll,
and reduce the demand for more incineration plants.
The strategies to meet the goal of “Towards Zero
Landfi ll and Zero Waste” are as follows:
i) Volume reduction through incineration;
ii) Reuse and recycle to reduce waste disposed of at
incineration plants;
iii) Reduce the amount of waste sent to the sanitary
landfi ll; and
iv) Waste minimisation to reduce waste generated.
Energy fuels our industries, drives our economy and
supports our quality of life. Practically all our energy
is derived from fossil fuels, viz. oil and natural gas.
Singapore is totally dependant on imported fossil
fuels and does not have any indigenous sources of
energy. The production of energy from fossil fuels
results in the emission of air pollutants and carbon
dioxide, a greenhouse gas.
The strategies to deal with energy use are as follows:
i) To be energy effi cient – i.e. to get the maximum
output from the consumption of energy
ii) To be carbon effi cient – i.e. to get the maximum
energy output from every unit of fossil fuel burned
iii) To be eco effi cient – i.e. to minimise effect on
the environment from the emissions of particulates
and other pollutants when fossil fuels are burned.
Overview on Waste Minimisation and
Recycling Programmes
Since the early 1990s, Singapore has been actively
promoting waste minimisation and recycling to
reduce the waste disposed of at the incineration
plants and landfill. In 2005, the overall rate of
recycling increased to 49% as compared to 48% in
2004. Table 14 provides the details on the waste
disposal and recycling rates for 2005.
Table 14Waste Statistics and Recycling Rates for 2005
Waste Type Waste Disposed Total Waste Recycled Total Waste Output Recycling Rate (%) of (tonne) (tonne)
Food waste 495,000 36,500 531,500 7
Paper/Cardboard 558,100 540,500 1,098,600 49
Plastics 588,800 86,000 674,800 13
Construction Debris 27,200 465,300 492,500 94
Wood/Timber 149,300 90,000 239,300 38
Horticultural Waste 98,500 101,000 199,500 51
Ferrous Metals 69,200 749,100 818,300 92
Non-ferrous Metals 14,700 74,700 89,400 84
Used Slag 83,500 298,900 382,400 78
Sludge 98,300 0 98,300 0
Glass 58,800 3,800 62,600 6
Textile/Leather 85,000 4,000 89,000 4
Scrap Tyres 6,000 10,800 16,800 64
Others 216,400 8,800 225,200 4
Total 2,548,800 2,469,400 5,018,200 49

31Environmental Protection Division
Annual Report 2005
Resource Conservation
Waste Management and Recycling Industry
There are some 450 companies in the waste
management and recycling industry in Singapore.
They range from small operators to multi-national
companies. Most of the companies are in the waste
collection business and the rest carry out sorting and
recycling of waste.
The Waste Management and Recycling Association of
Singapore (WMRAS), established on 8 August 2001,
has about 80 members. The association plays an
important role in helping the local waste management
and recycling industry to grow and develop.
WMRAS co-organised with NEA, PUB and Singapore
Water Association the second EnviroAsia 2005,
which was held from 9-11 Nov 2005. The show
attracted about 5,000 visitors from 43 countries
including Malaysia, Indonesia, China and Turkey.
Exhibitor participation also more than doubled,
with 137 local and international exhibitors
and representatives from 19 countries. WMRAS
participated in various programmes such as Clean
& Green Week, and Recycling Day 2005.
In 2005, several recycling facilities were set up to
recycle plastic waste, street cleansing wastes and
construction and demolition wastes.
National Recycling Programme
The NEA launched the National Recycling Programme
(NRP) in April 2001 for households in Housing &
Development Board (HDB) estates and private
residential estates. In this programme, the public
EnviroAsia 2005
waste collectors licensed by NEA provide door-to-
door collection of recyclable waste. Households
are provided recycling bags, crates or bins for
their recyclables such as waste paper, drink cans,
glass bottles, old clothing and plastic bottles, and
collection of recyclables is carried out once every
fortnight. Residents are informed of the collection
dates in advance and can place their recycling bags,
crates or bins outside their doors for collection on
the scheduled dates.
To ensure that a reliable and consistent recyclable
collection service is provided to households under
the NRP, NEA introduced the Quality of Service (QOS)
standards and a permit system in October 2002.
Under the permit system, Singapore is divided into
22 precincts and only one permit is issued to the
permit holders to operate in each of the precincts
to ensure orderliness in collection. The permit
holders have to meet a set of QOS standards. NEA
officers conduct audit checks on the performance
of the permit holders. Demerit points are issued
for any lapses in service standards.
Participation rate by households increased from
33% (1 in 3 households) in 2002 to 56% (about 1
in 2 households) in 2005.
To complement the NRP and in response to feedback
from residents, NEA had started working with public
waste collectors (PWCs) and Town Councils to
introduce at least one set of centralised recycling
bins for every five blocks of HDB flats by 2007.

32Environmental Protection Division Annual Report 2005
Resource Conservation
Launch of Recycling Day 2005 by Minister
Publicity poster for Recycling Day 2005Longest chain of plastic bottles in conjunction with Recycling Day 2005
Recycling Day 2005
Recycling Day 2005 was held on 17 September 2005
to promote community participation in waste recycling.
Recycling Day 2005 was jointly organised by the NEA,
Dunman Secondary School, the People’s Association
(PA), the PWCs, Singapore Environment Council (SEC)
and the Waste Management and Recycling Association
of Singapore (WMRAS). Grassroots organisations and
schools were also involved.
Minister for the Environment and Water Resources,
Dr. Yaacob Ibrahim launched Recycling Day 2005
at Dunman Secondary School. Recycling Day 2005
celebrations were also held concurrently at another
two sites, namely Bukit Ho Swee Community
Centre and beside Yew Tee MRT station. Activities
included the exchange of recyclables, games (with
recycling theme) booth design competition, speech
writing contest, sales of reused items, record-setting
of the longest chain of plastic bottles, workshop etc.
Recycling Programme at Condominiums
RCD has been working with the Managing Agents,
Management Corporation of condominiums and
recycling companies to implement recycling
programmes in condominiums.
In December 2004, RCD started a trial on regional
recycling bins to serve clusters of small and medium
size condominiums that did not have their own
recycling programmes. The fi rst cluster was in the
Kovan Road area. As of December 2005, 5 clusters
of condominiums were participating in the scheme.
The percentage of condominiums with recycling
programmes has increased from 24% in 2004 to
43% in 2005.
33Environmental Protection Division
Annual Report 2005
Resource Conservation
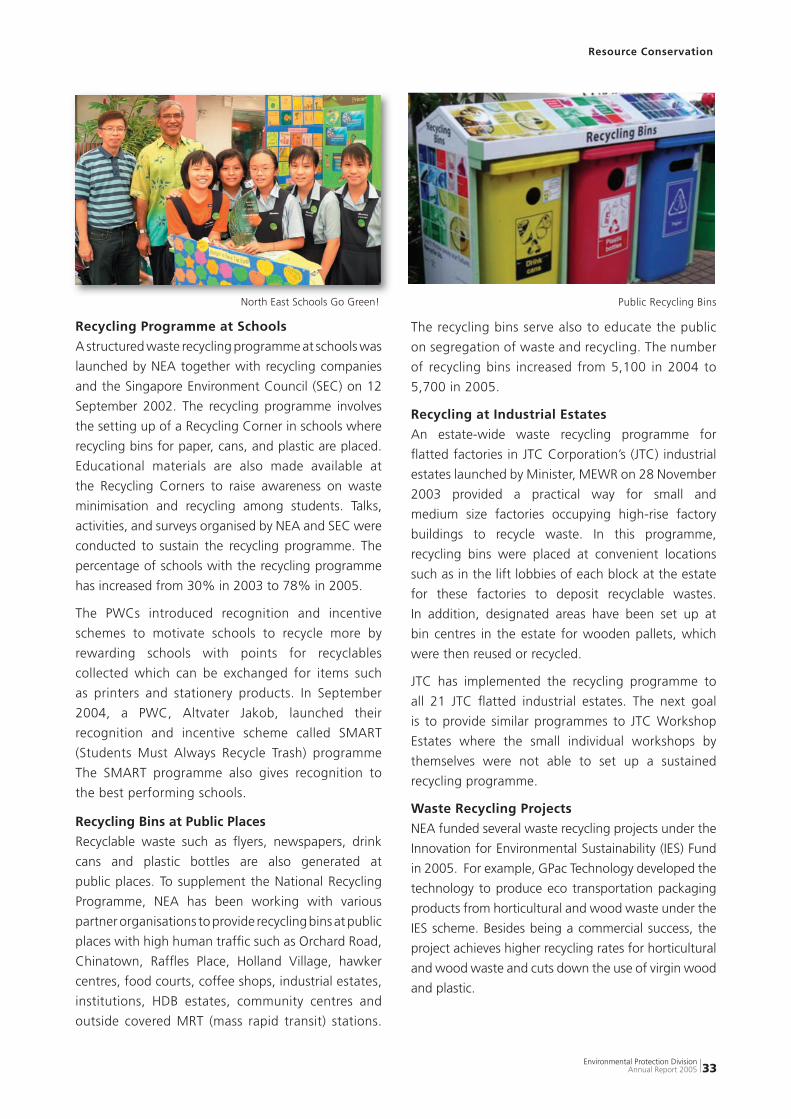
Recycling Programme at Schools
A structured waste recycling programme at schools was
launched by NEA together with recycling companies
and the Singapore Environment Council (SEC) on 12
September 2002. The recycling programme involves
the setting up of a Recycling Corner in schools where
recycling bins for paper, cans, and plastic are placed.
Educational materials are also made available at
the Recycling Corners to raise awareness on waste
minimisation and recycling among students. Talks,
activities, and surveys organised by NEA and SEC were
conducted to sustain the recycling programme. The
percentage of schools with the recycling programme
has increased from 30% in 2003 to 78% in 2005.
The PWCs introduced recognition and incentive
schemes to motivate schools to recycle more by
rewarding schools with points for recyclables
collected which can be exchanged for items such
as printers and stationery products. In September
2004, a PWC, Altvater Jakob, launched their
recognition and incentive scheme called SMART
(Students Must Always Recycle Trash) programme
The SMART programme also gives recognition to
the best performing schools.
Recycling Bins at Public Places
Recyclable waste such as fl yers, newspapers, drink
cans and plastic bottles are also generated at
public places. To supplement the National Recycling
Programme, NEA has been working with various
partner organisations to provide recycling bins at public
places with high human traffi c such as Orchard Road,
Chinatown, Raffl es Place, Holland Village, hawker
centres, food courts, coffee shops, industrial estates,
institutions, HDB estates, community centres and
outside covered MRT (mass rapid transit) stations.
North East Schools Go Green!
The recycling bins serve also to educate the public
on segregation of waste and recycling. The number
of recycling bins increased from 5,100 in 2004 to
5,700 in 2005.
Recycling at Industrial Estates
An estate-wide waste recycling programme for
fl atted factories in JTC Corporation’s (JTC) industrial
estates launched by Minister, MEWR on 28 November
2003 provided a practical way for small and
medium size factories occupying high-rise factory
buildings to recycle waste. In this programme,
recycling bins were placed at convenient locations
such as in the lift lobbies of each block at the estate
for these factories to deposit recyclable wastes.
In addition, designated areas have been set up at
bin centres in the estate for wooden pallets, which
were then reused or recycled.
JTC has implemented the recycling programme to
all 21 JTC fl atted industrial estates. The next goal
is to provide similar programmes to JTC Workshop
Estates where the small individual workshops by
themselves were not able to set up a sustained
recycling programme.
Waste Recycling Projects
NEA funded several waste recycling projects under the
Innovation for Environmental Sustainability (IES) Fund
in 2005. For example, GPac Technology developed the
technology to produce eco transportation packaging
products from horticultural and wood waste under the
IES scheme. Besides being a commercial success, the
project achieves higher recycling rates for horticultural
and wood waste and cuts down the use of virgin wood
and plastic.
Public Recycling Bins

34Environmental Protection Division Annual Report 2005
Resource Conservation
Awareness Building and Education
In conjunction with Recycling Day 2005, NEA organised
the “Games Booth Design” Competition and the
“Speech” Competition to make learning about Waste
Management and 3Rs more interesting and creative.
NEA also introduced an interactive 3Rs on-line game
known as “3R City Game” for primary and secondary
students to make learning about waste management
and recycling more fun (http://www.nea.gov.sg/3Rcity).
Solid Waste Management
With limited land available for waste disposal, NEA’s
policy for solid waste management necessitates
the reduction of volume of waste by incineration.
All incinerable waste that are not recovered, reused
or recycled are incinerated while the remaining waste
such as sludge, silt, shipyard waste, construction
waste and incineration ashes, are disposed of at
the offshore Semakau Landfi ll. The ratio of refuse
incinerated to that land-fi lled was about 90:10.
Besides incineration and landfi lling of waste, a
parallel policy of waste minimisation is gradually
proving to be an important part of the overall solid
waste management programme. Waste minimisation
was actively promoted in all sectors of the industry
and community to accommodate land constraints
and offset the rising costs of waste disposal.
Nevertheless, with refuse disposed of in 2001 reaching
2.80 million tonnes, the availability of land to cope
with the increasing amounts of refuse generated
can become a pressing problem. The daily average
for 2005 was 6,982 tonnes per day, an increase of
2.9% as compared to the amount of refuse disposed
of in 2004.
The amount of refuse collected from 2001 to 2005 is
shown in Chart 9.
Solid Waste Collection System
The huge amounts of municipal solid waste generated
daily necessitated the setting up of a highly effi cient
system for proper collection and disposal. Over the
years the waste management system in Singapore
has evolved into one of the most effi ciently operated
refuse collection services in the region.
Public Waste Collection Scheme
In 1999, the waste collection service was privatised and
the collection areas were divided into 9 geographical
sectors. In each sector, pre-qualifi ed waste collection
companies bid for the licence to provide refuse
collection services for residential and trade premises.
A map of the nine sectors is shown in Chart 10.
Successful bidders were appointed as Public Waste
Collectors (PWC) to serve the respective sectors.
They are also required to participate in the National
Chart 9Refuse Collected

35Environmental Protection Division
Annual Report 2005
Resource Conservation
Chart 10Privatised Refuse Collection Services – 9 Geographical Sectors
Table 15The Public Waste Collectors for the 9 Sectors
Recycling Programme (NRP) by providing door-to-
door collection services for recyclable materials
from households in their sectors. The PWCs for
the 9 sectors and the expiry date of their respective
licences are listed in Table 15.
No Sector PWC Licence Expiry Date
1 Pasir Ris - Tampines Altvater Jakob 30 June 2011
2 Bedok Altvater Jakob 31 October 2011
3 Jurong Altvater Jakob 31 March 2006
4 Clementi Sembwaste 30 April 2006
5 City Sembwaste 31 May 2006
6 Hougang - Punggol Sembwaste 30 June 2006
7 Ang Mo Kio - Toa Payoh Sembwaste 30 June 2006
8 Woodlands - Yishun Sembwaste 31 July 2006
9 Tanglin - Bukit Merah FME Onyx 31 August 2006
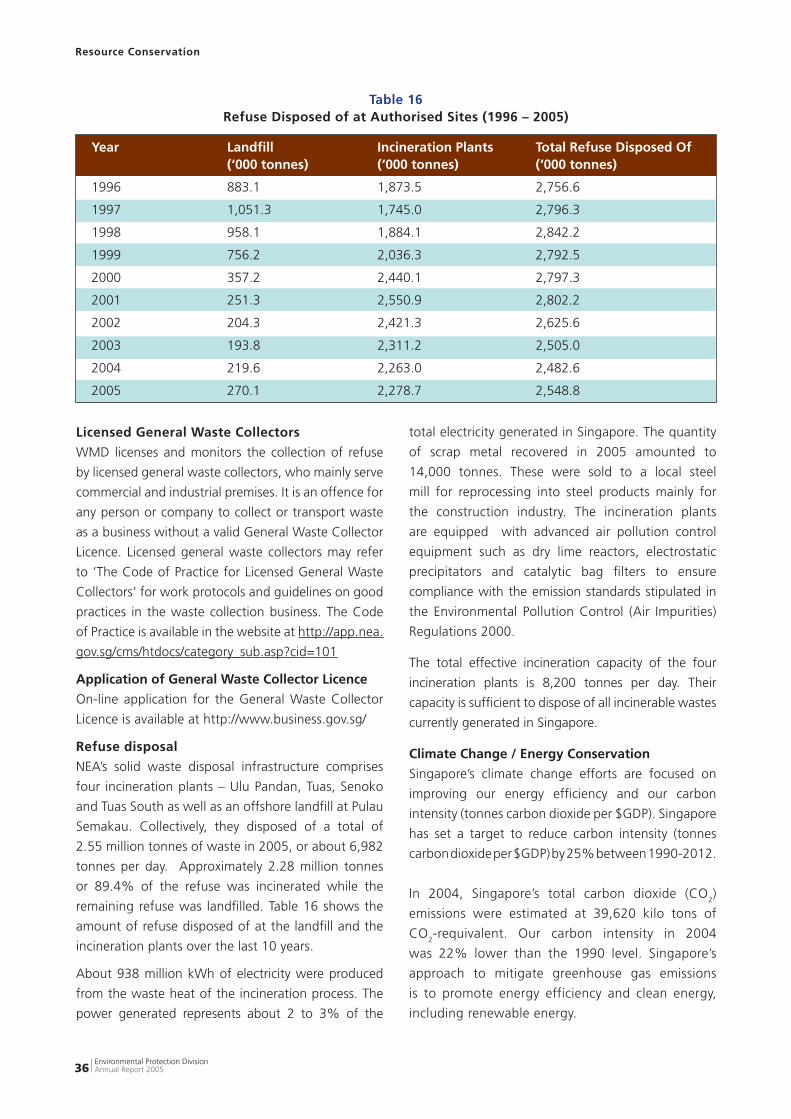
36Environmental Protection Division Annual Report 2005
Licensed General Waste Collectors
WMD licenses and monitors the collection of refuse
by licensed general waste collectors, who mainly serve
commercial and industrial premises. It is an offence for
any person or company to collect or transport waste
as a business without a valid General Waste Collector
Licence. Licensed general waste collectors may refer
to ‘The Code of Practice for Licensed General Waste
Collectors’ for work protocols and guidelines on good
practices in the waste collection business. The Code
of Practice is available in the website at http://app.nea.
gov.sg/cms/htdocs/category_sub.asp?cid=101
Application of General Waste Collector Licence
On-line application for the General Waste Collector
Licence is available at http://www.business.gov.sg/
Refuse disposal
NEA’s solid waste disposal infrastructure comprises
four incineration plants – Ulu Pandan, Tuas, Senoko
and Tuas South as well as an offshore landfi ll at Pulau
Semakau. Collectively, they disposed of a total of
2.55 million tonnes of waste in 2005, or about 6,982
tonnes per day. Approximately 2.28 million tonnes
or 89.4% of the refuse was incinerated while the
remaining refuse was landfi lled. Table 16 shows the
amount of refuse disposed of at the landfi ll and the
incineration plants over the last 10 years.
About 938 million kWh of electricity were produced
from the waste heat of the incineration process. The
power generated represents about 2 to 3% of the
Resource Conservation
total electricity generated in Singapore. The quantity
of scrap metal recovered in 2005 amounted to
14,000 tonnes. These were sold to a local steel
mill for reprocessing into steel products mainly for
the construction industry. The incineration plants
are equipped with advanced air pollution control
equipment such as dry lime reactors, electrostatic
precipitators and catalytic bag fi lters to ensure
compliance with the emission standards stipulated in
the Environmental Pollution Control (Air Impurities)
Regulations 2000.
The total effective incineration capacity of the four
incineration plants is 8,200 tonnes per day. Their
capacity is suffi cient to dispose of all incinerable wastes
currently generated in Singapore.
Climate Change / Energy Conservation
Singapore’s climate change efforts are focused on
improving our energy effi ciency and our carbon
intensity (tonnes carbon dioxide per $GDP). Singapore
has set a target to reduce carbon intensity (tonnes
carbon dioxide per $GDP) by 25% between 1990-2012.
In 2004, Singapore’s total carbon dioxide (CO2)
emissions were estimated at 39,620 kilo tons of
CO2-requivalent. Our carbon intensity in 2004
was 22% lower than the 1990 level. Singapore’s
approach to mitigate greenhouse gas emissions
is to promote energy efficiency and clean energy,
including renewable energy.
Table 16Refuse Disposed of at Authorised Sites (1996 – 2005)
Year Landfi ll Incineration Plants Total Refuse Disposed Of (‘000 tonnes) (‘000 tonnes) (‘000 tonnes)
1996 883.1 1,873.5 2,756.6
1997 1,051.3 1,745.0 2,796.3
1998 958.1 1,884.1 2,842.2
1999 756.2 2,036.3 2,792.5
2000 357.2 2,440.1 2,797.3
2001 251.3 2,550.9 2,802.2
2002 204.3 2,421.3 2,625.6
2003 193.8 2,311.2 2,505.0
2004 219.6 2,263.0 2,482.6
2005 270.1 2,278.7 2,548.8

37Environmental Protection Division
Annual Report 2005
National Energy Efficiency Committee
The National Energy Effi ciency Committee (NEEC) is an
inter-agency committee with 3P (People, Private and
Public sector) representation. It seeks to integrate the
promotion of energy effi ciency and the use of clean
energy sources with the reduction of emissions of air
pollutants and carbon dioxide from the production
of energy.
The key thrusts of the NEEC are as follows:
i) Promotion of energy conservation through the
effi cient use of energy in the industrial, building,
transportation and consumer sectors.
ii) Promotion of the use of cleaner energy sources
such as natural gas and renewable energy sources.
iii) Promotion of Singapore as a location for the pilot
test bedding of pioneering energy technologies
and as a hub for the development and
commercialisation of clean energy technologies.
RCD coordinates and facilitates the NEEC’s programmes
and provides secretariat support to the NEEC and its
Sub-committees and Workgroups.
Energy Efficiency Initiatives
In 2005, the following energy effi ciency initiatives were
launched under the umbrella of the NEEC:
(a) Energy Efficiency Improvement Assistance
Scheme
The Energy Effi ciency Improvement Assistance
Scheme (EASe) was launched by Assoc. Prof. Koo Tsai
Kee, Senior Parliamentary Secretary (MEWR) at the
Energy Management Best Practices and Technologies
Seminar in April 2005. The $10m co-funding scheme
gives incentives to manufacturers and building
owners to carry out detailed studies on their energy
consumption and identify specifi c areas for energy
effi ciency improvement and energy cost savings.
EASe is administered by NEA. The energy studies could
be carried out by experts in-house or externally by
Accredited Energy Services Companies (ESCOs).
(b) Energy Labelling Scheme
With increasing awareness and demand for energy
effi cient and ‘Green’ products, the Singapore
Environment Council (SEC) introduced the Associate
Green Corners Programme in July 2005. Participating
retailers must have at least 35% of their displayed
appliance models labelled under the Energy Labelling
Scheme. Currently, there are 8 Green Corner retail
stores and 17 Associate Green Corners in Singapore.
An Energy Labelled Home Appliances Exhibition was
held during the launch of the Clean and Green Week
2005 on 5 - 6 November 2005 at Bedok Reservoir.
Resource Conservation
Location of Green Corners

38Environmental Protection Division Annual Report 2005
Resource Conservation
Energy Labelled Home Appliances Exhibition
Location of Associate Green Corners

39Environmental Protection Division
Annual Report 2005
Resource Conservation
Dr Yaacob Ibrahim, Minister (MEWR) visited the Energy
Effi cient Products Information Center (EEPIC) at Hong
Tar’s store in IMM Building on 25 May 2005. Minister
was briefed by SEC and storeowners on the EEPIC and
was informed that shoppers found the information on
energy effi cient appliances useful.
(c) Fuel Economy Labelling Scheme
The labelling scheme is a voluntary labelling scheme
administered by SEC to promote fuel-effi cient cars.
As of December 2005, 99 car models were issued with
the Fuel Economy Label, representing 24% of the car
models in the market.
The SEC organised the Green Transport Day 2005 on
15 April 2005 at the Shaw House Amphitheatre. This
event promoted green transportation and encouraged
car buyers to select more fuel-effi cient cars and drive
efficiently. An exhibition held from 15 - 24 April
showcased green vehicles registered under the Fuel
Economy Labelling Scheme.
(d) Energy Smart Buildings Scheme
Assoc Prof Koo Tsai Kee, Senior Parliamentary Secretary
Minister’s visit at Hong Tar EEPIC
(MEWR) launched the Energy Smart Buildings Scheme
at the Environment Building in December 2005. Jointly
developed by the National Environment Agency and the
Energy Sustainability Unit of the National University of
Singapore, the scheme gives recognition to buildings
in the top 25 per cent of their category for achieving
exemplary energy effi ciency without compromising
the indoor environmental quality.
For a start, the Scheme targeted offi ce buildings. It
would subsequently be extended to buildings such as
hotels, shopping complexes and hospitals. The fi rst
recipients of the award were Environment Building,
Revenue House, SIA Computer Centre, JTC Summit,
Alexandra Point, Fuji Xerox Tower, City House and
Republic Plaza.
An accreditation scheme for energy services companies
(ESCOs) was launched in April 2005. The Accredited
ESCOs will serve as independent assessors ensuring
that the Energy SMART Offi ce scheme is an accurate,
objective, and independently assessed system as well
as to provide energy services for the EASe scheme.
SPS unveils the Energy Smart Offi ce Label

40Environmental Protection Division Annual Report 2005
Proud winners of Energy Smart Office Label and Accredited ESCOs
RCD also supported a series of events, seminars and
demonstration projects on clean and renewable
energy. In September 2005, RCD and SEI jointly
organised a 1-day Building-Integrated Photovoltaics
(BIPV) Seminar cum Tour to promote solar architecture
among developers and architects.
In October 2005, RCD led a group of agencies and
research institutions (Economic Development Board
(EDB), JTC, HDB, The Enterprise Challenge (TEC) and
Agency for Science, Technology and Research (A*STAR))
to participate in the “World Hydrogen Technologies
Convention” to promote Singapore as a test-bedding
hub to the international hydrogen technologies
experts and companies participating in this event.
During the same month, RCD also supported
the Singapore-German Chamber of Industry and
Commerce “Renewable Energies - Made in Germany”
symposium where the Germany Energy Agency and
leading solar energy companies showcased their
latest solar technologies.
Resource Conservation
(d) Public Sector Pilot Project
RCD is assisting eight public sector agencies to call
tenders for the provision of energy saving performance
contracting services under the Public Sector Economy
Drive. Four public sector agencies, namely Ministry
of the Environment and Water Resources (MEWR),
Ministry of Finance (MOF), Ministry of Manpower
(MOM) and Singapore General Hospital (SGH) called
their tenders between June and November 2005. NEA
will continue to work with Civil Aviation Authority
of Singapore (CAAS), Inland Revenue Authority of
Singapore (IRAS), Monetary Authority of Singapore
(MAS) and Changi General Hospital (CGH) to call
tenders in FY 06.
(e) Awareness Building and Education
RCD worked with our partners on the following events
to raise awareness on energy effi ciency:
i) The Seminar on Energy Management Best
Practices & Technologies was held on 7 April 2005
at the Hotel Le Meridien. The topics presented
included case studies by owners of manufacturing
facilities and commercial buildings that had
implemented successful energy efficiency
improvement projects, as well as funding schemes
offered by NEA.
ii) The Seminar on Energy Smart Offi ce Buildings was
held on 16 December 2005 at the Environment
Building. The topics presented included the benefi ts
of the Energy Smart Buildings Scheme, as well as a
case study by a developer who had successfully
implemented several energy effi ciency improvement
projects.

41Environmental Protection Division
Annual Report 2005
InternationalCooperation
5

42Environmental Protection Division Annual Report 2005
International Cooperation
Overview
PDD spearheads NEA’s efforts to safeguard Singapore’s
environmental interests internationally. In 2004, NEA’s
active participation in international environmental for
a helped to strengthen Singapore’s environmental
cooperation with regional countries and international
organisations. This has enhanced Singapore’s standing
on matters relating to environmental policies,
management and technology in the international
arena.
Bilateral Cooperation
Malaysia
The Malaysia-Singapore Joint Committee on the
Environment Working Group (MSJCE WG), formed
under the auspices of the MSJCE, is co-chaired by
CEO of NEA and Director-General of Department of
Environment, Malaysia.
The MSJCE WG held its 3rd and 4th meetings on 29
- 30 August 2005 in Singapore and 14 - 15 November
2005 in Putrajaya, Malaysia respectively. The meetings
discussed environmental issues of mutual concern.
These included the control of vehicular emissions,
water quality in the Straits of Johor and the Skudai
River catchments and emergency response plans to
deal with chemical spills at the Second Crossing.
3rd MSJCE Working Group Meeting held on 29-30 August 2005 in Singapore.
Indonesia
The Indonesia-Singapore Working Group (ISWG) on
the Environment was formed to support the Indonesia-
Singapore Environment Partnership (ISEP) and to
develop joint programmes and activities under this
bilateral partnership initiative.
The 3rd Meeting of the ISWG was held on 20 - 21 July
2005 in Singapore. The Meeting was co-chaired by CEO,
NEA and Assistant to Minister for Global Environment
Affairs, Ministry of Environment, Indonesia. The
meeting discussed various areas of collaboration and
projects such as capacity building under the ISWG.
Regional CooperationASEAN Working Group on MultilateralEnvironmental Agreements (AWGMEA)
NEA participated in the 9th meeting of the AWGMEA
that was held on 18 - 19 May 2005 in Siem Reap,
Cambodia.
The meeting developed a list of common understanding
on various issues under the multilateral environmental
agreements (MEAs), namely the United Nations
Framework Convention on Climate Change , Montreal
Protocol on Substances that Deplete the Ozone Layer,
Basel Convention on the Control of Transboundary
Movement of Hazardous Wastes and their Disposal,
Rotterdam Convention on Prior Informed Consent
Procedure for Certain Hazardous Chemicals and
Pesticides in International Trade and Stockholm
Convention on Persistent Organic Pollutants.
The 9th meeting of the AWGMEA enabled ASEAN
member countries to better understand the current
concerns of other ASEAN member countries regarding
the various MEAs. It also enabled ASEAN member
countries to exchange information and experience on
dealing with MEA-related issues.
ASEAN Working Group on Environmentally Sustainable Cities (AWGESC)
Since its inception in 2003, Singapore has been
spearheading ASEAN’s Regional Environmentally
Sustainable Cities Programme (RESCP). An ASEAN
Working Group on Environmentally Sustainable
Cities (AWGESC), chaired by Singapore, was set
up to develop strategies and action plans to
drive the RESCP. A total of 24 cities in ASEAN are
currently participating in this Programme.

43Environmental Protection Division
Annual Report 2005
International Cooperation
At the 3rd meeting of the ASEAN Working Group on
Environmentally Sustainable Cities (AWGESC) held on
28 - 29 June 2005 in Hanoi, Vietnam, the Meeting
agreed to broaden the RESCP to beyond action
programmes and activities for Clean Air, Clean Water
and Clean Land, and to encompass philosophies,
strategies and policies of environmental sustainability
within ASEAN cities. In this regard, an ASEAN Initiative
on Environmentally Sustainable Cities (AIESC) was
established to replace the RESCP. Together with the
AIESC, NEA developed a website portal entitled
“ASEAN Network on Environmentally Sustainable
Cities” to facilitate the sharing of best practices and
promote capacity development for members.
The AWGESC, together with the ASEAN Secretariat
and the Ministry of Environment, Indonesia, jointly
organised a workshop to develop key environmental
indicators and awards criteria on 6 - 8 December
2005 in Jakarta, Indonesia. The workshop, attended
by representatives from the participating ASEAN cities
as well as representatives from various international
organisations, successfully developed a set of key
performance indicators on Clean Air, Clean Water and
Clean Land and award criteria guidelines to promote
environmental sustainability in ASEAN cities.
ASEAN Senior Officials on the Environment
(ASOEN)
Senior offi cials from NEA attended the Meeting of the
16thASEAN Senior Offi cials on the Environment (ASOEN)
held in Penang, Malaysia from 16 -18 August 2005.
A major outcome of the Meeting was the setting
up of the Panel of ASEAN Experts on Fire and
Haze Assessment and Coordination to undertake the
rapid assessment of the situation on the ground
during critical periods of fi res and haze, and provide
recommendations to facilitate immediate response
and effective mobilisation of resources in the region.
Informal ASEAN Ministerial Meeting on the
Environment (IAMME)
The Senior Parliamentary Secretary (SPS) of MEWR led
a delegation comprising senior offi cials from NEA to
Makati City, Philippines, for the 9th Informal ASEAN
Ministerial Meeting on the Environment (IAMME) on
Mr Loh Ah Tuan, Chairman for AWGESC, giving his opening address at the Workshop on Development of Key Indicators for Clean Air, Clean Water and Clean Land; and Awards to Promote Environmental Sustainability in ASEAN Cities in December 2005 in Jakarta.
27 September 2005. One of the key achievements of
the IAMME was the release of a Joint Communiqué
on Transboundary Haze Pollution by the ASEAN
Environment Ministers to demonstrate ASEAN’s
commitment and resolve to tackle the regional
haze problem. While at the meeting, SPS offi ciated
the launch of the web portal for the ASEAN
Network on Environmentally Sustainable Cities
http://www.aseansec.org/aiesc.htm
Sub-Regional Fire-Fighting Arrangements
(SRFA) for Sumatra and Borneo
The 16th and 17th Joint Meeting on the Sub-regional
Fire-fi ghting arrangements (SRFA) for Sumatra and
Borneo were held on 17 March 2005 in Singapore and
14 November 2005 in Bandar Seri Begawan, Brunei
Darussalam respectively.
Senior offi cials from Brunei Darussalam, Indonesia,
Malaysia and Singapore attended the meetings.
Thailand participated in the 17th meeting as a
new member to the SRFA. The meetings provided
opportunities for the offi cials to be updated on the
latest weather and smoke haze situation, as well
as review the progress made in implementing the
ASEAN Regional Haze Action Plan. One signifi cant
outcome from the 17th SRFA meeting was the adoption
of a set of trigger points for activating joint emergency
response as recommended by the Panel of Experts for
Fire and Haze Assessment and Coordination.
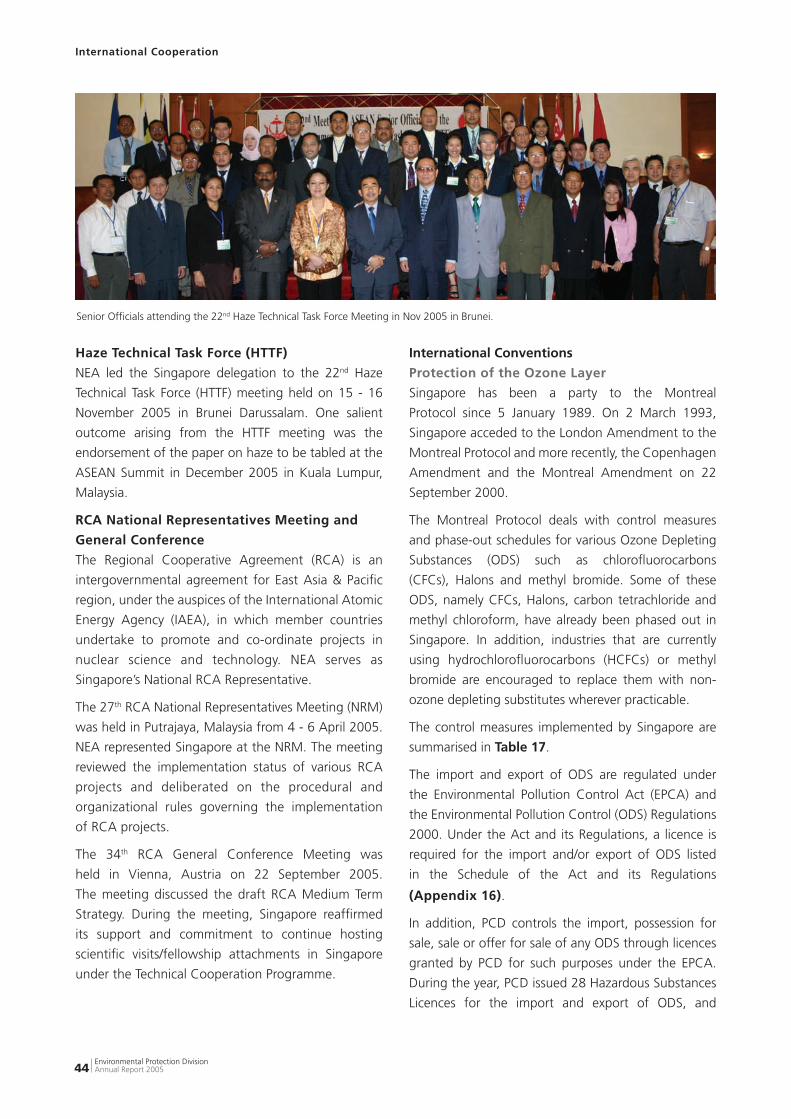
44Environmental Protection Division Annual Report 2005
Senior Offi cials attending the 22nd Haze Technical Task Force Meeting in Nov 2005 in Brunei.
International Cooperation
Haze Technical Task Force (HTTF)
NEA led the Singapore delegation to the 22nd Haze
Technical Task Force (HTTF) meeting held on 15 - 16
November 2005 in Brunei Darussalam. One salient
outcome arising from the HTTF meeting was the
endorsement of the paper on haze to be tabled at the
ASEAN Summit in December 2005 in Kuala Lumpur,
Malaysia.
RCA National Representatives Meeting and
General Conference
The Regional Cooperative Agreement (RCA) is an
intergovernmental agreement for East Asia & Pacifi c
region, under the auspices of the International Atomic
Energy Agency (IAEA), in which member countries
undertake to promote and co-ordinate projects in
nuclear science and technology. NEA serves as
Singapore’s National RCA Representative.
The 27th RCA National Representatives Meeting (NRM)
was held in Putrajaya, Malaysia from 4 - 6 April 2005.
NEA represented Singapore at the NRM. The meeting
reviewed the implementation status of various RCA
projects and deliberated on the procedural and
organizational rules governing the implementation
of RCA projects.
The 34th RCA General Conference Meeting was
held in Vienna, Austria on 22 September 2005.
The meeting discussed the draft RCA Medium Term
Strategy. During the meeting, Singapore reaffi rmed
its support and commitment to continue hosting
scientifi c visits/fellowship attachments in Singapore
under the Technical Cooperation Programme.
International Conventions
Protection of the Ozone Layer
Singapore has been a party to the Montreal
Protocol since 5 January 1989. On 2 March 1993,
Singapore acceded to the London Amendment to the
Montreal Protocol and more recently, the Copenhagen
Amendment and the Montreal Amendment on 22
September 2000.
The Montreal Protocol deals with control measures
and phase-out schedules for various Ozone Depleting
Substances (ODS) such as chlorofl uorocarbons
(CFCs), Halons and methyl bromide. Some of these
ODS, namely CFCs, Halons, carbon tetrachloride and
methyl chloroform, have already been phased out in
Singapore. In addition, industries that are currently
using hydrochlorofl uorocarbons (HCFCs) or methyl
bromide are encouraged to replace them with non-
ozone depleting substitutes wherever practicable.
The control measures implemented by Singapore are
summarised in Table 17.
The import and export of ODS are regulated under
the Environmental Pollution Control Act (EPCA) and
the Environmental Pollution Control (ODS) Regulations
2000. Under the Act and its Regulations, a licence is
required for the import and/or export of ODS listed
in the Schedule of the Act and its Regulations
(Appendix 16).
In addition, PCD controls the import, possession for
sale, sale or offer for sale of any ODS through licences
granted by PCD for such purposes under the EPCA.
During the year, PCD issued 28 Hazardous Substances
Licences for the import and export of ODS, and

45Environmental Protection Division
Annual Report 2005
Table 17Summary of Measures to Phase Out Ozone-Depleting Substances
*Note: Quarantine applications - Include treatments to prevent the introduction, establishment, and/or spread of quarantine pests, or to ensure their offi cial control. Pre-shipment applications — These include non-quarantine methyl bromide applications within 21 days prior to export that are required to meet the offi cial requirements of the importing or exporting countries.
International Cooperation
Date Measure
5 October 1989 Quota Allocation System implemented for Chlorofl uorocarbons (CFCs).
5 February 1991 Prohibit the import and manufacture of non-pharmaceutical aerosol products and polystyrene sheets/products containing controlled CFCs.
1 January 1992 (a) Prohibit the use of Halon 1301 for new fi re-protection systems. (b) Prohibit the import of Halon 2402.
1 January 1993 Prohibit the import of new air-conditioning and refrigeration equipment using CFC 11 and CFC 12.
1 January 1994 Prohibit the import of Halon 1211 and Halon 1301.
15 April 1994 Prohibit the import of fi re-extinguishers fi lled with Halon 1211.
1 January 1995 All new cars must be equipped with non-CFC air-conditioning systems.
1 April 1995 Prohibit the import of HBFCs.
1 January 1996 Prohibit the import of CFCs, carbon tetrachloride and 1,1,1-trichloroethane (methylchloroform).
1 January 2002 Freeze the consumption of Methyl Bromide (MeBr) for non-quarantine and pre-shipment (non-QPS) applications*.
electronically processed 1,687 inward and outward
declarations for the import and/or export of ODS
through the TradeNet computerised network system.
Control on Export, Import and Transit of
Hazardous Wastes (Basel Convention)
Singapore acceded to the Basel Convention on 2
January 1996. The Hazardous Waste (Control of
Export, Import and Transit) Act and its Regulations were
enacted and came into operation on 16 March 1998.
The Act and its Regulations enable Singapore to fulfi l
its obligations under the Basel Convention. Under the
Act and its Regulations, any person wishing to export,
import or transit any hazardous waste scheduled under
the Basel Convention is required to apply for a permit
from PCD.
During the year, PCD processed and issued 10 import,
18 export and 45 transit permits under the Basel
Convention.
Control of Persistent Organic Pollutants
The Stockholm Convention seeks to control and
ultimately eliminate the release of persistent organic
pollutants (POPs) into the environment. It sets out
control measures on the production, import, export,
disposal, and use of 10 commercially produced
POPs (8 pesticides and 2 industrial chemicals) and 2
unintentional by-products (furans and dioxins) from
waste incinerators and chemical plants. The Stockholm
Convention entered into force on 17 May 2004, ninety
days after France submitted the fi ftieth instrument
of ratifi cation, acceptance, approval or accession to
become a Party to the Stockholm Convention on 17
February 2004.
Singapore has banned the use of the 10 commercially
produced POP chemicals in Singapore well in advance
of the deposition of its instruments of ratifi cation and
accession with the Secretary-General of the United
Nations in New York on 24 May 2005. The Convention
entered into force for Singapore on 22 Aug 2005 (i.e.
the 90th day after the date of deposit of the instruments).
PCD has already taken measures to limit the emission
46Environmental Protection Division Annual Report 2005
International Cooperation
of furans and dioxins from our incineration plants.
In keeping with internationally accepted practices
to control such emissions, PCD has introduced air
emission standards under the Environmental Pollution
Control (Air Impurities) Regulations 2000 to limit
dioxins and furans releases.
Control on International Trade in Hazardous Chemicals and Pesticides (The Rotterdam Convention on Prior Informed Consent
Procedure)
The Rotterdam Convention on Prior Informed Consent
Procedure for Certain Hazardous Chemicals and
Pesticides in International Trade seeks to regulate the
international trade of 27 highly dangerous pesticides
and industrial chemicals using the Prior Informed
Consent (PIC) procedure. The Convention had entered
into force on 24 February 2004 and the list, after
further review, now contains 39 hazardous industrial
chemicals and pesticides.
None of the chemicals, except Ethylene Oxide
(ETO), is produced in Singapore. The ETO produced is
exported for approved medical and clinical sterilisation
uses only.
On 24 May 2005, Singapore deposited its instruments
of ratifi cation and accession with the Secretary-
General of the United Nations in New York. Similar
to Stockholm Convention, the Rotterdam Convention
entered into force for Singapore on 22 Aug 2005. PCD
is the Designated National Authority for the control of
the import and re-export of these 39 highly dangerous
pesticides and chemicals. PCD will only grant a licence
to a company to import and re-export any of the 39
controlled chemicals if it abides by the PIC procedure.
During the year, PCD approved 7 applications of
export of chemicals controlled under the Rotterdam
Convention. The exports were granted in accordance
with the PIC procedure under the Rotterdam
Convention.

47Environmental Protection Division
Annual Report 2005
Appendices
6

48Environmental Protection Division Annual Report 2005
Appendix 1
ORGANISATION CHARTENVIRONMENTAL PROTECTION DIVISION
Head Planning & Development DepartmentChua Yew Peng
Head Pollution Control DepartmentJoseph Hui
Head Resource Conservation DepartmentOng Seng Eng
Head Waste Management DepartmentLow Fong Hon
Chief EngineerPolicy PlanningHo Cheng Hoon
Chief Engineer Central Building Plan UnitYau Tai Yin
Chief Engineer External CooperationBin Chee Kwan
Chief Engineer Industry & Manpower DevelopmentBin Chee Kwan
Chief Engineer InspectorateJothieswaran Poobalasingam
Chief Engineer Chemical ControlTan Quee Hong
Chief Scientifi c Offi cer Environmental Monitoring & Assessment UnitIndrani Rajaram
Chief EngineerWaste Minimistation Vincent Teo
Chief EngineerEnergy Conservation Ananda Ram Bhaskar
Chief EngineerWaste Reclamation Cheong Hock Lai
Chief EngineerIP Industry Regulatory Unit / Licensing & Regulation Ong Soo San
Chief EngineerProjects Chua Soon Wah
Director - General
Loh Ah Tuan

49Environmental Protection Division
Annual Report 2005
Ap
pe
nd
ix 2
OR
GA
NIS
AT
ION
CH
AR
T O
F P
OLL
UT
ION
CO
NT
RO
L D
EPA
RT
ME
NT
H
EA
D
Insp
ect
ora
teC
he
mic
al
Co
ntr
ol
En
forc
em
en
tM
SJC
E/IS
JCE/
WG
EMA
SEA
N M
atte
rs/P
roje
cts
Haz
ard
ou
s Su
bst
ance
sTo
xic
Was
tes
• En
forc
e po
llutio
n co
ntro
l leg
isla
tion
• Im
plem
ent
air
and
wat
er p
ollu
tion
cont
rol p
rogr
amm
es e
.g. i
nspe
ctio
ns,
wat
er s
ampl
ings
& e
mis
sion
tes
ting,
su
rvei
llanc
es o
f ru
ral a
reas
, bac
kyar
d in
dust
ries
and
indu
strie
s•
Inve
stig
ate
com
plai
nts
of a
ir an
d w
ater
pol
lutio
n
• In
vest
igat
e co
mpl
aint
s of
noi
se
pollu
tion
from
con
stru
ctio
n si
tes
• Fo
rmul
ate
and
impl
emen
t
pro
gram
mes
/pro
ject
s on
en
viro
nmen
tal m
anag
emen
t
for
the
ASE
AN
Wor
king
Gro
up o
n
En
viro
nmen
tal M
anag
emen
t
• Fo
rmul
ate
and
impl
emen
t
prog
ram
mes
/pro
ject
s on
en
viro
nmen
tal c
o-op
erat
ion
for
the
Mal
aysi
a-Si
ngap
ore
Join
t C
omm
ittee
on t
he E
nviro
nmen
t an
d th
e
In
done
sia-
Sing
apor
e Jo
int
Com
mitt
ee
on
the
Env
ironm
ent
• C
ontr
ol v
ehic
ular
em
issi
ons
and
fuel
qual
ity
• Pl
an a
nd im
plem
ent
pr
ogra
mm
es s
uch
as h
azar
d
an
alys
is, s
afet
y re
view
, was
tes
audi
t, e
mer
genc
y &
spi
ll
resp
onse
, to
cont
rol h
azar
dous
subs
tanc
es
• A
ppro
ve a
nd c
heck
on
the
tr
ansp
orta
tion
of h
azar
dous
su
bsta
nces
.
• C
ontr
ol t
he im
port
, exp
ort,
sal
e,
ha
ndlin
g &
sto
rage
of
ha
zard
ous
chem
ical
s th
roug
h
lic
ence
s an
d pe
rmits
• Pl
an a
nd im
plem
ent
prog
ram
mes
such
as
haza
rd a
naly
sis,
saf
ety
revi
ew, w
aste
s au
dit,
em
erge
ncy
&
sp
ill r
espo
nse,
to
cont
rol t
oxic
was
tes
• A
ppro
ve a
nd c
heck
on
the
tr
ansp
orta
tion
and
disp
osal
of
toxi
c
w
aste
s
• Im
plem
ent
prog
ram
mes
to
phas
e-ou
t
ozon
e de
plet
ing
subs
tanc
es
• Im
plem
ent
prog
ram
mes
to
fulfi
l the
oblig
atio
ns o
f th
e Ba
sel C
onve
ntio
n
• U
nder
take
mon
itorin
g pr
ogra
mm
es t
o
as
sess
air
qual
ity a
nd t
he q
ualit
y of
the
inla
nd a
nd c
oast
al w
ater
s
• M
onito
r to
xic
trac
e co
ntam
inan
ts in
the
envi
ronm
ent
• Tr
ack
air
and
wat
er q
ualit
y tr
ends
to id
entif
y em
ergi
ng e
nviro
nmen
tal
pr
oble
ms
• Pr
ovid
e la
bora
tory
ser
vice
s fo
r
in
vest
igat
ions
and
enf
orce
men
t ac
tion
• U
nder
take
stu
dies
and
pro
ject
s re
late
d
to
env
ironm
enta
l qua
lity
• D
evel
op a
nd u
pgra
de m
onito
ring
met
hods
for
air
and
wat
er q
ualit
y
as
sess
men
t
Envi
ron
men
tal M
on
ito
rin
g
& A
sses
smen
t U
nit

50Environmental Protection Division Annual Report 2005
Ap
pe
nd
ix 3
HEA
D
OR
GA
NIS
AT
ION
CH
AR
T O
F P
LAN
NIN
G A
ND
DE
VE
LOP
ME
NT
DE
PAR
TM
EN
T
C
en
tra
l B
uil
din
g P
lan
Po
licy
an
d P
lan
nin
gE
xte
rna
l C
oo
pe
rati
on
Ind
ust
ry a
nd
Ma
np
ow
er
De
ve
lop
me
nt
Plan
nin
gB
uild
ing
Pla
nPo
licy
Plan
nin
g
Reg
ion
alR
esea
rch
Inte
rnat
ion
al/
Mu
ltila
tera
l En
viro
nm
enta
l A
gre
emen
t
Dev
elo
pm
ent
& 3
P Pa
rtn
ersh
ip
• A
sses
s en
viro
nmen
tal
impa
ct o
f ne
w
deve
lopm
ents
at
land
use
and
de
velo
pmen
t co
ntro
l sta
ges
• Im
pose
en
viro
nmen
tal
cont
rol
requ
irem
ents
on
new
dev
elop
men
ts
• Pr
oces
s se
wer
age
and
drai
nage
in
terp
reta
tion
plan
ap
plic
atio
ns
• Pr
ovid
e w
alk-
in
pre-
cons
ulta
tion
sess
ions
to
arch
itect
s an
d pr
ofes
sion
al
engi
neer
s on
bui
ldin
g pl
an s
ubm
issi
on
• Re
gist
er b
uild
ing
plan
s/de
taile
d pl
ans
on s
ewer
age,
dr
aina
ge a
nd
envi
ronm
enta
l hea
lth
• C
heck
bui
ldin
g pl
ans
for
com
plia
nce
with
po
llutio
n co
ntro
l re
quire
men
ts
• Pr
oces
s ap
plic
atio
ns
for
Tem
pora
ry
Occ
upat
ion
Perm
it/C
ertifi
cat
e of
St
atut
ory
Com
plet
ion
• D
evel
op &
rev
iew
env
ironm
enta
l pol
icie
s,
stan
dard
s &
str
ateg
ies
• D
evel
op v
ehic
ular
em
issi
on c
ontr
ol
prog
ram
mes
• D
evel
op g
reen
veh
icle
pro
gram
mes
• A
tten
d to
tec
hnic
al m
atte
rs p
erta
inin
g to
M
ontr
eal P
roto
col
• C
oord
inat
e im
plem
enta
tion
of M
EAs
• Re
pres
ent
NEA
/pro
vide
sup
port
at
mul
tilat
eral
, reg
iona
l and
bila
tera
l mee
tings
• C
oord
inat
e &
ove
rsee
bila
tera
l/reg
iona
l en
viro
nmen
tal c
oope
ratio
n &
oth
er r
egio
nal
activ
ities
• Tr
ack
& f
orm
ulat
e re
spon
ses
to r
egio
nal
and
bila
tera
l iss
ues
• Le
ad a
nd c
oord
inat
e de
velo
pmen
t of
5
key
envi
ronm
enta
l ind
ustr
y se
ctor
s: W
aste
M
anag
emen
t &
Rec
yclin
g, E
nerg
y Se
rvic
e,
Pollu
tion
Con
trol
and
Pub
lic H
ealth
• Id
entif
y an
d pr
omot
e cr
eatio
n of
new
jo
bs in
the
env
ironm
enta
l sec
tors
for
Si
ngap
orea
ns a
nd P
Rs
• D
evel
op t
he lo
cal e
nviro
nmen
tal
tech
nolo
gy s
ecto
r th
roug
h In
nova
tion
for
Envi
ronm
enta
l Sus
tain
abili
ty F
und,
te
st-b
eddi
ng p
roje
cts
and
join
t re
sear
ch
prog
ram
mes
with
ter
tiary
inst
itutio
ns a
nd
rese
arch
org
anis
atio
ns

51Environmental Protection Division
Annual Report 2005
Ap
pe
nd
ix 4
HEA
D
OR
GA
NIS
AT
ION
CH
AR
T O
F R
ES
OU
RC
E C
ON
SE
RV
AT
ION
DE
PAR
TM
EN
T
Wa
ste
Min
imis
ati
on
En
erg
y C
on
serv
ati
on
Rec
yclin
g P
rog
ram
me
Rec
yclin
g I
nd
ust
ryG
reen
Pac
kag
ing
Pr
od
uct
ion
Ener
gy
Effi
cien
cyC
lean
er E
nerg
yC
lim
ate
Cha
nge
Uni
t
• Fo
rmu
late
& i
mp
lem
ent
w
aste
rec
yclin
g i
nit
iati
ves
&
pro
gra
mm
es
• Pr
om
ote
was
te r
ecyc
ling
in
ho
use
ho
lds,
com
mer
cial
, in
du
stri
al
and
pPu
blic
sec
tors
• Pl
an,
pro
mo
te a
nd
co
ord
inat
e th
e
dep
loym
ent
of
recy
clin
g
bin
s in
pu
blic
pla
ces
• Fa
cilit
ate
dev
elo
pm
ent
of
recy
clin
g f
acili
ties
• M
anag
e &
dev
elo
p
Sa
rim
bu
n R
ecyc
ling
Par
k
• C
olle
ct a
nd
an
alys
e
w
aste
sta
tist
ics
&
re
cycl
ing
rat
es
• In
no
vati
ve g
reen
tech
no
log
ies
• G
reen
pra
ctic
es s
uch
as e
co l
abel
ing
• Pr
od
uct
an
d p
acka
gin
g
re
-des
ign
to
red
uce
was
te
• Pr
od
uct
ste
war
dsh
ip
• D
evel
op
str
ateg
ies
and
p
rog
ram
mes
fo
r en
erg
y
effi
cien
cy
• Pr
om
ote
en
erg
y ef
fici
ent
tech
no
log
ies
• Pr
om
ote
en
erg
y
effi
cien
cy
in
th
e B
uild
ing
s,
Co
nsu
mer
, In
du
stri
al,
Tr
ansp
ort
atio
n,
and
Pub
lic s
ecto
rs
• Se
cret
aria
t su
pp
ort
fo
r
the
NEE
C
• D
evel
op
str
ateg
ies
and
pro
gra
mm
es f
or
clea
ner
en
erg
y
• Pr
om
ote
cle
aner
ener
gy
in t
he
Bu
ildin
gs,
Co
nsu
mer
, In
du
stri
al,
Tran
spo
rtat
ion
, an
d
Pu
blic
sec
tors
• Pr
om
ote
dev
elo
pm
ent
and
tes
t-b
edd
ing
of
pro
mis
ing
en
erg
y
tech
no
log
ies
• D
evel
op
str
ateg
ies
and
pro
gra
mm
es t
o
en
sure
Sin
gap
ore
mee
t
it
s o
blig
atio
ns
un
der
the
Un
ited
Nat
ion
s
Fr
amew
ork
Co
nve
nti
on
on
Clim
ate
Ch
ang
e
(U
NFC
CC
) an
d t
he
Kyo
to P
roto
col
• C
oo
rdin
ate
the
pre
par
atio
n o
f Si
ng
apo
re’s
N
atio
nal
Co
mm
un
icat
ion
to
th
e U
NFC
CC
• C
om
pile
Sin
gap
ore
’s
in
ven
tory
of
gre
enh
ou
se
g
as e
mis
sio
ns
• C
om
mis
sio
n s
tud
ies
to
as
cert
ain
th
e lo
cal
imp
acts
o
f g
lob
al c
limat
e ch
ang
e •
Imp
lem
ent
pro
gra
ms
to
ra
ise
pu
blic
aw
aren
ess
on
clim
ate
chan
ge
issu
es
• Pr
om
ote
th
e d
evel
op
men
t
of
Cle
an D
evel
op
men
t
M
ech
anis
m (
CD
M)
p
roje
cts
HEA
D
Wa
ste
Min
imis
ati
on
En
erg
y C
on
serv
ati
on
Re
cycl
ing
Pro
gra
mm
eR
ecy
clin
g I
nd
ust
ryE
ne
rgy
Eff
icie
ncy
Cle
an
er
En
erg
yC
lim
ate
Ch
an
ge
Un
itG
ree
n P
ack
ag
ing
a
nd
Pro
du
ctio
n
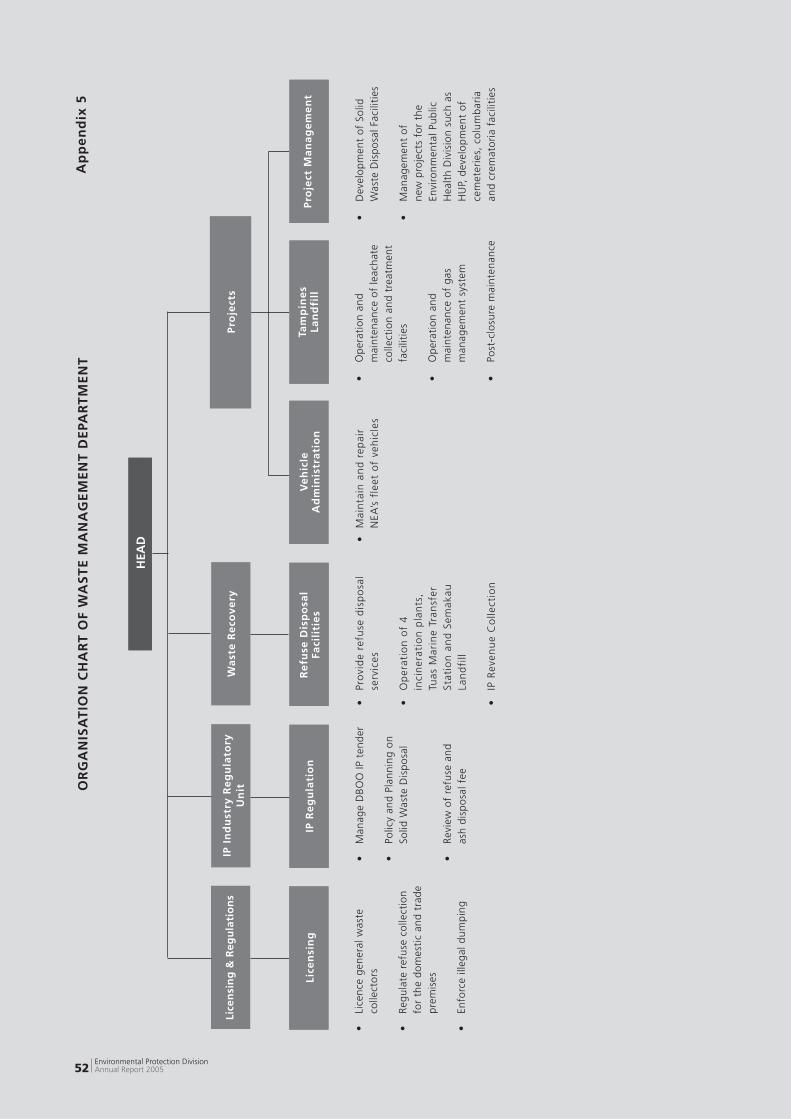
52Environmental Protection Division Annual Report 2005
Ap
pe
nd
ix 5
HEA
D
OR
GA
NIS
AT
ION
CH
AR
T O
F W
AS
TE
MA
NA
GE
ME
NT
DE
PAR
TM
EN
T
Rec
yclin
g P
rog
ram
me
Rec
yclin
g I
nd
ust
ryG
reen
Pac
kag
ing
Pr
od
uct
ion
Ener
gy
Effi
cien
cyC
lean
er E
nerg
yC
lim
ate
Cha
nge
Uni
t
Pro
ject
Ma
na
ge
me
nt
Lice
nsi
ng
& R
egu
lati
on
sIP
In
du
stry
Re
gu
lato
ry
Un
itW
ast
e R
eco
ve
ryP
roje
cts
Lice
nsi
ng
IP R
eg
ula
tio
nR
efu
se D
isp
osa
l Fa
cili
tie
sV
eh
icle
A
dm
inis
tra
tio
nTa
mp
ine
s La
nd
fill
• Li
cen
ce g
ener
al w
aste
co
llect
ors
• R
egu
late
ref
use
co
llect
ion
for
the
do
mes
tic
and
tra
de
pre
mis
es
• En
forc
e ill
egal
du
mp
ing
• M
anag
e D
BO
O IP
ten
der
• Po
licy
and
Pla
nn
ing
on
Solid
Was
te D
isp
osa
l
• R
evie
w o
f re
fuse
an
d
as
h d
isp
osa
l fee
• Pr
ovi
de
refu
se d
isp
osa
l
serv
ices
• O
per
atio
n o
f 4
inci
ner
atio
n p
lan
ts,
Tu
as M
arin
e Tr
ansf
er
Stat
ion
an
d S
emak
au
La
nd
fill
• IP
Rev
enu
e C
olle
ctio
n
• M
ain
tain
an
d r
epai
r
N
EA’s
fle
et o
f ve
hic
les
• O
per
atio
n a
nd
m
ain
ten
ance
of
leac
hat
e co
llect
ion
an
d t
reat
men
t fa
cilit
ies
• O
per
atio
n a
nd
m
ain
ten
ance
of
gas
m
anag
emen
t sy
stem
• Po
st-c
losu
re m
ain
ten
ance
• D
evel
op
men
t o
f So
lid
Was
te D
isp
osa
l Fac
iliti
es
• M
anag
emen
t o
f n
ew p
roje
cts
for
the
Envi
ron
men
tal P
ub
lic
Hea
lth
Div
isio
n s
uch
as
HU
P, d
evel
op
men
t o
f ce
met
erie
s, c
olu
mb
aria
and
cre
mat
ori
a fa
cilit
ies
HEA
D

53Environmental Protection Division
Annual Report 2005
Appendix 6
STANDARD OF CONCENTRATION OF AIR IMPURITIES
Substance Trade, Industry, Process, Emission Limits Fuel Burning Equipment or Industrial Plant
(a) Ammonia and ammonium Any trade, industry or process 76 mg/Nm3 expressed as ammonia compounds
(b) Antimony and its compounds Any trade, industry or process 5 mg/Nm3 expressed as antimony
(c) Arsenic and its compounds Any trade, industry or process 1 mg/Nm3 expressed as arsenic
(d) Benzene Any trade, industry or process 5 mg/Nm3
(e) Cadmium and its compounds Any trade, industry or process 3 mg/Nm3 expressed as cadmium
(f) Carbon monoxide Any trade, industry, process or 625 mg/Nm3
fuel burning equipment
(g) Chlorine Any trade, industry or process 32 mg/Nm3
(h) Copper and its compounds Any trade, industry or process 5 mg/Nm3 expressed as copper (i) Dioxins and furans Any waste incinerator (i) 1.0 ng TEQ/Nm3 for waste incinerators commissioned before 1st Jan 2001
(ii) 0.1 ng TEQ/Nm3 for waste incinerators commissioned on or after 1st Jan 2001
(j) Ethylene oxide Any trade, industry or process 5 mg/Nm3
(k) Fluorine, hydrofl uoric acid or Any trade, industry or process 50 mg/Nm3 expressed as inorganic fl uorine compounds hydrofl uoric acid
(l) Formaldehyde Any trade, industry or process 20 mg/Nm3
(m) Hydrogen chloride Any trade, industry or process 200 mg/Nm3
(n) Hydrogen sulphide Any trade, industry or process 7.6 mg/Nm3
(o) Lead and its compounds Any trade, industry or process 5 mg/Nm3 expressed as lead
(p) Mercury and its compounds Any trade, industry or process 3 mg/Nm3 expressed as mercury
(q) Oxides of nitrogen Any trade, industry, process or 700 mg/Nm3 expressed as fuel burning equipment nitrogen dioxide
(r) Particulate substances including Any trade, industry, process, (i) 100 mg/Nm3 ;or smoke, soot, dust, ash, fl y-ash, fuel burning equipment or (ii) where there is more than one fl ue, cinders, cement, lime, alumina, industrial plant (except for any duct or chimney in any scheduled grit and other solid particles cold blast foundry cupolas) premises, the total mass of the of any kind particulate emissions from all of such fl ue, duct or chimney divided by the total volume of such emissions shall not exceed 100mg/Nm3 and the particulate emissions from each of such fl ue, duct or chimney shall not exceed 200 mg/Nm3 at any point in time.
(s) Smoke All stationary fuel-burning sources Standard Ringelmann No 1 or equivalent opacity (Not to exceed more than 5 mins in any period of one hour, 3 times a day)
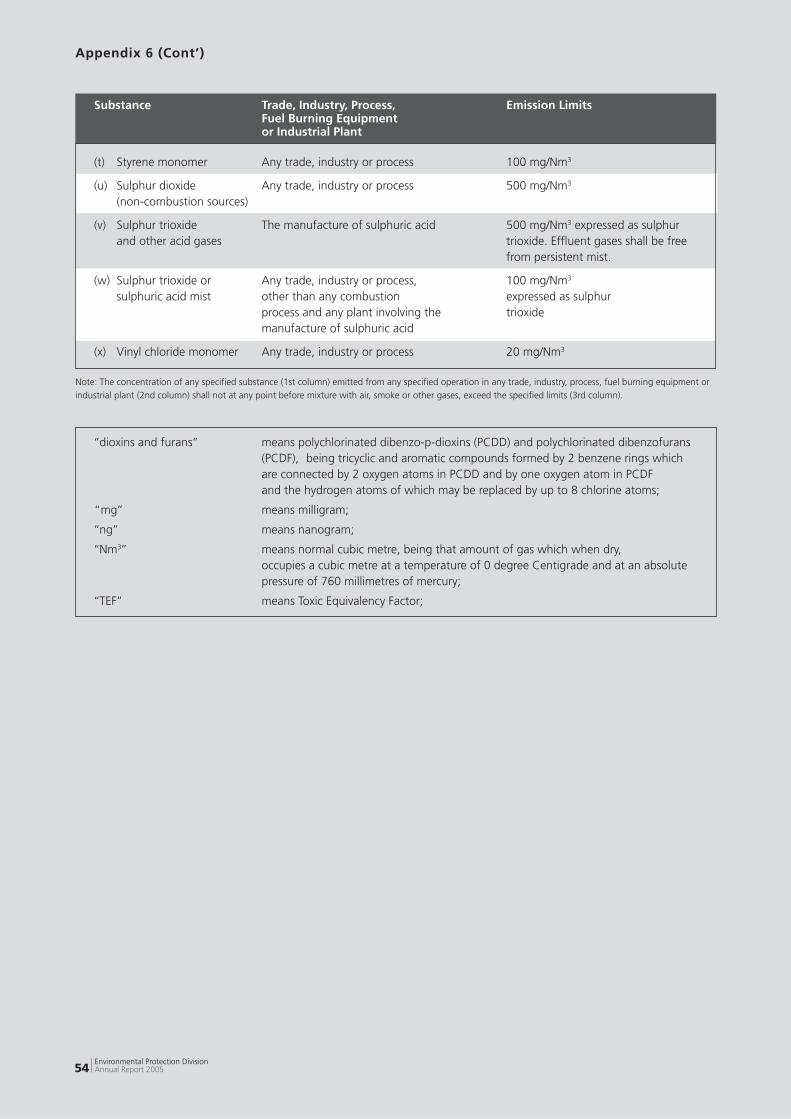
54Environmental Protection Division Annual Report 2005
Appendix 6 (Cont’)
Substance Trade, Industry, Process, Emission Limits Fuel Burning Equipment or Industrial Plant
(t) Styrene monomer Any trade, industry or process 100 mg/Nm3
(u) Sulphur dioxide Any trade, industry or process 500 mg/Nm3
(non-combustion sources)
(v) Sulphur trioxide The manufacture of sulphuric acid 500 mg/Nm3 expressed as sulphur and other acid gases trioxide. Effl uent gases shall be free from persistent mist.
(w) Sulphur trioxide or Any trade, industry or process, 100 mg/Nm3
sulphuric acid mist other than any combustion expressed as sulphur process and any plant involving the trioxide manufacture of sulphuric acid
(x) Vinyl chloride monomer Any trade, industry or process 20 mg/Nm3
Note: The concentration of any specifi ed substance (1st column) emitted from any specifi ed operation in any trade, industry, process, fuel burning equipment or industrial plant (2nd column) shall not at any point before mixture with air, smoke or other gases, exceed the specifi ed limits (3rd column).
‘‘dioxins and furans’’ means polychlorinated dibenzo-p-dioxins (PCDD) and polychlorinated dibenzofurans (PCDF), being tricyclic and aromatic compounds formed by 2 benzene rings which are connected by 2 oxygen atoms in PCDD and by one oxygen atom in PCDF and the hydrogen atoms of which may be replaced by up to 8 chlorine atoms;
“mg’’ means milligram;
‘‘ng’’ means nanogram;
‘‘Nm3’’ means normal cubic metre, being that amount of gas which when dry, occupies a cubic metre at a temperature of 0 degree Centigrade and at an absolute pressure of 760 millimetres of mercury;
‘‘TEF’’ means Toxic Equivalency Factor;

55Environmental Protection Division
Annual Report 2005
Appendix 7
LIST OF PREMISES CLASSIFIED AS SCHEDULED PREMISES UNDER THE ENVIRONMENTAL POLLUTION CONTROL ACT
Scheduled Premises are any premises :-
(a) being used for :
(i) cement works, being works for the manufacture or packing of portland cement, similar cement or pozzolanic materials;
(ii) concrete works, being works for the manufacture of concrete and of each batch capacity greater than 0.5 cubic metre;
(iii) asphalt works, being works for the manufacture of asphalt or tarmacadam;
(iv) ceramic works, being works in which any products such as bricks, tiles, pipes, pottery goods, refractories or glass are manufactured in furnaces or kilns fi red by any fuel; (v) chemical works, being works in which acids, alkali, chemical fertilizer, soap, detergent, sodium silicates, lime or other calcium compounds, chlorine, chemicals or chemical products are manufactured;
(vi) coke or charcoal works, being works in which coke and charcoal is produced and quenched, cut, crushed or graded;
(vii) ferrous and non-ferrous metal works, being works in which metal melting process for casting and/or metal coating are carried out;
(viii) gas works, being works in which coal, coke, oil or other mixtures or derivatives are handled or prepared for carbonisation or gasifi cation and in which such materials are subsequently carbonised or gasifi ed;
(ix) crushing, grinding and milling works, being works in which rock, ores, minerals, chemicals or natural grain products are processed by crushing, grinding, milling or separating into different sizes by sieving, air elutriation or in any other manner;
(x) petroleum works, being works in which crude or shale oil or crude petroleum or other mineral oil is refi ned or reconditioned;
(xi) scrap metal recovery works, being works in which scrap metals are treated in any type of furnace for recovery of metal irrespective of whether this is the primary object of any specifi c premises or not;
(xii) primary metallurgical works, being works in which ores are smelted or converted to metal of any kind;
(xiii) pulping works, being works in which wood or cellulose material is made into pulp;
(xiv) abrasive blasting works, being works in which equipment or structures are cleaned by abrasive blasting;
(b) on which there is erected any boiler of steam generating capacity of 2300 kilogrammes or more per hour, incinerator or furnace burning 500 kilogrammes or more of solid combustible material per hour or 220 kilogrammes or more of liquid material per hour;
(c) being used or intended to be used for storing:-
(i) more than 100 tonnes of one or more of the following substances:-
chemicals, chemical products, hydrocarbons or hydrocarbon products which are toxic or which produce toxic gases on burning or on contact with water or air; or
(ii) more than 1000 tonnes of one or more of the following substances: -chemicals, chemical products, hydrocarbons or hydrocarbon products with a fl ash point lower than 55º C.

56Environmental Protection Division Annual Report 2005
Appendix 8
NOTE: * The concentration of Toxic Metal shall not exceed the limits as shown, individually or in total.
‘Controlled Watercourse’ means a watercourse from which potable water supplied by PUB under the Public Utilities Act is obtained but does not include a watercourse from which water is pumped into a main of the PUB.
ALLOWABLE LIMITS FOR TRADE EFFLUENT DISCHARGED INTO A PUBLIC SEWER/WATERCOURSE/CONTROLLED WATERCOURSE
Public Sewer Watercourse Controlled Watercourse Items Of Analysis Units in milligram per litre or otherwise stated 1 Temperature of discharge 45ºC 45ºC 45ºC 2 Colour - 7 Lovibond Units 7 Lovibond Units 3 pH Value 6 - 9 6 - 9 6 - 9 4 BOD (5 days at 20ºC) 400 50 20 5 COD 600 100 60 6 Total Suspended Solids 400 50 30
7 Total Dissolved Solids 3000 - 1000
8 Chloride (as chloride ion) 1000 - 250
9 Sulphate (as SO4) 1000 - 200
10 Sulphide (as sulphur) 1 0.2 0.2
11 Cyanide (as CN) 2 0.1 0.1
12 Detergents (linear alkylate 30 15 5 sulphonate as methylene blue active substances)
13 Grease and Oil (Total) - 10 1 Grease and Oil (Hydrocarbon) 60 10 - Grease and Oil (Non-hydrocarbon) 100 - -
14 Arsenic 5 0.1 0.01
15 Barium 10 2 1
16 Tin 10 - 5
17 Iron (as Fe) 50 10 1
18 Beryllium 5 - 0.5
19 Boron 5 5 0.5
20 Manganese 10 5 0.5
21 Phenolic Compounds 0.5 0.2 Nil (expressed as phenol)
22 *Cadmium 1 0.1 0.003
23 *Chromium (trivalent and 5 1 0.05 hexavalent)
24 *Copper 5 0.1 0.1
25 *Lead 5 0.1 0.1
26 *Mercury 0.5 0.05 0.001
27 *Nickel 10 1 0.1
28 *Selenium 10 0.5 0.01
29 *Silver 5 0.1 0.1
30 *Zinc 10 1 0.5
31 *Metals in Total 10 1 0.5
32 Chlorine (Free) - 1 1
33 Phosphate (as PO4) - 5 2
34 Calcium (as Ca) - - 150
35 Magnesium (as Mg) - - 150
36 Nitrate (NO3) - - 20

57Environmental Protection Division
Annual Report 2005
The trade effl uent discharged must not include:-
(1) Calcium carbide.(2) Petroleum spirit or other infl ammable solvents.(3) Materials that may give rise to fi re or explosion hazards.(4) Materials that may be a hazard to human life, a public nuisance, injurious to health or otherwise objectionable. (5) Refuse, garbage, sawdust, timber, or any solid matter.(6) Pesticides, fungicides, insecticides, herbicide, rodenticide or fumigants.(7) Radioactive material.
The trade effl uent discharged into a public sewer must not include rainwater, storm water, ground water or other form of street drainage, subsurface drainage, roof drainage or yard drainage.
The trade effl uent shall be analysed in accordance with the latest edition of ‘Standard Methods for the Examination of Waterand Wastewater’ published jointly by the American Water Works Association and the Water Pollution Control Federation of the United States.
Appendix 8 (Cont’)

58Environmental Protection Division Annual Report 2005
Appendix 9
TRADE EFFLUENT TARIFF SCHEME
The fees to be levied for discharge of biodegradable trade effl uent into the public sewers are as follows:-
Concentration Fee at $ per cubic metre or part thereof (mg/l) BOD TSS
401 - 600 0.21 0.15
601 - 800 0.42 0.30
801 - 1000 0.63 0.45
1001 - 1200 0.84 0.60
1201 - 1400 1.05 0.75
1401 - 1600 1.26 0.90
1601 - 1800 1.47 1.05
1801 - 2000 1.68 1.20
2001 - 2200 1.89 1.35
2201 - 2400 2.10 1.50
2401 - 2600 2.31 1.65
2601 - 2800 2.52 1.80
2801 - 3000 2.73 1.95
3001 - 3200 2.94 2.10
3201 - 3400 3.15 2.25
3401 - 3600 3.36 2.40
3601 - 3800 3.57 2.55
3801 - 4000 3.78 2.70
NB: BOD = Biochemical Oxygen Demand (5 days at 20°C)TSS = Total Suspended Solids
Trade effl uent with BOD and TSS each in excess of 4000 mg/l shall be treated to below this standard at the factory prior to discharge into the public sewers.
Prior approval is required to dispose of organic sludge at designated Water Reclamation Plants/Sludge Treatment Works on the payment of a fee at a rate of $7.00 per cubic meter or part thereof.
Organic sludge means the organic matter in trade effl uent which has a minimum solid content of 3 per cent by weight or a maximum moisture content of 97 per cent by weight.

59Environmental Protection Division
Annual Report 2005
Appendix 10
HAZARDOUS SUBSTANCES LISTED IN THE 2ND SCHEDULE OF THE ENVIRONMENTAL POLLUTION CONTROL ACT
HAZARDOUS SUBSTANCES
Substance Exclusion
Acetic acid Substances containing not more than 80%, weight in weight, of acetic acid;
Preparations and solutions for photographic use.
Alkali metal bifl uorides; Ammonium bifl uoride; Preparations containing not more than 0.3%, weight in Potassium fl uoride; Sodium fl uoride; Potassium silicofl uoride; weight, of potassium fl uoride in radiator protectors; Sodium silicofl uoride; Silicofl uoric acid Preparations containing not more than 0.96%, weight in weight, of potassium fl uoride in photographic chemicals;
Substances containing not more than 3%, weight in weight, of sodium fl uoride or sodium silicofl uoride as a preservative;
Substances containing sodium fl uoride intended for the treatment of human ailments.
Ammonia Preparations and solutions of ammonia containing not more than 10%, weight in weight, of ammonia;
Refrigeration equipment; Photographic and plan developers;
Hair colour dyes;
Perm lotions;
Smelling bottles. Ammonium chlorate Ammonium nitrate Aqueous solutions containing less than 60%, weight in weight, of ammonium nitrate.
Ammonium perchlorate Anionic surface active agents Preparations containing less than 5% by weight of anionic surface active agents;
Preparations containing anionic surface active agents which are not less than 90% biodegradable under a test carried out in accordance with that part of the OECD method which is referred to as “Confi rmatory Test Procedure” in European Communities Council Directive No. 73/405/EEC (C) or other equivalent test methods acceptable to the Director. Antimony pentachloride Polishes Arsenical substances, the following: Pyrites ores or sulphuric acid containing arsenical Arsenic acid poisons as natural impurities; Animal feeding stuffs Arsenic sulphide containing not more than 0.005%, weight in weight, of Arsenic trichloride 4-hydroxy-3-nitrophenyl-arsonic acid and not containing Arsine any other arsenical poison;

60Environmental Protection Division Annual Report 2005
HAZARDOUS SUBSTANCES
Substance Exclusion
Appendix 10 (Cont’)
Calcium arsenite Animal feeding stuffs containing not more than 0.01%, Copper arsenate weight in weight, of arsanilic acid and not containing Copper arsenite any other arsenical poison; Lead arsenate Organic compounds of arsenic Animal feeding stuffs containing not more than 0.0375% Oxides of arsenic weight in weight, of carbarsone and not containing Potassium arsenite any other arsenical poison. Sodium arsenate Sodium arsenite Sodium thioarsenate Asbestos in the form of crocidolite, amosite, chrysotile Asbestos products containing chrysotile other than roofi ng and amphiboles and products containing these sheets, refuse chutes, ceiling boards, partition boards, forms of asbestos fi re barriers, doors, paints, cement, fl oor tiles and putty;
Asbestos in the form of chrysotile in any vehicle brake or clutch lining not installed in any vehicle if the packaging of the vehicle brake or clutch lining is affi xed with the appropriate label or in any vehicle brake or clutch lining installed in any vehicle registered before 1st April 1995.
The label to be affi xed on the packaging of the vehicle brake and clutch lining is in accordance with Part III of the Second Schedule of the EPCA.
Barium nitrate Preparations and solutions containing less than 10%, weight in weight, of barium nitrate.
Boric acid; Sodium borate Boric acid or sodium borate in medicinal preparations, cosmetics, toilet preparations and substances being preparations intended for human consumption;
Preparations containing boric acid or sodium borate or a combination of both where water or solvent is not the only other part of the composition.
Boron trichloride
Boron trifl uoride
Bromine; Bromine solutions
Cadmium-containing silver brazing alloy Captafol Carbamates Benomyl; Carbendazim; Chlorpropham; Propham; Thiophanate-methyl; Preparations containing not more than 1%, weight in weight, of propoxur and not containing any other carbamate;
Preparations containing not more than 1%, weight in weight, of methomyl and not containing any other carbamate. Carbon tetrafl uoride

61Environmental Protection Division
Annual Report 2005
HAZARDOUS SUBSTANCES
Substance Exclusion
Appendix 10 (Cont’)
Chlorinated hydrocarbons, the following: Aldrin Benzene hexachloride (BHC) Bromocyclen Camphechlor Chlorbenside Chlorbicyclen Chlordane Chlordecone Chlorfenethol Chlorfenson Chlorfensulphide Chlorobenzilate Chloropropylate Dicophane (DDT) pp’-DDT Dicofol Dieldrin Endosulfan Endrin Fenazafl or Fenson Fluorbenzide Gamma benzene hexachloride (Gamma - BHC) HEOD [1,2,3,4,10,10-hexachloro-6,7-epoxy-1,4,4a,5,6,7,8, 8a- octahydro-1, 4 (exo): 5,8 (endo)-dimethano naphthalene] HHDN [1,2,3,4,10,10-hexachloro-1,4,4a,5,8,8a-hexahydro-1, 4 (exo):5,8 (endo)-dimethano naphthalene] Heptachlor Isobenzan Isodrin Kelevan Methoxychlor [1,1,1-trichloro-2,2-di-(p-methoxyphenyl) ethane] Tetrachlordiphenylethane [TDE; 1,1-dichloro-2,2-bis (p-chlorophenyl) ethane] Tetradifon Tetrasul Toxaphene Allied chlorinated hydrocarbon compounds used as pesticides (insecticides, acaricides, etc.) Chlorine Chlorine used for chlorination of water in swimming pools.
Chlorine trifl uoride
Chlorobenzenes, the following: Monochlorobenzene Meta-dichlorobenzene Ortho-dichlorobenzene Trichlorobenzene Tetrachlorobenzene Pentachlorobenzene Hexachlorobenzene Chlorophenols, the following: Substances containing not more than 1%, weight Monochlorophenol in weight, of chlorophenols. Dichlorophenol
Paper impregnated with not more than 0.3%, weight in weight, of benzene hexachloride or gamma - BHC provided it is labelled with directions that no food, wrapped or unwrapped, or food utensils are to be placed on the treated paper, and that it is not to be used where food is prepared or served.

62Environmental Protection Division Annual Report 2005
HAZARDOUS SUBSTANCES
Substance Exclusion
Appendix 10 (Cont’)
Trichlorophenol Tetrachlorophenol Pentachlorophenol and their salts Chlorophenoxyacids; their salts, esters, amines Chloropicrin Chlorosilanes, the following: Hexachlorodisilane Phenyltrichlorosilane Tetrachlorosilane
Chlorosulphonic acid Chromic acid Substances containing not more than 9%, weight in weight, of chromic acid;
Photographic solutions containing chromic acid in individual containers containing not more than 15 kilograms each of such solutions and of aggregate weight of not more than 500 kilograms of such solutions.
Cyanides Ferrocyanides; Ferricyanides; Acetonitrile; Acrylonitrile; Butyronitrile; 2-Dimethylaminoacetonitrile; Isobutyronitrile; Methacrylonitrile; Propionitrile.
Diborane Dibromochloropropane Diethyl sulphate Dinitrocresols (DNOC); their compounds with a metal or a base Dinosam; its compounds with a metal or a base Dinoseb; its compounds with a metal or a base Diquat; its salts Drazoxolon; its salts Dressings on seeds.
Endothal; its salts Epichlorohydrin Ethyl mercaptan Substances containing less than 1%, weight in weight, of ethyl mercaptan
Ethylene dibromide

63Environmental Protection Division
Annual Report 2005
Appendix 10 (Cont’)
HAZARDOUS SUBSTANCES
Substance Exclusion
Ethylene dichloride Ethylene imine Ethylene oxide Mixtures of inert gases and ethylene oxide comprising not more than 12%, weight in weight, of ethylene oxide contained in cylinders of water capacity less than 47 litres and for aggregate of not more than 3 numbers of such cylinders.
Ferric chloride Fluorine Fluoroacetamide Formaldehyde Substances containing not more than 5%, weight in weight, of formaldehyde;
Photographic glazing or hardening solutions.
Formic acid Substances containing not more than 5%, weight in weight, of formic acid.
Germane Guanidine nitrate Hydrazine anhydrous; Hydrazine aqueous solutions Hydrochloric acid Substances containing not more than 9%, weight in weight, of hydrochloric acid.
Hydrofl uoric acid Preparations or solutions containing not more than 2%, weight in weight, of hydrofl uoric acid.
Hydrogen chloride Hydrogen cyanide; Hydrocyanic acid Preparations of wild cherry; In reagent kits supplied for medical or veterinary purposes, substances containing less than the equivalent of 0.1%, weight in weight, of hydrocyanic acid.
Hydrogen fl uoride Hydrogen peroxide Preparations and solutions containing not more than 20%, weight in weight, of hydrogen peroxide.
Hydrogen selenide Isocyanates Polyisocyanates containing less than 0.7%, weight in weight, of free monomeric diisocyanates;
Pre-polymerised isocyanates in polyurethane paints and lacquers;
Hardeners and bonding agents for immediate use in adhesives.

64Environmental Protection Division Annual Report 2005
Lead compounds in paint Lead compounds in paint in which the lead content is not more than 0.06% by weight of the paint;
Lead compounds in paint in which the container is affi xed with an appropriate label.
The labels to be used for paints containing lead compounds are in accordance with Part IV of the Second Schedule of the EPCA
Lead tetra-ethyl and similar lead containing compounds Lead tetra-ethyl and similar lead containing compounds in petrol intended for use in Singapore as fuel for motor vehicles Mercuric chloride; Mercuric iodide; Organic Dressings on seeds or bulbs; compounds of mercury Toilet, cosmetic and therapeutic preparations containing not more than 0.01%, weight in weight, of phenyl mercuric salts as a preservative;
Antiseptic dressings on toothbrushes; Textiles containing not more than 0.01%, weight in weight, of phenyl mercuric salts as a bacteriostat and fungicide.
Mercury and its compounds in batteries Batteries other than mercury oxide batteries, zinc carbon batteries containing more than 0.001% by weight of mercury per cell and alkaline batteries, except those in button form, containing more than 0.025% by weight of mercury per cell.
Metanil yellow (sodium salt of metanilylazo-diphenylamine) Dye-indicators used in laboratories
Methyl chloride Methyl mercaptan Substances containing less than 1%, weight in weight, of methyl mercaptan
Monomethyltetrachloro diphenyl methane Monomethyl-dichloro-diphenyl methane Monomethyl-dibromodiphenyl methane Niclofolan Nicotine sulphate Nitric acid Substances containing not more than 9%, weight in weight, of nitric acid.
Nitric oxide Nitrobenzene Substances containing less than 0.1%, weight in weight, of nitrobenzene;
Soaps containing less than 1%, weight in weight, of nitrobenzene;
Polishes and cleansing agents.
Appendix 10 (Cont’)
HAZARDOUS SUBSTANCES
Substance Exclusion

65Environmental Protection Division
Annual Report 2005
Nitrogen trifl uoride Ozone depleting substances, namely:
(a) Chlorofl uorocarbons, the following: Chloroheptafl uoropropane Chloropentafl uoroethane
Chlorotrifl uoromethane Dichlorodifl uoromethane Dichlorohexafl uoropropane Dichlorotetrafl uoroethane Heptachlorofl uoropropane
Hexachlorodifl uoropropane Pentachlorofl uoroethane Pentachlorotrifl uoropropane Tetrachlorodifl uoroethane Tetrachlorotetrafl uoropropane Trichlorofl uoromethane Trichloropentafl uoropropane Trichlorotrifl uoroethane (b) Halons, the following: Bromochlorodifl uoromethane
Bromochloromethane Bromotrifl uoromethane Dibromotetrafl uoroethane
(c) Hydrochlorofl uorocarbons, the following: 1,1-dichloro-1-fl uoro-ethane 1,1-dichloro-2,2,3,3,3-pentafl uoropropane 1,3-dichloro-1,2,2,3,3-pentafl uoropropane 1-chloro-1,1-difl uoro-ethane Chlorodifl uoroethane Chlorodifl uoromethane Chlorodifl uoropropane Chlorofl uoroethane Chlorofl uoromethane Chlorofl uoropropane Chlorohexafl uoropropane Chloropentafl uoropropane Chlorotetrafl uoroethane Chlorotetrafl uoropropane Chlorotrifl uoroethane Chlorotrifl uoropropane Dichlorodifl uoroethane Dichlorodifl uoropropane Dichlorofl uoroethane Dichlorofl uoromethane Dichlorofl uoropropane Dichloropentafl uoropropane Dichlorotetrafl uoropropane Dichlorotrifl uoroethane Dichlorotrifl uoropropane Hexachlorofl uoropropane Pentachlorodifl uoropropane Pentachlorofl uoropropane Tetrachlorodifl uoropropane Tetrachlorofl uoroethane
Appendix 10 (Cont’)
Products containing any ozone depleting substance other than the following products:
(a) in the case of chlorofl uorocarbons –
(i) air-conditioners in vehicles registered on or after 1st January 1995 or intended for such vehicles; (ii) equipment for domestic or commercial refrigeration or air-conditioning installed on or after 1st January 1993, or heat pump equipment, which contains any chlorofl uorocarbon substance as a refrigerant or in any insulating material of such equipment; (iii) refrigerators that have a compressor rating which exceeds one horsepower; (iv) non-pharmaceutical aerosol products; (v) insulation boards, panels or pipe covers; (vi) polystyrene sheets or fi nished products;
(b) in the case of Halons, portable fi re extinguishers; and
(c) in the case of bromotrifl uoromethane, fi re protection systems with building plans approved after 17th June 1991 and installed after 31st December 1991.
HAZARDOUS SUBSTANCES
Substance Exclusion

66Environmental Protection Division Annual Report 2005
Tetrachlorofl uoropropane Tetrachlorotrifl uoropropane Trichlorodifl uoroethane Trichlorodifl uoropropane Trichlorofl uoroethane Trichlorofl uoropropane Trichlorotetrafl uoropropane Trichlorotrifl uoropropane
(d) Hydrobromofl uorocarbons, the following: Bromodifl uoroethane Bromodifl uoromethane Bromodifl uoropropane Bromofl uoroethane Bromofl uoromethane Bromofl uoropropane Bromohexafl uoropropane Bromopentafl uoropropane Bromotetrafl uoroethane Bromotetrafl uoropropane Bromotrifl uoroethane Bromotrifl uoropropane Dibromodifl uoroethane Dibromodifl uoropropane Dibromofl uoroethane Dibromofl uoromethane Dibromofl uoropropane
Dibromopentafl uoropropane Dibromotetrafl uoropropane Dibromotrifl uoroethane Dibromotrifl uoropropane Hexabromofl uoropropane Pentabromodifl uoropropane Pentabromofl uoropropane Tetrabromodifl uoropropane Tetrabromofl uoroethane Tetrabromofl uoropropane Tetrabromotrifl uoropropane Tribromodifl uoroethane Tribromodifl uoropropane Tribromofl uoroethane Tribromofl uoropropane Tribromotetrafl uoropropane Tribromotrifl uoropropane
(e) Carbon tetrachloride
(f) 1,1,1-trichloroethane (methyl chloroform)
(g) Methyl bromide Oleum Orange II [sodium salt of p-(2-hydroxy-1-naphthylazo) Dye-indicators used in laboratories benzenesulphonic acid]
Appendix 10 (Cont’)
HAZARDOUS SUBSTANCES
Substance Exclusion

67Environmental Protection Division
Annual Report 2005
Appendix 10 (Cont’)
HAZARDOUS SUBSTANCES
Substance Exclusion
Preparations containing less than 1%, weight in weight, of phenols;
Phenols which are intended for the treatment of human ailments and other medical purposes;
Soaps for washing;
Tar (coal or wood), crude or refi ned;
Photographic solutions containing hydroquinone in individual containers containing not more than 15 kilograms each of such solutions and of aggregate weight of not more than 500 kilograms of such solutions.
Organic peroxides Car puttys;
Substances and preparations containing not more than 3%, weight in weight, of organic peroxides;
Solutions of not more than 60%, weight in weight, of methyl ethyl ketone peroxides and total aggregate weight of less than 50 kilograms of such solutions. Organo-tin compounds, the following: Compounds of fentin Cyhexatin Paraquat; its salts Preparation in pellet form containing not more than 5%, weight in weight, of salts of paraquat ion.
Perchloromethyl mercaptan Substances containing less than 1%, weight in weight, of perchloromethyl mercaptan
Phenols, the following: Catechol Cresol Hydroquinone Octyl phenol Phenol Resorcinol
Phosgene Phosphides Phosphine Phosphoric acid Substances containing not more than 50%, weight in weight, of phosphoric acid. Phosphorus compounds used as pesticides (insecticides, Acephate; acaricides, etc.) Bromophos; Iodofenphos; Malathion; Pirimiphos-methyl; Temephos; Tetrachlorvinphos; Trichlorfon;
Preparations containing not more than 0.5%, weight in weight, of chlorpyrifos and not containing any other phosphorus compound;
Preparations containing not more than 0.5%, weight in weight, of dichlorvos and not containing any other phosphorus compound;

68Environmental Protection Division Annual Report 2005
Appendix 10 (Cont’)
HAZARDOUS SUBSTANCES
Substance Exclusion
Materials impregnated with dichlorvos and not containing any other phosphorus compound for slow release;
Preparations containing not more than 1%, weight in weight, of azamethiphos and not containing any other phosphorus compound.
Phosphorus oxychloride Phosphorus pentachloride Phosphorus pentafl uoride Phosphorus trichloride Polybrominated biphenyls Polychlorinated biphenyls Polychlorinated terphenyls Potassium chlorate
Potassium hydroxide Substances containing not more than 17%, weight in weight, of potassium hydroxide;
Accumulators;
Batteries.
Potassium nitrate Preparations and solutions containing less than 5%, weight in weight, of potassium nitrate or a combination of both potassium nitrate and sodium nitrate.
Potassium nitrite Aqueous solutions containing less than 5%, weight in weight, of potassium nitrite.
Potassium perchlorate Prochloraz Sodium chlorate Sodium hydroxide Substances containing not more than 17%, weight in weight, of sodium hydroxide;
Made-up formulated preparations either liquid or solid for biochemical tests.
Sodium nitrate Preparations and solutions containing less than 5%, weight in weight, of sodium nitrate or a combination of both sodium nitrate and potassium nitrate
Sodium nitrite Aqueous solutions containing less than 5%, weight in weight, of sodium nitrite.
Sodium perchlorate Sulphur in diesel intended for use in Singapore as fuel for Sulphur in diesel in which the sulphur content is 0.005% motor vehicles or industrial plants or less by weight.
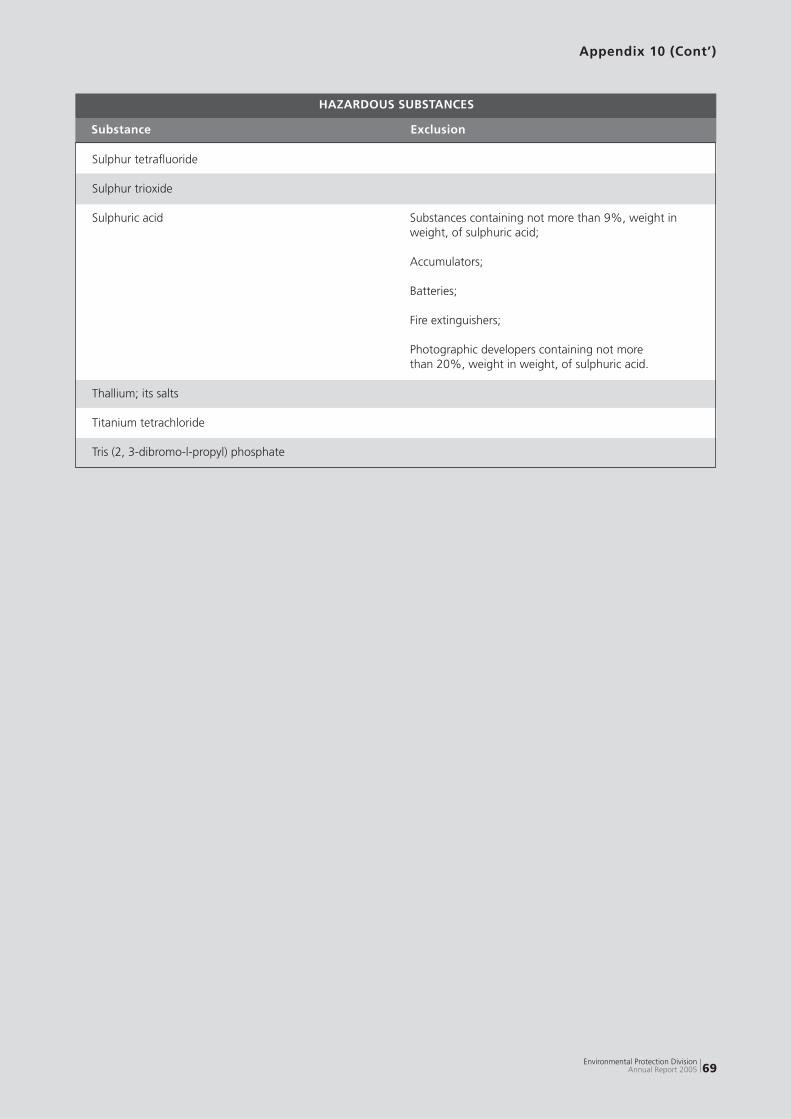
69Environmental Protection Division
Annual Report 2005
Sulphur tetrafl uoride Sulphur trioxide Sulphuric acid Substances containing not more than 9%, weight in weight, of sulphuric acid;
Accumulators;
Batteries;
Fire extinguishers;
Photographic developers containing not more than 20%, weight in weight, of sulphuric acid.
Thallium; its salts Titanium tetrachloride Tris (2, 3-dibromo-l-propyl) phosphate
Appendix 10 (Cont’)
HAZARDOUS SUBSTANCES
Substance Exclusion

70Environmental Protection Division Annual Report 2005
HAZARDOUS SUBSTANCES QUANTITIES EXCEEDING WHICH TRANSPORT APPROVAL IS REQUIRED
Appendix 11
Substance Qty (kgs) Substance Qty (kgs)
Acetic acid 1000 Hydrogen peroxide 1000
Ammonia 500 Hydrogen selenide 0
Antimony pentachloride 50 Isocyanates 500
Arsine 0 Lead tetra-ethyl and similar lead 0 containing compounds
Arsenical Substances 50 Metanil yellow (sodium salt of 5000 metanilylazo-diphenylamine)
Boric Acid; Sodium borate 5000 Methyl bromide 50
Boron trichloride 50 Methyl chloride 50
Boron trifl uoride 50 Methyl mercaptan 50
Bromine, bromine solutions 50 Monomethyltetrachloro diphenyl methane 0
Captafol 0 Monomethyl-dichloro-diphenyl methane 0
Carbamates except bendiocard, BPMC 0 Monomethyl-dibromo-diphenyl methane 0 (fenobucarb), mercaptodimethur (methiocarb)
Carbon tetrafl uoride 500 Nitric acid (95% or greater) 50
Chlorine 500 Nitric acid (less than 95%) 1000
Chlorine trifl uoride 50 Nitric oxide 0
Chlorinated hydrocarbon compounds 0 Nitrogen trifl uoride 50 used as pesticides
Chlorobenzenes 0 Oleum 50
Chlorophenols 0 Orange II (sodium salt of p-(2-hydroxy-1 5000 naphthylazo) benzenesulphonic acid)
Chlorophenoxyacids 0 Organic compounds of Mercury; 0 Mercuric chloride; Mercuric iodide
Chlorosilanes 50 Organic peroxides 500
Chlorosulphonic acid 50 Organo-tin compounds 0
Chromic acid 50 Perchloro methyl mercaptan 50
Cyanides 50 Phenols 500
Diborane 50 Phosgene 0
Dibromochloropropane 50 Phosphides 0
Diethyl sulphate 500 Phosphorous compounds except 0 Dimethoate, diazinon, Fenchlorophos, fenitrothion, Phenthoate, profenophos, Prothiophos, quinalphos
Epichlorohydrin 50 Phosphorus oxychloride 50
Ethyl mercaptan 50 Phosphorus pentachloride 50
Ethylene dibromide 0 Phosphorus pentafl uoride 50
Ethylene dichloride 0 Phosphorus trichloride 50
Ethylene imine 0 Polybrominated biphenyls 0
Ethylene oxide 50 Polychlorinated biphenyls 0
Ferric chloride 1000 Polychlorinated terphenyls 0
Fluorine 0 Potassium hydroxide 1000
Fluoroacetamide 0 Prochloraz 0
Formic acid 1000 Sodium hydroxide 1000
Germane 0 Sulphur in Diesel 0
Hydrazine anhydrous, hydrazine 50 Sulphur tetrafl uoride 0 aqueous solutions
Hydrochloric acid 1000 Sulphur trioxide 50
Hydrocyanic acid; Hydrogen cyanide 0 Sulphuric acid 1000
Hydrofl uoric acid 500 Titanium tetrachloride 1000
Hydrogen chloride, all forms 500 Tris(2,3-dibromopropyl) phosphate 0
NB: Defi nition and exemptions of Poisons in Part II List will also be extended to the above list.
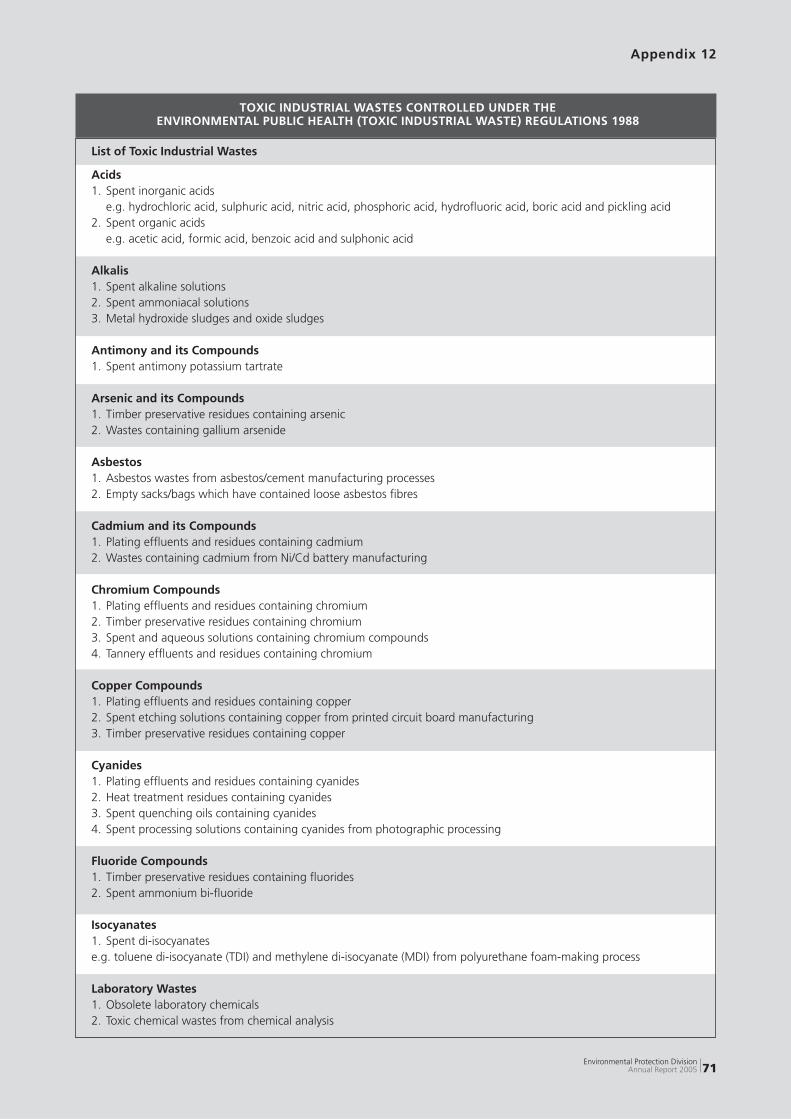
71Environmental Protection Division
Annual Report 2005
Appendix 12
TOXIC INDUSTRIAL WASTES CONTROLLED UNDER THE ENVIRONMENTAL PUBLIC HEALTH (TOXIC INDUSTRIAL WASTE) REGULATIONS 1988
List of Toxic Industrial Wastes
Acids 1. Spent inorganic acids e.g. hydrochloric acid, sulphuric acid, nitric acid, phosphoric acid, hydrofl uoric acid, boric acid and pickling acid 2. Spent organic acids e.g. acetic acid, formic acid, benzoic acid and sulphonic acid
Alkalis 1. Spent alkaline solutions 2. Spent ammoniacal solutions 3. Metal hydroxide sludges and oxide sludges
Antimony and its Compounds 1. Spent antimony potassium tartrate
Arsenic and its Compounds 1. Timber preservative residues containing arsenic 2. Wastes containing gallium arsenide
Asbestos 1. Asbestos wastes from asbestos/cement manufacturing processes 2. Empty sacks/bags which have contained loose asbestos fi bres Cadmium and its Compounds 1. Plating effl uents and residues containing cadmium 2. Wastes containing cadmium from Ni/Cd battery manufacturing
Chromium Compounds 1. Plating effl uents and residues containing chromium 2. Timber preservative residues containing chromium 3. Spent and aqueous solutions containing chromium compounds 4. Tannery effl uents and residues containing chromium
Copper Compounds 1. Plating effl uents and residues containing copper 2. Spent etching solutions containing copper from printed circuit board manufacturing 3. Timber preservative residues containing copper
Cyanides 1. Plating effl uents and residues containing cyanides 2. Heat treatment residues containing cyanides 3. Spent quenching oils containing cyanides 4. Spent processing solutions containing cyanides from photographic processing
Fluoride Compounds 1. Timber preservative residues containing fl uorides 2. Spent ammonium bi-fl uoride
Isocyanates 1. Spent di-isocyanates e.g. toluene di-isocyanate (TDI) and methylene di-isocyanate (MDI) from polyurethane foam-making process Laboratory Wastes 1. Obsolete laboratory chemicals 2. Toxic chemical wastes from chemical analysis
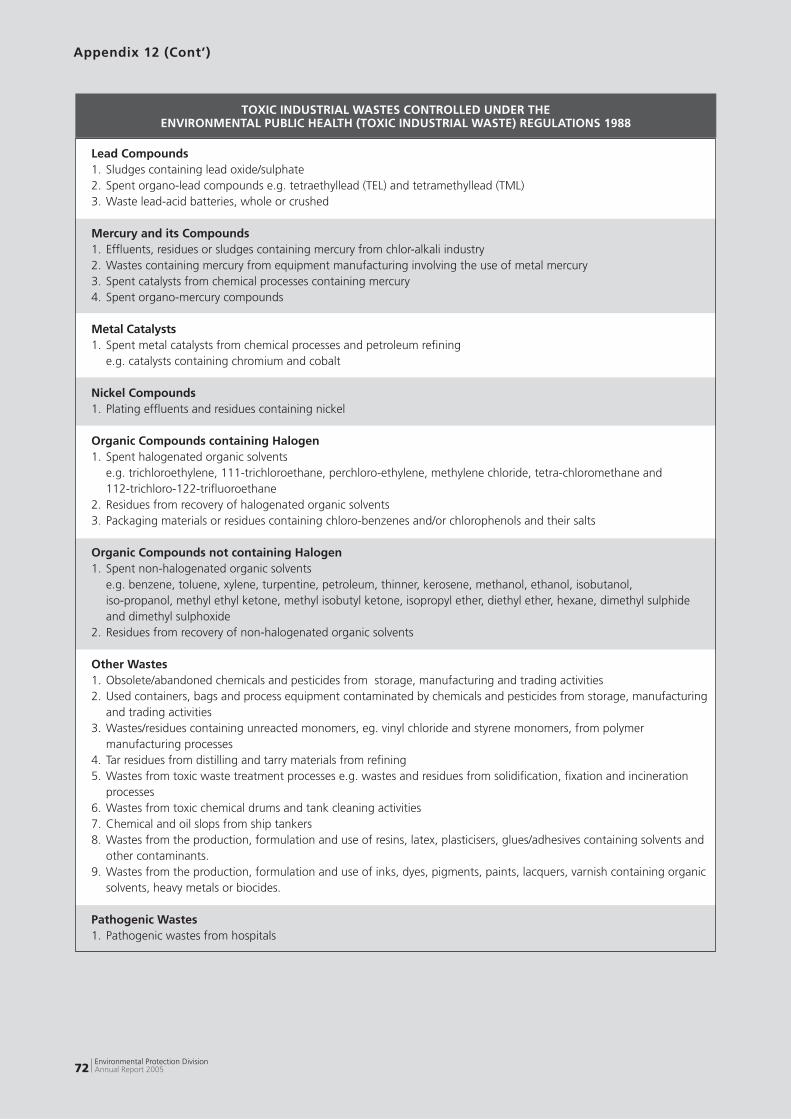
72Environmental Protection Division Annual Report 2005
TOXIC INDUSTRIAL WASTES CONTROLLED UNDER THE ENVIRONMENTAL PUBLIC HEALTH (TOXIC INDUSTRIAL WASTE) REGULATIONS 1988
Appendix 12 (Cont’)
Lead Compounds 1. Sludges containing lead oxide/sulphate 2. Spent organo-lead compounds e.g. tetraethyllead (TEL) and tetramethyllead (TML) 3. Waste lead-acid batteries, whole or crushed
Mercury and its Compounds 1. Effl uents, residues or sludges containing mercury from chlor-alkali industry 2. Wastes containing mercury from equipment manufacturing involving the use of metal mercury 3. Spent catalysts from chemical processes containing mercury 4. Spent organo-mercury compounds Metal Catalysts 1. Spent metal catalysts from chemical processes and petroleum refi ning e.g. catalysts containing chromium and cobalt
Nickel Compounds 1. Plating effl uents and residues containing nickel
Organic Compounds containing Halogen 1. Spent halogenated organic solvents e.g. trichloroethylene, 111-trichloroethane, perchloro-ethylene, methylene chloride, tetra-chloromethane and 112-trichloro-122-trifl uoroethane 2. Residues from recovery of halogenated organic solvents 3. Packaging materials or residues containing chloro-benzenes and/or chlorophenols and their salts
Organic Compounds not containing Halogen 1. Spent non-halogenated organic solvents e.g. benzene, toluene, xylene, turpentine, petroleum, thinner, kerosene, methanol, ethanol, isobutanol, iso-propanol, methyl ethyl ketone, methyl isobutyl ketone, isopropyl ether, diethyl ether, hexane, dimethyl sulphide and dimethyl sulphoxide 2. Residues from recovery of non-halogenated organic solvents
Other Wastes 1. Obsolete/abandoned chemicals and pesticides from storage, manufacturing and trading activities 2. Used containers, bags and process equipment contaminated by chemicals and pesticides from storage, manufacturing and trading activities 3. Wastes/residues containing unreacted monomers, eg. vinyl chloride and styrene monomers, from polymer manufacturing processes 4. Tar residues from distilling and tarry materials from refi ning 5. Wastes from toxic waste treatment processes e.g. wastes and residues from solidifi cation, fi xation and incineration processes 6. Wastes from toxic chemical drums and tank cleaning activities 7. Chemical and oil slops from ship tankers 8. Wastes from the production, formulation and use of resins, latex, plasticisers, glues/adhesives containing solvents and other contaminants. 9. Wastes from the production, formulation and use of inks, dyes, pigments, paints, lacquers, varnish containing organic solvents, heavy metals or biocides.
Pathogenic Wastes 1. Pathogenic wastes from hospitals

73Environmental Protection Division
Annual Report 2005
Phenolic Compounds 1. Sludges/residues from paint stripping using chemicals containing phenols 2. Residues containing unreacted phenol and formaldehyde from adhesive industry
Polychlorinated Bi-phenyl (PCB) including Poly-chlorinated Ter-phenyl (PCT) 1. Spent transformer oil containing PCB and/or PCT 2. Retrofi lled transformer contaminated with PCB and/or PCT 3. Electrical equipment and parts containing or contaminated with PCB and/or PCT e.g. Capacitors and transformers 4. Containers and all waste materials contaminated with PCB and/or PCT
Polyvinyl Chloride (PVC) 1. All waste materials containing PVC e.g. PVC insulated wires, PVC pipes and trunking, PVC parts, PVC upholstery and PVC resins
Silver Compounds 1. Spent processing solutions containing silver from photographic processing
Used, Contaminated Oil 1. Used mineral, lubricating and hydraulic oil from machine cylinders, turbines, switch gears and transformers 2. Spent motor oils from petrol and diesel engines 3. Spent quenching oil from metal hardening 4. Oil recovered from solvent degreasers 5. Spent oil water emulsions e.g. Spent coolants from metal working industries 6. Oil water mixtures (mainly oil) e.g. Oily ballast water from ship tankers 7. Oil and sludge from oil interceptors 8. Tankers sludges and oil sludges/residues from storage tanks 9. Oil sludges containing acid from recovery and recycling of used oil
Zinc Compounds 1. Plating effl uents and residues containing zinc
TOXIC INDUSTRIAL WASTES CONTROLLED UNDER THE ENVIRONMENTAL PUBLIC HEALTH (TOXIC INDUSTRIAL WASTE) REGULATIONS 1988
Appendix 12 (Cont’)

74Environmental Protection Division Annual Report 2005
Appendix 13
BOUNDARY NOISE LIMITS FOR FACTORY PREMISES
The maximum permissible boundary noise levels are as follows:
Maximum permissible noise level (reckoned as the equivalent continuous noise level over the Type of affected premises specifi ed period) in decibels (dBA)
Day Evening Night 7 am - 7 pm 7 pm - 11 pm 11 pm -7 am
Noise Sensitive Premises 60 55 50 Residential
Premises 65 60 55 Commercial
Premises 70 65 60
Maximum permissible noise level (reckoned as the equivalent continuous noise level over Type of affected premises 5 minutes) in decibels (dBA)
Day Evening Night 7 am - 7 pm 7 pm - 11 pm 11 pm -7 am
Noise Sensitive Premises 65 60 55
Residential Premises 70 65 60
Commercial Premises 75 70 65
Factory Premises 75 70 65
Appendix 13

75Environmental Protection Division
Annual Report 2005
MAXIMUM PERMISSIBLE NOISE LEVELS FROM CONSTRUCTION SITES
Since 1 Oct 2001, the permissible noise limits for evening (7 pm to 10 pm) and night time (10 pm to 7 am) for construction sites located within 150 m from any residential areas have been tightened. The old and new permissible noise limits with respect to residential areas are as shown:
Appendix 14
Existing Noise Limits Existing Noise Limits (Commenced before 1 Oct 2001) (Commenced on or after 1 Oct 2001) Time Noise Limits Time Noise Limits
7 am to 7 pm Leq 12 hr – 75 dBA 7 am to 7 pm Leq 12 hr – 75 dBA Leq 5 min – 90 dBA Leq 5 min – 90 dBA
7 pm to 7 am Leq 12 hr – 65 dBA 7 pm to 10 pm Leq 1 hr – 65 dBA Leq 5 min – 70 dBA
Leq 5 min – 70 dBA 10 pm to 7 am Leq 1 hr – 55 dBA Leq 5 min – 60 dBA

76Environmental Protection Division Annual Report 2005
Appendix 15
AMBIENT AIR QUALITY STANDARDS
Pollutants Averaging Time USEPA Primary Air Quality Standards Concentration Method
GASEOUS POLLUTANTS
Sulphur Dioxide Annual Mean 80 µg/m3 (0.03 ppm) Pulsed Fluorescence 24 Hours 365 µg/m3 (0.14 ppm)
Carbon Monoxide 8 Hours 10 mg/m3 (9 ppm) Non-dispersive 1 Hour 40 mg/m3 (35 ppm) Infrared Spectrometry
Nitrogen Dioxide Annual Mean 100 µg/m3 (0.053 ppm) Chemiluminescence
Ozone 1 Hour 235 µg/m3 (0.12 ppm) Ultraviolet Photometry 8 Hours 157 µg/m3 (0.08 ppm)
PARTICULATE POLLUTANTS
PM10 Annual Mean 50 µg/m3 1) High Volume Sampling (Particles that are 10 24 Hours 150 µg/m3 2) Continuous Filter-Based Mass micrometers or smaller) Measurement 3) Beta Attenuation
Lead 3 Months 1.5 µg/m3 Atomic Absorption Spectroscopy
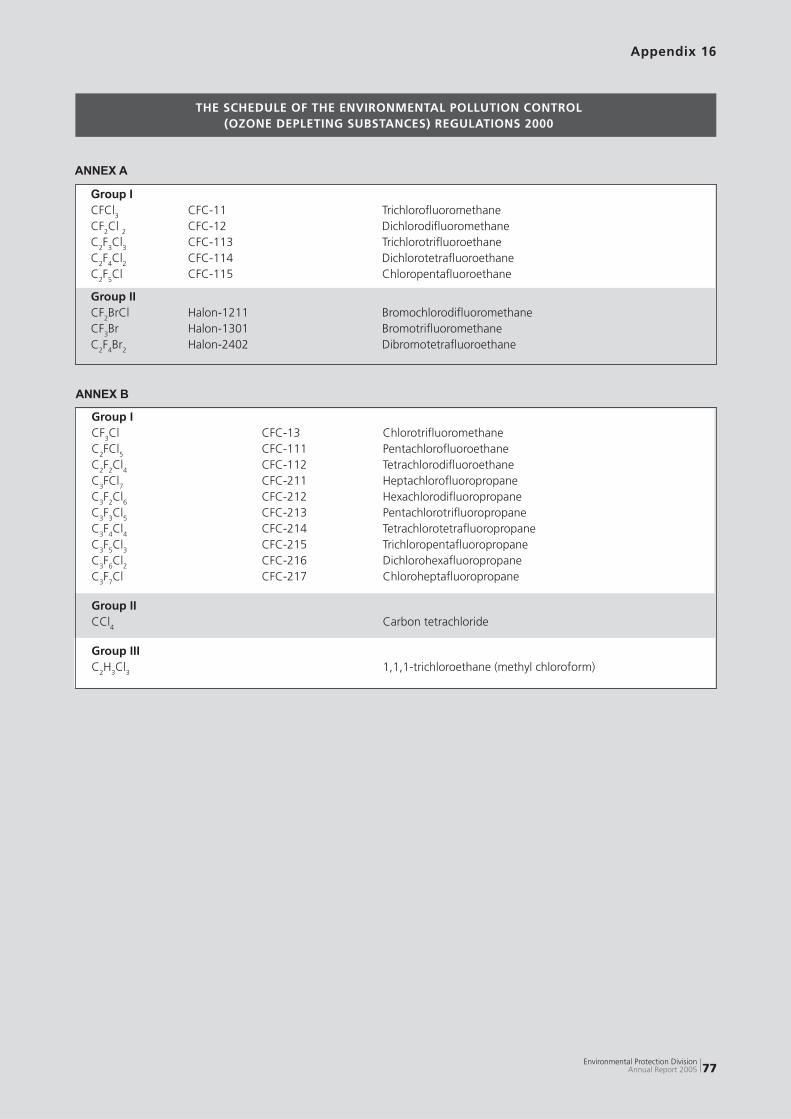
77Environmental Protection Division
Annual Report 2005
THE SCHEDULE OF THE ENVIRONMENTAL POLLUTION CONTROL(OZONE DEPLETING SUBSTANCES) REGULATIONS 2000
ANNEX A
Group I CFCl3 CFC-11 Trichlorofl uoromethane CF2Cl 2 CFC-12 Dichlorodifl uoromethane C2F3Cl3 CFC-113 Trichlorotrifl uoroethane C2F4Cl2 CFC-114 Dichlorotetrafl uoroethane C2F5Cl CFC-115 Chloropentafl uoroethane
Group II CF2BrCl Halon-1211 Bromochlorodifl uoromethane CF3Br Halon-1301 Bromotrifl uoromethane C2F4Br2 Halon-2402 Dibromotetrafl uoroethane
Appendix 16
ANNEX B
Group I CF3Cl CFC-13 Chlorotrifl uoromethane C2FCl5 CFC-111 Pentachlorofl uoroethane C2F2Cl4 CFC-112 Tetrachlorodifl uoroethane C3FCl7 CFC-211 Heptachlorofl uoropropane C3F2Cl6 CFC-212 Hexachlorodifl uoropropane C3F3Cl5 CFC-213 Pentachlorotrifl uoropropane C3F4Cl4 CFC-214 Tetrachlorotetrafl uoropropane C3F5Cl3 CFC-215 Trichloropentafl uoropropane C3F6Cl2 CFC-216 Dichlorohexafl uoropropane C3F7Cl CFC-217 Chloroheptafl uoropropane
Group II CCl4 Carbon tetrachloride
Group III C2H3Cl3 1,1,1-trichloroethane (methyl chloroform)

78Environmental Protection Division Annual Report 2005
ANNEX C
Group I CHFCl2 HCFC-21 Dichlorofl uoromethane CHF2Cl HCFC-22 Chlorodifl uoromethane CH2FCl HCFC-31 Chlorofl uoromethane C2HFCl4 HCFC-121 Tetrachlorofl uoroethane C2HF2Cl3 HCFC-122 Trichlorodifl uoroethane C2HF3Cl2 HCFC-123 Dichlorotrifl uoroethane C2HF4Cl HCFC-124 Chlorotetrafl uoroethane C2H2FCl3 HCFC-131 Trichlorofl uoroethane C2H2F2Cl2 HCFC-132 Dichlorodifl uoroethane C2H2F3Cl HCFC-133 Chlorotrifl uoroethane C2H3FCl2 HCFC-141 Dichlorofl uoroethane CH3CFCl2 HCFC-141b 1,1-dichloro-1-fl uoro-ethane C2H3 F2Cl HCFC-142 Chlorodifl uoroethane CH3CF2Cl HCFC-142b 1-chloro-1,1-difl uoro-ethane C2H4FCl HCFC-151 Chlorofl uoroethane C3HFCl6 HCFC-221 Hexachlorofl uoropropane C3HF2Cl5 HCFC-222 Pentachlorodifl uoropropane C3HF3Cl4 HCFC-223 Tetrachlorotrifl uoropropane C3HF4Cl3 HCFC-224 Trichlorotetrafl uoropropane C3HF5Cl2 HCFC-225 Dichloropentafl uoropropane CF3CF2CHCl2 HCFC-225ca 1,1-dichloro-2,2,3,3,3-pentafl uoropropane CF2ClCF2CHClF HCFC-225cb 1,3-dichloro-1,2,2,3,3-pentafl uoropropane C3HF6Cl HCFC-226 Chlorohexafl uoropropane C3H2FCl5 HCFC-231 Pentachlorofl uoropropane C3H2F2Cl4 HCFC-232 Tetrachlorodifl uoropropane C3H2F3Cl3 HCFC-233 Trichlorotrifl uoropropane C3H2F4Cl2 HCFC-234 Dichlorotetrafl uoropropane C3H2F5Cl HCFC-235 Chloropentafl uoropropane C3H3FCl4 HCFC-241 Tetrachlorofl uoropropane C3H3F2Cl3 HCFC-242 Trichlorodifl uoropropane C3H3F3Cl2 HCFC-243 Dichlorotrifl uoropropane C3H3F4Cl HCFC-244 Chlorotetrafl uoropropane C3H4FCl3 HCFC-251 Trichlorofl uoropropane C3H4F2Cl2 HCFC-252 Dichlorodifl uoropropane C3H4F3Cl HCFC-253 Chlorotrifl uoropropane C3H5FCl2 HCFC-261 Dichlorofl uoropropane C3H5F2Cl HCFC-262 Chlorodifl uoropropane C3H6FCl HCFC-271 Chlorofl uoropropane
Appendix 16 (Cont’)
THE SCHEDULE OF THE ENVIRONMENTAL POLLUTION CONTROL(OZONE DEPLETING SUBSTANCES) REGULATIONS 2000

79Environmental Protection Division
Annual Report 2005
Appendix 16 (Cont’)
THE SCHEDULE OF THE ENVIRONMENTAL POLLUTION CONTROL(OZONE DEPLETING SUBSTANCES) REGULATIONS 2000
ANNEX C
Group II CHFBr2 Dibromofl uoromethane CHF2Br HBFC-22B1 Bromodifl uoromethane CH2FBr Bromofl uoromethane C2HFBr4 Tetrabromofl uoroethane C2HF2Br3 Tribromodifl uoroethane C2HF3Br2 Dibromotrifl uoroethane C2HF4Br Bromotetrafl uoroethane C2H2FBr3 Tribromofl uoroethane C2H2F2Br2 Dibromodifl uoroethane C2H2F3Br Bromotrifl uoroethane C2H3FBr2 Dibromofl uoroethane C2H3F2Br Bromodifl uoroethane C2H4FBr Bromofl uoroethane C3HFBr6 Hexabromofl uoropropane C3HF2Br5 Pentabromodifl uoropropane C3HF3Br4 Tetrabromotrifl uoropropane C3HF4Br3 Tribromotetrafl uoropropane C3HF5Br2 Dibromopentafl uoropropane C3HF6Br Bromohexafl uoropropane C3H2FBr5 Pentabromofl uoropropane C3H2F2Br4 Tetrabromodifl uoropropane C3H2F2Br4 Tetrabromodifl uoropropane C3H2F3Br3 Tribromotrifl uoropropane C3H2F4Br2 Dibromotetrafl uoropropane C3H2F5Br Bromopentafl uoropropane C3H3FBr4 Tetrabromofl uoropropane C3H3F2Br3 Tribromodifl uoropropane C3H3F3Br2 Dibromotrifl uoropropane C3H3F4Br Bromotetrafl uoropropane C3H4FBr3 Tribromofl uoropropane C3H4F2Br2 Dibromodifl uoropropane C3H4F3Br Bromotrifl uoropropane C3H5FBr2 Dibromofl uoropropane C3H5F2Br Bromodifl uoropropane C3H6FBr Bromofl uoropropane
Group III CHClBr Bromochloromethane
ANNEX E
Group I CH3Br Methyl bromide

80Environmental Protection Division Annual Report 2005