near real-time iot analytics of pumping stations in powerbi · with access to only flat files of...
TRANSCRIPT

Mehmet BakkalogluBusiness Insights & Analytics, Hitachi Consulting
Team: Siddhartha Mohapatra, Vaughan Rees, John Shiangoli, Sidhartha Mahapatro
SQLBits Conference
7 April 2017
Near Real-Time IoT Analytics of Pumping
Stations in PowerBI

Contents
• Background
• Challenge
• Dashboards
• Solution
• Future improvements
• Comparison to other options

Waste Water Network
PS: Pumping Station
CSO: Combined Sewer
Overflow
WWTW: Waste Water
Treatment Works

Objective: Prevent Waste Water Spills
• Spills are damaging to the environment and may incur a fine from the
Environment Agency

The Data
• ~600 Waste Water Treatment Plants, ~900 Pumping Stations, ~250 CSOs
• Sites have different architectures, different sets of IoT sensors (SCADA
signals), different naming conventions for sensors, and some of them 100s of
sensors
• Analogue signals up to every 15 min
• Digital signals only when there is a change from 1 to 0 and 0 to 1 (therefore
there can be a long gap between receiving a signal)
• This particular solution currently has 45 million rows (100 sites, Aug 16 – Mar
17). With new sites added, it will be around 400 million rows (600 sites, 1
years’ data).For the purposes of this session
Site Names, Catchment Names,
Beach Names have been
masked, and postcodes mapped
to random Scottish postcodes
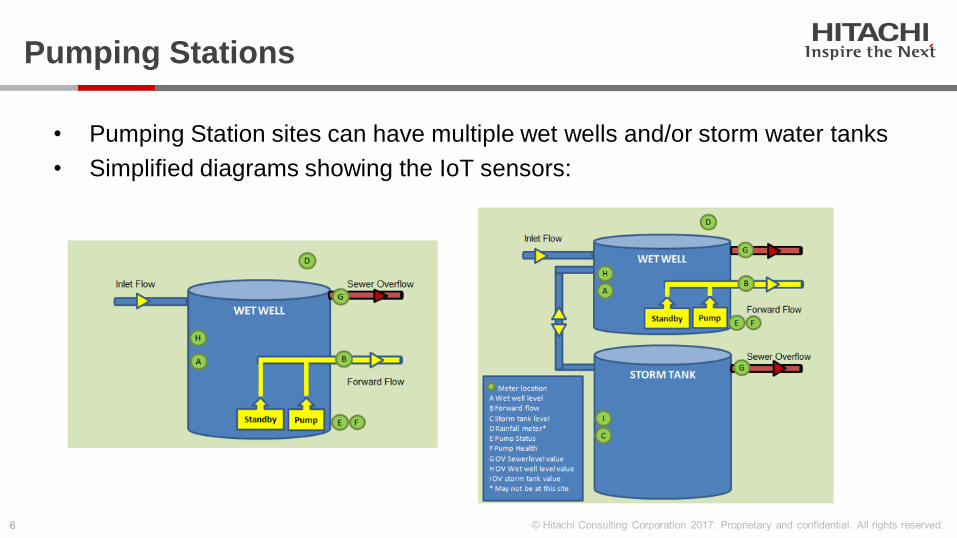
Pumping Stations
• Pumping Station sites can have multiple wet wells and/or storm water tanks
• Simplified diagrams showing the IoT sensors:

Challenge
• How to produce a generic set of dashboards for pumping stations that will:
• Show us the likelihood of a spill at a pumping station
• Help us investigate the cause of a spill, including going back in history
• Show the asset status
With access to only flat files of IoT data (SCADA)
Using Azure & PowerBI
In near real-time (~15 minutes latency)
With compelling visualisations
PowerBI Dashboards

Current Status
Dashboard showing the
likelihood of a spill at a
site
• Used by site
engineers and
operators
• Shows the logic
used to derive
likelihood of spill
• Can also filter by
beach to determine
whether spills are
affecting a particular
beach
• Can be used on
mobile devices as
well

Details (1)
Dashboard allowing users
to identify the cause of a
spill
Example:
• It might be that pump
was not running when
it should have been,
which would indicate
an issue with the pump
• It might be that when
there is more than one
pump running the flow
did not increase, which
might indicate a
blockage e.g. dead
animal or garbage
• etc.
Spilling
Heavy Rain
Both pumps on

Details (2)
Why is there no flow?
Why is pump 3 not running?
No signal from pump 3

Details (3)
Why is it above consented flow
even though level is not high?

Signal Status
• Shows whether there
was a signal in the last
day
• If there was not a
signal in the last day
this could mean there
is need for
maintenance
• Last signal value vs
signal average

Architecture
• How do we fill in the gap to meet the requirements?
Flat files
(SCADA
data) ?On-premise

First set of requirements to be addressed
• Names of signals from different sites need to be
standardised
• In some cases, due to the architecture of sites,
signals from multiple sites need to be reported as one
site
• Not all sites have rainfall data, therefore we need to
map it from the nearest site
• For rainfall level use average of last one hour of
rainfall voltage
• Likelihood of a spill at a pumping station requires
complex logic
• Visualise Pump Status properly

Likelihood of a spill
Working with site engineers, analysing historical data,
and based on available sensors:
Around 100 sites classified into 6 types:Around 300 rules defined
using various signals and
thresholds to determine RAG
Status and Risk Level
Some spills are
allowed e.g. if it is
raining heavily, but
other spills are not
allowed. RAG
Status identifies this.• Is there a Flow signal?
• Flow vs Consented Flow?
• Rainfall vs Threshold?
• Wet Well Level vs Spill Level vs Thresholds?
• Pump(s) running?
• Is there a Tide Meter?
• Tide increasing/decreasing?
• Storm pump(s) running?
• Is there an inhibitor?
• Is there a Pumped Overflow signal?

Likelihood of a spill
We need a platform that
enables us to implement such
a rules engine in near real-time

Visualise Pump Status
• Pump Status is a digital signal
that comes only when there is a
change from 1 to 0 and 0 to 1
• It does not come at a regular
interval
• In order to visualise it and to be
able to filter properly, generate
data points at 5 minute intervals
and at end points
• While this is not difficult to do,
we need a platform that
enables us to generate data
points in near real-time
Original
data points
visualised
differently
With
generated
data points
2 pumps
(option 1)
2 pumps
(option 2)
Filtering on > 14:15 would show
no pump status until 15:00Zeros are missing
Original
data points

Where to implement these requirements
Easiest choice: Do it in a Data Warehouse – but what about latency?
a) Data Warehouse
b) Stream Analytics
c) Storm on HDInsight
d) Spark on HDInsight
e) Somewhere else?

Azure SQL
Data
Warehouse
Basic Architecture
Flat files
(SCADA
data)
Azure Data Factory
Azure
Blob
StorageSSIS
Stored
Procs
Load into DW using PolyBase
• Fastest way of loading
• Rate increases when DWU
is increased
• This is not the case for other
options such as BCP, ADF,
SSIS
Use SSIS Azure Blob Upload Task
• Can do transformations, conditional
tasks, and connect to various sources
• Alternatives: AZCopy (command-line
utility), ADF Copy (transformation not
possible & Data Management Gateway
required), BCP (for small files)
1
2
33 issues
causing us
not to meet
latency
requirement
(~15 min)
On-premise Cloud

Improvement 1 – Azure Tabular Model
• PowerBI DirectQuery is unacceptably slow, has
functional limitations, creates load on DW
• PowerBI Import Mode even with Pro licence can
only be refreshed up to 8 times a day, has a size
limit, and no partitioning
How can we make this near real-time?
• Use Azure Analysis Services Tabular Model – we
can process it as frequently as we wish
• Improve processing performance by partitioning
Tabular Model into current and historical
• Live Connection from PowerBI to Tabular Model
works super fast
(Azure Analysis Services came out in October 2016 & is still in preview)
Connection
Options

How to process partitions of Azure Tabular Model & streamline with ETL process
using Microsoft.AnalysisServices.Tabular;using static Microsoft.AnalysisServices.Tabular.Database;
...public IDictionary<string, string> Execute(
IEnumerable<LinkedService> linkedServices,IEnumerable<Dataset> datasets, Activity activity,IActivityLogger logger)
{...if (currentDateTime.Date == lastProcessDate.Date){
// If during the day, process only current partitionmodel.Tables[tableName[i]].Partitions[0].RequestRefresh(RefreshType.Full);...
}else{
// If new day, process fullmodel.RequestRefresh(RefreshType.Full);...
}...
}
• No out-of-the-box way of automating the processing of Azure Tabular Model yet
• Do it in C# using Tabular Object Model libraries (TOM) and run from Azure Data Factory
using Azure BatchHow to run C# from ADF using Azure
Batch
1. Create a .NET Class
Library project with just the
Execute method of the
IDotNetActivity interface
2. Build it, create a zip file of the
binaries, and upload to Azure Blob
Storage
3. Create an Azure Batch account and
pool
4. Add a pipeline to Azure Data
Factory solution to run the C# code
using Azure Batch
https://docs.microsoft.com/en-
us/azure/data-factory/data-factory-use-
custom-activities

Process Tabular Model from Azure Data Factory

Add pipeline to ADF to process Tabular Model

Improvement 2 – Archive Blob Files
With data growing rapidly, even using PolyBase,
loading data into Azure Data Warehouse physical
table slows down
Archive Blob Files that have been loaded into Data Warehouse physical table, so the external table points to only the new files
Archiving is done from SSIS retrospectively
(Alternative would be to define PolyBase on a file (rather than a folder) but it would have to be on the fly)
CREATE EXTERNAL TABLE [stg].[iSCADADigital]([dv_id] [bigint] NULL,[db_addr] [int] NULL,[time] [datetime2](7) NULL,[value] [bit] NULL,......)WITH ( DATA_SOURCE = [iSCADAAzureStorage],LOCATION = N'digital/',FILE_FORMAT = [PipeDelimitedText],REJECT_TYPE = VALUE,REJECT_VALUE = 0)
PolyBase
External
Table
Fact
(Physical
Table)
Dimension
(Physical
Table)
File1
File 2
File N
Azure Blob
StorageAzure Data Warehouse

Improvement 3 – Streamline SSIS & ADF
• Minimise latency between SSIS completion and ADF start
• Create a Stored Proc that will be the first task in ADF that will check for the
completion of SSIS upload of files into Azure Blob
CREATE PROC [ctl].[iSCADAStartProcess] AS
BEGIN...-- Check Upload Status WHILE ISNULL(@ProcessStatus, '') = ''BEGIN
SET @ProcessStatus = (SELECT TOP 1 ProcessStatusFROM ctl.ProcessAuditWHERE ProcessName = ‘SSISUpload'
AND ProcessStatus = 'END');END-- Now log the start of Azure Data Factory Phase-- And load data into Azure Data Warehouse...
END

Azure SQL
Data
Warehouse
Architecture
Flat files
(SCADA
data)
Azure Analysis
Services
Tabular Model
Azure Data Factory
Azure
Blob
StorageSSIS
Stored
Procs
Load data
using
PolyBase
Live
Connection
Archive
historical blobs
for faster load
Streamline
by adding
handshake
Partition Tabular Model
• Current Partition
• Historical Partition
Process with Tabular Object
Model (TOM)
• Current Partition processed
at the end of each run
• Full process at midnight
Azure Blob
Upload Task
Every 15
minutes
C#
Script
Microsoft
recommended
minimum for ADF
CloudOn-premise

How to improve this solution
• As data grows, may need a more sophisticated partitioning scheme for Tabular
Model. Currently 45 million rows (Aug 16 – Mar 17). With new sites added, it will
be around 400 million rows (600 sites, 1 years’ data).
• Automatically scale up Azure Analysis Services when doing full processing
overnight, and then scale down
• Use machine learning to find the correlation between signals – this could help
improve the logic to predict the likelihood a spill (Utilising Azure Stream Analytics
& Azure Machine Learning)
• Store historical RAG Status and Risk Level, and use Machine Learning to
predict future RAG Status and Risk Level
• Other ideas:
• Detect pump blockages from Flow & Pump Status
• Pump energy use vs Flow rate – determine whether pumps are efficient or need to be serviced

Comparison to alternative solutions
Solution Handle
complex rules
Handle out of
order events
Latency Visualisations Cope with
large
amounts of
data
Historical data
analysis
alongside near
real-time data
Scale up
& down
Cost
Azure Data Warehouse &
Analysis Services
Yes Yes ~ 15 min
(Microsoft
recommended
minimum for
ADF)
PowerBI Yes Yes Yes Pay-as-you-go
(PaaS)
Azure Stream Analytics May struggle
(SQL &
reference data
from Azure Blob
but no UDFs,
no extensible
code)
Yes Low PowerBI Yes Results need to
be stored in DW
Yes Pay-as-you-go
(PaaS)
Storm on HDInsight Code in Java or
C#
Has to be
implemented
Low PowerBI Yes (Very
Large)
Results need to
be stored
Yes Pay-as-you-go
(PaaS)
Spark on HDInsight (Spark
Streaming)
Scala or Java Yes (by
batching data)
Batching adds
some latency
PowerBI Yes (Very
Large)
Results need to
be stored
Yes Pay-as-you-go
(PaaS)
On-premises SQL Server &
Analysis Services
Yes Yes Low (Although
loading data
may be slow)
SSRS or with on-
premises gateway in
PowerBI but may need
ExpressRoute for
performance
Not as
powerful as
Azure DW
Yes No High initial
setup cost, and
later upgrade
cost

A lot more can be done with Waste Water IoT data
• Another similar but larger project we did was on Waste Water Treatment Works
• Common dashboards for all sites to analyse performance, identify issues, prevent failures
• Dashboard for each phase of treatment: Final Effluent Inlet & PST Filters & HST ASP FST etc.

Contact
LinkedIn: https://www.linkedin.com/in/mehmet-bakkaloglu-0a328010/
