nec directive status report 2014 - european environment agency
TRANSCRIPT

NEC Directive status report 2014Reporting by Member States under Directive 2001/81/EC
of the European Parliament and of the Council of 23 October 2001 on national emission ceilings for certain atmospheric pollutants
EEA Technical report No 7/2015
ISSN 1725-2237


EEA Technical report No 7/2015
NEC Directive status report 2014Reporting by Member States under Directive 2001/81/EC
of the European Parliament and of the Council of 23 October 2001 on national emission ceilings for certain atmospheric pollutants

European Environment AgencyKongens Nytorv 61050 Copenhagen KDenmark
Tel.: +45 33 36 71 00Web: eea.europa.euEnquiries: eea.europa.eu/enquiries
Cover design: EEACover photo: © flickr/ Hans PõldojaLayout: EEA/Henriette Nilsson
Legal noticeThe contents of this publication do not necessarily reflect the official opinions of the European Commission or other institutions of the European Union. Neither the European Environment Agency nor any person or company acting on behalf of the Agency is responsible for the use that may be made of the information contained in this report.
Copyright notice© European Environment Agency, 2015Reproduction is authorised provided the source is acknowledged.
More information on the European Union is available on the Internet (http://europa.eu).
Luxembourg: Publications Office of the European Union, 2015
ISBN 978-92-9213-648-2ISSN 1725-2237doi:10.2800/101114

3
Contents
NEC Directive status report 2014
Contents
Acknowledgements .................................................................................................................... 4
Executive summary .................................................................................................................... 5
Units and abbreviations ........................................................................................................... 11
1 Introduction ......................................................................................................................... 121.1 Reporting requirements under the NECD ..........................................................................12
2 Assessment of EU and Member State emissions ............................................................. 162.1 EU progress in meeting emission ceilings ..........................................................................16
2.2 Comparison of Member State-reported emissions data with NECD emission ceilings ..... 17
2.3 Analysis of Member State emissions per pollutant ..........................................................21
2.4 Timeliness and transparency of reporting .........................................................................26
2.5 Basis for estimating emissions from mobile sources .......................................................26
2.6 Potential underestimation of Member State emissions due to non-reporting of emissions from certain sectors .......................................................................................27
3 Summary and recommendations ...................................................................................... 323.1 Emission trends and ceiling assessments ..........................................................................32
3.2 Outlook post-2013.................................................................................................................33
3.3 Recommended improvements in reporting methodology ..............................................33
References ................................................................................................................................. 34
Appendix 1 Data sources ......................................................................................................... 36
Appendix 2 Reporting status of NECD emissions ................................................................. 37

NEC Directive status report 20144
Acknowledgements
Acknowledgements
This report was prepared by the European Environment Agency (EEA) and its European Topic Centre for Air Pollution and Climate Change Mitigation (ETC/ACM, partner Umweltbundesamt Austria). The lead author was Melanie Tista. Other authors were Michael Gager and Bernhard Ullrich; the internal ETC review was performed by Paul Ruyssenaars (ETC/ACM, partner RIVM).
The EEA project manager was Anke Lükewille. The desk officer at the European Commission's Directorate-General for the Environment responsible for implementation of the National Emission Ceilings Directive (NECD) is André Zuber.
The EEA acknowledges comments received on the draft report from the Eionet national reference centres of EEA member countries and the European Commission (DG Environment).

5
Executive summary
NEC Directive status report 2014
Executive summary
This report describes the most recent emission inventory information provided by the Member States of the European Union (EU) at the end of 2014, under Directive 2001/81/EC of the European Parliament and of the Council on national emission ceilings for certain atmospheric pollutants (commonly known as the National Emission Ceilings Directive (NECD)) (EU, 2001).
The NECD requires all 28 EU Member States to report information annually on emissions of four significant air pollutants: nitrogen oxides (NOX), non-methane volatile organic compounds (NMVOCs), sulphur dioxide (SO2) and ammonia (NH3). These pollutants can cause respiratory problems, contribute to the acidification of soil and surface water, cause eutrophication in sensitive habitats and damage vegetation through exposure to tropospheric ozone resulting from these emissions. To help protect human health and the environment,
the NECD sets pollutant-specific and legally binding emission ceilings for each of these substances and for each country. The ceilings were to be met by 2010 as well as in future years.
Member State–reported emissions data and NECD emission ceilings
Each year, by 31 December, Member States are required to report their national emission inventories for the four NECD pollutants. More specifically, final emission data should be submitted for the previous year but one, as should provisional emission data for the previous year. Therefore, at the end of 2014, Member States were required to report final emission data for the year 2012, and provisional estimates of emissions for 2013.
Box ES.1 The European Clean Air Programme and revision of the NECD
In late 2013, following a policy review, the European Commission (EC) proposed a new European Clean Air Programme: its strategic objective is to attain air quality levels that do not give rise to significant negative impacts on, nor pose risks for, human health and the environment. The first general objective of the proposed Programme is to achieve full compliance with present air quality policies, and to conform to international commitments by 2020. Proposed policy options to help achieve this objective include the full implementation of existing measures addressing transport, small- and medium-scale combustion and background pollution (within the Member States, intra-EU and globally). Additional proposed actions include support for national and local actions through EU funds, as well as an improved research and innovation agenda within the EU Framework Programme Horizon 2020. A revised NECD would repeal and replace the current practice of annual capping of national emissions of air pollutants. The proposal ensures, however, that the national emission ceilings set in the NECD for NOX, NMVOCs, SO2, and NH3 for 2010 and onwards apply until 2020.
The second general objective of the European Clean Air Programme is to reduce the impact of air pollution beyond 2020 (2030 is the target year). The proposal for a revised NECD includes new national emission reduction commitments, applicable from 2020 and 2030, for NOX, NMVOCs, SO2, NH3, fine particulate matter (PM2.5) and methane (CH4). To ensure timely compliance, interim targets for the same pollutants will apply for 2025. The aim of the envisaged staggered tightening of commitments is to firstly achieve compliance with the amended Gothenburg Protocol by 2020 (UNECE, 1999, 2012a and 2012b), followed by more ambitious reductions from 2030 onward. Moreover, the package includes a proposal for a directive that would establish emission limit values for medium-sized combustion facilities (i.e. with a thermal input ranging from 1 MW to 50 MW).
For more information, see http://ec.europa.eu/environment/air/clean_air_policy.htm.

Executive summary
6 NEC Directive status report 2014
Table ES.1 summarises EU-27 (1) Member State progress in meeting the NECD emission ceilings of four main air pollutants (see Table ES.1).
NOX emissions:
• 11 Member States exceeded their ceilings in 2010 (final data);
• eight Member States exceeded their emission ceilings in 2011 (final data);
• nine Member States exceeded their ceilings in 2012 (final data);
• six Member States were still exceeding their NOX ceilings in 2013 (Austria, Belgium, France, Germany, Ireland and Luxembourg) (provisional data).
In absolute amounts, Germany and France reported the highest exceedances of NOX ceilings in 2013, by 218 kilotonnes and 180 kilotonnes, respectively. In percentage terms, Luxembourg (41%) and Austria (32%) continued to exceed their NOX emission ceilings the most in 2013.
NMVOC emissions:
• four Member States exceeded their ceilings in 2010 (final data);
• five Member States exceeded their ceilings in 2011 (final data);
• four Member States exceeded their ceilings in 2012 (final data);
• three Member States were still exceeding their NMVOC ceilings in 2013 (Denmark, Germany and Ireland) (provisional data).
In absolute amounts, Germany reported the highest exceedances of NMVOC ceilings in 2013, by 143 kilotonnes. In percentage terms, Ireland (64%) and Denmark (35%) continued to exceed their NMVOC emission ceilings the most in 2013.
SO2 emissions:
All Member States met emission ceilings for SO2 in 2010, 2011, 2012 and 2013.
NH3 emissions:
• six Member States (Austria, Denmark, Finland, Germany, the Netherlands and Spain) exceeded their ceilings in 2010, 2011, 2012 (final data) and 2013 (provisional data).
In absolute amounts, Germany reported the highest exceedances of NH3 ceilings in 2013, by 121 kilotonnes. In percentage terms, Germany (22%) and Finland (20%) continued to exceed their NH3 emission ceilings the most in 2013.
Box ES.2 Adjustments to emission inventories and commitments under the LRTAP Convention
In 2012, the Executive Body for the LRTAP Convention decided that adjustments to emission reduction commitments or to inventories may be applied, in some circumstances. The EMEP Centre on Emission Inventories and Projections (CEIP) leads the adjustment procedure and coordinates the review of any supporting documentation and assesses whether the adjustment is consistent with the particular circumstances and the guidance for adjustments.
Under the Gothenburg Protocol, inventory adjustment applications for emissions from Germany (for NOX) and Denmark (for NH3) were accepted by the EMEP Steering Body in 2014. For Belgium, France and Spain, the adjustment application process was not completed in 2014, and so was left pending. Following guidance of the European Commission, unadjusted emission inventory data are used in this report.
(1) Croatia joined the EU in July 2013, and therefore data for 2010 to 2013 are shown for informative purposes only.

Executive summary
7NEC Directive status report 2014
Table ES.1 EU-27 Member State progress in meeting NECD emission ceilings
Member State
NOX NMVOCs SO2 NH3
2010 2011 2012 2013 2010 2011 2012 2013 2010 2011 2012 2013 2010 2011 2012 2013
Austria ü ü ü ü ü ü ü ü
Belgium ü ü ü ü ü ü ü ü ü
Bulgaria ü ü ü ü ü ü ü ü ü ü ü ü ü ü ü ü
Cyprus ü ü ü ü ü ü ü ü ü ü ü ü ü ü ü ü
Czech Republic
ü ü ü ü ü ü ü ü ü ü ü ü ü ü ü ü
Denmark ü ü ü ü ü ü ü
Estonia ü ü ü ü ü ü ü ü ü ü ü ü ü ü ü ü
Finland ü ü ü ü ü ü ü ü ü ü ü ü
France ü ü ü ü ü ü ü ü ü ü ü ü
Germany ü ü ü ü
Greece ü ü ü ü ü ü ü ü ü ü ü ü ü ü ü ü
Hungary ü ü ü ü ü ü ü ü ü ü ü ü ü ü ü ü
Ireland ü ü ü ü ü ü ü ü
Italy ü ü ü ü ü ü ü ü ü ü ü ü ü ü ü ü
Latvia ü ü ü ü ü ü ü ü ü ü ü ü ü ü ü ü
Lithuania ü ü ü ü ü ü ü ü ü ü ü ü ü ü ü ü
Luxembourg ü ü ü ü ü ü ü ü ü ü ü ü
Malta ü ü ü ü ü ü ü ü ü ü ü ü ü ü
Netherlands ü ü ü ü ü ü ü ü ü ü ü
Poland ü ü ü ü ü ü ü ü ü ü ü ü ü ü ü ü
Portugal ü ü ü ü ü ü ü ü ü ü ü ü ü ü ü ü
Romania ü ü ü ü ü ü ü ü ü ü ü ü ü ü ü ü
Slovakia ü ü ü ü ü ü ü ü ü ü ü ü ü ü ü ü
Slovenia ü ü ü ü ü ü ü ü ü ü ü ü ü
Spain ü ü ü ü ü ü ü ü ü
Sweden ü ü ü ü ü ü ü ü ü ü ü ü ü ü ü
United Kingdom
ü ü ü ü ü ü ü ü ü ü ü ü ü ü ü ü
ü 16 19 18 21 23 22 23 24 27 27 27 27 21 21 21 21
11 8 9 6 4 5 4 3 0 0 0 0 6 6 6 6
Notes: 'ü' indicates that the emission ceiling has been attained; '' indicates the ceiling has not been attained.
Years 2010, 2011 and 2012: final data; year 2013: provisional data.
Under the Gothenburg Protocol, inventory adjustment applications for emissions from Germany (for NOX) and Denmark (for NH3) were accepted by the EMEP Steering Body in 2014. However, emission data reported under the NECD used in this report are unadjusted.
Executive summary
8 NEC Directive status report 2014
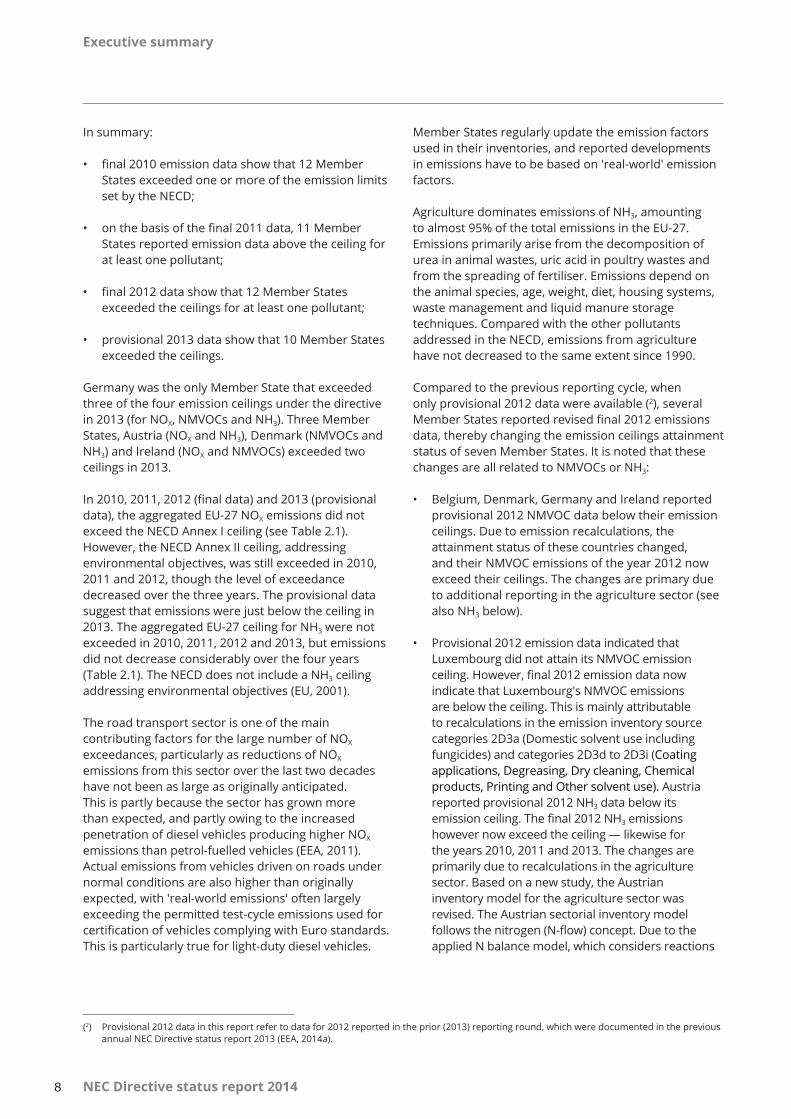
In summary:
• final 2010 emission data show that 12 Member States exceeded one or more of the emission limits set by the NECD;
• on the basis of the final 2011 data, 11 Member States reported emission data above the ceiling for at least one pollutant;
• final 2012 data show that 12 Member States exceeded the ceilings for at least one pollutant;
• provisional 2013 data show that 10 Member States exceeded the ceilings.
Germany was the only Member State that exceeded three of the four emission ceilings under the directive in 2013 (for NOX, NMVOCs and NH3). Three Member States, Austria (NOX and NH3), Denmark (NMVOCs and NH3) and Ireland (NOX and NMVOCs) exceeded two ceilings in 2013.
In 2010, 2011, 2012 (final data) and 2013 (provisional data), the aggregated EU-27 NOX emissions did not exceed the NECD Annex I ceiling (see Table 2.1). However, the NECD Annex II ceiling, addressing environmental objectives, was still exceeded in 2010, 2011 and 2012, though the level of exceedance decreased over the three years. The provisional data suggest that emissions were just below the ceiling in 2013. The aggregated EU-27 ceiling for NH3 were not exceeded in 2010, 2011, 2012 and 2013, but emissions did not decrease considerably over the four years (Table 2.1). The NECD does not include a NH3 ceiling addressing environmental objectives (EU, 2001).
The road transport sector is one of the main contributing factors for the large number of NOX exceedances, particularly as reductions of NOX emissions from this sector over the last two decades have not been as large as originally anticipated. This is partly because the sector has grown more than expected, and partly owing to the increased penetration of diesel vehicles producing higher NOX emissions than petrol-fuelled vehicles (EEA, 2011). Actual emissions from vehicles driven on roads under normal conditions are also higher than originally expected, with 'real-world emissions' often largely exceeding the permitted test-cycle emissions used for certification of vehicles complying with Euro standards. This is particularly true for light-duty diesel vehicles.
Member States regularly update the emission factors used in their inventories, and reported developments in emissions have to be based on 'real-world' emission factors.
Agriculture dominates emissions of NH3, amounting to almost 95% of the total emissions in the EU-27. Emissions primarily arise from the decomposition of urea in animal wastes, uric acid in poultry wastes and from the spreading of fertiliser. Emissions depend on the animal species, age, weight, diet, housing systems, waste management and liquid manure storage techniques. Compared with the other pollutants addressed in the NECD, emissions from agriculture have not decreased to the same extent since 1990.
Compared to the previous reporting cycle, when only provisional 2012 data were available (2), several Member States reported revised final 2012 emissions data, thereby changing the emission ceilings attainment status of seven Member States. It is noted that these changes are all related to NMVOCs or NH3:
• Belgium, Denmark, Germany and Ireland reported provisional 2012 NMVOC data below their emission ceilings. Due to emission recalculations, the attainment status of these countries changed, and their NMVOC emissions of the year 2012 now exceed their ceilings. The changes are primary due to additional reporting in the agriculture sector (see also NH3 below).
• Provisional 2012 emission data indicated that Luxembourg did not attain its NMVOC emission ceiling. However, final 2012 emission data now indicate that Luxembourg's NMVOC emissions are below the ceiling. This is mainly attributable to recalculations in the emission inventory source categories 2D3a (Domestic solvent use including fungicides) and categories 2D3d to 2D3i (Coating applications, Degreasing, Dry cleaning, Chemical products, Printing and Other solvent use). Austria reported provisional 2012 NH3 data below its emission ceiling. The final 2012 NH3 emissions however now exceed the ceiling — likewise for the years 2010, 2011 and 2013. The changes are primarily due to recalculations in the agriculture sector. Based on a new study, the Austrian inventory model for the agriculture sector was revised. The Austrian sectorial inventory model follows the nitrogen (N-flow) concept. Due to the applied N balance model, which considers reactions
(2) Provisional 2012 data in this report refer to data for 2012 reported in the prior (2013) reporting round, which were documented in the previous annual NEC Directive status report 2013 (EEA, 2014a).

Executive summary
9NEC Directive status report 2014
0
2 000
4 000
6 000
8 000
10 000
20102011
20122013
20102011
20122013
20102011
20122013
20102011
20122013
Emissions (Gg)
Annex I emission ceilings Annex II emission ceilings
NOX NMVOCs SO2 NH3
Figure ES.1 EU-27 progress in meeting emission ceilings set out in NECD Annexes I and II: aggregated Member State final 2010, final 2011, final 2012 and provisional 2013 emission data, compared with EU-27 emission ceilings
throughout the N-flow in agricultural systems, the recalculations resulted in higher NH3 emissions and lower N2O emissions.
• Germany and the Netherlands reported increases of NH3 emissions with regard to the provisional and final 2012 data. This changes their attainment status. The changes are primarily due to recalculations in the agriculture sector. For both countries, the NH3 emission levels from agriculture increased due to improved emission factors for the different husbandry systems and manure application (EMEP/EEA, 2013). In Germany the new NH3 emission factors nearly doubled the fertiliser-induced NH3 emissions. Furthermore new sources were added to the inventories (e.g. application of sewage sludge, compost and emissions from crop residues), and livestock data were updated (e.g. for dairy cows and other cattle).
EU progress in meeting its emission ceilings
The EU itself has two different sets of emission ceilings for 2010 and onwards, as set out in the NECD (3).
Based on the aggregated reported final 2010, final 2011, final 2012 data and provisional 2013 emission data (see Figure ES.1), the less stringent ceilings of Annex I to the NECD have not been exceeded.
For NOX, the aggregated EU-27 emissions data are however above the respective Annex II ceiling for the years 2010, 2011 and 2012. In 2013, provisional emission data are slightly below the ceilings (see Figure ES.1). For NMVOCs, emission data of the year 2010 are above the ceiling, but for the years 2011, 2012 and 2013, the Annex II emission ceiling is not exceeded. SO2 emission data of all years are below the levels of emissions ceilings.
Past emission trends
Under the NECD, Member States are formally obliged to submit only two years of emission data. This hampers any reliable assessment of long-term emission trends (either within individual Member States or for the EU as a whole). Nevertheless, several Member States voluntarily submit updated emission data under NECD reporting for all years as far back
(3) Annexes I and II to the NECD define emission ceilings for the EU. The Annex I EU ceilings represent the aggregation of individual Member State ceilings defined in that annex. The Annex II EU ceilings are stricter than those of Annex I and are designed with the aim of attaining, by 2010, for the EU as a whole, the interim environmental objectives set out in Article 5 of the NECD (i.e. a reduction of acidification and health- and vegetation-related ground-level ozone exposure by 2010, compared with the 1990 situation). Annex II of the NECD does not define a separate ceiling for NH3.
Note: The emission ceilings shown are those set out for the EU in Annexes I and II to the NECD. The aggregated emission estimates comprise unadjusted emission data reported on the basis of fuel used (6 Member States) and fuel sold (21 Member States) for mobile sources. An overview of the basis used by Member States for estimating emissions from mobile sources is given in Table 2.4.
as 1990. These EU Member States declare considerable emission reductions of the four NECD pollutants since 1990. A more complete picture of past emission trends in the EU will be provided in mid-2015 when the EEA will publish the annual EU emission report under the UNECE Convention on Long-range Transboundary Air Pollution (LRTAP Convention) (EEA, 2015a).
Completeness of data reporting
a) Pollutant–source combinations not included in the original 2010 emission ceilings
Since the original 2010 emissions ceilings were set, improved knowledge has become available on the sources of air pollutants. In several instances, 'new' emission source categories for the pollutants covered
Executive summary
10 NEC Directive status report 2014
within the scope of the NECD have been identified; in some cases, based on measurements, emission factors have been developed (e.g. for NOX and NMVOC emissions in the agriculture sector) that allow emission estimates to be made.
As in 2014, this report focuses on NOX and NMVOC emissions from the agriculture sector as examples of source categories which were not considered when the targets were set, but for which emission inventory guidance is now available (EMEP/EEA, 2013). The aim is to assess the magnitude of these emissions as compared with National Totals, and attainment with national emission ceilings. At EU-27 level, NOX and NMVOC emissions from the agriculture sector amount to 2.4% and 8.5% of total emissions in 2013, respectively.
Based on NOX emission estimates for 2013 as provided by 21 Member States, NOX from agriculture contributes to maximal 11% to the respective National Totals. The exclusion from the National Total of NOX emitted by the agriculture sector would not by itself change the attainment status of any Member State.
However, NMVOC emissions from agriculture for 2013 (as provided by 23 Member States) have a higher contribution, up to 47% of the National Total emissions. The exclusion from NMVOCs emitted by the agriculture sector from the National Total would change the attainment status of three Member States (Denmark, Germany and Ireland), i.e. these countries would not meet their ceilings. In the year 2010, excluding NMVOC data from the agriculture sector would have brought the EU emissions below the EU Annex II ceiling. The same is true for NOX emissions in the year 2012.
A second analysis was performed to assess the number of Member States that report NH3 emissions from the 'new' sources '3Da4 — Crop residues applied to soil' and '3De — Cultivated crops'. Data from these categories were reported by only three Member States for the year 2013. The share of National Total NH3 emissions was highest for Denmark (7%); here excluding NH3 emissions of these categories from the National Total would change the attainment status of Denmark and Austria, i.e. the NH3 ceiling would be achieved if this category was excluded from the National Totals.
The two examples mentioned above show that incomplete reporting coupled with the apparent significant contribution of such sources to National Totals causes emissions to be underestimated in a number of Member States, in some cases significantly so.
b) 'Not estimated' emissions
The reporting guidelines of the LRTAP Convention (UNECE, 2014a) (and through Annex III of the NECD, by extension applicable also to reporting under this EU directive) allow Member States to report emissions as 'not estimated' (NE) for sectors where emissions are known to occur but have not been calculated or reported. Ideally 'NE' should only be used for sources that are very small, where, for example, it may be less cost-effective to develop a specific estimation methodology than to improve the accuracy of estimates for more significant sources.
By definition, use of the 'NE' notation key means national inventories are incomplete; emission totals are therefore underestimated. Seventeen Member States used the notation key 'NE' for more than 10 source categories. Only nine Member States provided reasons for using it in their data submissions under the NECD, and it should be noted that Member States provided more information under their LRTAP Convention submissions (the reporting deadline was 15 February). However, the information provided varied somewhat in terms of informative value.
Transparency of reported information
Providing inventory reports or additional explanatory information that describes the methods and sources of the reported data is not mandatory under the NECD; this limits the transparency of the data submission. Nevertheless, 11 Member States (Austria, Croatia, Estonia, Finland, Germany, Latvia, the Netherlands, Poland, Romania, Slovakia and Sweden) voluntarily submitted inventory reports alongside their NECD inventories.
Public access to data and reports
Data described in this report are available from the EEA online data viewer (EEA, 2015b).
The EEA also publishes individual air pollution fact sheets (e.g. EEA, 2014b) for each Member State, providing additional analyses of various parameters; these include current progress made in achieving the respective emission ceilings for each pollutant. Updated fact sheets will be published by the EEA in the autumn of 2015.

11
Units and abbreviations
NEC Directive status report 2014
Units and abbreviations
CDR (Eionet) Central Data Repository
CEIP (EMEP) Centre on Emission Inventories and Projections
EEA European Environment Agency
Eionet European Environmental Information and Observation Network of the EEA
EMEP Cooperative programme for monitoring and evaluation of the long-range transmissions of air pollutants in Europe
ETC/ACM European Topic Centre for Air Pollution and Climate Change Mitigation
EU European Union
EC European Commission
Gg 1 gigagram = 109 g = 1 kiloton (kt)
GHG inventory Greenhouse gas inventory
IIR Informative Inventory Report
LRTAP Convention UNECE Convention on Long-range Transboundary Air Pollution
MW megawatt
NE 'not estimated' (notation key)
NECD National Emission Ceilings Directive
NFR nomenclature for reporting (UNECE)
NH3 ammonia
NMVOCs non-methane volatile organic compounds
N2O nitrous oxide
NOX nitrogen oxides
PM particulate matter
PM2.5 fine particulate matter, i.e. with a diameter of 2.5 micrometres or less
SO2 sulphur dioxide
UNECE United Nations Economic Commission for Europe
UNFCCC United Nations Framework Convention on Climate Change
UNFCCC/MMR EU Monitoring Mechanism/UNFCCC

NEC Directive status report 201412
Introduction
1 Introduction
'The aim [of the National Emission Ceilings Directive] is to limit emissions of acidifying and eutrophying pollutants and ozone precursors in order to improve the protection in the Community of the environment and human health ... by establishing national emission ceilings'.
Directive 2001/81/EC of the European Parliament and of the Council on national emission ceilings for certain atmospheric pollutants (known as the National Emission Ceilings Directive (NECD)) (EU, 2001) highlights the importance of reporting air pollutant emission data for assessing progress in reducing air pollution in the European Union (EU) and for ascertaining whether Member States are in compliance with their commitments (4).
This report provides an overview of the latest emission data submitted by Member States under the NECD. It also presents a comparison of the emission ceilings of nitrogen oxides (NOX), non-methane volatile organic compounds (NMVOCs) (5), sulphur dioxide (SO2), and ammonia (NH3) emissions and the reported emission data for 2012 (final data) and 2013 (provisional data). Additionally, final 2010 and 2011 emission data are discussed within this report. In instances where Member States did not resubmit new 2010 and 2011 data, emission data for these years submitted in 2012 and 2013 were used (EEA, 2013 and 2014a).
1.1 Reporting requirements under the NECD
Articles 2, 6, 7 and 8 of the NECD set out the requirements for EU Member States on national inventories, projections and programmes. According to these provisions, Member States are to prepare and annually update national total emissions estimates for the pollutants NOX, NMVOCs, SO2, and NH3. In previous years, Member States were also required to report projected emissions for the year 2010 for
all four pollutants (this is no longer required). The requirement to report future projections is included in the European Commission's proposal for a revised NECD (see Box ES.1). In addition, by 31 December each year, Member States should report to the European Commission and the EEA these national emission inventories; final emission data should be submitted for the previous year but one, as should provisional emission data for the previous year.
Member States were also obliged to report their updated national programmes for progressive reduction of national emissions of NOX, NMVOCs, SO2, and NH3 to the European Commission by the end of 2006.
To help ensure that information on emissions reported by Member States is consistent and harmonised, the NECD (Annex III) requires Member States to prepare emission inventories using the methodologies agreed upon by the LRTAP Convention. It also requests that Member States use the EMEP/Corinair emission inventory guidebook (since renamed the EMEP/EEA air pollutant emission inventory guidebook (EMEP/EEA, 2013)), in preparing their inventories and projections.
Moreover, it is considered good practice for Member States to adhere to the principles outlined in the UNECE guidelines for reporting emission data under the LRTAP Convention (UNECE, 2014a). The historic emission data presented must be 'transparent, consistent, comparable, complete and accurate'.
Further, the guidelines specify how emissions from transport should be estimated and reported. Austria, Belgium, Ireland, Lithuania, Luxembourg, the Netherlands and the United Kingdom may thus additionally choose to use the national emission total calculated based on fuels used in the geographic area of the party as a basis for compliance, whereas all other EU Member States use fuel sold as a basis.
(4) Croatia joined the EU in July 2013, and therefore data for 2010 to 2013 are shown for informative purposes only.(5) The NECD defines VOCs as being non-methane volatile organic compounds (NMVOCs), i.e. methane (CH4) is not considered.

Introduction
13NEC Directive status report 2014
1.1.1 Scope
The NECD covers emissions from all relevant sources of NOX, NMVOCs, SO2, and NH3 which arise as a result of human activities within the territory of the Member States and their exclusive economic zones, except:
• emissions from international maritime traffic;
• aircraft emissions beyond the landing and take-off cycle;
• emissions in the Canary Islands, for Spain;
• emissions in the overseas departments, for France;
• emissions in Madeira and the Azores, for Portugal.
1.1.2 Preparation of the annual NECD status report and access to information
As specified in Article 7 of the NECD, the European Commission — assisted by the EEA — must prepare inventories (and projections) for relevant pollutants, in cooperation with Member States and based on information that the Member States provide. A description of the quality assurance/quality control activities related to the compilation of the EU inventory, together with a description of the institutional arrangements and the data flow underpinning this report, are available in the NEC Directive status report 2011 (see Chapter 1.2.2 Inventory QA/QC activities, EEA, 2012).
The NECD also requires that inventories and projections be made publicly available. Data described in this report can be accessed both online from an EEA data viewer (6) (EEA, 2015b) and also separately as downloadable files from the EEA dataservice.
1.1.3 Inventory adjustment applications under the Gothenburg Protocol
In 2012, the Executive Body for the LRTAP Convention decided that adjustments to emission reduction commitments or to inventories for the purposes of comparing total national emissions with them, may be applied in some circumstances, in the event that such a circumstance contributes to a party being unable
to meet one of its reduction commitments (UNECE, 2012c). In 2012, the Executive Body for the LRTAP Convention decided that adjustments to emission reduction commitments or to inventories may be applied, in some circumstances. The EMEP Centre on Emission Inventories and Projections (CEIP) leads the adjustment procedure, coordinates the review of any supporting documentation and assesses whether the adjustment is consistent with the particular circumstances and the guidance for adjustments (UNECE, 2012d).
In 2014, inventory adjustment applications for emissions from Germany (for NOX) and Denmark (for NH3), were accepted by the EMEP Steering Body (UNECE, 2014b). Adjusted emissions of the year 2012 amount to 1 072 Gg (NOX for Germany) and 68 Gg (NH3 for Denmark), i.e. adjustments would bring Denmark below the NH3 NECD Annex I ceilings. For Belgium, France and Spain, the adjustment review process was not completed in 2014, and the applications were subsequently left pending (UNECE, 2014b). Emission data used within this report are unadjusted for all Member States. Adjusted data for 2013 are not available yet. Following guidance of the European Commission, unadjusted emission inventory data are used in this report.
1.1.4 Differences between NECD, LRTAP Convention and UNFCCC/MMR inventory reporting
In addition to reporting emission data under the NECD, Member States that are also Parties to international conventions are also required to report emissions of certain pollutants. The respective international reporting obligations are: the protocols of the LRTAP Convention (UNECE, 1979), and the EU Monitoring Mechanism (EU, 2013) and its implementing provisions. Table 1.1 provides an overview of Member States' air pollution reporting obligations. The EU as a whole is also a Party to the LRTAP Convention.
The three reporting obligations listed in Table 1.1 differ mainly in the number and type of air pollutants for which reporting is required, the geographical coverage of countries (e.g. whether overseas dependencies are included in the territories of Denmark, France, Portugal, Spain or the United Kingdom), and whether domestic and international aviation and navigation are included in the National Total.
(6) http://www.eea.europa.eu/data-and-maps/data/data-viewers/emissions-nec-directive-viewer.

Introduction
14 NEC Directive status report 2014
Table 1.1 Overview of air pollutant emission reporting obligations in the EU
Legal obligation Emission reporting requirements
Annual reporting deadline for EU Member States
Annual reporting deadline for the EU
NECD Emissions of NOX, NMVOCs, SO2 and NH3
31 December n/a
LRTAP Convention Emissions (a) of NOX (as NO2), NMVOCs, SOX (as SO2), NH3, CO, HMs, POPs and PM
15 February 30 April
EU Monitoring Mechanism/UNFCCC (UNFCCC/MMR)
Emissions of CO2, CH4, N2O, HFCs, PFCs, SF6, NF3, NOX, CO, NMVOCs and SO2
15 January (to the European Commission)15 April (to the UNFCCC)
15 April
Table 1.2 Major differences between reporting obligations: LRTAP Convention, NECD and UNFCCC/MMR
Source categories Included in National Totals Not included in National Totals but reported as a 'memo item'
Domestic aviation (landing and take-off) NECD, LRTAP, UNFCCC/MMR n/a
Domestic aviation (cruise) UNFCCC/MMR NECD, LRTAP
International aviation (landing and take-off) NECD, LRTAP UNFCCC/MMR
International aviation (cruise) n/a NECD, LRTAP, UNFCCC/MMR
National navigation (domestic shipping) NECD, LRTAP, UNFCCC/MMR n/a
International inland shipping NECD, LRTAP UNFCCC/MMR
International maritime navigation n/a NECD, LRTAP, UNFCCC/MMR
Road transport (fuel sold (a)) NECD (b), LRTAP, UNFCCC/MMR n/a
Notes: (a) Parties are formally required to report only on the substances and for the years set forth in protocols that have entered into force and that have been ratified by the party.
CH4: methane; CO: carbon monoxide; CO2: carbon dioxide; HFCs: hydrofluorocarbons; HMs: heavy metals; NF3: nitrogen trifluoride; N2O: nitrous oxide; NO2: nitrogen dioxide; PFCs: perfluorocarbons; PM: particulate matter; POPs: persistent organic pollutants; SF6: sulphur hexafluoride; SOX: sulphur oxides; SO2: sulphur dioxide.
Notes: NECD: NOX, NMVOCs, SO2 and NH3.
LRTAP: NOX, NMVOCs, SOX, NH3, CO, HMs, POPs and PM.
UNFCCC/MMR: CO2, CH4, N2O, HFCs, PFCs, SF6, NOX, NMVOCs, SO2 and CO.
(a) In addition, Member States may also report emission estimates based on fuel used as an additional 'memo item'.
(b) Austria, Belgium, Ireland, Lithuania, Luxembourg, the Netherlands, Switzerland and the United Kingdom may additionally choose to use the national emission total calculated on the basis of fuel used in the geographic area of the party as a basis for compliance (UNECE, 2014a).

15
Assessment of EU and Member State emissions
NEC Directive status report 2014
2 Assessment of EU and Member State emissions
0
2 000
4 000
6 000
8 000
10 000
20102011
20122013
20102011
20122013
20102011
20122013
20102011
20122013
Emissions (Gg)
Annex I emission ceilings Annex II emission ceilings
NOX NMVOCs SO2 NH3
Figure 2.1 EU-27 progress in meeting emission ceilings set out in NECD Annexes I and II: aggregated Member State final 2010, final 2011, final 2012 and provisional 2013 emission data, compared with EU-27 emission ceilings
This chapter compares emissions and ceilings, and presents the development of NOX, NMVOCs, SO2 and NH3 emissions as reported by the Member States under the NECD, over the last 4 years. Appendices 1 and 2 provide an overview of the data available up to and including 1 February 2015 from the current NECD reporting round used in this report. Data provided in previous reporting cycles are not considered, except in instances where Member States did not resubmit new 2010 and 2011 data, in which case the emission data submitted in 2012 and 2013 were used (EEA, 2013 and 2014a).
2.1 EU progress in meeting emission ceilings
Figure 2.1 illustrates the EU-27's progress in meeting its emission ceilings, as specified in Annexes I and II to the NECD. For all pollutants, the final 2010, final 2011, final 2012 and provisional 2013 emission data are lower than the respective aggregated 2010 ceiling (Annex I to the NECD). However, emission data for NH3 did not change much over the last four years.
Of the three stricter Annex II emission ceilings designed with the aim of achieving the NECD's interim environmental objectives by 2010, NOX emission data are above the ceiling for the final 2010, final 2011 and final 2012 data. Further, NMVOC data are above the ceiling for the final 2010 data (see Figure 2.1 and Table 2.1).
Provisional 2013 data reveal no exceedance of the Annex I or II ceilings for any of the four pollutants. However, some uncertainty exists concerning the 2013 data, since final 2013 emission data will only be reported at the end of 2015.
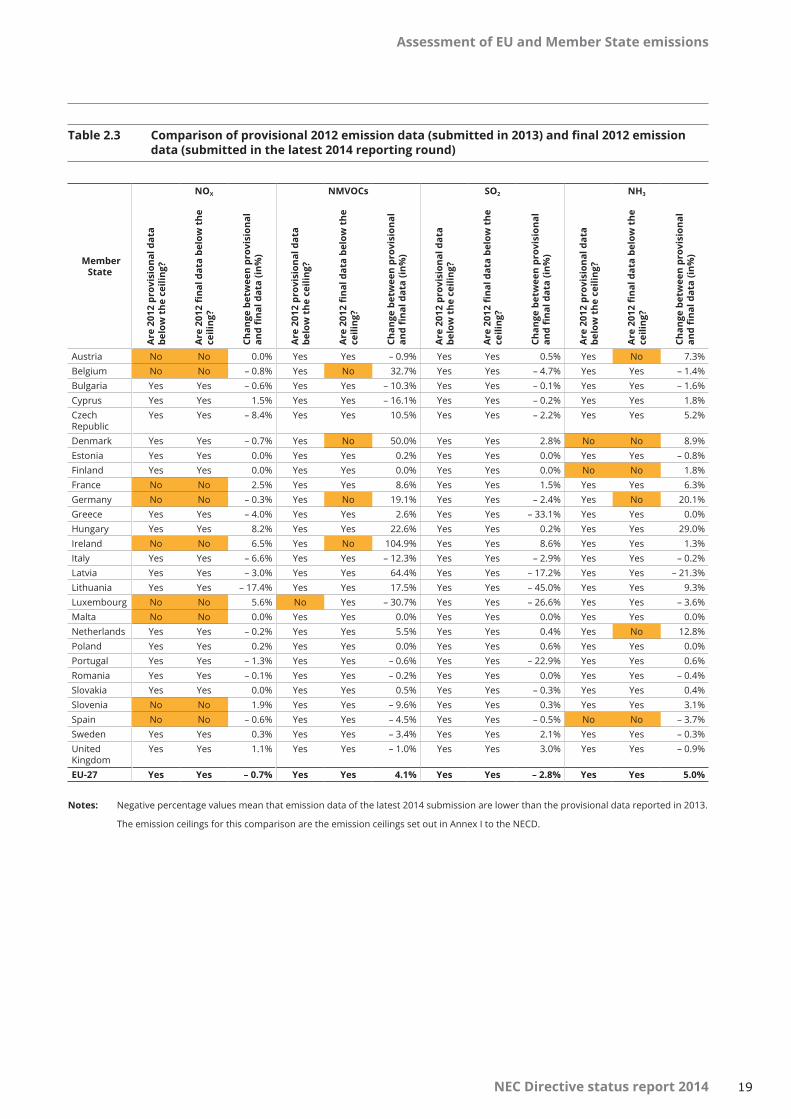
Evaluation of previous submissions shows that the range of recalculations (provisional to final) is expected to be in the range of a few percent. For
instance, a comparison of provisional 2012 emission data (submitted in 2013) and final 2012 emission data (submitted in 2014) for the EU-27 (see Table 2.3) showed that NOX, and SO2 emissions were slightly lower in the final estimate (− 0.7% and − 2.8%, respectively). In contrast, for NMVOCs and NH3, such recalculations in the national emission inventories led to an increase at EU-27 level (+ 4.1% and + 5.0%, respectively).
Notes: The emission ceilings shown are those set out for the EU in Annexes I and II to the NECD (7).
The aggregated emission estimates are a mix of unadjusted emission data reported on the basis of fuel used (6 Member States) and fuel sold (21 Member States) for mobile sources. An overview of the basis on which emissions from mobile sources was estimated is given in Table 2.4.
(7) Annexes I and II to the NECD define emission ceilings for the EU (EC, 2001). The Annex I EU ceilings represent the aggregation of individual Member State ceilings defined in that annex. The Annex II EU ceilings are stricter than those of Annex I, and are designed with the aim of attaining, by 2010, for the EU as a whole, the interim environmental objectives set out in Article 5 of the NECD (i.e. a reduction of European ecosystem areas where the critical loads for acidification are exceeded, as well as of vegetation-related ground-level ozone exposure by 2010, compared with the 1990 situation). There is no separate ceiling for NH3 defined in Annex II to the NECD.

Assessment of EU and Member State emissions
16 NEC Directive status report 2014
NECD Annex I emission ceilings NECD Annex II emission ceilings
NOX NMVOCs SO2 NH3 NOX NMVOCs SO2 NH3
Ceilings (Gg) 9 003 8 848 8 297 4 294 Ceilings (Gg) 8 180 7 585 7 832 No ceiling
Final 2010 emission data (Gg}
8 978 7 719 4 430 3 836 Final 2010 emission data (Gg)
8 978 7 719 4 430 3 836
Difference from emissions (%)
– 0.3% – 12.8% – 46.6% – 10.7% Difference from emissions (%)
9.8% 1.8% – 43.0% ---
Final 2011 emission data (Gg)
8 649 7 322 4 381 3 822 Final 2011 emission data
8 649 7 322 4 381 3 822
Difference from emissions (%)
– 3.9% – 17.3% – 47.2% – 11.0% Difference from emissions (%)
5.7% – 3.5% – 44.1% ---
Final 2012 emission data (Gg)
8 302 7 003 3 872 3 793 Final 2012 emission data
8 302 7 003 3 872 3 793
Difference from emissions (%)
– 7.8% – 20.9% – 53.3% – 11.7% Difference from emissions (%)
1.5% – 7.7% – 50.6% ---
Provisional 2013 emission data (Gg)
7 976 6 922 3 431 3 795 Provisional 2013 emission data
7 976 6 922 3 431 3 795
Difference from emissions (%)
– 11.4% – 21.8% – 58.7% – 11.6% Difference from emissions (%)
– 2.5% – 8.7% – 56.20% ---
2.2 Comparison of Member State-reported emissions data with NECD emission ceilings
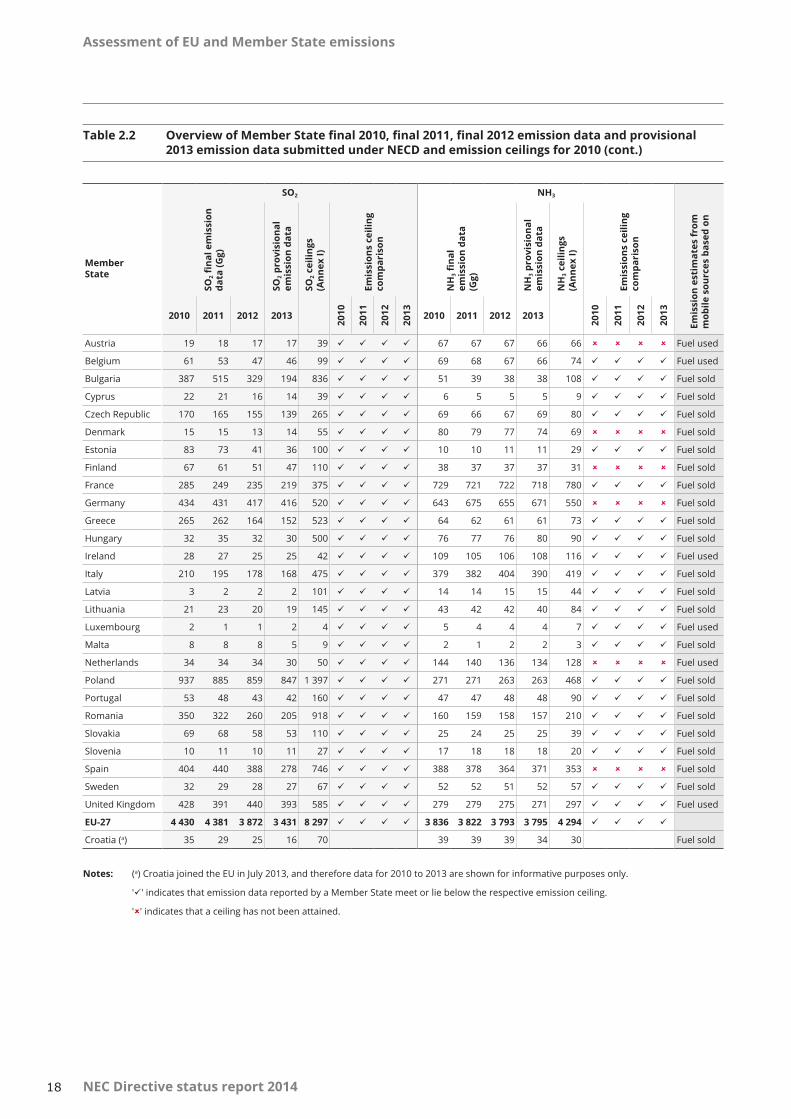
Table 2.2 provides an overview of Member State final 2010, final 2011 and final 2012 data and provisional 2013 emission data submitted under the NECD, as compared to the emission ceilings.
Final 2010 emission data show that 12 Member States exceeded one or more of the emission limits set by the NECD. On the basis of the final 2011 data, 11 Member States reported emission data above the ceiling for at least one pollutant. Final 2012 data show again 12 Member States and provisional 2013 data show 10 Member States exceeding the ceilings (Table 2.3).
Table 2.1 Comparison of aggregated EU-27 final 2010, 2011, 2012 and provisional 2013 emission data with emission ceilings
Note: The emission ceilings shown are the EU-27 emission ceilings set out in Annexes I and II to the NECD. Annex II to the NECD, addressing environmental objectives, does not define a ceiling for NH3.
In comparing provisional 2012 data reported in 2013 with final 2012 data reported in 2014, recalculations changed the status (i.e. compliance with the Annex I ceilings of the NECD) of seven Member States: Austria (NH3), Belgium (NMVOCs), Denmark (NMVOCs), Germany (NMVOCs and NH3), Ireland (NMVOCs), Luxembourg (NMVOCs) and the Netherlands (NH3) (see Section 2.3 for further details). These changes are all related to NMVOCs or NH3.
Some Member States reported very large differences (over 25%) between the provisional 2012 and final 2012 data: Ireland had the highest change (+ 104.9% for NMVOCs), followed by Latvia (+ 64.4% for NMVOCs), Denmark (+ 50.0% for NMVOCs), Lithuania (− 45.0% for SO2), Greece (− 33.1% for SO2), Belgium (+ 32.7% for NMVOCs), Luxembourg (− 30.7% for NMVOCs), Hungary (+ 29.0 for NH3), and Luxembourg (− 26.6% for SO2) (see Section 2.3 for further details).

Assessment of EU and Member State emissions
17NEC Directive status report 2014
Table 2.2 Overview of Member State final 2010, final 2011, final 2012 emission data and provisional 2013 emission data submitted under NECD and emission ceilings for 2010
NOX NMVOCs
Member State
NO
X fin
al e
mis
sion
da
ta (G
g)
NO
X pro
visi
onal
em
issi
on d
ata
NO
X cei
lings
(A
nnex
I)
Emis
sion
s ce
iling
co
mpa
riso
n
NM
VOCs
fina
l em
issi
on d
ata
(Gg)
NM
VOCs
pr
ovis
iona
l em
issi
on d
ata
NM
VOC
ceili
ngs
(Ann
ex I)
Emis
sion
s ce
iling
co
mpa
riso
n
2010 2011 2012 2013
2010
2011
2012
2013 2010 2011 2012 2013
2010
2011
2012
2013
Austria 148 145 141 136 103 129 125 132 125 159 ü ü ü ü
Belgium 229 214 204 197 176 155 143 141 138 139 ü
Bulgaria 117 136 123 112 247 ü ü ü ü 93 91 82 80 175 ü ü ü ü
Cyprus 19 21 21 16 23 ü ü ü ü 10 8 8 7 14 ü ü ü ü
Czech Republic 239 225 193 179 286 ü ü ü ü 151 136 146 134 220 ü ü ü ü
Denmark 132 124 115 110 127 ü ü ü 125 119 116 114 85
Estonia 37 36 32 30 60 ü ü ü ü 35 33 34 33 49 ü ü ü ü
Finland 167 154 147 145 170 ü ü ü ü 116 106 105 95 130 ü ü ü ü
France 1 096 1 036 1 008 990 810 874 807 772 758 1 050 ü ü ü ü
Germany 1 334 1 311 1 270 1 269 1 051 1 239 1 169 1 136 1 138 995
Greece 319 296 248 239 344 ü ü ü ü 185 159 156 145 261 ü ü ü ü
Hungary 156 143 127 123 198 ü ü ü ü 129 123 122 124 137 ü ü ü ü
Ireland 82 73 76 77 65 91 89 88 90 55
Italy 964 930 849 837 990 ü ü ü ü 1 080 989 836 878 1 159 ü ü ü ü
Latvia 38 33 34 34 61 ü ü ü ü 89 88 89 87 136 ü ü ü ü
Lithuania 50 46 48 49 110 ü ü ü ü 71 69 70 65 92 ü ü ü ü
Luxembourg 18 19 18 15 11 7 7 7 7 9 ü ü ü ü
Malta 8 8 9 5 8 ü ü 3 3 3 3 12 ü ü ü ü
Netherlands 274 258 248 240 260 ü ü ü 158 156 154 150 185 ü ü ü ü
Poland 861 842 819 796 879 ü ü ü ü 653 638 630 636 800 ü ü ü ü
Portugal 181 173 167 166 250 ü ü ü ü 179 173 167 168 180 ü ü ü ü
Romania 218 223 226 194 437 ü ü ü ü 365 356 354 334 523 ü ü ü ü
Slovakia 89 85 81 80 130 ü ü ü ü 64 70 61 63 140 ü ü ü ü
Slovenia 45 46 46 43 45 ü ü 35 41 35 34 40 ü ü ü
Spain 886 881 850 750 847 ü 634 603 556 538 662 ü ü ü ü
Sweden 150 139 131 126 148 ü ü ü 192 187 179 174 241 ü ü ü ü
United Kingdom 1 123 1 051 1 073 1 020 1 167 ü ü ü ü 855 835 824 803 1 200 ü ü ü ü
EU-27 8 978 8 649 8 302 7 976 9 003 ü ü ü ü 7 719 7 322 7 003 6 922 8 848 ü ü ü ü
Croatia (*) 64 60 56 56 87 55 53 49 46 90
Assessment of EU and Member State emissions
18 NEC Directive status report 2014
Table 2.2 Overview of Member State final 2010, final 2011, final 2012 emission data and provisional 2013 emission data submitted under NECD and emission ceilings for 2010 (cont.)
SO2 NH3
Member State
SO2 f
inal
em
issi
on
data
(Gg)
SO2 p
rovi
sion
al
emis
sion
dat
a
SO2 c
eilin
gs
(Ann
ex I)
Emis
sion
s ce
iling
co
mpa
riso
n
NH
3 fin
al
emis
sion
dat
a (G
g)
NH
3 pro
visi
onal
em
issi
on d
ata
NH
3 cei
lings
(A
nnex
I)
Emis
sion
s ce
iling
co
mpa
riso
n
Emis
sion
est
imat
es fr
om
mob
ile s
ourc
es b
ased
on
2010 2011 2012 2013
2010
2011
2012
2013 2010 2011 2012 2013
2010
2011
2012
2013
Austria 19 18 17 17 39 ü ü ü ü 67 67 67 66 66 Fuel used
Belgium 61 53 47 46 99 ü ü ü ü 69 68 67 66 74 ü ü ü ü Fuel used
Bulgaria 387 515 329 194 836 ü ü ü ü 51 39 38 38 108 ü ü ü ü Fuel sold
Cyprus 22 21 16 14 39 ü ü ü ü 6 5 5 5 9 ü ü ü ü Fuel sold
Czech Republic 170 165 155 139 265 ü ü ü ü 69 66 67 69 80 ü ü ü ü Fuel sold
Denmark 15 15 13 14 55 ü ü ü ü 80 79 77 74 69 Fuel sold
Estonia 83 73 41 36 100 ü ü ü ü 10 10 11 11 29 ü ü ü ü Fuel sold
Finland 67 61 51 47 110 ü ü ü ü 38 37 37 37 31 Fuel sold
France 285 249 235 219 375 ü ü ü ü 729 721 722 718 780 ü ü ü ü Fuel sold
Germany 434 431 417 416 520 ü ü ü ü 643 675 655 671 550 Fuel sold
Greece 265 262 164 152 523 ü ü ü ü 64 62 61 61 73 ü ü ü ü Fuel sold
Hungary 32 35 32 30 500 ü ü ü ü 76 77 76 80 90 ü ü ü ü Fuel sold
Ireland 28 27 25 25 42 ü ü ü ü 109 105 106 108 116 ü ü ü ü Fuel used
Italy 210 195 178 168 475 ü ü ü ü 379 382 404 390 419 ü ü ü ü Fuel sold
Latvia 3 2 2 2 101 ü ü ü ü 14 14 15 15 44 ü ü ü ü Fuel sold
Lithuania 21 23 20 19 145 ü ü ü ü 43 42 42 40 84 ü ü ü ü Fuel sold
Luxembourg 2 1 1 2 4 ü ü ü ü 5 4 4 4 7 ü ü ü ü Fuel used
Malta 8 8 8 5 9 ü ü ü ü 2 1 2 2 3 ü ü ü ü Fuel sold
Netherlands 34 34 34 30 50 ü ü ü ü 144 140 136 134 128 Fuel used
Poland 937 885 859 847 1 397 ü ü ü ü 271 271 263 263 468 ü ü ü ü Fuel sold
Portugal 53 48 43 42 160 ü ü ü ü 47 47 48 48 90 ü ü ü ü Fuel sold
Romania 350 322 260 205 918 ü ü ü ü 160 159 158 157 210 ü ü ü ü Fuel sold
Slovakia 69 68 58 53 110 ü ü ü ü 25 24 25 25 39 ü ü ü ü Fuel sold
Slovenia 10 11 10 11 27 ü ü ü ü 17 18 18 18 20 ü ü ü ü Fuel sold
Spain 404 440 388 278 746 ü ü ü ü 388 378 364 371 353 Fuel sold
Sweden 32 29 28 27 67 ü ü ü ü 52 52 51 52 57 ü ü ü ü Fuel sold
United Kingdom 428 391 440 393 585 ü ü ü ü 279 279 275 271 297 ü ü ü ü Fuel used
EU-27 4 430 4 381 3 872 3 431 8 297 ü ü ü ü 3 836 3 822 3 793 3 795 4 294 ü ü ü ü
Croatia (a) 35 29 25 16 70 39 39 39 34 30 Fuel sold
Notes: (a) Croatia joined the EU in July 2013, and therefore data for 2010 to 2013 are shown for informative purposes only.
'ü' indicates that emission data reported by a Member State meet or lie below the respective emission ceiling.
'' indicates that a ceiling has not been attained.
Assessment of EU and Member State emissions
19NEC Directive status report 2014
Table 2.3 Comparison of provisional 2012 emission data (submitted in 2013) and final 2012 emission data (submitted in the latest 2014 reporting round)
Member State
NOX NMVOCs SO2 NH3
Are
201
2 pr
ovis
iona
l dat
a be
low
the
cei
ling?
Are
201
2 fi
nal d
ata
belo
w t
he
ceili
ng?
Chan
ge b
etw
een
prov
isio
nal
and
fina
l dat
a (in
%)
Are
201
2 pr
ovis
iona
l dat
a be
low
the
cei
ling?
Are
201
2 fi
nal d
ata
belo
w t
he
ceili
ng?
Chan
ge b
etw
een
prov
isio
nal
and
fina
l dat
a (in
%)
Are
201
2 pr
ovis
iona
l dat
a be
low
the
cei
ling?
Are
201
2 fi
nal d
ata
belo
w t
he
ceili
ng?
Chan
ge b
etw
een
prov
isio
nal
and
fina
l dat
a (in
%)
Are
201
2 pr
ovis
iona
l dat
a be
low
the
cei
ling?
Are
201
2 fi
nal d
ata
belo
w t
he
ceili
ng?
Chan
ge b
etw
een
prov
isio
nal
and
fina
l dat
a (in
%)
Austria No No 0.0% Yes Yes – 0.9% Yes Yes 0.5% Yes No 7.3%Belgium No No – 0.8% Yes No 32.7% Yes Yes – 4.7% Yes Yes – 1.4%Bulgaria Yes Yes – 0.6% Yes Yes – 10.3% Yes Yes – 0.1% Yes Yes – 1.6%Cyprus Yes Yes 1.5% Yes Yes – 16.1% Yes Yes – 0.2% Yes Yes 1.8%Czech Republic
Yes Yes – 8.4% Yes Yes 10.5% Yes Yes – 2.2% Yes Yes 5.2%
Denmark Yes Yes – 0.7% Yes No 50.0% Yes Yes 2.8% No No 8.9%Estonia Yes Yes 0.0% Yes Yes 0.2% Yes Yes 0.0% Yes Yes – 0.8%Finland Yes Yes 0.0% Yes Yes 0.0% Yes Yes 0.0% No No 1.8%France No No 2.5% Yes Yes 8.6% Yes Yes 1.5% Yes Yes 6.3%Germany No No – 0.3% Yes No 19.1% Yes Yes – 2.4% Yes No 20.1%Greece Yes Yes – 4.0% Yes Yes 2.6% Yes Yes – 33.1% Yes Yes 0.0%Hungary Yes Yes 8.2% Yes Yes 22.6% Yes Yes 0.2% Yes Yes 29.0%Ireland No No 6.5% Yes No 104.9% Yes Yes 8.6% Yes Yes 1.3%Italy Yes Yes – 6.6% Yes Yes – 12.3% Yes Yes – 2.9% Yes Yes – 0.2%Latvia Yes Yes – 3.0% Yes Yes 64.4% Yes Yes – 17.2% Yes Yes – 21.3%Lithuania Yes Yes – 17.4% Yes Yes 17.5% Yes Yes – 45.0% Yes Yes 9.3%Luxembourg No No 5.6% No Yes – 30.7% Yes Yes – 26.6% Yes Yes – 3.6%Malta No No 0.0% Yes Yes 0.0% Yes Yes 0.0% Yes Yes 0.0%Netherlands Yes Yes – 0.2% Yes Yes 5.5% Yes Yes 0.4% Yes No 12.8%Poland Yes Yes 0.2% Yes Yes 0.0% Yes Yes 0.6% Yes Yes 0.0%Portugal Yes Yes – 1.3% Yes Yes – 0.6% Yes Yes – 22.9% Yes Yes 0.6%Romania Yes Yes – 0.1% Yes Yes – 0.2% Yes Yes 0.0% Yes Yes – 0.4%Slovakia Yes Yes 0.0% Yes Yes 0.5% Yes Yes – 0.3% Yes Yes 0.4%Slovenia No No 1.9% Yes Yes – 9.6% Yes Yes 0.3% Yes Yes 3.1%Spain No No – 0.6% Yes Yes – 4.5% Yes Yes – 0.5% No No – 3.7%Sweden Yes Yes 0.3% Yes Yes – 3.4% Yes Yes 2.1% Yes Yes – 0.3%United Kingdom
Yes Yes 1.1% Yes Yes – 1.0% Yes Yes 3.0% Yes Yes – 0.9%
EU-27 Yes Yes – 0.7% Yes Yes 4.1% Yes Yes – 2.8% Yes Yes 5.0%
Notes: Negative percentage values mean that emission data of the latest 2014 submission are lower than the provisional data reported in 2013.
The emission ceilings for this comparison are the emission ceilings set out in Annex I to the NECD.

Assessment of EU and Member State emissions
20 NEC Directive status report 2014
2.3 Analysis of Member State emissions per pollutant
For the four NECD pollutants, Figures 2.2–2.5 illustrate the relative difference (8) between final 2010, 2011 and 2012, and provisional 2013 emissions and the respective emission ceilings. Positive percentage values indicate that emissions breached the emission ceiling.
The reported National Total of Austria, Belgium, Ireland, Luxembourg, the Netherlands and the United Kingdom are based on fuel used. All other Member States reported a National Total based on fuel sold. The aggregated EU-27 emission total is thus based on data for fuel used and for fuel sold. The emission ceilings for this comparison are those set out in Annex I to the NECD.
2.3.1 NOX emissions
Analysis of the official final 2010 data indicates that 11 Member States exceeded their respective NOX ceilings for that year (Austria, Belgium, Denmark, France, Germany, Ireland, Luxembourg, Malta, the Netherlands, Spain and Sweden). Eight Member States (Austria, Belgium, France, Germany, Ireland, Luxembourg, Slovenia and Spain) exceeded the ceiling in 2011. Nine Member States (the same eight Member States as for 2011, plus Malta) exceeded the NOX emission ceiling in 2012. In 2013, six Member States (Austria, Belgium, France, Germany, Ireland, and Luxembourg) exceeded their ceilings. The highest exceedance in 2013 (in percentage terms) was reported for Luxembourg (41%).
The largest emitters of NOX in 2013 were Germany, the United Kingdom, and France. Between 2012 and 2013, 25 Member States reported emission reductions. The total reduction for the EU-27 between 2012 and 2013 amounts to − 3.9%. The highest absolute reductions between 2012 and 2013 occurred in Spain, the United Kingdom and Romania.
Provisional 2013 NOX emission data show that six Member States (Austria, Belgium, France, Germany, Ireland and Luxembourg) did not attain their ceilings in the year 2013 (see Figure 2.2).
2.3.2 NMVOC emissions
Emission data for NMVOCs are above the ceilings for four Member States (Belgium, Denmark, Germany and Ireland) in 2010 and 2012, and for five Member States in 2011 (the same four Member States, plus Slovenia). Provisional 2013 emission data of NMVOCs are above the ceilings for three Member States (Denmark, Germany and Ireland). The highest exceedance in 2013 (in percentage terms) was reported for Ireland (64%).
The largest emitters of NMVOCs in 2013 were Germany, Italy and the United Kingdom. Between 2012 and 2013, 19 Member States reported emission reductions. The total reduction for the EU-27 between 2012 and 2013 amounts to − 1.2%. The highest absolute reductions between 2012 and 2013 were achieved in Romania, the United Kingdom and Spain.
For 2013, the provisional emission data of 24 Member States fell below their respective ceilings (see Figure 2.3). Denmark, Germany and Ireland exceeded their ceilings in the year 2013.
Belgium, Denmark, Germany and Ireland reported a large difference between the provisional 2012 data (submitted in the previous reporting round) and the final 2012 data (Belgium + 32.7%, Denmark + 50%, Germany + 19.1% and Ireland + 104.9%). These increases change the attainment status of the four countries, and their NMVOC emissions of the year 2012 are now above their ceilings (see Table 2.3). The changes are primarily attributable to reporting of additional sources in the agriculture sector. The additional reporting of NMVOC emissions for agriculture also affects the attainment of the ceilings for Denmark, Germany and Ireland in 2013 (see Table 2.6).
(8) The relative difference between emissions and the emission ceilings was estimated as 100 x (Eem – Eceil)/Eceil (%), where Eem are the emissions of years 2010, 2011, 2012 or 2013, respectively, and Eceil is the 2010 Annex I ceiling value of the NECD.

Assessment of EU and Member State emissions
21NEC Directive status report 2014
Figure 2.2 Distance from ceiling (%) for NOX emissions in 2010, 2011, 2012 and 2013
– 100 – 50 0 50 100
Romania
Lithuania
Bulgaria
Estonia
Latvia
Malta
Slovakia
Hungary
Czech Republic
Portugal
Greece
Cyprus
Italy
Sweden
Finland
Denmark
United Kingdom
Spain
Poland
Netherlands
Slovenia
EU-27
Belgium
Ireland
Germany
France
Austria
Luxembourg
2011 emissions lower than ceiling2012 emissions lower than ceiling
2010 emissions lower than ceiling
2013 emissions lower than ceiling
2010 emissions higher than ceiling2011 emissions higher than ceiling2012 emissions higher than ceiling2013 emissions higher than ceiling
%
Latvia reported a large difference between the provisional 2012 data (submitted in the previous reporting round) and the final 2012 data (+ 64.4%). The largest changes occurred within the 'Solvents' sector (9) in several categories, with the biggest change in the category '2D3i — Other solvent use'. Other notable changes occurred owing to reporting of additional sources in the agriculture sector. Latvia stated (NEC report of Latvia, 2014) that recalculations in the 'Solvents' sector were carried out for two reasons: first, the list of NMVOCs substances was supplemented, and second, the time series consistency was performed using one method for the whole time series.
Provisional 2012 emission data (submitted in 2013) indicated that Luxembourg did not attain its NMVOC emission ceiling. However, recently submitted final 2012 emission data now indicate that Luxembourg's NMVOC emissions are below its ceiling. A large difference between the provisional 2012 data and the final 2012 data was reported (− 30.7%). This is mainly attributable to recalculations in the categories 2D3a (Domestic solvent use including fungicides) and 2D3d to 2D3i (Coating applications, Degreasing, Dry cleaning, Chemical products, Printing and Other solvent use).
(9) According to the NECD sector aggregation used for the 'old' nomenclature for reporting (NFR-09) template.

Assessment of EU and Member State emissions
22 NEC Directive status report 2014
Figure 2.3 Distance from ceiling (%) for NMVOC emissions in 2010, 2011, 2012 and 2013
%– 100 – 50 0 50 100
Malta
Slovakia
Bulgaria
Cyprus
Greece
Czech Republic
Romania
Latvia
Estonia
United Kingdom
Lithuania
Sweden
France
Finland
Luxembourg
Italy
EU-27
Austria
Poland
Netherlands
Spain
Slovenia
Hungary
Portugal
Belgium
Germany
Denmark
Ireland
2011 emissions lower than ceiling2012 emissions lower than ceiling
2010 emissions lower than ceiling
2013 emissions lower than ceiling
2010 emissions higher than ceiling2011 emissions higher than ceiling2012 emissions higher than ceiling2013 emissions higher than ceiling
2.3.3 SO2 emissions
All Member States complied with the emission ceilings for SO2.
The largest emitters of SO2 in 2013 were Poland, Germany and the United Kingdom. Between 2012 and 2013, 23 EU Member States reported emission reductions. The total reduction for the EU-27 between 2012 and 2013 amounts to − 11.4%. The highest absolute reductions between 2012 and 2013 occurred in Bulgaria, Spain and Romania.
Final 2010, 2011, 2012 and provisional 2013 SO2 emission data of all EU-27 Member States were below their respective ceilings (see Figure 2.4).
Lithuania reported very large differences between the provisional 2012 (submitted in the previous reporting round) and final 2012 data (− 45.0%). The highest changes occurred in the categories '1A1a — Public electricity and heat production', '1A2f — Stationary combustion in manufacturing industries and construction: Non-metallic minerals' and '1A4bi — Residential: Stationary'.
Greece reported major differences between the provisional 2012 and final 2012 data (– 33.1%). These differences arise from recalculations in the category '1A1a — Public Electricity and Heat Production'.
Likewise, Luxembourg reported major differences between the provisional 2012 and final 2012 data (− 26.6%). The highest change occurred in the

Assessment of EU and Member State emissions
23NEC Directive status report 2014
Figure 2.4 Distance from ceiling (%) for SO2 emissions in 2010, 2011, 2012 and 2013
– 100 – 50 0 50 100
Latvia
Hungary
Lithuania
Romania
Bulgaria
Denmark
Portugal
Greece
Cyprus
Italy
Estonia
Spain
Luxembourg
Sweden
EU-27
Slovenia
Finland
Austria
Belgium
Slovakia
Czech Republic
Malta
France
Netherlands
Ireland
Poland
United Kingdom
Germany
2011 emissions lower than ceiling
2012 emissions lower than ceiling
2010 emissions lower than ceiling
2013 emissions lower than ceiling
2010 emissions higher than ceiling
2011 emissions higher than ceiling
2012 emissions higher than ceiling
2013 emissions higher than ceiling
%
categories '1A4bi — Residential: Stationary' and '1A4ai — Commercial/institutional: Stationary'.
Reasons for the differences in data from Greece, Lithuania and Luxembourg can be analysed if these countries submit an informative inventory report.
2.3.4 NH3 emissions
Emission data for NH3 of the years 2010, 2011, 2012 (final data) and 2013 (provisional data) exceeded the ceilings in six Member States (Austria, Denmark, Finland, Germany, the Netherlands and Spain). The highest exceedance in 2013 (in percentage terms) was reported for Germany (22%).
The largest emitters of NH3 in 2013 were France, Germany and Italy. Between 2012 and 2013, 16 of 27 EU Member States reported emission reductions. There was no reduction for the EU-27 between 2012 and 2013. The highest absolute reductions between 2012 and 2013 occurred in Italy, and the highest absolute increase in Germany.
Provisional NH3 emission data show that six Member States (Austria, Denmark, Finland, Germany, the Netherlands and Spain) did not achieve their ceilings in the year 2013. The same six Member States exceeded their respective NH3 ceilings in 2010, 2011 and 2012 (see Figure 2.5).

Assessment of EU and Member State emissions
24 NEC Directive status report 2014
Figure 2.5 Distance from ceiling (%) for NH3 emissions in 2010, 2011, 2012 and 2013
2011 emissions lower than ceiling
2012 emissions lower than ceiling
2010 emissions lower than ceiling
2013 emissions lower than ceiling
2010 emissions higher than ceiling
2011 emissions higher than ceiling
2012 emissions higher than ceiling
2013 emissions higher than ceiling
– 100 – 50 0 50 100
Latvia
Bulgaria
Estonia
Lithuania
Cyprus
Malta
Portugal
Poland
Luxembourg
Slovakia
Romania
Greece
Czech Republic
EU-27
Belgium
Hungary
Slovenia
United Kingdom
Sweden
France
Ireland
Italy
Austria
Netherlands
Spain
Denmark
Finland
Germany%
Austria reported an increase of NH3 emissions when comparing the provisional 2012 data (submitted in the previous reporting round) and the final 2012 data. This changes the attainment status (see Table 2.3). The NH3 emissions are now above the ceiling for the years from 2010 through 2013. The changes are primarily attributable to recalculations in the agriculture sector. Austria stated (NEC report of Austria, 2014) that in a new study, the Austrian inventory model for the sector agriculture was revised according to the 2006 IPCC Guidelines (IPCC, 2006) and the EMEP/EEA air pollutant emission inventory guidebook (EMEP/EEA, 2013). The Austrian sectorial inventory model follows the N-flow concept. The final 2012 NH3 emissions however now exceed the ceiling — likewise for the years 2010, 2011 and 2013. The changes are primarily due to recalculations in the agriculture sector. Based on a new study, the Austrian inventory model for the
agriculture sector was revised. The Austrian sectorial inventory model follows the nitrogen (N-flow) concept. Due to the applied N balance model, which considers reactions throughout the N-flow in agricultural systems, the recalculations resulted in higher NH3 emissions and lower N2O emissions.
Also, Germany and the Netherlands reported increases in NH3 emissions concerning provisional 2012 data and final 2012 data, i.e. towards non-attainment with their ceilings (see Table 2.3). The changes are primarily due to recalculations in the agriculture sector.
Hungary reported a large difference between the provisional 2012 data (submitted in the previous reporting round) and the final 2012 data (+ 29.0%). The changes again occurred in the agriculture sector.

Assessment of EU and Member State emissions
25NEC Directive status report 2014
Figure 2.6 Reporting status — date of first NECD inventory submission to CDR
1.12.2014 31.12.2014 30.1.2015
PolandFinland
SloveniaUnited Kingdom
MaltaSweden
DenmarkLithuaniaGermany
IrelandRomania
FranceBelgium
Czech RepublicSpain
EstoniaBulgariaSlovakia
CyprusAustria
LatviaNetherlands
CroatiaLuxembourg
Portugal
HungaryItaly
Greece
Date of submission
NECD reporting 2014
2.4 Timeliness and transparency of reporting
Information in this section is based on submissions from Member States delivered to the EEA via the Eionet Reportnet Central Data Repository (CDR) and explanatory information provided by Member States directly to the ETC/ACM.
2.4.1 Timeliness and completeness
In the 2014 reporting cycle (10), all Member States provided the mandatory information on final 2012 emissions and the provisional 2013 emission data. Three Member States submitted these data after the formal deadline for submission: Hungary, Italy and Greece (see Figure 2.6).
Data from the Member States must be compiled in order to allow comparison with the respective EU-27 ceilings as set out in Annexes I and II to the NECD. It is therefore extremely important that Member States report complete emission data sets.
2.4.2 Transparency of submitted information
Providing IIRs or explanatory information that describes the methods and sources of reported data is not mandatory under the NECD, meaning that the transparency of submitted information is rather limited. Nevertheless, 11 Member States (Austria, Croatia, Estonia, Finland, Germany, Latvia, Poland, Romania, the Netherlands, Slovakia and Sweden) voluntarily submitted an inventory report alongside their NECD inventories (11).
More detailed information about the quality of the 2014 NECD submissions (for example, in terms of its internal consistency and completeness) will be provided in the annual joint EEA and EMEP/CEIP inventory review report (EMEP/EEA, 2015). Data described in this report are also available from the EEA online data viewer (EEA, 2015b).
2.5 Basis for estimating emissions from mobile sources
In preparing emission inventories and projections under the NECD, Member States should apply the principles outlined in the UNECE guidelines for reporting emission data under the LRTAP Convention (UNECE, 2014a). Article V/A, paragraph 22 of these guidelines specifies how emissions from transport should be reported: 'For emissions from transport, all Parties should calculate emissions consistent with national energy balances reported to Eurostat or the International Energy Agency. Emissions from road vehicle transport should therefore be calculated on the basis of the fuel sold in the Party concerned. In addition, Parties may voluntarily calculate emissions from road vehicles based on fuel used or kilometres driven in the geographic area of the party. The method for the estimate(s) should be clearly specified in the IIR.'
Paragraph 23 of the guidelines details the basis for compliance checking: 'For Parties for which emission ceilings are derived from national energy projections based on the amount of fuels sold, compliance checking will be based on fuels sold in the geographic area of the Party. Other Parties within the EMEP region
(10) The reporting deadline for the 2014 reporting cycle was 31.12.2014.(11) By comparison, 23 Member States submitted IIRs under the LRTAP Convention by 31 March 2015 (EEA, 2015a).

Assessment of EU and Member State emissions
26 NEC Directive status report 2014
Table 2.4 Basis for estimating emissions from mobile sources in 2013
Member State Road transport based on...
Two National Totals reported (based on fuel sold and fuel
used)?
Austria (a) Fuel used Yes
Belgium (a) Fuel used Yes
Bulgaria Fuel sold No
Croatia Fuel sold No
Cyprus Fuel sold No
Czech Republic Fuel sold No
Denmark Fuel sold No
Estonia Fuel sold No
Finland Fuel sold No
France Fuel sold No
Germany Fuel sold No
Greece Fuel sold No
Hungary Fuel sold No
Ireland (a) Fuel used Yes
Italy Fuel sold No
Latvia Fuel sold No
Lithuania (a) Fuel sold No
Luxembourg (a) Fuel used Yes
Malta Fuel sold No
Netherlands (a) Fuel used No
Poland Fuel sold No
Portugal Fuel sold No
Romania Fuel sold No
Slovakia Fuel sold No
Slovenia Fuel sold No
Spain Fuel sold No
Sweden Fuel sold No
United Kingdom (a) Fuel used No
(i.e. Austria, Belgium, Ireland, Lithuania, Luxembourg, the Netherlands, Switzerland and the United Kingdom of Great Britain and Northern Ireland) may choose to use the national emission total calculated on the basis of fuels used in the geographic area of the Party as a basis for compliance with their respective emission ceilings.'
The difference between transport emissions estimated using the amount of fuel sold within a country and emissions estimated using the amount of fuel consumed (i.e. fuel used) in a country can be relatively
large for countries where 'tank tourism' occurs, i.e. where fuel purchased within a country is actually used outside the country and vice versa. This can lead to omissions or double counting at EU level.
The sum of EU-27 emissions is based on information reported by Member States that includes both data on fuel used (6 Member States) and fuel sold (21 Member States). Table 2.4 gives an overview of related Member State reporting.
2.6 Potential underestimation of Member State emissions due to non-reporting of emissions from certain sectors
Since the original integrated assessment modelling undertaken to help determine the 2010 emission ceilings, knowledge on sources of air pollutants has grown. In several instances, 'new' emission sources for the pollutants covered within the scope of the NECD have been recognised; on the basis of subsequent measurements, emission factors have been developed that now allow emission estimates to be made.
As a result, several (but not all) Member States now report emissions from 'new' pollutant–source category combinations not included in the original modelling. Examples of such combinations are NOX and NMVOC emissions from the agriculture sector (NFR code 3) or NH3 from the categories 3Da4 (Crop residues applied to soils) and 3De (Cultivated crops).
The EMEP/EEA air pollutant emission inventory guidebook (EMEP/EEA, 2013) provides Member States with default methodologies and emission factors that they can use in order to estimate emissions. Not all 'new' pollutant–source combinations are assigned a default method with default emission factors in the guidebook. This occurs, for example, when scientific evidence is deemed insufficient to recommend an emission factor as suitable for use across Europe. Nevertheless, in a number of Member States, national methods and data are available that have been applied to estimate emissions for these combinations.
2.6.1 Assessment of Member State reporting of NOX and NMVOC emissions from the agriculture sector
The number of Member States that report emissions from the 'new' sources NOX and NMVOCs from the agriculture sector in 2013 was assessed. This allows an assessment of the significance of emissions in these new categories compared to the reported National Totals for comparison with the national emissions
Notes: (a) indicates that these countries may additionally report national emission totals calculated based on fuels used in the geographic area of the party as a basis for compliance.
Marked entries means that those countries have not reported a National Total on the basis of fuel sold.

Assessment of EU and Member State emissions
27NEC Directive status report 2014
Table 2.5 Share of NOX emissions from the agriculture sector to Member States' National Total, and comparison with NECD Annex I ceilings for 2013
Member State Number of categories, where values were
reported
Share of NOX emissions on the National Total
Emissions (National Total) — ceiling
comparison
Emissions (NT excl. NOX from agriculture) — ceiling comparison
Hungary 14 11% ü ü
Germany 13 9%
Latvia 10 6% ü ü
Croatia 12 6% ü ü
Belgium 12 5%
Austria 16 4%
Estonia 9 4% ü ü
Slovenia 13 4% ü ü
Portugal 16 3% ü ü
Bulgaria 1 3% ü ü
Spain 2 2% ü ü
Luxembourg 1 2%
Poland 1 1% ü ü
Netherlands 11 1% ü ü
Cyprus 12 1% ü ü
Greece 1 1% ü ü
Denmark 14 1% ü ü
Romania 8 < 1% ü ü
France 1 < 1%
Italy 1 < 1% ü ü
Finland 1 < 1% ü ü
ceilings (see Tables 2.5 and 2.6). The NOX and NMVOC emissions from all Member States and categories of the agriculture sector were also summed and compared with the total EU-27 emissions for the years 2010, 2011, 2012 and 2013 (see Table 2.7).
NOX emissions from the agriculture sector (Table 2.5)
Data for NOX from the agriculture sector were reported by 21 Member States for the year 2013. The share of National Total NOX emissions attributed to agricultural activities was higher than 4% in only five countries (Hungary, Germany, Latvia, Croatia and Belgium). The exclusion from the National Total of NOX emissions from the agriculture sector from the National Total does not change the attainment status of any Member State.
NMVOC emissions from the agriculture sector (Table 2.6)
Data for NMVOCs from the agriculture sector were reported by 23 Member States for the year 2013. The
share of National Total NMVOC emissions that was attributed to agricultural activities was significant (> 10%) in 11 countries. The exclusion from the National Total of NMVOC emissions from the agriculture sector would change the attainment status of three Member States Denmark and Germany and Ireland).
NOX and NMVOC emissions from the agriculture sector at EU-27 level (Table 2.7)
At EU-27 level in 2013, deducting NOX emissions from the agriculture sector amounts to 2.4% of the total emissions in 2013. For year 2012 data, excluding NOX data from the agriculture sector would have brought the emissions below the EU Annex II ceiling. The subtraction of NMVOC emissions from the agriculture sector amounts to 8.5% of total emissions in 2013. In the year 2010, the exclusion of NMVOC data from the agriculture sector would have brought the emissions below the EU Annex II ceiling.
Notes: 'ü' indicates that provisional emission data reported by a Member State meet or lie below the respective emission ceiling. '' indicates that a ceiling has not been attained.

Assessment of EU and Member State emissions
28 NEC Directive status report 2014
Table 2.6 Share of NMVOC emissions from the agriculture sector to Member States' National Total, and comparison with the NECD Annex I ceilings for 2013
Member State Number of agricultural source categories
Share of agricultural NMVOC emissions of the
National Total
Emissions (National Total) — ceiling
comparison
Emissions (NT excl. NMVOCs from
agriculture) — ceiling comparison
Ireland 13 47% ü
Denmark 13 33% ü
Bulgaria 2 27% ü ü
Belgium 11 27% ü ü
Cyprus 12 22% ü ü
Romania 7 19% ü ü
Germany 11 18% ü
Hungary 14 17% ü ü
Slovenia 11 16% ü ü
Estonia 8 12% ü ü
United Kingdom 7 12% ü ü
Latvia 9 8% ü ü
Spain 1 7% ü ü
Luxembourg 1 3% ü ü
Croatia 1 1% ü ü
Austria 2 1% ü ü
Portugal 15 1% ü ü
Slovakia 1 1% ü ü
France 1 < 1% ü ü
Finland 1 < 1% ü ü
Poland 2 < 1% ü ü
Italy 9 < 1% ü ü
Netherlands 1 < 1% ü ü
Notes: 'ü' indicates that provisional emission data reported by a Member State meet or lie below the respective emission ceiling. '' indicates that a ceiling has not been attained.
Table 2.7 Effect on NOX and NMVOC emissions of the 'new' emission source categories within the agriculture sector on EU total emissions
EU-27 emissions as reported (Gg)
Amount of the agriculture sector (Gg)
EU-27 without emissions from the
agriculture sector (Gg)
EU-27 emissions — ceiling (Annex I)
comparison
EU-27 emissions
(excl. agric.) — ceiling (Annex I)
comparison
EU-27 emissions — ceiling (Annex II)
comparison
EU-27 emissions
(excl. agric.) — ceiling (Annex II)
comparison
NOX 2010 8 978 178 8 800 ü ü
2011 8 649 188 8 461 ü ü
2012 8 302 187 8 115 ü ü ü
2013 7 976 191 7 785 ü ü ü ü
NMVOCs 2010 7 719 510 7 209 ü ü ü
2011 7 322 511 6 810 ü ü ü ü
2012 7 003 584 6 419 ü ü ü ü
2013 6 922 588 6 334 ü ü ü ü
Notes: 'ü' indicates that provisional emission data meet or lie below the respective emission ceiling. '' indicates that a ceiling has not been attained.
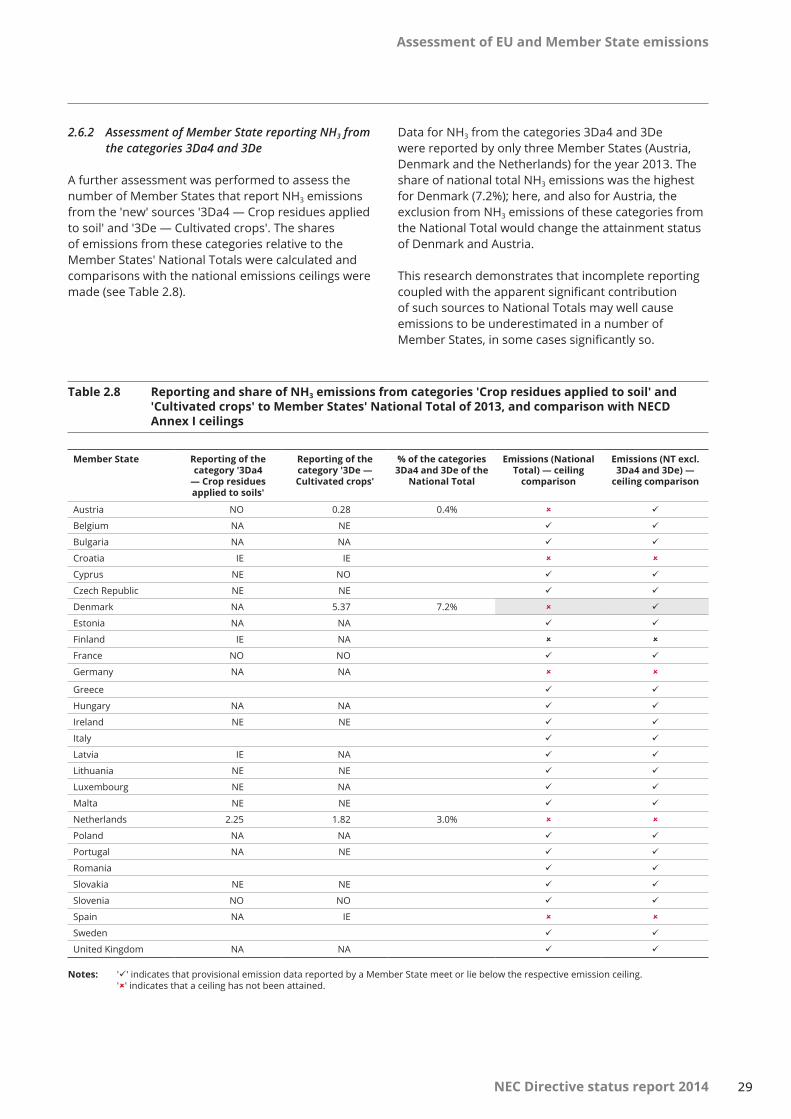
Assessment of EU and Member State emissions
29NEC Directive status report 2014
Table 2.8 Reporting and share of NH3 emissions from categories 'Crop residues applied to soil' and 'Cultivated crops' to Member States' National Total of 2013, and comparison with NECD Annex I ceilings
Member State Reporting of the category '3Da4
— Crop residues applied to soils'
Reporting of the category '3De — Cultivated crops'
% of the categories 3Da4 and 3De of the
National Total
Emissions (National Total) — ceiling
comparison
Emissions (NT excl. 3Da4 and 3De) —
ceiling comparison
Austria NO 0.28 0.4% ü
Belgium NA NE ü ü
Bulgaria NA NA ü ü
Croatia IE IE
Cyprus NE NO ü ü
Czech Republic NE NE ü ü
Denmark NA 5.37 7.2% ü
Estonia NA NA ü ü
Finland IE NA
France NO NO ü ü
Germany NA NA
Greece ü ü
Hungary NA NA ü ü
Ireland NE NE ü ü
Italy ü ü
Latvia IE NA ü ü
Lithuania NE NE ü ü
Luxembourg NE NA ü ü
Malta NE NE ü ü
Netherlands 2.25 1.82 3.0%
Poland NA NA ü ü
Portugal NA NE ü ü
Romania ü ü
Slovakia NE NE ü ü
Slovenia NO NO ü ü
Spain NA IE
Sweden ü ü
United Kingdom NA NA ü ü
2.6.2 Assessment of Member State reporting NH3 from the categories 3Da4 and 3De
A further assessment was performed to assess the number of Member States that report NH3 emissions from the 'new' sources '3Da4 — Crop residues applied to soil' and '3De — Cultivated crops'. The shares of emissions from these categories relative to the Member States' National Totals were calculated and comparisons with the national emissions ceilings were made (see Table 2.8).
Data for NH3 from the categories 3Da4 and 3De were reported by only three Member States (Austria, Denmark and the Netherlands) for the year 2013. The share of national total NH3 emissions was the highest for Denmark (7.2%); here, and also for Austria, the exclusion from NH3 emissions of these categories from the National Total would change the attainment status of Denmark and Austria.
This research demonstrates that incomplete reporting coupled with the apparent significant contribution of such sources to National Totals may well cause emissions to be underestimated in a number of Member States, in some cases significantly so.
Notes: 'ü' indicates that provisional emission data reported by a Member State meet or lie below the respective emission ceiling. '' indicates that a ceiling has not been attained.

Assessment of EU and Member State emissions
30 NEC Directive status report 2014
Figure 2.7 Number of Member State 'not estimated' source categories for NOX, NMVOCs, SO2 and NH3 for data of the year 2013
Number of source categories that are 'not estimated'0 20 40 60 80 100 120 140
Czech RepublicIreland
SwedenPortugal
LithuaniaBulgaria
SpainBelgium
LatviaDenmark
LuxembourgMalta
GermanyCyprus
SlovakiaNetherlands
CroatiaGreece
United KingdomEstoniaPolandFinland
HungaryAustriaFrance
Slovenia
NOX NMVOC SO2 NH3
2.6.3 Reporting of the notation key 'NE' (not estimated)
The official reporting guidelines of the LRTAP Convention (UNECE, 2014a) (and through Annex III to the NECD, by extension applicable also to reporting under the NECD) allow countries to report emissions as 'NE' for those sectors where emissions are known to occur but have not been estimated or reported.
Countries should report separately the reasons for not estimating emissions. Concerning 'NE' emissions, the EMEP/EEA air pollutant emission inventory guidebook (EMEP/EEA, 2013) recommends that the following be included in an IIR:
• a list of sources not estimated in the inventory;
• a qualitative assessment of their importance, currently and in future;
• a description of intentions to calculate these in future, or an explanation of why there are no such plans.
Certain Member States used the notation key 'NE' for a considerable number of source categories (see Figure 2.7).
Only nine Member States provided reasons for using it in their data submissions under the NECD, and it should be noted that Member States provided more information under their LRTAP Convention submissions (the reporting deadline was 15 February). However, the information provided varied somewhat in terms of informative value.
The analysis of reporting of the notation key 'NE' (Figure 2.7) did not consider that in several cases different countries report different notation keys for the same category (e.g. a country reported 'NA', another country reported 'NE' for the same category),
Notes: Romania and Italy are not included in this analysis, as these countries used a reporting format older than the NFR 2014, and therefore comparability would have been not ensured.
or even reported 'NA' for a category where other countries report emissions. Such instances also can lead to a wrong interpretation of the inventory completeness.

31
Summary and recommendations
NEC Directive status report 2014
3 Summary and recommendations
This chapter summarises the information reported by the Member States and the various issues encountered in compiling the inventory submissions. Recommendations for improving current reporting processes are also presented.
3.1 Emission trends and ceiling assessments
Comparison of final 2010 emission estimates and ceilings
A total of 12 Member States reported emission data above the ceiling of at least one pollutant. The final emission data exceed the respective ceilings for three of the four pollutants in Denmark and Germany (NOX, NMVOCs and NH3) and for two ceilings in Austria, Belgium, Ireland, Spain and the Netherlands.
Comparison of final 2011 emission estimates and ceilings
A total of 11 Member States reported emission data above the ceiling of at least one pollutant, based on final 2011 data. The final emission data exceed the respective ceilings for three of the four pollutants in Germany and for two in Austria, Belgium, Denmark, Ireland, Slovenia and Spain.
Comparison of final 2012 emission estimates and ceilings
A total of 12 Member States reported emission data above the ceiling of at least one pollutant. The final 2012 emission data exceed the respective ceilings for three of the four pollutants in Germany and for two
ceilings in Austria, Belgium, Denmark, Ireland and Spain.
Comparison of provisional 2013 emission estimates and ceilings
A total of 10 Member States reported emission data above the ceiling of at least one pollutant. The provisional 2013 emission data exceed the respective ceilings for three of the four pollutants in Germany (NOX, NMVOCs and NH3) and for two ceilings in Austria, Denmark and Ireland.
Based on provisional 2013 emissions data, the highest number of ceiling exceedances was reported for NOX and NH3 (six Member States, each). Three Member States reported provisional 2013 emission data for NMVOCs above the ceiling. All Member States continue to meet their SO2 ceilings. The emission data for NH3 has not changed much at EU-27 level over the last 4 years. Over the years 2010 to 2013 the same six Member States exceeded their NH3 ceiling
Emission trends
The NECD does not formally require Member States to report complete emission time-series data back to 1990. Between 2012 and 2013, emission reductions were reported by about three-quarters of the Member States for NOX and SO2, and by more than two-thirds of the EU Member States for SO2. For NH3, emission reductions were reported by more than half of the Member States. A more complete picture of past emission trends in the EU will be available in mid-2015, when the EEA publishes its annual EU emission inventory report under the LRTAP Convention (EEA, 2015a).

Summary and recommendations
32 NEC Directive status report 2014
Completeness of 2013 emissions compared to ceilings
Since the original integrated assessment modelling undertaken in support of determining the 2010 emissions ceilings, knowledge on the sources of air pollutants has advanced. Examples of reporting emissions from 'new' pollutant–source category combinations that were not included in the original modelling are NOX and NMVOC emissions from the agriculture sector, or NH3 from the categories 3Da4 and 3De.
Reporting of NOX and NMVOC emissions of the agriculture sector has increased in recent years. In the 2011 reporting round, only 17 Member States reported data for NOX and NMVOCs of the agriculture sector. In the 2014 reporting round, NOX data were reported by 21 Member States, and NMVOC data by 23 countries. 2013 data for NH3 from the categories 3Da4 and 3De were reported by only three Member States.
A number of Member States used the notation key 'NE' to indicate that emissions from specific source categories were not estimated. Member States are encouraged to review and limit their use of the 'NE' notation key when reporting emission data in future, and to provide numerical estimates where relevant and applicable.
3.2 Outlook post-2013
The NECD called for emission ceilings to be complied with by 2010, and to not be exceeded in any year following. In addition to those Member States that report exceedances, it is noted that several others have reported emissions for 2013 which lie just below the value of their respective ceilings, e.g. Slovenia for NOX and Belgium for NMVOCs. It is essential that all Member States take appropriate measures to limit any future increases in emissions which would result in their ceilings being exceeded.
3.3 Recommended improvements in reporting methodology
Improving the completeness of Member States' reporting in line with the reporting criteria of the EMEP reporting guidelines is key. Classifying specific emission source categories as 'NE' should be limited only to insignificant sources of emissions, in accordance with the definitions included in the reporting guidelines. Incomplete emission inventories hamper the judgement of compliance by the European Commission, especially for those countries where emissions are very close to the ceilings. The reporting of the best-performing Member States might be used to establish a benchmark that could encourage others to develop more comprehensive reporting over the next few years.
To help improve the transparency of the reported NECD data, it is always recommended that Member States submit an accompanying inventory or NECD report. Such a report should include explanatory information on the reported inventory: clarifying whether the reporting is on the basis of fuel used or sold, providing an explanation for time series changes and recalculations, addressing document uncertainties, etc.
It is also important to improve the transparency of measures taken by Member States and the contribution of these measures to meeting the national emission ceilings, e.g. the anticipated impacts of current and planned measures on future emissions.
The European Commission's proposal for a revised NECD (see Box ES. 1) includes several new additional elements in addition to the continuing requirement that Member States annually prepare and report national emission inventories and projections for the main air pollutants (but also now including primary PM2.5). These include that emission inventories and projections shall be accompanied by an informative inventory report (IIR), and that a review process will be introduced under the NECD to assist with the further improvement of emission inventories.

33
References
NEC Directive status report 2014
References
EEA, 2011, Laying the foundations for greener transport — TERM 2011: transport indicators tracking progress towards environmental targets in Europe, EEA Report No 7/2011, European Environment Agency (http://www.eea.europa.eu/publications/foundations-for-greener-transport) accessed 13 February 2015.
EEA, 2012, NEC Directive status report 2011, EEA Technical report No 6/2012, European Environment Agency (http://www.eea.europa.eu/publications/nec-directive-status-report-2011) accessed 13 February 2015.
EEA, 2013, NEC Directive status report 2012, EEA Technical report No 6/2013, European Environment Agency (http://www.eea.europa.eu/publications/nec-directive-status-report-2012) accessed 13 February 2015.
EEA, 2014a, NEC Directive status report 2013, EEA Technical report No 10/2014, European Environment Agency (http://www.eea.europa.eu/publications/nec-directive-status-report-2013) accessed 13 February 2015.
EEA, 2014b, 'Air pollution — Air pollution country fact sheets (2014)', European Environment Agency (http://www.eea.europa.eu/themes/air/air-pollution-country-fact-sheets-2014) accessed 13 February 2015.
EEA, 2015a, 'European Union emission inventory report 1990–2013 under the Convention on Long-range Transboundary Air Pollution (LRTAP)', EEA Technical report, European Environment Agency, in preparation.
EEA, 2015b, 'Interactive data viewers — Air pollutant emissions data viewer (NEC Directive)', European Environment Agency (http://www.eea.europa.eu/data-and-maps/data/data-viewers/emissions-nec-directive-viewer) accessed 13 February 2015.
EMEP/EEA, 2013, EMEP/EEA air pollutant emission inventory guidebook — 2013, EEA Technical report No 12/2013, European Environment Agency (http://www.eea.europa.eu/publications/emep-eea-guidebook-2013) accessed 13 February 2015.
EMEP/EEA, 2015, 'Inventory Review 2015: Review of emission data reported under the LRTAP Convention and NEC Directive Stage 1 and 2 review', EMEP/CEIP Technical report, in preparation.
EU, 2001, Directive 2001/81/EC of the European Parliament and of the Council of 23 October 2001 on national emission ceilings for certain atmospheric pollutants (OJ L 309, 27.11.2001, p. 22 (OJ L 236, 23.9.2003 p. 33) (http://eur-lex.europa.eu/legal-content/EN/TXT/PDF/?uri=CELEX:02001L0081-20130701&from=EN) accessed 13 February 2015.
EU, 2013, Regulation (EU) No 525/2013 of the European Parliament and of the Council of 21 May 2013 on a mechanism for monitoring and reporting greenhouse gas emissions and for reporting other information at national and Union level relevant to climate change and repealing Decision No 280/2004/EC Text with EEA relevance (http://eur-lex.europa.eu/legal-content/EN/TXT/?uri=CELEX:32013R0525) accessed 20 May 2015.
IPCC, 2006, 2006 IPCC Guidelines for National Greenhouse Gas Inventories, prepared by the National
Greenhouse Gas Inventories Programme, Eggleston H. S., Buendia L., Miwa K., Ngara T. and Tanabe K. (eds), IGES, Japan, Intergovernmental Panel on Climate Change (http://www.ipcc-nggip.iges.or.jp/public/2006gl/) accessed 13 February 2015.
UNECE, 1979, 1979 Convention on Long-range Transboundary Air Pollution, United Nations Economic Commission for Europe, Geneva (http://www.unece.org/fileadmin/DAM/env/lrtap/full%20text/1979.CLRTAP.e.pdf) accessed 13 February 2015.
UNECE, 1999, The 1999 Gothenburg Protocol to Abate Acidification, Eutrophication and Ground-level Ozone, United Nations Economic Commission for Europe http://www.unece.org/fileadmin/DAM/env/documents/2013/air/eb/ECE.EB.AIR.114_ENG.pdf) accessed 17 April 2015.
UNECE, 2006, Implementation Committee, its structure and functions and procedure for review, (ECE/EB.AIR/2006/2), United Nations Economic Commission

References
34 NEC Directive status report 2014
for Europe (http://www.unece.org/fileadmin/DAM/env/documents/2006/eb/EB/EB%20Decisions/Decision%202006.2.pdf) accessed 3 March 2015.
UNECE, 2012a, Decision 2012/1 Amendment of annex I to the 1999 Protocol to Abate Acidification, Eutrophication and Ground-level Ozone, United Nations Economic Commission for Europe (http://www.unece.org/fileadmin/DAM/env/lrtap/full%20text/ECE_EB.AIR_111_Add1_1_E.pdf) accessed 2 March 2015.
UNECE, 2012b, Decision 2012/2 Amendment of the text of and annexes II to IX to the 1999 Protocol to Abate Acidification, Eutrophication and Ground-level Ozone and the addition of new annexes X and XI, (ECE/EB.AIR/111/Add.1), United Nations Economic Commission for Europe, Geneva (http://www.unece.org/fileadmin/DAM/env/documents/2013/air/ECE_EB.AIR_111_Add.1__ENG_DECISION_2.pdf) accessed 2 March 2015.
UNECE, 2012c, Decision 2012/3, Adjustments under the Gothenburg Protocol to emission reduction commitments or to inventories for the purposes of comparing total national emissions with them, (ECE/EB.AIR/111), United Nations Economic Commission for Europe (http://www.unece.org/fileadmin/DAM/env/documents/2013/air/ECE_EB.AIR_111_Add.1__ENG_DECISION_3.pdf) accessed 3 March 2015.
UNECE, 2012d, Decision 2012/12, Guidance for adjustments under the 1999 Protocol to Abate Acidification, Eutrophication and Ground-level Ozone to emission reduction commitments or to inventories for the purposes of comparing total national emissions with them, (ECE/EB.AIR/113), United Nations Economic Commission for Europe (http://www.unece.org/fileadmin/DAM/env/documents/2012/EB/Decision_2012_12.pdf) accessed 3 March 2015.
UNECE, 2014a, Guidelines for reporting emission data under the Convention on Long-range Transboundary Air Pollution, (ECE/EB.AIR/125), United Nations Economic Commission for Europe, Geneva (http://www.ceip.at/fileadmin/inhalte/emep/2014_Guidelines/ece.eb.air.125_ADVANCE_VERSION_reporting_guidelines_2013.pdf) accessed 13 February 2015.
UNECE, 2014b, Review of adjustment applications, Report by the Centre on Emission Inventories and Projections, (ECE/EB.AIR/GE.1/2014/10), United Nations Economic Commission for Europe, Geneva (http://www.ceip.at/fileadmin/inhalte/emep/pdf/2015/ece.eb.air.ge.1.2014.10.edited.ae_formatting_accepted.ko.pdf) accessed 3 March 2015.
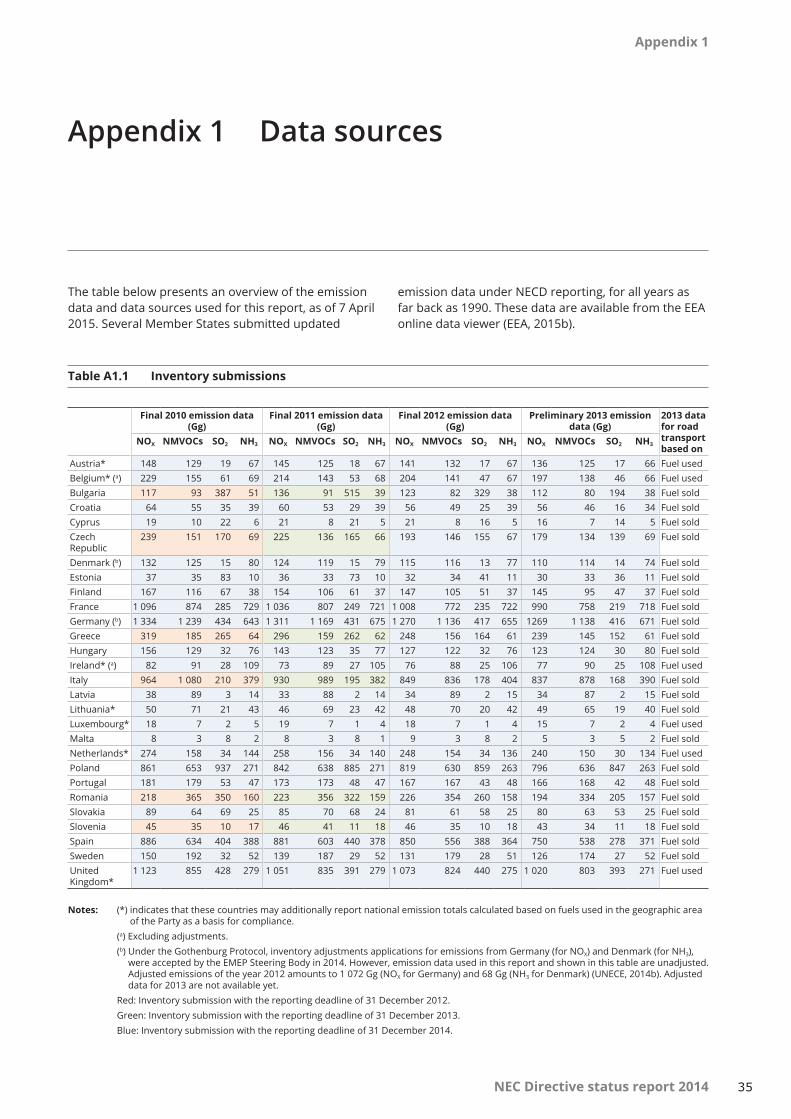
35
Appendix 1
NEC Directive status report 2014
Appendix 1 Datasources
Table A1.1 Inventory submissions
Final 2010 emission data (Gg)
Final 2011 emission data (Gg)
Final 2012 emission data (Gg)
Preliminary 2013 emission data (Gg)
2013 data for road transport based on
NOX NMVOCs SO2 NH3 NOX NMVOCs SO2 NH3 NOX NMVOCs SO2 NH3 NOX NMVOCs SO2 NH3
Austria* 148 129 19 67 145 125 18 67 141 132 17 67 136 125 17 66 Fuel usedBelgium* (a) 229 155 61 69 214 143 53 68 204 141 47 67 197 138 46 66 Fuel usedBulgaria 117 93 387 51 136 91 515 39 123 82 329 38 112 80 194 38 Fuel soldCroatia 64 55 35 39 60 53 29 39 56 49 25 39 56 46 16 34 Fuel soldCyprus 19 10 22 6 21 8 21 5 21 8 16 5 16 7 14 5 Fuel soldCzech Republic
239 151 170 69 225 136 165 66 193 146 155 67 179 134 139 69 Fuel sold
Denmark (b) 132 125 15 80 124 119 15 79 115 116 13 77 110 114 14 74 Fuel soldEstonia 37 35 83 10 36 33 73 10 32 34 41 11 30 33 36 11 Fuel soldFinland 167 116 67 38 154 106 61 37 147 105 51 37 145 95 47 37 Fuel soldFrance 1 096 874 285 729 1 036 807 249 721 1 008 772 235 722 990 758 219 718 Fuel soldGermany (b) 1 334 1 239 434 643 1 311 1 169 431 675 1 270 1 136 417 655 1269 1 138 416 671 Fuel soldGreece 319 185 265 64 296 159 262 62 248 156 164 61 239 145 152 61 Fuel soldHungary 156 129 32 76 143 123 35 77 127 122 32 76 123 124 30 80 Fuel soldIreland* (a) 82 91 28 109 73 89 27 105 76 88 25 106 77 90 25 108 Fuel usedItaly 964 1 080 210 379 930 989 195 382 849 836 178 404 837 878 168 390 Fuel soldLatvia 38 89 3 14 33 88 2 14 34 89 2 15 34 87 2 15 Fuel soldLithuania* 50 71 21 43 46 69 23 42 48 70 20 42 49 65 19 40 Fuel soldLuxembourg* 18 7 2 5 19 7 1 4 18 7 1 4 15 7 2 4 Fuel usedMalta 8 3 8 2 8 3 8 1 9 3 8 2 5 3 5 2 Fuel soldNetherlands* 274 158 34 144 258 156 34 140 248 154 34 136 240 150 30 134 Fuel usedPoland 861 653 937 271 842 638 885 271 819 630 859 263 796 636 847 263 Fuel soldPortugal 181 179 53 47 173 173 48 47 167 167 43 48 166 168 42 48 Fuel soldRomania 218 365 350 160 223 356 322 159 226 354 260 158 194 334 205 157 Fuel soldSlovakia 89 64 69 25 85 70 68 24 81 61 58 25 80 63 53 25 Fuel soldSlovenia 45 35 10 17 46 41 11 18 46 35 10 18 43 34 11 18 Fuel soldSpain 886 634 404 388 881 603 440 378 850 556 388 364 750 538 278 371 Fuel soldSweden 150 192 32 52 139 187 29 52 131 179 28 51 126 174 27 52 Fuel soldUnited Kingdom*
1 123 855 428 279 1 051 835 391 279 1 073 824 440 275 1 020 803 393 271 Fuel used
The table below presents an overview of the emission data and data sources used for this report, as of 7 April 2015. Several Member States submitted updated
emission data under NECD reporting, for all years as far back as 1990. These data are available from the EEA online data viewer (EEA, 2015b).
Notes: (*) indicates that these countries may additionally report national emission totals calculated based on fuels used in the geographic area of the Party as a basis for compliance.
(a) Excluding adjustments. (b) Under the Gothenburg Protocol, inventory adjustments applications for emissions from Germany (for NOX) and Denmark (for NH3),
were accepted by the EMEP Steering Body in 2014. However, emission data used in this report and shown in this table are unadjusted. Adjusted emissions of the year 2012 amounts to 1 072 Gg (NOX for Germany) and 68 Gg (NH3 for Denmark) (UNECE, 2014b). Adjusted data for 2013 are not available yet.
Red: Inventory submission with the reporting deadline of 31 December 2012. Green: Inventory submission with the reporting deadline of 31 December 2013. Blue: Inventory submission with the reporting deadline of 31 December 2014.

NEC Directive status report 201436
Appendix 2
Appendix 2 ReportingstatusofNECDemissions
Table A2.1 Submission overview
Member State
Submission uploaded
to CDR
Re-submissions
Years covered
Format NOX, NMVOCs, SO2, NH3
Projections table
Updated NECD
programmes
Socio-economic
data (Annex IV B)
IIR
2012 final
2013 provisional
Austria 30.12.2014 12.02.2015 1990–2013 NFR 2014-1 x x np n/a n/a 30.12.2014 12.02.2015
Belgium 24.12.2014 n/a 1990, 1995, 2000, 2005, 2010–2013
NFR 2014-1 x x np n/a n/a np
Bulgaria 30.12.2014 07.01.2015 2012–2013 NFR 2014-1 x x 2015, 2020 n/a n/a npCroatia 31.12.2014 11.02.2015 1990–2013 NFR 2014-1 x x np n/a n/a 31.12.2014
16.03.2015Cyprus 30.12.2014 13.02.2015 1990–2013 NFR 2014-1 x x np n/a n/a npCzech Republic
29.12.2014 n/a 2012–2013 NFR 2014-1 x x np n/a n/a np
Denmark 19.12.2014 n/a 1980–2013 NFR 2014-1 x x 2020, 2025, 2030
n/a n/a np
Estonia 30.12.2014 n/a 1990–2013 NFR 2014-1 x x 2020, 2025, 2030
n/a n/a 30/12/2014
Finland 16.12.2014 13.02.2015 27.02.2015
1980–2013 NFR 2014-1 x x 2020, 2025, 2030, 2050
(NH3)
n/a x 16.12.2014
France 24.12.2014 n/a 1980–2013 NFR 2014-1 x x np n/a n/a npGermany 22.12.2014 n/a 1990–2013 NFR 2014-1 x x np n/a n/a 22.12.2014Greece 29.01.2015 31.01.2015 2012–2013 NFR 2014-1 x x np n/a n/a npHungary 13.01.2015 n/a 1990–2013 NFR 2014-1 x x np n/a n/a npIreland 22.12.2014 21.01.2015 1990–2013 NFR 2014-1 x x np n/a n/a npItaly 26.01.2015 n/a 2012–2013 NFR 2008-1 x x np n/a n/a npLatvia 30.12.2014 24.03.2015 1990–2013 NFR 2014-1 x x np n/a n/a 30.12.2014Lithuania 20.12.2014 n/a 1990–2013 NFR 2014-1 x x 2015, 2020 n/a x npLuxembourg 31.12.2014 n/a 1990–2013 NFR 2014-1 x x np n/a n/a npMalta 18.12.2014 19.01.2015 2000–2013 NFR 2014-1 x x np n/a n/a npNetherlands 31.12.2014 15.02.2015 1990–2013 NFR 2014-1 x x 2020, 2030 n/a n/a 15.03.2015Poland 11.12.2014 n/a 1995–2013 NFR 2014-1 x x np n/a n/a 11.12.2014
30.03.2015Portugal 31.12.2014 n/a 1990–2013 NFR 2014-1 x x np n/a n/a npRomania 23.12.2014 n/a 2012–2013 NFR 2009-1 x x np n/a n/a 23.12.2014Slovakia 30.12.2014 n/a 2000–2013 NFR 2014-1 x x np n/a n/a 30.12.2014Slovenia 17.12.2014 n/a 2012–2013 NFR 2014-1 x x 2020, 2025,
2030n/a x np
Spain 29.12.2014 n/a 1990–2013 NFR 2014-1 x x np n/a n/a npSweden 19.12.2014 10.02.2015 1990–2013 NFR 2014-1 x x np n/a n/a "19.12.2014,
10.02.2015"United Kingdom
18.12.2014 n/a 2009–2013 NFR 2014-1 x x np n/a n/a np
The status of reporting NECD emissions (the 2014 reporting round) as of 7 April 2015 is shown in Table A2.1.
Notes: 'np' denotes 'not provided'. 'x' denotes 'provided'. 'NFR' denotes 'nomenclature for reporting' — the sectoral classification system developed by UNECE/EMEP for reporting air emissions. Values in red indicate that data were not received by the reporting deadline of 31 December 2014 and/or are not in the new NFR 2014
reporting format.

European Environment Agency
NEC Directive status report 2014Reporting by Member States under Directive 2001/81/EC of the European Parliament and of the Council of 23 October 2001 on national emission ceilings for certain atmospheric pollutants
2015 — 36 pp. — 21 x 29.7 cm
ISBN 978-92-9213-648-2doi:10.2800/101114
HOW TO OBTAIN EU PUBLICATIONS
Free publications:
• one copy: via EU Bookshop (http://bookshop.europa.eu);
• more than one copy or posters/maps: from the European Union's representations (http://ec.europa.eu/represent_en.htm); from the delegations in non-EU countries (http://eeas.europa.eu/delegations/index_en.htm); by contacting the Europe Direct service (http://europa.eu/europedirect/index_en.htm) or calling 00 800 6 7 8 9 10 11 (freephone number from anywhere in the EU) (*).
(*) The information given is free, as are most calls (though some operators, phone boxes or hotels may charge you).
Priced publications:
• via EU Bookshop (http://bookshop.europa.eu).

European Environment AgencyKongens Nytorv 61050 Copenhagen KDenmark
Tel.: +45 33 36 71 00Web: eea.europa.euEnquiries: eea.europa.eu/enquiries
TH-AK-15-007-EN
-Ndoi:10.2800/101114