nection (ticon tb) sell property - real estate target ... · see important disclosures at the end...
TRANSCRIPT
See important disclosures at the end of this report Powered by EFATM Platform 1
Company Update, 10 September 2015
Ticon Ind Connection (TICON TB) Sell (Maintained) Property - Real Estate Target Price: THB10.80 Market Cap: USD368m Price: THB12.10
Weak Factory Business As Usual Macro
Risks
Growth
Value
65
74
82
91
99
108
116
125
8
10
12
14
16
18
20
22
Ticon Ind Connection (TICON TB)Price Close Relative to Stock Exchange of Thailand Index (RHS)
5
10
15
20
25
Sep
-14
Nov
-14
Jan-
15
Mar
-15
May
-15
Jul-1
5
Vol m
Source: Bloomberg
Avg Turnover (THB/USD) 17.2m/0.50m Cons. Upside (%) 15.7 Upside (%) -10.7 52-wk Price low/high (THB) 9.35 - 20.1 Free float (%) 40 Share outstanding (m) 1,099 Shareholders (%) Rojana Industrial Park PLC 43.5 Thai NVDR 4.2 Suchada Leesawattrakun 3.8 Share Performance (%) YTD 1m 3m 6m 12m Absolute (33.2) 0.8 (25.3) (31.3) (31.3) Relative (25.3) 4.3 (16.7) (19.2) (18.3) Shariah compliant Chatree Srismaicharoen, License No. 018092 +66 2862 9743 [email protected]
Forecasts and Valuations Dec-13 Dec-14 Dec-15F Dec-16F Dec-17FTotal turnover (THBm) 5,855 5,619 4,403 4,892 5,239Reported net profit (THBm) 1,414 762 570 705 923Recurring net profit (THBm) 1,845 946 676 832 1,074Recurring net profit growth (%) 10.7 (48.7) (28.5) 23.0 29.1Recurring EPS (THB) 2.06 0.94 0.62 0.76 0.98DPS (THB) 1.00 0.50 0.40 0.50 0.60Recurring P/E (x) 5.9 12.9 19.7 16.0 12.4P/B (x) 1.27 1.17 1.16 1.14 1.10Dividend Yield (%) 8.3 4.1 3.3 4.1 5.0Return on average equity (%) 17.1 7.6 5.0 6.1 7.8Return on average assets (%) 6.1 2.6 1.8 2.1 2.7Net debt to equity (%) 171.6 146.3 168.5 171.2 174.3Our vs consensus EPS (adjusted) (%) (13.5) (6.3) 18.0
Source: Company data, RHB
Ticon’s core businesses have not improved significantly so far in 3Q15. Maintain SELL and DCF-based THB10.80 TP (11% downside). Although the warehouse business has grown as strong as its target, the ready-built factory division remains sluggish and management has decided to cut new leased factory space targets for this year by 50%.
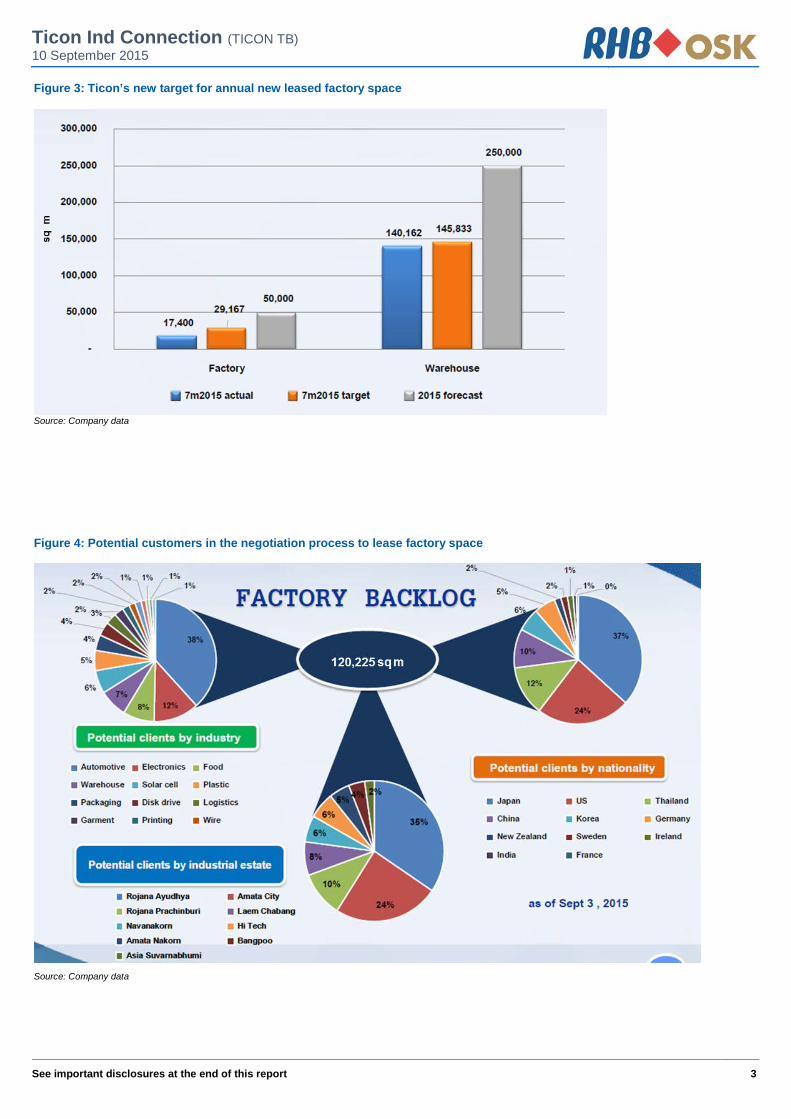
♦ Slow move on factory business. Ticon Industrial Connection (Ticon) has officially cut its FY15 new leased factory space target by 50% to 50,000 sq m. This is equal to our assumptions as 7M15 new leased factory space stood at only 17,400 sq m, ie far behind management’s previous annual target of 100,000 sq m. Although there are several customers negotiating for factory space totalling 120,000 sq m (see Figure 4), stagnant direct investment – especially from Ticon’s key customer sectors such as automotive & auto parts, and electronics – remains a key negative and, therefore, the occupancy rate for its factory business is hovering around a historical low of 49%.
♦ Maintaining strong warehouse view. The warehouse business has grown strongly YTD with new leased space of 140,000 sq m for 7M15 and is likely to achieve management’s full-year target of 250,000 sq m. This is because there remains an increasing demand for storage space and logistics facilities from the manufacturing sector, especially from Thailand-based consumer product manufacturers that are looking to serve a wider market under the ASEAN Economic Community (AEC).
♦ Asset sale a must. In order to reduce Ticon’s high debt gearing (net D/E: 1.9x), it has to execute: i) an asset sale to REIT by year end worth ~THB3.3bn (lower YoY due to the weak factory business), and ii) the THB260m sale of an undeveloped landbank that may occur in 4Q15 – which we have not yet included in our earnings forecast. These anticipated gains from asset sales should help turn a profit in 2H15, after the loss in 1H15. However, FY15 net profit is likely to weaken 25% YoY and the risk of capital increase is likely to be highlighted if the asset sale plan is delayed.
♦ Maintain SELL due to: i) the weak outlook for Ticon’s factory business in spite of its healthy warehouse business, ii) the weak forecast earnings for this year, and iii) the 11% downside to its last closing price. Our DCF-based TP of THB10.80, implying 14.2x FY16F P/E, is based on assumptions shown in Figure 5.
Ticon Ind Connection (TICON TB) 10 September 2015
See important disclosures at the end of this report 2
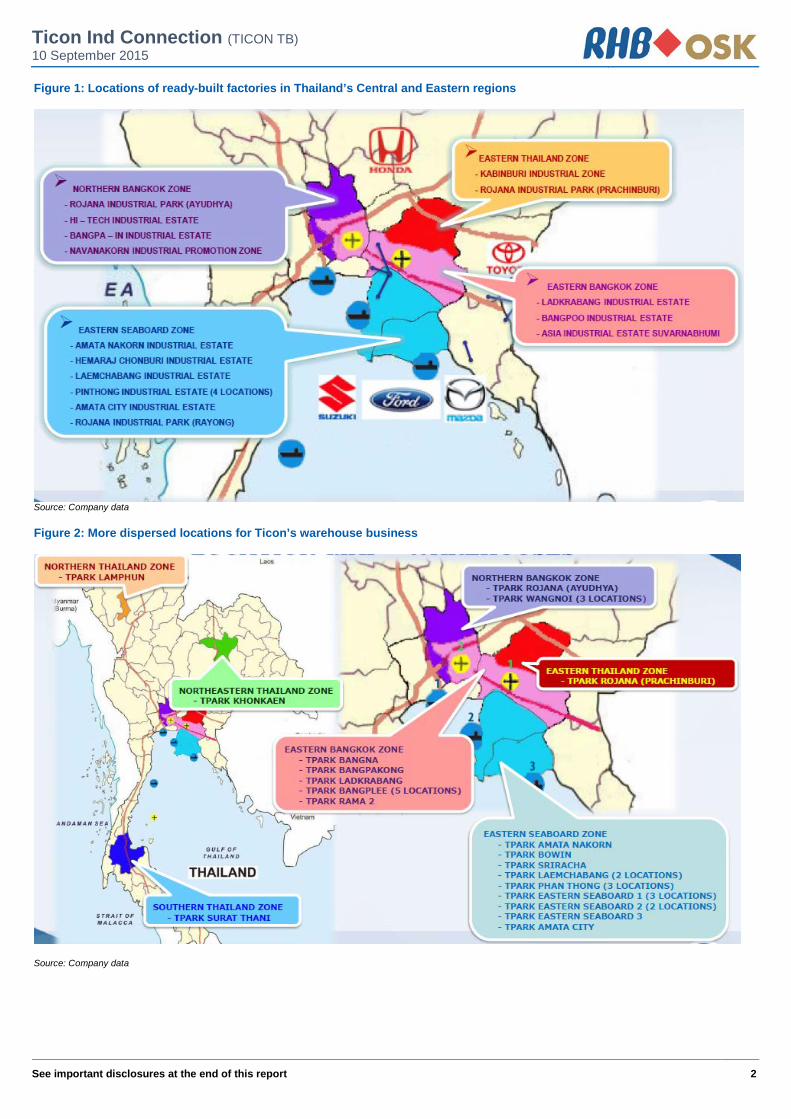
Figure 1: Locations of ready-built factories in Thailand’s Central and Eastern regions
Source: Company data Figure 2: More dispersed locations for Ticon’s warehouse business
Source: Company data
Ticon Ind Connection (TICON TB) 10 September 2015
See important disclosures at the end of this report 3
Figure 3: Ticon’s new target for annual new leased factory space
Source: Company data Figure 4: Potential customers in the negotiation process to lease factory space
Source: Company data
Ticon Ind Connection (TICON TB) 10 September 2015
See important disclosures at the end of this report 4
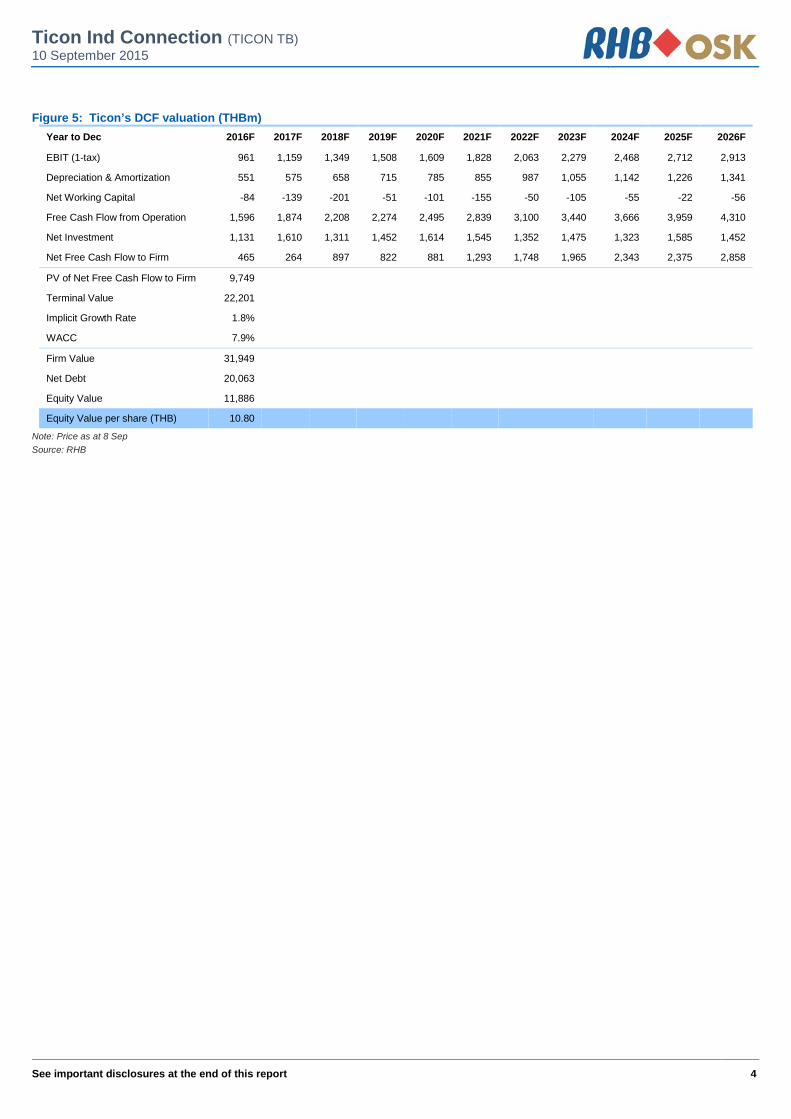
Figure 5: Ticon’s DCF valuation (THBm) Year to Dec 2016F 2017F 2018F 2019F 2020F 2021F 2022F 2023F 2024F 2025F 2026F
EBIT (1-tax) 961 1,159 1,349 1,508 1,609 1,828 2,063 2,279 2,468 2,712 2,913
Depreciation & Amortization 551 575 658 715 785 855 987 1,055 1,142 1,226 1,341
Net Working Capital -84 -139 -201 -51 -101 -155 -50 -105 -55 -22 -56
Free Cash Flow from Operation 1,596 1,874 2,208 2,274 2,495 2,839 3,100 3,440 3,666 3,959 4,310
Net Investment 1,131 1,610 1,311 1,452 1,614 1,545 1,352 1,475 1,323 1,585 1,452
Net Free Cash Flow to Firm 465 264 897 822 881 1,293 1,748 1,965 2,343 2,375 2,858
PV of Net Free Cash Flow to Firm 9,749
Terminal Value 22,201 Implicit Growth Rate 1.8% WACC 7.9%
Firm Value 31,949 Net Debt 20,063 Equity Value 11,886 Equity Value per share (THB) 10.80
Note: Price as at 8 Sep Source: RHB
Ticon Ind Connection (TICON TB) 10 September 2015
See important disclosures at the end of this report 5
Financial Exhibits
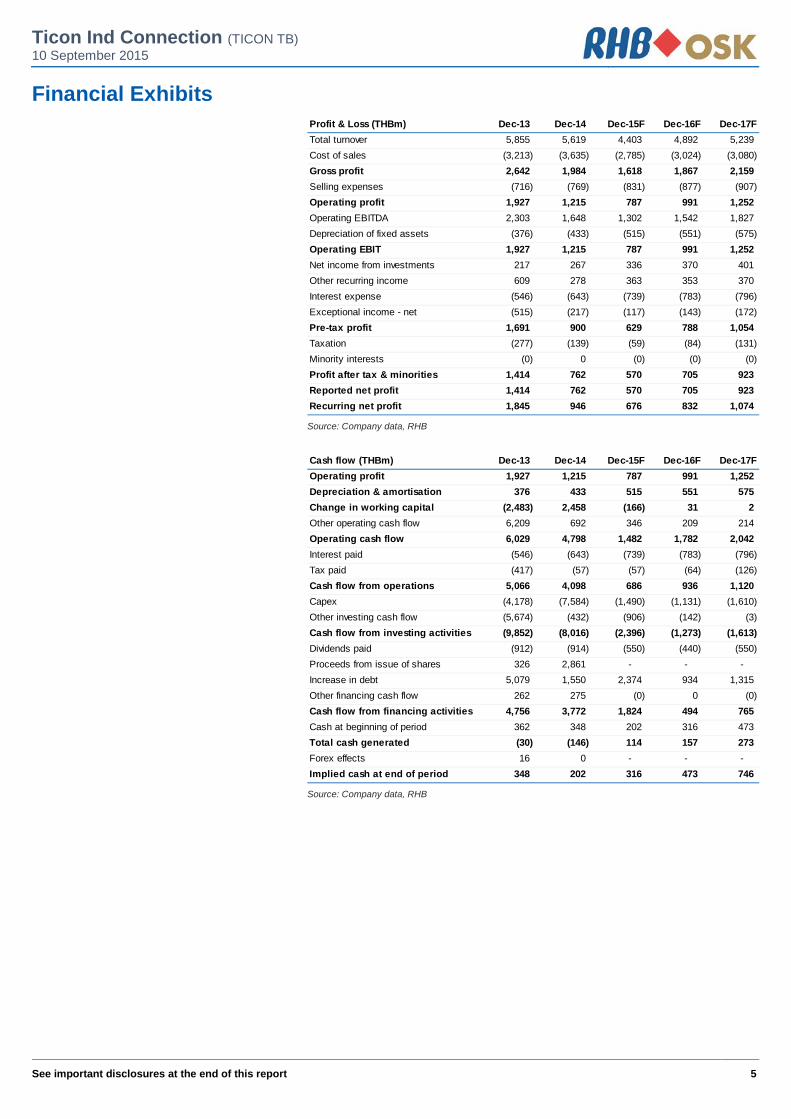
Profit & Loss (THBm) Dec-13 Dec-14 Dec-15F Dec-16F Dec-17FTotal turnover 5,855 5,619 4,403 4,892 5,239 Cost of sales (3,213) (3,635) (2,785) (3,024) (3,080) Gross profit 2,642 1,984 1,618 1,867 2,159 Selling expenses (716) (769) (831) (877) (907) Operating profit 1,927 1,215 787 991 1,252 Operating EBITDA 2,303 1,648 1,302 1,542 1,827 Depreciation of fixed assets (376) (433) (515) (551) (575) Operating EBIT 1,927 1,215 787 991 1,252 Net income from investments 217 267 336 370 401 Other recurring income 609 278 363 353 370 Interest expense (546) (643) (739) (783) (796) Exceptional income - net (515) (217) (117) (143) (172) Pre-tax profit 1,691 900 629 788 1,054 Taxation (277) (139) (59) (84) (131) Minority interests (0) 0 (0) (0) (0) Profit after tax & minorities 1,414 762 570 705 923 Reported net profit 1,414 762 570 705 923 Recurring net profit 1,845 946 676 832 1,074 Source: Company data, RHB
Cash flow (THBm) Dec-13 Dec-14 Dec-15F Dec-16F Dec-17FOperating profit 1,927 1,215 787 991 1,252 Depreciation & amortisation 376 433 515 551 575 Change in working capital (2,483) 2,458 (166) 31 2 Other operating cash flow 6,209 692 346 209 214 Operating cash flow 6,029 4,798 1,482 1,782 2,042 Interest paid (546) (643) (739) (783) (796) Tax paid (417) (57) (57) (64) (126) Cash flow from operations 5,066 4,098 686 936 1,120 Capex (4,178) (7,584) (1,490) (1,131) (1,610) Other investing cash flow (5,674) (432) (906) (142) (3) Cash flow from investing activities (9,852) (8,016) (2,396) (1,273) (1,613) Dividends paid (912) (914) (550) (440) (550) Proceeds from issue of shares 326 2,861 - - - Increase in debt 5,079 1,550 2,374 934 1,315 Other financing cash flow 262 275 (0) 0 (0) Cash flow from financing activities 4,756 3,772 1,824 494 765 Cash at beginning of period 362 348 202 316 473 Total cash generated (30) (146) 114 157 273 Forex effects 16 0 - - - Implied cash at end of period 348 202 316 473 746 Source: Company data, RHB
Ticon Ind Connection (TICON TB) 10 September 2015
See important disclosures at the end of this report 6
Financial Exhibits
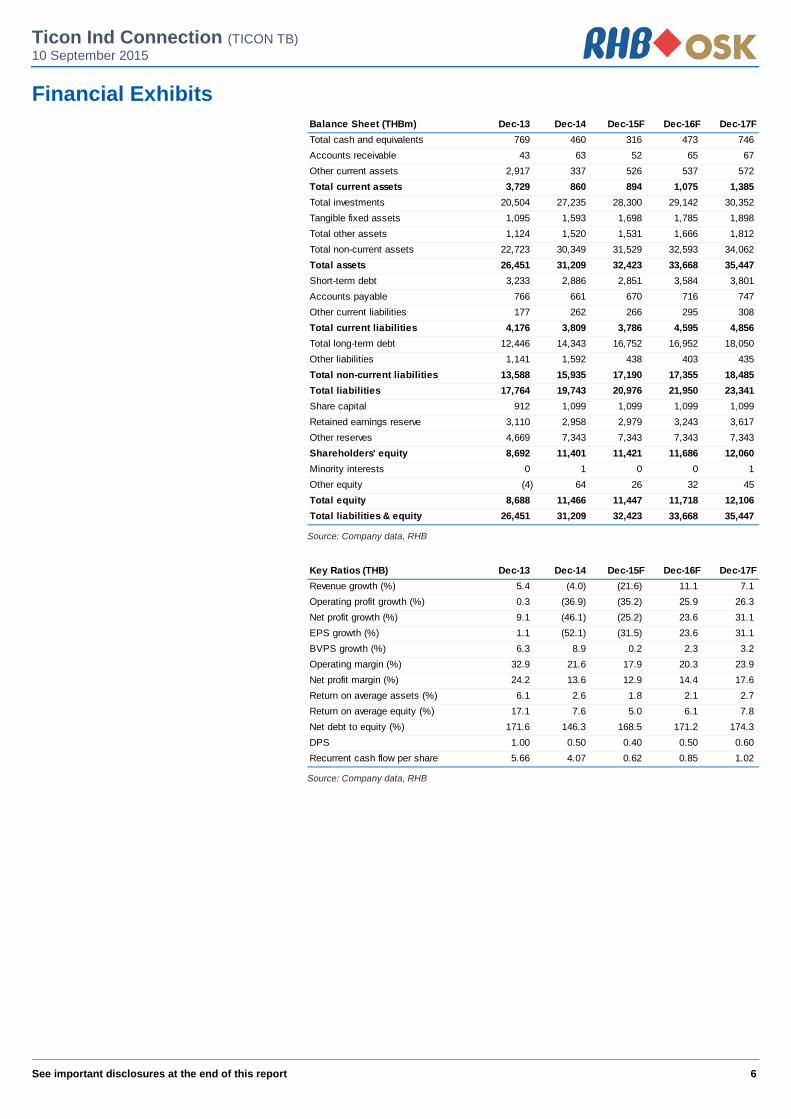
Balance Sheet (THBm) Dec-13 Dec-14 Dec-15F Dec-16F Dec-17FTotal cash and equivalents 769 460 316 473 746 Accounts receivable 43 63 52 65 67 Other current assets 2,917 337 526 537 572 Total current assets 3,729 860 894 1,075 1,385 Total investments 20,504 27,235 28,300 29,142 30,352 Tangible fixed assets 1,095 1,593 1,698 1,785 1,898 Total other assets 1,124 1,520 1,531 1,666 1,812 Total non-current assets 22,723 30,349 31,529 32,593 34,062 Total assets 26,451 31,209 32,423 33,668 35,447 Short-term debt 3,233 2,886 2,851 3,584 3,801 Accounts payable 766 661 670 716 747 Other current liabilities 177 262 266 295 308 Total current liabilities 4,176 3,809 3,786 4,595 4,856 Total long-term debt 12,446 14,343 16,752 16,952 18,050 Other liabilities 1,141 1,592 438 403 435 Total non-current liabilities 13,588 15,935 17,190 17,355 18,485 Total liabilities 17,764 19,743 20,976 21,950 23,341 Share capital 912 1,099 1,099 1,099 1,099 Retained earnings reserve 3,110 2,958 2,979 3,243 3,617 Other reserves 4,669 7,343 7,343 7,343 7,343 Shareholders' equity 8,692 11,401 11,421 11,686 12,060 Minority interests 0 1 0 0 1 Other equity (4) 64 26 32 45 Total equity 8,688 11,466 11,447 11,718 12,106 Total liabilities & equity 26,451 31,209 32,423 33,668 35,447 Source: Company data, RHB
Key Ratios (THB) Dec-13 Dec-14 Dec-15F Dec-16F Dec-17FRevenue growth (%) 5.4 (4.0) (21.6) 11.1 7.1Operating profit growth (%) 0.3 (36.9) (35.2) 25.9 26.3Net profit growth (%) 9.1 (46.1) (25.2) 23.6 31.1EPS growth (%) 1.1 (52.1) (31.5) 23.6 31.1BVPS growth (%) 6.3 8.9 0.2 2.3 3.2Operating margin (%) 32.9 21.6 17.9 20.3 23.9Net profit margin (%) 24.2 13.6 12.9 14.4 17.6Return on average assets (%) 6.1 2.6 1.8 2.1 2.7Return on average equity (%) 17.1 7.6 5.0 6.1 7.8Net debt to equity (%) 171.6 146.3 168.5 171.2 174.3DPS 1.00 0.50 0.40 0.50 0.60Recurrent cash flow per share 5.66 4.07 0.62 0.85 1.02 Source: Company data, RHB
Ticon Ind Connection (TICON TB) 10 September 2015
See important disclosures at the end of this report 7
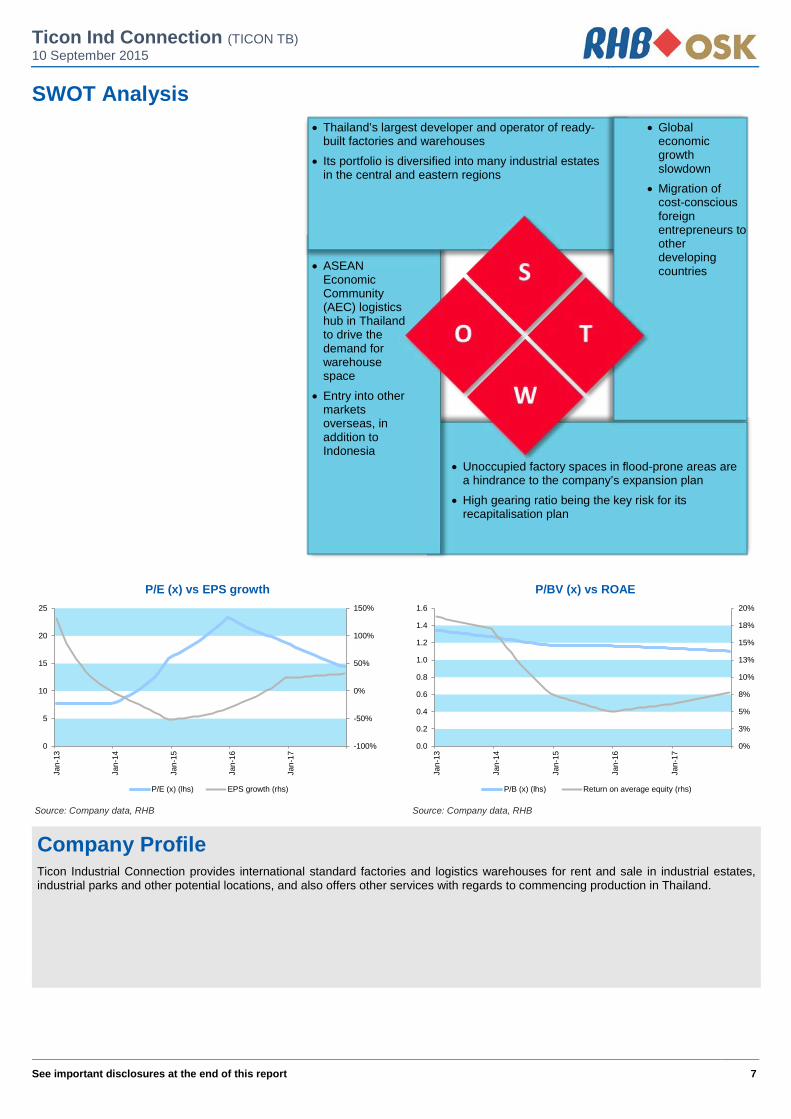
SWOT Analysis
• Thailand’s largest developer and operator of ready-built factories and warehouses
• Its portfolio is diversified into many industrial estates in the central and eastern regions
• Global economic growth slowdown
• Migration of cost-conscious foreign entrepreneurs to other developing countries
• ASEAN Economic Community (AEC) logistics hub in Thailand to drive the demand for warehouse space
• Entry into other markets overseas, in addition to Indonesia
• Unoccupied factory spaces in flood-prone areas are a hindrance to the company’s expansion plan
• High gearing ratio being the key risk for its recapitalisation plan
-100%
-50%
0%
50%
100%
150%
0
5
10
15
20
25
Jan-
13
Jan-
14
Jan-
15
Jan-
16
Jan-
17
P/E (x) vs EPS growth
P/E (x) (lhs) EPS growth (rhs)
0%
3%
5%
8%
10%
13%
15%
18%
20%
0.0
0.2
0.4
0.6
0.8
1.0
1.2
1.4
1.6
Jan-
13
Jan-
14
Jan-
15
Jan-
16
Jan-
17
P/BV (x) vs ROAE
P/B (x) (lhs) Return on average equity (rhs)
Source: Company data, RHB Source: Company data, RHB
Company Profile Ticon Industrial Connection provides international standard factories and logistics warehouses for rent and sale in industrial estates, industrial parks and other potential locations, and also offers other services with regards to commencing production in Thailand.
Ticon Ind Connection (TICON TB) 10 September 2015
See important disclosures at the end of this report 8
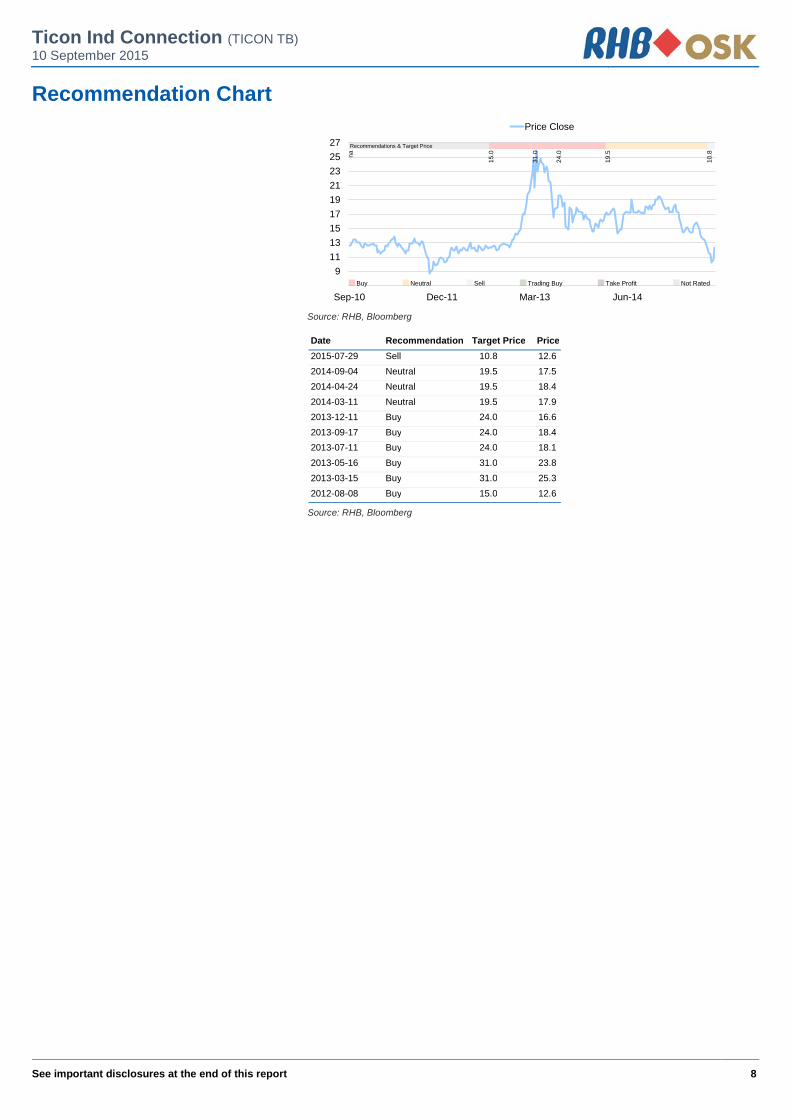
Recommendation Chart
79
111315171921232527
Sep-10 Dec-11 Mar-13 Jun-14
Price Close
na
15.0
31.0
24.0
19.5
10.8
Recommendations & Target Price
Buy Neutral Sell Trading Buy Take Profit Not Rated
Source: RHB, Bloomberg
Source: RHB, Bloomberg
Date Recommendation Target Price Price 2015-07-29 Sell 10.8 12.6 2014-09-04 Neutral 19.5 17.5 2014-04-24 Neutral 19.5 18.4 2014-03-11 Neutral 19.5 17.9 2013-12-11 Buy 24.0 16.6 2013-09-17 Buy 24.0 18.4 2013-07-11 Buy 24.0 18.1 2013-05-16 Buy 31.0 23.8 2013-03-15 Buy 31.0 25.3 2012-08-08 Buy 15.0 12.6
9
RHB Guide to Investment Ratings Buy: Share price may exceed 10% over the next 12 months Trading Buy: Share price may exceed 15% over the next 3 months, however longer-term outlook remains uncertain Neutral: Share price may fall within the range of +/- 10% over the next 12 months Take Profit: Target price has been attained. Look to accumulate at lower levels Sell: Share price may fall by more than 10% over the next 12 months Not Rated: Stock is not within regular research coverage Investment Research Disclaimers RHB has issued this report for information purposes only. This report is intended for circulation amongst RHB and its affiliates’ clients generally or such persons as may be deemed eligible by RHB to receive this report and does not have regard to the specific investment objectives, financial situation and the particular needs of any specific person who may receive this report. This report is not intended, and should not under any circumstances be construed as, an offer or a solicitation of an offer to buy or sell the securities referred to herein or any related financial instruments. This report may further consist of, whether in whole or in part, summaries, research, compilations, extracts or analysis that has been prepared by RHB’s strategic, joint venture and/or business partners. No representation or warranty (express or implied) is given as to the accuracy or completeness of such information and accordingly investors should make their own informed decisions before relying on the same. This report is not directed to, or intended for distribution to or use by, any person or entity who is a citizen or resident of or located in any locality, state, country or other jurisdiction where such distribution, publication, availability or use would be contrary to the applicable laws or regulations. By accepting this report, the recipient hereof (i) represents and warrants that it is lawfully able to receive this document under the laws and regulations of the jurisdiction in which it is located or other applicable laws and (ii) acknowledges and agrees to be bound by the limitations contained herein. Any failure to comply with these limitations may constitute a violation of applicable laws. All the information contained herein is based upon publicly available information and has been obtained from sources that RHB believes to be reliable and correct at the time of issue of this report. However, such sources have not been independently verified by RHB and/or its affiliates and this report does not purport to contain all information that a prospective investor may require. The opinions expressed herein are RHB’s present opinions only and are subject to change without prior notice. RHB is not under any obligation to update or keep current the information and opinions expressed herein or to provide the recipient with access to any additional information. Consequently, RHB does not guarantee, represent or warrant, expressly or impliedly, as to the adequacy, accuracy, reliability, fairness or completeness of the information and opinion contained in this report. Neither RHB (including its officers, directors, associates, connected parties, and/or employees) nor does any of its agents accept any liability for any direct, indirect or consequential losses, loss of profits and/or damages that may arise from the use or reliance of this research report and/or further communications given in relation to this report. Any such responsibility or liability is hereby expressly disclaimed. Whilst every effort is made to ensure that statement of facts made in this report are accurate, all estimates, projections, forecasts, expressions of opinion and other subjective judgments contained in this report are based on assumptions considered to be reasonable and must not be construed as a representation that the matters referred to therein will occur. Different assumptions by RHB or any other source may yield substantially different results and recommendations contained on one type of research product may differ from recommendations contained in other types of research. The performance of currencies may affect the value of, or income from, the securities or any other financial instruments referenced in this report. Holders of depositary receipts backed by the securities discussed in this report assume currency risk. Past performance is not a guide to future performance. Income from investments may fluctuate. The price or value of the investments to which this report relates, either directly or indirectly, may fall or rise against the interest of investors. This report does not purport to be comprehensive or to contain all the information that a prospective investor may need in order to make an investment decision. The recipient of this report is making its own independent assessment and decisions regarding any securities or financial instruments referenced herein. Any investment discussed or recommended in this report may be unsuitable for an investor depending on the investor’s specific investment objectives and financial position. The material in this report is general information intended for recipients who understand the risks of investing in financial instruments. This report does not take into account whether an investment or course of action and any associated risks are suitable for the recipient. Any recommendations contained in this report must therefore not be relied upon as investment advice based on the recipient's personal circumstances. Investors should make their own independent evaluation of the information contained herein, consider their own investment objective, financial situation and particular needs and seek their own financial, business, legal, tax and other advice regarding the appropriateness of investing in any securities or the investment strategies discussed or recommended in this report. This report may contain forward-looking statements which are often but not always identified by the use of words such as “believe”, “estimate”, “intend” and “expect” and statements that an event or result “may”, “will” or “might” occur or be achieved and other similar expressions. Such forward-looking statements are based on assumptions made and information currently available to RHB and are subject to known and unknown risks, uncertainties and other factors which may cause the actual results, performance or achievement to be materially different from any future results, performance or achievement, expressed or implied by such forward-looking statements. Caution should be taken with respect to such statements and recipients of this report should not place undue reliance on any such forward-looking statements. RHB expressly disclaims any obligation to update or revise any forward-looking statements, whether as a result of new information, future events or circumstances after the date of this publication or to reflect the occurrence of unanticipated events.
10
The use of any website to access this report electronically is done at the recipient’s own risk, and it is the recipient’s sole responsibility to take precautions to ensure that it is free from viruses or other items of a destructive nature. This report may also provide the addresses of, or contain hyperlinks to, websites. RHB takes no responsibility for the content contained therein. Such addresses or hyperlinks (including addresses or hyperlinks to RHB own website material) are provided solely for the recipient’s convenience. The information and the content of the linked site do not in any way form part of this report. Accessing such website or following such link through the report or RHB website shall be at the recipient’s own risk. This report may contain information obtained from third parties. Third party content providers do not guarantee the accuracy, completeness, timeliness or availability of any information and are not responsible for any errors or omissions (negligent or otherwise), regardless of the cause, or for the results obtained from the use of such content. Third party content providers give no express or implied warranties, including, but not limited to, any warranties of merchantability or fitness for a particular purpose or use. Third party content providers shall not be liable for any direct, indirect, incidental, exemplary, compensatory, punitive, special or consequential damages, costs, expenses, legal fees, or losses (including lost income or profits and opportunity costs) in connection with any use of their content. The research analysts responsible for the production of this report hereby certifies that the views expressed herein accurately and exclusively reflect his or her personal views and opinions about any and all of the issuers or securities analysed in this report and were prepared independently and autonomously. The research analysts that authored this report are precluded by RHB in all circumstances from trading in the securities or other financial instruments referenced in the report, or from having an interest in the company(ies) that they cover. RHB and/or its affiliates and/or their directors, officers, associates, connected parties and/or employees, may have, or have had, interests in the securities or qualified holdings, in subject company(ies) mentioned in this report or any securities related thereto and may from time to time add to or dispose of, or may be materially interested in, any such securities. Further, RHB and/or its affiliates may have, or have had, business relationships with the subject company(ies) mentioned in this report and may from time to time seek to provide investment banking or other services to the subject company(ies) referred to in this research report. As a result, investors should be aware that a conflict of interest may exist. The contents of this report is strictly confidential and may not be copied, reproduced, published, distributed, transmitted or passed, in whole or in part, to any other person without the prior express written consent of RHB and/or its affiliates. This report has been delivered to RHB and its affiliates’ clients for information purposes only and upon the express understanding that such parties will use it only for the purposes set forth above. By electing to view or accepting a copy of this report, the recipients have agreed that they will not print, copy, videotape, record, hyperlink, download, or otherwise attempt to reproduce or re-transmit (in any form including hard copy or electronic distribution format) the contents of this report. RHB and/or its affiliates accepts no liability whatsoever for the actions of third parties in this respect. The contents of this report are subject to copyright. Please refer to Restrictions on Distribution below for information regarding the distributors of this report. Recipients must not reproduce or disseminate any content or findings of this report without the express permission of RHB and the distributors. The securities mentioned in this publication may not be eligible for sale in some states or countries or certain categories of investors. The recipient of this report should have regard to the laws of the recipient’s place of domicile when contemplating transactions in the securities or other financial instruments referred to herein. The securities discussed in this report may not have been registered in such jurisdiction. Without prejudice to the foregoing, the recipient is to note that additional disclaimers, warnings or qualifications may apply based on geographical location of the person or entity receiving this report. RESTRICTIONS ON DISTRIBUTION Malaysia This report is issued and distributed in Malaysia by RHB Research Institute Sdn Bhd. The views and opinions in this report are our own as of the date hereof and is subject to change. If the Financial Services and Markets Act of the United Kingdom or the rules of the Financial Conduct Authority apply to a recipient, our obligations owed to such recipient therein are unaffected. RHB Research Institute Sdn Bhd has no obligation to update its opinion or the information in this report. Thailand This report is issued and distributed in the Kingdom of Thailand by RHB OSK Securities (Thailand) PCL, a licensed securities company that is authorised by the Ministry of Finance, regulated by the Securities and Exchange Commission of Thailand and is a member of the Stock Exchange of Thailand. The Thai Institute of Directors Association has disclosed the Corporate Governance Report of Thai Listed Companies made pursuant to the policy of the Securities and Exchange Commission of Thailand. RHB OSK Securities (Thailand) PCL does not endorse, confirm nor certify the result of the Corporate Governance Report of Thai Listed Companies. Indonesia This report is issued and distributed in Indonesia by PT RHB OSK Securities Indonesia. This research does not constitute an offering document and it should not be construed as an offer of securities in Indonesia. Any securities offered or sold, directly or indirectly, in Indonesia or to any Indonesian citizen or corporation (wherever located) or to any Indonesian resident in a manner which constitutes a public offering under Indonesian laws and regulations must comply with the prevailing Indonesian laws and regulations.
11
Singapore This report is issued and distributed in Singapore by RHB Research Institute Singapore Pte Ltd and it may only be distributed in Singapore to accredited investors, expert investors and institutional investors as defined in the Financial Advisers Regulations and the Securities and Futures Act (Chapter 289), as amended from time to time. By virtue of distribution to these categories of investors, RHB Research Institute Singapore Pte Ltd and its representatives are not required to comply with Section 36 of the Financial Advisers Act (Chapter 110) (Section 36 relates to disclosure of RHB Research Institute Singapore Pte Ltd ’s interest and/or its representative's interest in securities). Recipients of this report in Singapore may contact RHB Research Institute Singapore Pte Ltd in respect of any matter arising from or in connection with the report. Hong Kong This report is issued and distributed in Hong Kong by RHB OSK Securities Hong Kong Limited (興業僑豐證券有限公司) (CE No.: ADU220) (“RHBSHK”) which is licensed in Hong Kong by the Securities and Futures Commission for Type 1 (dealing in securities) and Type 4 (advising on securities) regulated activities. Any investors wishing to purchase or otherwise deal in the securities covered in this report should contact RHB OSK Securities Hong Kong Limited. United States This report was prepared by RHB and is being distributed solely and directly to “major” U.S. institutional investors as defined under, and pursuant to, the requirements of Rule 15a-6 under the U.S. Securities and Exchange Act of 1934, as amended (the “Exchange Act”). RHB is not registered as a broker-dealer in the United States and does not offer brokerage services to U.S. persons. Any order for the purchase or sale of the securities discussed herein that are listed on Bursa Malaysia Securities Berhad must be placed with and through Auerbach Grayson (“AG”). Any order for the purchase or sale of all other securities discussed herein must be placed with and through such other registered U.S. broker-dealer as appointed by RHB from time to time as required by the Exchange Act Rule 15a-6. This report is confidential and not intended for distribution to, or use by, persons other than the recipient and its employees, agents and advisors, as applicable. Additionally, where research is distributed via Electronic Service Provider, the analysts whose names appear in this report are not registered or qualified as research analysts in the United States and are not associated persons of Auerbach Grayson AG or such other registered U.S. broker-dealer as appointed by RHB from time to time and therefore may not be subject to any applicable restrictions under Financial Industry Regulatory Authority (“FINRA”) rules on communications with a subject company, public appearances and personal trading. Investing in any non-U.S. securities or related financial instruments discussed in this research report may present certain risks. The securities of non-U.S. issuers may not be registered with, or be subject to the regulations of, the U.S. Securities and Exchange Commission. Information on non-U.S. securities or related financial instruments may be limited. Foreign companies may not be subject to audit and reporting standards and regulatory requirements comparable to those in the United States. The financial instruments discussed in this report may not be suitable for all investors. Transactions in foreign markets may be subject to regulations that differ from or offer less protection than those in the United States. OWNERSHIP AND MATERIAL CONFLICTS OF INTEREST Malaysia RHB does not have qualified shareholding (1% or more) in the subject company (ies) covered in this report except for: a) - RHB and/or its subsidiaries are not liquidity providers or market makers for the subject company (ies) covered in this report except for: a) - RHB and/or its subsidiaries have not participated as a syndicate member in share offerings and/or bond issues in securities covered in this report in the last 12 months except for: a) - RHB has not provided investment banking services to the company/companies covered in this report in the last 12 months except for: a) - Thailand RHB OSK Securities (Thailand) PCL and/or its directors, officers, associates, connected parties and/or employees, may have, or have had, interests and/or commitments in the securities in subject company(ies) mentioned in this report or any securities related thereto. Further, RHB OSK Securities (Thailand) PCL may have, or have had, business relationships with the subject company(ies) mentioned in this report. As a result, investors should exercise their own judgment carefully before making any investment decisions.
12
Indonesia PT RHB OSK Securities Indonesia is not affiliated with the subject company(ies) covered in this report both directly or indirectly as per the definitions of affiliation above. Pursuant to the Capital Market Law (Law Number 8 Year 1995) and the supporting regulations thereof, what constitutes as affiliated parties are as follows: 1. Familial relationship due to marriage or blood up to the second degree, both horizontally or vertically;
2. Affiliation between parties to the employees, Directors or Commissioners of the parties concerned;
3. Affiliation between 2 companies whereby one or more member of the Board of Directors or the Commissioners are the same;
4. Affiliation between the Company and the parties, both directly or indirectly, controlling or being controlled by the Company;
5. Affiliation between 2 companies which are controlled, directly or indirectly, by the same party; or
6. Affiliation between the Company and the main Shareholders.
PT RHB OSK Securities Indonesia is not an insider as defined in the Capital Market Law and the information contained in this report is not considered as insider information prohibited by law.
Insider means: a. a commissioner, director or employee of an Issuer or Public Company;
b. a substantial shareholder of an Issuer or Public Company;
c. an individual, who because of his position or profession, or because of a business relationship with an Issuer or Public Company, has access to inside information; and
d. an individual who within the last six months was a Person defined in letters a, b or c, above.
Singapore RHB Research Institute Singapore Pte Ltd and/or its subsidiaries and/or associated companies do not make a market in any securities covered in this report, except for: (a) - The staff of RHB Research Institute Singapore Pte Ltd and its subsidiaries and/or its associated companies do not serve on any board or trustee positions of any issuer whose securities are covered in this report, except for: (a) - RHB Research Institute Singapore Pte Ltd and/or its subsidiaries and/or its associated companies do not have and have not within the last 12 months had any corporate finance advisory relationship with the issuer of the securities covered in this report or any other relationship (including a shareholding of 1% or more in the securities covered in this report) that may create a potential conflict of interest, except for: (a) - Hong Kong RHBSHK or any of its group companies may have financial interests in in relation to an issuer or a new listing applicant (as the case may be) the securities in respect of which are reviewed in the report, and such interests aggregate to an amount equal to or more than (a) 1% of the subject company’s market capitalization (in the case of an issuer as defined under paragraph 16 of the Code of Conduct for Persons Licensed by or Registered with the Securities and Futures Commission (the “Code of Conduct”); and/or (b) an amount equal to or more than 1% of the subject company’s issued share capital, or issued units, as applicable (in the case of a new listing applicant as defined in the Code of Conduct). Further, the analysts named in this report or their associates may have financial interests in relation to an issuer or a new listing applicant (as the case may be) in the securities which are reviewed in the report. RHBSHK or any of its group companies may make a market in the securities covered by this report. RHBSHK or any of its group companies may have analysts or their associates, individual(s) employed by or associated with RHBSHK or any of its group companies serving as an officer of the company or any of the companies covered by this report. RHBSHK or any of its group companies may have received compensation or a mandate for investment banking services to the company or any of the companies covered by this report within the past 12 months. Note: The reference to “group companies” above refers to a group company of RHBSHK that carries on a business in Hong Kong in (a) investment banking; (b) proprietary trading or market making; or (c) agency broking, in relation to securities listed or traded on The Stock Exchange of Hong Kong Limited.
13
Kuala Lumpur Hong Kong Singapore
RHB Research Institute Sdn Bhd Level 11, Tower One, RHB Centre
Jalan Tun Razak Kuala Lumpur
Malaysia Tel : +(60) 3 9280 2185 Fax : +(60) 3 9284 8693
RHB OSK Securities Hong Kong Ltd.
12th Floor World-Wide House 19 Des Voeux Road Central, Hong Kong
Tel : +(852) 2525 1118 Fax : +(852) 2810 0908
RHB Research Institute Singapore
Pte Ltd (formerly known as DMG & Partners Research Pte Ltd)
10 Collyer Quay #09-08 Ocean Financial Centre
Singapore 049315 Tel : +(65) 6533 1818 Fax : +(65) 6532 6211
Jakarta Shanghai Phnom Penh
PT RHB OSK Securities Indonesia Wisma Mulia, 20th Floor
Jl. Jend. Gatot Subroto No. 42 Jakarta 12710, Indonesia Tel : +(6221) 2783 0888 Fax : +(6221) 2783 0777
RHB OSK (China) Investment Advisory Co. Ltd.
Suite 4005, CITIC Square 1168 Nanjing West Road
Shanghai 20041 China
Tel : +(8621) 6288 9611 Fax : +(8621) 6288 9633
RHB OSK Indochina Securities Limited
No. 1-3, Street 271 Sangkat Toeuk Thla, Khan Sen Sok
Phnom Penh Cambodia
Tel: +(855) 23 969 161 Fax: +(855) 23 969 171
Bangkok
RHB OSK Securities (Thailand) PCL
10th Floor, Sathorn Square Office Tower 98, North Sathorn Road, Silom
Bangrak, Bangkok 10500 Thailand
Tel: +(66) 2 862 9999 Fax : +(66) 2 862 9799
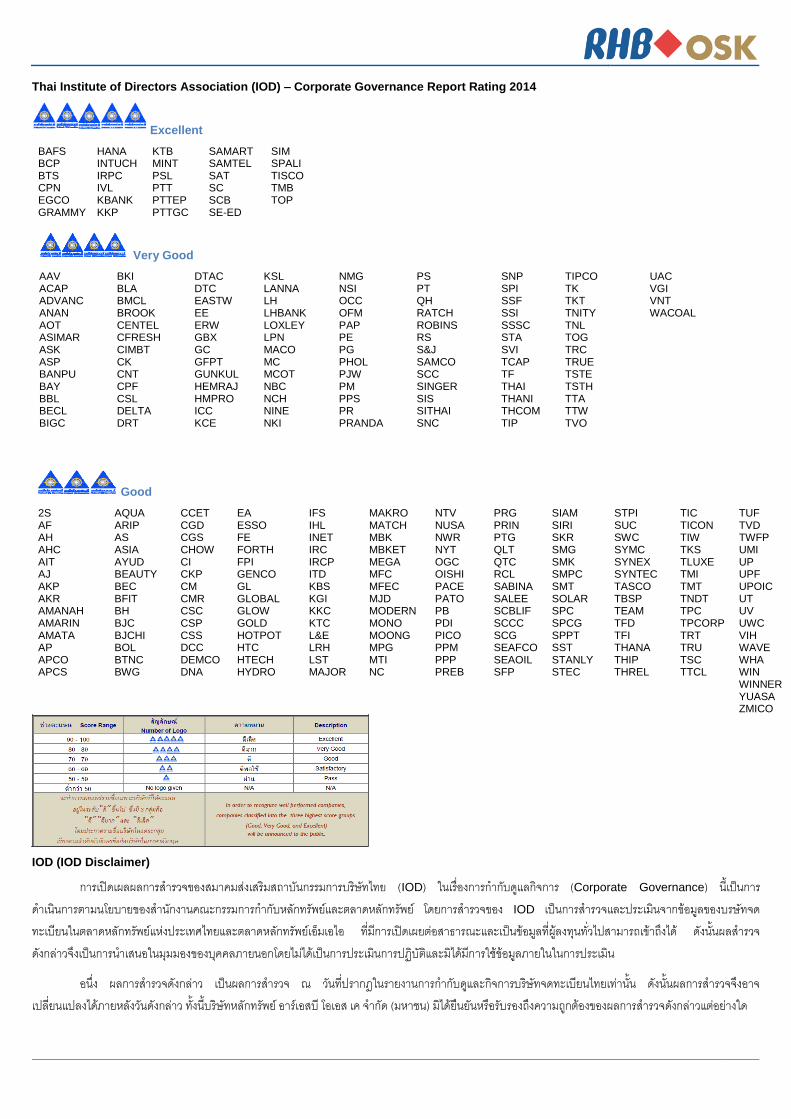
Thai Institute of Directors Association (IOD) – Corporate Governance Report Rating 2014
Excellent
BAFS HANA KTB SAMART SIM BCP INTUCH MINT SAMTEL SPALI BTS IRPC PSL SAT TISCO CPN IVL PTT SC TMB EGCO KBANK PTTEP SCB TOP GRAMMY KKP PTTGC SE-ED
Very Good
AAV BKI DTAC KSL NMG PS SNP TIPCO UAC ACAP BLA DTC LANNA NSI PT SPI TK VGI ADVANC BMCL EASTW LH OCC QH SSF TKT VNT ANAN BROOK EE LHBANK OFM RATCH SSI TNITY WACOAL AOT CENTEL ERW LOXLEY PAP ROBINS SSSC TNL ASIMAR CFRESH GBX LPN PE RS STA TOG ASK CIMBT GC MACO PG S&J SVI TRC ASP CK GFPT MC PHOL SAMCO TCAP TRUE BANPU CNT GUNKUL MCOT PJW SCC TF TSTE BAY CPF HEMRAJ NBC PM SINGER THAI TSTH BBL CSL HMPRO NCH PPS SIS THANI TTA BECL DELTA ICC NINE PR SITHAI THCOM TTW BIGC DRT KCE NKI PRANDA SNC TIP TVO
Good
2S AQUA CCET EA IFS MAKRO NTV PRG SIAM STPI TIC TUF AF ARIP CGD ESSO IHL MATCH NUSA PRIN SIRI SUC TICON TVD AH AS CGS FE INET MBK NWR PTG SKR SWC TIW TWFP AHC ASIA CHOW FORTH IRC MBKET NYT QLT SMG SYMC TKS UMI AIT AYUD CI FPI IRCP MEGA OGC QTC SMK SYNEX TLUXE UP AJ BEAUTY CKP GENCO ITD MFC OISHI RCL SMPC SYNTEC TMI UPF AKP BEC CM GL KBS MFEC PACE SABINA SMT TASCO TMT UPOIC AKR BFIT CMR GLOBAL KGI MJD PATO SALEE SOLAR TBSP TNDT UT AMANAH BH CSC GLOW KKC MODERN PB SCBLIF SPC TEAM TPC UV AMARIN BJC CSP GOLD KTC MONO PDI SCCC SPCG TFD TPCORP UWC AMATA BJCHI CSS HOTPOT L&E MOONG PICO SCG SPPT TFI TRT VIH AP BOL DCC HTC LRH MPG PPM SEAFCO SST THANA TRU WAVE APCO BTNC DEMCO HTECH LST MTI PPP SEAOIL STANLY THIP TSC WHA APCS BWG DNA HYDRO MAJOR NC PREB SFP STEC THREL TTCL WIN
WINNER YUASA
ZMICO
IOD (IOD Disclaimer)
การเปิดเผลผลการส ารวจของสมาคมส่งเสริมสถาบันกรรมการบรษิัทไทย (IOD) ในเรื่องการก ากับดูแลกิจการ (Corporate Governance) นี้เป็นการด าเนินการตามนโยบายของส านักงานคณะกรรมการก ากับหลักทรัพย์และตลาดหลักทรัพย์ โดยการส ารวจของ IOD เป็นการส ารวจและประเมินจากข้อมูลของบรษัทจดทะเบียนในตลาดหลักทรัพย์แห่งประเทศไทยและตลาดหลกัทรัพย์เอ็มเอไอ ที่มีการเปิดเผยต่อสาธารณะและเป็นข้อมูลที่ผูล้งทุนทั่วไปสามารถเข้าถงึได้ ดังนั้นผลส ารวจดังกล่าวจึงเป็นการน าเสนอในมุมมองของบุคคลภายนอกโดยไม่ได้เป็นการประเมินการปฏิบัติและมิได้มีการใช้ข้อมูลภายในในการประเมิน
อนึ่ง ผลการส ารวจดังกล่าว เป็นผลการส ารวจ ณ วนัที่ปรากฎในรายงานการก ากับดแูละกิจการบริษัทจดทะเบียนไทยเท่านั้น ดังนั้นผลการส ารวจจึงอาจเปลี่ยนแปลงได้ภายหลังวันดังกล่าว ทัง้นี้บริษัทหลักทรัพย์ อาร์เอสบี โอเอส เค จ ากัด (มหาชน) มิได้ยืนยันหรือรับรองถึงความถูกต้องของผลการส ารวจดงักล่าวแต่อย่างใด