oil & gas services neutral (from overweight) - perdanaperdana.my/file/pdf/analyst/10.01.2014 rhb...
TRANSCRIPT

See important disclosures at the end of this report Powered by EFATM
Platform 1
Sector Update, 1 October 2014
Oil & Gas Services NEUTRAL (from Overweight)
Not All Paradigm Shifts Are Exciting
Macro
1
Risks
1
Growth
1
Value
1
Buys
Companies Ticker
Market cap (MYRm)
FV (MYR)
SapuraKencana Petroleum SAKP MK 29,361 5.33
Dialog Group DLG MK 9,476 2.25
Bumi Armada BAB MK 7,232 2.24
Dayang Enterprise DEHB MK 3,184 4.80
Coastal Contract COCO MK 2,029 5.90
Wah Seong WSC MK 1,278 2.25
Perdana Petroleum PETR MK 825 2.20
Source: RHB
Sells
Companies Ticker
Market cap (MYRm)
FV (MYR)
Petronas Chemicals PCHEM MK 55,360 6.11
Malaysia Marine and Heavy Engineering
MMHE MK 5,600 3.10
Yinson YNS MK 2,218 2.60
Source: RHB
Neutrals
Companies Ticker
Market cap (MYRm)
FV (MYR)
Perisai Petroleum PPT MK 1,723 1.46
Alam Maritim AMRB MK 1,451 1.35
Muhibbah Engineering MUHI MK 939 3.22
Petra Energy PENB MK 691 3.02
Favelle Favco FFB MK 668 3.62
Daya Materials DAYA MK 519 0.31
Source: RHB
Kong Ho Meng +603 9207 7620
The Research Team +603 9207 7609
We are turning more cautious on the implementation and execution risks of the stocks under our coverage, going forward. We believe the sector’s current premium valuation is unsustainable, as many local O&G players venture overseas and move up the value chain. We see this resulting in a narrowing of the gap between local and global valuations. We downgrade this sector to NEUTRAL from Overweight.
Near-term outlook lacks re-rating catalysts. We believe the sector’s
upside is limited moving forward, and think that oil and gas (O&G) project timelines in Malaysia and worldwide may see further delays. The increasing costs and complexities of projects, uncertainties in long-term expectations of O&G demand and the direction of crude oil prices have and will likely continue to influence global O&G majors’ capex spending.
Current valuation unsustainable. Malaysian O&G players are moving away from the domestic front and becoming regional or global companies – as more often than not, overseas markets tend to offer more lucrative margins – which is positive for the industry. However, we believe that as players expand abroad, the big gap in valuations (when compared to their regional and global peers) should narrow and Malaysian O&G stocks should shed their premium valuations. Currently, Malaysian O&G stocks are valued higher than their regional and global peers, albeit at a lower earnings base and market share. We believe the premiums are unsustainable in the long run.
Four NEUTRAL segments, one OVERWEIGHT segment. Under our coverage universe, the stocks are divided into five segments. We are currently NEUTRAL on the following segments: i) floating production, storage and offloading (FPSO), ii) drilling rigs, iii) services and fabrication, and iv) downstream and petrochemicals. We are NEUTRAL on these segments as we believe the outlook going forward remains mixed. Having said that, we are still OVERWEIGHT on exploration and production as we believe the development of the segment remains positive, driven by Petronas’ need to sustain its production profile.
Downgrading four stocks. Over the past two months, we have downgraded three stocks to NEUTRAL from Buy – Perisai Petroleum Teknologi (Perisai) (PPT MK, FV: MYR1.46), Muhibbah Engineering (Muhibbah) (MUHI MK, FV: MYR3.22) and Daya Materials (DAYA MK, FV: MYR0.31) – and one stock to SELL from Neutral, ie Malaysia Marine Heavy Engineering (MMHE) (MMHE MK, FV: MYR3.10). Common themes within these four downgrades were: i) a slow orderbook replenishment rate, ii) underutilized assets, as well as iii) operational inefficiencies and uncertainties resulting in low margins. (Please see overleaf
for our summarised valuation table)
Oil & Gas Services 1 October 2014
See important disclosures at the end of this report 2
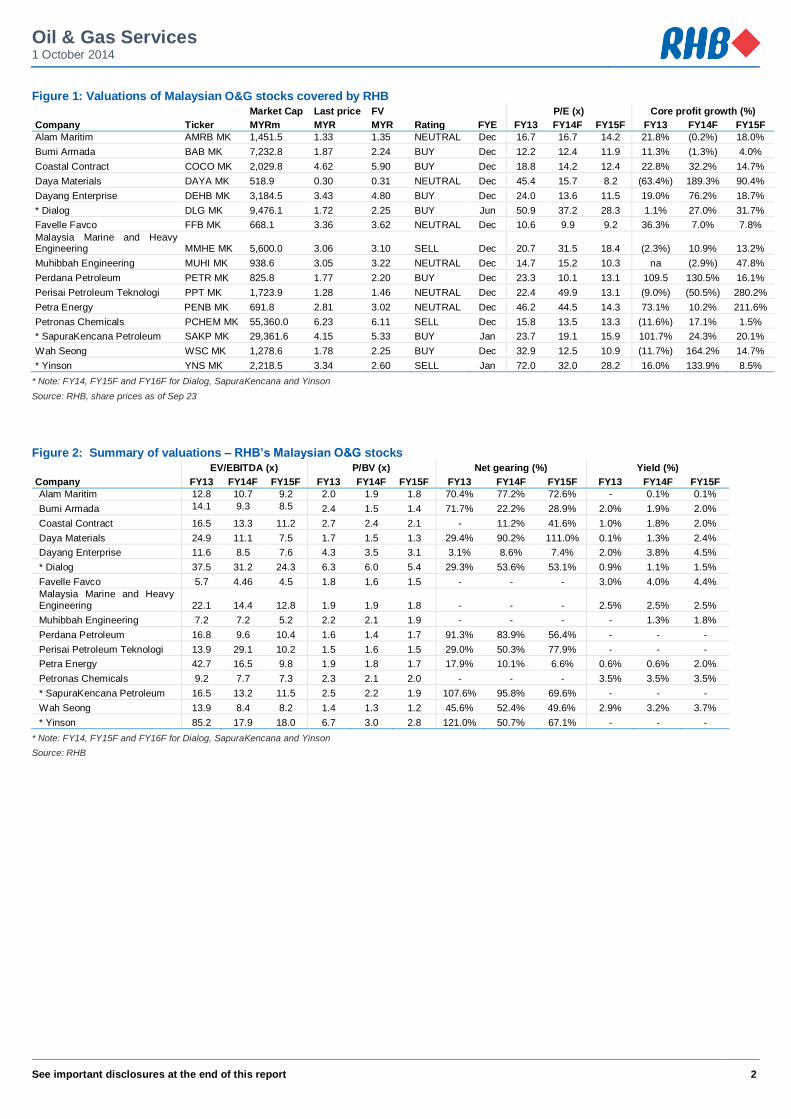
Figure 1: Valuations of Malaysian O&G stocks covered by RHB
Market Cap Last price FV P/E (x) Core profit growth (%)
Company Ticker MYRm MYR MYR Rating FYE FY13 FY14F FY15F FY13 FY14F FY15F
Alam Maritim AMRB MK 1,451.5 1.33 1.35 NEUTRAL Dec 16.7 16.7 14.2 21.8% (0.2%) 18.0%
Bumi Armada BAB MK 7,232.8 1.87 2.24 BUY Dec 12.2 12.4 11.9 11.3% (1.3%) 4.0%
Coastal Contract COCO MK 2,029.8 4.62 5.90 BUY Dec 18.8 14.2 12.4 22.8% 32.2% 14.7%
Daya Materials DAYA MK 518.9 0.30 0.31 NEUTRAL Dec 45.4 15.7 8.2 (63.4%) 189.3% 90.4%
Dayang Enterprise DEHB MK 3,184.5 3.43 4.80 BUY Dec 24.0 13.6 11.5 19.0% 76.2% 18.7%
* Dialog DLG MK 9,476.1 1.72 2.25 BUY Jun 50.9 37.2 28.3 1.1% 27.0% 31.7%
Favelle Favco FFB MK 668.1 3.36 3.62 NEUTRAL Dec 10.6 9.9 9.2 36.3% 7.0% 7.8%
Malaysia Marine and Heavy Engineering MMHE MK 5,600.0 3.06 3.10 SELL Dec 20.7 31.5 18.4 (2.3%) 10.9% 13.2%
Muhibbah Engineering MUHI MK 938.6 3.05 3.22 NEUTRAL Dec 14.7 15.2 10.3 na (2.9%) 47.8%
Perdana Petroleum PETR MK 825.8 1.77 2.20 BUY Dec 23.3 10.1 13.1 109.5 130.5% 16.1%
Perisai Petroleum Teknologi PPT MK 1,723.9 1.28 1.46 NEUTRAL Dec 22.4 49.9 13.1 (9.0%) (50.5%) 280.2%
Petra Energy PENB MK 691.8 2.81 3.02 NEUTRAL Dec 46.2 44.5 14.3 73.1% 10.2% 211.6%
Petronas Chemicals PCHEM MK 55,360.0 6.23 6.11 SELL Dec 15.8 13.5 13.3 (11.6%) 17.1% 1.5%
* SapuraKencana Petroleum SAKP MK 29,361.6 4.15 5.33 BUY Jan 23.7 19.1 15.9 101.7% 24.3% 20.1%
Wah Seong WSC MK 1,278.6 1.78 2.25 BUY Dec 32.9 12.5 10.9 (11.7%) 164.2% 14.7%
* Yinson YNS MK 2,218.5 3.34 2.60 SELL Jan 72.0 32.0 28.2 16.0% 133.9% 8.5%
* Note: FY14, FY15F and FY16F for Dialog, SapuraKencana and Yinson
Source: RHB, share prices as of Sep 23
Figure 2: Summary of valuations – RHB’s Malaysian O&G stocks
EV/EBITDA (x) P/BV (x) Net gearing (%) Yield (%)
Company FY13 FY14F FY15F FY13 FY14F FY15F FY13 FY14F FY15F FY13 FY14F FY15F
Alam Maritim 12.8 10.7 9.2 2.0 1.9 1.8 70.4% 77.2% 72.6% - 0.1% 0.1%
Bumi Armada 14.1 9.3 8.5 2.4 1.5 1.4 71.7% 22.2% 28.9% 2.0% 1.9% 2.0%
Coastal Contract 16.5 13.3 11.2 2.7 2.4 2.1 - 11.2% 41.6% 1.0% 1.8% 2.0%
Daya Materials 24.9 11.1 7.5 1.7 1.5 1.3 29.4% 90.2% 111.0% 0.1% 1.3% 2.4%
Dayang Enterprise 11.6 8.5 7.6 4.3 3.5 3.1 3.1% 8.6% 7.4% 2.0% 3.8% 4.5%
* Dialog 37.5 31.2 24.3 6.3 6.0 5.4 29.3% 53.6% 53.1% 0.9% 1.1% 1.5%
Favelle Favco 5.7 4.46 4.5 1.8 1.6 1.5 - - - 3.0% 4.0% 4.4%
Malaysia Marine and Heavy Engineering 22.1 14.4 12.8 1.9 1.9 1.8 - - - 2.5% 2.5% 2.5%
Muhibbah Engineering 7.2 7.2 5.2 2.2 2.1 1.9 - - - - 1.3% 1.8%
Perdana Petroleum 16.8 9.6 10.4 1.6 1.4 1.7 91.3% 83.9% 56.4% - - -
Perisai Petroleum Teknologi 13.9 29.1 10.2 1.5 1.6 1.5 29.0% 50.3% 77.9% - - -
Petra Energy 42.7 16.5 9.8 1.9 1.8 1.7 17.9% 10.1% 6.6% 0.6% 0.6% 2.0%
Petronas Chemicals 9.2 7.7 7.3 2.3 2.1 2.0 - - - 3.5% 3.5% 3.5%
* SapuraKencana Petroleum 16.5 13.2 11.5 2.5 2.2 1.9 107.6% 95.8% 69.6% - - -
Wah Seong 13.9 8.4 8.2 1.4 1.3 1.2 45.6% 52.4% 49.6% 2.9% 3.2% 3.7%
* Yinson 85.2 17.9 18.0 6.7 3.0 2.8 121.0% 50.7% 67.1% - - -
* Note: FY14, FY15F and FY16F for Dialog, SapuraKencana and Yinson
Source: RHB

Oil & Gas Services 1 October 2014
See important disclosures at the end of this report 3
Table Of Contents
Sector Summary (NEUTRAL) 4
Valuations are stretched 4
O&G sector: downgrade to NEUTRAL 4
Downgraded stocks 5
Valuations are Stretched 6
Exploration & Production (Maintain OVERWEIGHT) 9
The surge of E&P ownership 9
Floating Production, Storage and Offloading (Downgrade To NEUTRAL) 13
Prospects offset by risks on cost and delays 13
Leading indicators for FPS demand 13
Near-term outlook may lead to more project delays 14
Drilling rigs (Downgrade to NEUTRAL) 16
Drilling too deep? 16
OSVs And Shipbuilding (Downgrade To NEUTRAL) 20
The myth of charter rates 20
Services And Fabrication Space (Maintain NEUTRAL) 22
EPC the next stage 22
After the mega service contracts, what next? 22
Downstream (Maintain NEUTRAL) 24
Oil storage 24
Petrochemicals 25

Oil & Gas Services 1 October 2014
See important disclosures at the end of this report 4
Sector Summary (Downgrade To NEUTRAL)
Valuations are stretched
Petronas’ capex spending, which has propelled the positive sentiment in the O&G sector over the past several years, we believe will remain robust at MYR40bn-60bn. However, we are turning more cautious on the implementation and execution risks going forward. We see limited upside to the sector moving forward, and believe the current premium ascribed to it is unsustainable, as many local O&G players venture overseas and move up the value chain. This should move local valuations closer to global ones. We downgrade this sector to NEUTRAL from Overweight.
Downgrading the sector to NEUTRAL
O&G stocks under our coverage are divided into five segments. Of these, we are only OVERWEIGHT on exploration and production players as we believe their outlook is still positive. Meanwhile, we are NEUTRAL on the rest of the segments as we believe the outlook of the companies is mixed. Exploration & production (E&P) – OVERWEIGHT (maintained). We are OVERWEIGHT on the E&P segment as we believe there is still some upside for companies involved in this very technically demanding aspect of the O&G industry. We believe growth for the segment would come from three types of E&P: i) marginal fields, ii) enhanced oil recovery, and iii) deepwater exploration. Their long-term values would slowly unfold via a production sharing contract (PSC) or a risk service contract (RSC) from Petronas. FPSO – NEUTRAL (downgraded from Overweight). Although there is continuous demand for FPSOs, the segment is notorious for its inherent risks – contract award delays, execution risks and cost overruns. Given the huge capex, fundraising will likely involve 20-30% equity with the rest coming from borrowings. Earnings may only materialise after a 2-year conversion and construction period. We view that the global O&G industry is in a tightening global capex spending phase. A downturn in global O&G outlook could delay project planning stages, which could lead to lower contract awards. Drilling rigs – NEUTRAL (downgraded from Overweight). This is a key segment in the exploration phase. From our observation of crude oil prices and jack-up (JU) rig day rates, and with the current price of crude oil hovering around the lower range of USD90-100, we believe JU rig rates could stabilise around USD140,000-150,000, if not lower. As we do not expect day rates to go up, cost increases would hurt their bottomlines. Other risks could involve delays in capex spending and uncommitted projects from the oil majors. We note the expensive valuations of the Malaysian rig players, notably UMW Oil and Gas (UMWOG) (UMWOG MK, NR) which is currently trading at 20x/12x EV/EBITDAs for FY14F/FY15F. Global players are valued at EV/EBITDAs of 6-7x. Offshore supply vessel (OSV) – NEUTRAL (downgraded from Overweight). While the industry remains bullish over future contracts, our NEUTRAL rating is premised on our belief that local valuations offer limited upside. Malaysian market valuations of 13-15x P/Es are above that of regional peers (<10x) despite positive sector fundamentals – which is partly due to the advantage they enjoy as a result of cabotage policies. We foresee local OSV players being increasingly dependent on overseas OSV contracts. Hence, we believe that local OSV valuations could move towards global valuations. On charter rates, we believe these would remain steady in the near future. Recent industry consolidation suggests that new entrants are still coming into the market, with current players undergoing fleet modernisation. Services and fabrication – NEUTRAL (maintained). We believe the market has priced in the long-term orderbook coming from the mega umbrella service contracts. Initially, most of the key service contractors reported lower margins due to slower work orders, and the depreciation, operating and interest costs that had been booked into the P&L for the additional assets and vessels required to prepare for jobs. We expect these jobs to come into full swing by end-2014, which should help normalise margins. Further growth for the service players would come from moving into a higher value chain such as engineering, procurement, construction and commissioning jobs (EPCC), which entails new risks.

Oil & Gas Services 1 October 2014
See important disclosures at the end of this report 5
Downstream and petrochemicals – NEUTRAL (maintained). We see subdued excitement for downstream players in the near term, as major re-rating catalysts may only take place 3-5 years towards the completion of the refinery and petrochemicals integrated development (RAPID) project due in early 2019. We are NEUTRAL for the long term on the storage industry. While the sector’s near-term outlook is supported by strong demand in Asia, we are concerned over the long-term impact on the Straits Hub terminals from rising capacity from regions like China, India and the Middle East.
We believe the outlook for petrochemicals remains mixed. In the near term, ethylene-based product prices might be on an upward trend due to major ethylene producers in Taiwan, South Korea and Japan undergoing major plant turnarounds. However, we expect prices for methane-based products, ie urea, ammonia and methanol, to soften in the near to mid term, as Chinese urea producers are expected to flood the market during the low tax window that lasts until the end of October. However, prices could recover, as the planting season in the northern hemisphere picks up pace in early- to mid-2015.
Downgraded stocks
Across the subsectors, we recently downgraded four stocks; three were downgraded from Buy to NEUTRAL while one was downgraded from a Neutral to a SELL.
Perisai Petroleum Teknologi (NEUTRAL from Buy). Perisai registered a disappointing 1H core net loss, as its Rubicone mobile offshore production unit (MOPU) and Enterprise 3 derrick lay barge (DLB) were underutilised. We do not expect the two assets to be deployed in FY14 and potential contracts may only be in FY15. Perisai has two more rigs due to be completed in mid-2015 and mid-2016. Due to the lack of earnings visibility on new contracts for the idle vessels and the new JU rigs, we downgrade the stock to a NEUTRAL with a FV of MYR1.46 (from MYR2.07), which is based on 15x P/E to FY15 EPS. This is a 1x discount to the target P/E of 16x for other OSV players under our coverage.
Muhibbah Engineering (downgraded to NEUTRAL from Buy). Muhibbah’s 1HFY14 only came in at 25%/35% of our/consensus estimates respectively. Due to the disappointing results, we cut our FY14/FY15 earnings forecasts by 42%/43% respectively, as we believe Muhibbah will be facing an uphill battle in replenishing its orderbook. We estimate its current orderbook at MYR2.0bn, ie 1.1x its FY13 revenue. This implies a lack of earnings visibility. We do note that Muhibbah holds an offshore fabrication license from Petronas and is a potential beneficiary of RAPID projects. To date, 11 infrastructure and production packages have been given out by Petronas for the project. Our lower SOP-based FV of MYR3.22 (from MYR3.38) implies an undemanding FY15F P/E of 10.7x.
MMHE (downgraded to SELL from Neutral). MMHE registered disappointing 1HFY14 results due to higher-than-expected operating costs at its offshore construction division while the marine construction wing was impacted by lower margin projects. Its current situation has also been exacerbated by the load out of three major projects in 1HFY14. This is because most of the earnings from the projects have been booked in, leaving the company with a 50% yard utilisation rate. Our downgrade to SELL is based upon MMHE’s lack of earnings visibility and continued operational inefficiencies. We peg the company to 18.7x FY15F P/E, a 10% discount to the large cap O&G counters under our coverage with a lower FV of MYR3.10 (from MYR4.08).
Daya Materials (NEUTRAL from Buy). We downgraded Daya Materials on end-August, as we think the company deserves to trade at a lower P/E of 9x vs our 13-16x for the OSV sector. While the company’s offshore subsea construction division will become a significant earnings driver (7+2 years charter in the North Sea for Technip), we believe its earnings recovery is overshadowed by near-term share price overhang. This is due to uncertainties from fund-raising risks and the loss of a key management person who recently resigned from the board. Daya Materials plans to raise a total of MYR990m, mostly to fund the full acquisition of its vessels. Our ex-all FV could be MYR0.09-0.11 pegged to unchanged 9x P/E.

Oil & Gas Services 1 October 2014
See important disclosures at the end of this report 6
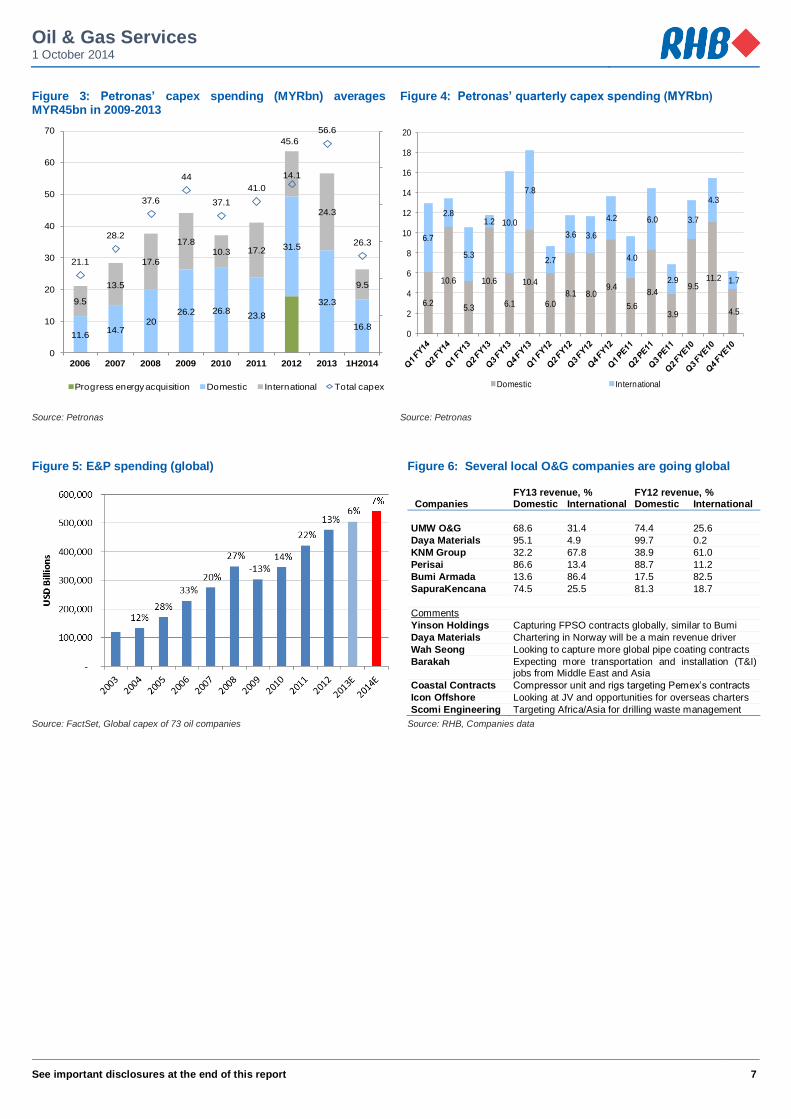
Valuations Are Stretched Petronas’ capex spending, which has propelled the positive sentiment in the O&G sector over the several years, is expected to remain robust at MYR40bn-60bn. However, we are turning more cautious on the implementation and execution risks going forward, as we see limited upside to the sector. We believe the sector’s current premium valuation is unsustainable, given that many local O&G players are venturing overseas and moving up the value chain. This should result in a narrowing of the gap between local and global valuations. We downgrade this sector to NEUTRAL from Overweight. We believe the past flurry of P/E re-ratings is coming towards its tail-end, as we believe many O&G companies are entering into a more challenging phase of growth. In 2011-2013, O&G big caps outperformed the KLCI index at an average of 12% while small caps outperformed by as much as 50% on average. During that period, the sector was driven by positive sentiment from Petronas’ 5-year MYR300bn capex roll-out and business transformation/expansion by key O&G players. However, the sector’s earnings have underperformed market’s expectations as a result of lower margins. This was mainly due to a couple of factors. Firstly, a mismatch in expectations of project timelines to the slow execution of work orders did not help to cover for depreciation, operating costs and interest charges. Secondly, delayed roll-outs of new contract awards complicated orderbook replenishment. Local jobs will still go on. We opine that Petronas will resume its annual capex spending at our estimates of MYR40-60bn per annum. Through 2009-2013, capex spending averaged MYR45bn per annum, whereby the domestic capex average was MYR28bn (63% of the total) while the international investment was MYR17bn (37%). 1H14 capex spending from Petronas was recorded at MYR26.3bn, of which domestic capex stood at MYR16.8bn (64%) while international investment was booked at MYR9.5bn (36%). We note that international capex has increased of late. The market expects a better 2H14. The industry expects 2HCY14 to be better, driven by the pickup in operating activities and more contract awards. The contract awards range from brownfield, enhanced oil recovery (EOR – at least 10 EOR projects expected to be awarded) and risk sharing contracts (RSCs) to fabrication and engineering, procurement, construction and commissioning (EPCC) works. We are turning more cautious. Despite the market’s bullish view, we advise investors to weigh these against execution risk, as earnings recognition for some of these contracts may be backloaded. Large capital-intensive projects and/or global expansion usually entail higher political and execution risks. There will also be a longer development period before reasonable returns from mega projects are seen. We believe that there will also be greater need for fund-raising with partnership risks and competition with the big boys. We advise investors to focus on companies with clear long-term diversification strategies, have proven execution track records and are niche players in the O&G sub-sectors. Domestic valuations are priced in. We see limited upside to the sector moving forward, given the challenge to grow from a higher earnings base as a result of the influx of major contracts awarded as well as the increasing risks in the current operating and financing environment. While contract awards are still expected, we believe O&G activities (Malaysia and worldwide) will see further delays in project timelines, influenced by a myriad of factors. These include increasing costs and project complexities, uncertainties in the long-term expectations of O&G demand and the direction of crude oil prices. These factors have influenced the capex spending of global O&G majors in the past and will continue to do so moving forward. We believe the sector’s premium valuation is unsustainable. Many local O&G companies are expanding regionally, signalling the growing “independence” from Petronas’ direction and capex spending. While the market’s outperformance in 2011-2013 represented an overdrive period for domestic O&G capex expansion, the future of many local O&G players will involve global expansion and moving up the value chain. We interpret this to result in a narrowing of the gap between local and global valuations.
Despite the outperformance of the sector over the 2011-2013 period, the sector’s earnings have underperformed market expectations
Petronas’ capex spending, which has propelled the positive sentiment in the O&G sector over the past several years, will remain robust
More contract awards expected in 2H14
We are turning more cautious, given that further risks are expected to come from project implementation and execution
Limited upside to the sector moving forward
Current sector premium valuation is unsustainable
Oil & Gas Services 1 October 2014
See important disclosures at the end of this report 7
Figure 3: Petronas’ capex spending (MYRbn) averages MYR45bn in 2009-2013
Figure 4: Petronas’ quarterly capex spending (MYRbn)
11.614.7
2026.2 26.8
23.8
31.5
32.3
16.8
9.5
13.5
17.6
17.810.3 17.2
14.1
24.3
9.5
21.1
28.2
37.6
44
37.1
41.0
45.6
56.6
26.3
0
10
20
30
40
50
60
0
10
20
30
40
50
60
70
2006 2007 2008 2009 2010 2011 2012 2013 1H2014
Progress energy acquisition Domestic International Total capex
6.2
10.6
5.3
10.6
6.1
10.4
6.0
8.1 8.09.4
5.6
8.4
3.9
9.511.2
4.5
6.7
2.8
5.3
1.2 10.0
7.8
2.7
3.6 3.6
4.2
4.0
6.0
2.9
3.7
4.3
1.7
0
2
4
6
8
10
12
14
16
18
20
Domestic International
Source: Petronas Source: Petronas
Figure 5: E&P spending (global) Figure 6: Several local O&G companies are going global
FY13 revenue, % FY12 revenue, % Companies Domestic International Domestic International
UMW O&G 68.6 31.4 74.4 25.6
Daya Materials 95.1 4.9 99.7 0.2
KNM Group 32.2 67.8 38.9 61.0
Perisai 86.6 13.4 88.7 11.2
Bumi Armada 13.6 86.4 17.5 82.5
SapuraKencana 74.5 25.5 81.3 18.7
Comments
Yinson Holdings Capturing FPSO contracts globally, similar to Bumi
Daya Materials Chartering in Norway will be a main revenue driver
Wah Seong Looking to capture more global pipe coating contracts
Barakah Expecting more transportation and installation (T&I) jobs from Middle East and Asia
Coastal Contracts Compressor unit and rigs targeting Pemex’s contracts
Icon Offshore Looking at JV and opportunities for overseas charters
Scomi Engineering Targeting Africa/Asia for drilling waste management
Source: FactSet, Global capex of 73 oil companies Source: RHB, Companies data

Oil & Gas Services 1 October 2014
See important disclosures at the end of this report 8
Figure 7: Forecast on upstream spending by oil majors Figure 8: Capex vs crude oil production by oil majors
Source: Bloomberg, Douglas Westwood Source: Bloomberg, Douglas Westwood
Figure 3: Share price relative performance (%, past 12 months)
Figure 4: Relative performance (%, past three months)
-50 0 50 100 150
BUMI ARMADA BERHAD
MALAYSIA MARINE AND HEAVY EN
ALAM MARITIM RESOURCES
PETRONAS CHEMICALS GROUP
DAYA MATERIALS
PERISAI PETROLEUM TEKNOLOGI
PETRONAS GAS
WAH SEONG CORP
DAYANG ENTERPRISE HLDGS
SAPURAKENCANA PETROLEUM
FAVELLE FAVCO
PETRA ENERGY
DIALOG GROUP
MUHIBBAH ENGINEERING (M)
PERDANA PETROLEUM
COASTAL CONTRACTS
YINSON HOLDINGS
-30 -20 -10 0 10 20 30 40
BUMI ARMADA BERHAD
MALAYSIA MARINE AND HEAVY EN
PERISAI PETROLEUM TEKNOLOGI
ALAM MARITIM RESOURCES
PETRA ENERGY
DIALOG GROUP
DAYA MATERIALS
PETRONAS CHEMICALS GROUP
SAPURAKENCANA PETROLEUM
FAVELLE FAVCO
PETRONAS GAS
DAYANG ENTERPRISE HLDGS
WAH SEONG CORP
COASTAL CONTRACTS
PERDANA PETROLEUM
MUHIBBAH ENGINEERING (M)
YINSON HOLDINGS
Source: Bloomberg Source: Bloomberg

Oil & Gas Services 1 October 2014
See important disclosures at the end of this report 9
E&P (Maintain OVERWEIGHT) The surge of E&P ownership
OVERWEIGHT. There are many O&G players venturing into E&P asset ownership that are slowly transforming themselves into industry names. We believe that the higher bookings of barrels (bbls) (for both undeveloped and developed reserve profiles) and production growth will drive E&Ps higher. While E&P continues to be a hot O&G topic in South-East Asia, the key criteria for success are the: i) cash margins – ranging around USD30-40/bbl, ii) good acreage positions, iii) quality of the wells, iv) debt-adjusted production growth, and v) management experience. This comes in tandem with the need for strong execution, solid partnerships and ample balance sheets to absorb additional costs to justify drilling into potentially dry wells. E&P is ultimately a high-risk business. Although more reserves are found, E&P companies still need time to realise the value from their discoveries due to the operations and execution risks involved in reserves recovery. We believe E&P players with clearly defined strategies and the ability to demonstrate execution track records will emerge as long-term winners.
SapuraKencana Petroleum (SapuraKencana) (SAKP MK, BUY, FV: MYR5.33) is our Top Pick for the subsector. This is because it has demonstrated good execution, having recognised profit from managing the Berantai field. It also discovered significant upside in gas reserves at the SK310 and SK318 fields while benefiting from its ability to retain Newfield Exploration Co’s (Newfield) (NFX US, NR) technical personnel who operated at the fields for a long time. SapuraKencana made huge discoveries in five wells at its gas fields in Sarawak (also previously belonging to Newfield), which should provide significant upside to its original gas reserves estimates of 1.5-3trn cu ft. There are five more remaining wells to be drilled.
We believe that Dialog Group (DLG MK, BUY, FV: MYR2.25), which holds several E&P assets, is still in the cost recovery stage. The same applies to Petra Energy (PENB MK, NEUTRAL, FV: MYR3.02), which is operating the KBM RSC. However, we believe these stocks have passed the learning curve and are slowly building up strong balance sheets. Hence, they could be the next successful E&P players to keep an eye on.
Other beneficiaries of E&P play are Scomi Energy Services (SES MK, NR) and Uzma (UZMA MK, NR), as they are the RSC service contractors with Ophir Energy (OPHR LN, NR) for the Tanjung Baram Delta field. Sumatec Resources (SMTC MK, NR) is operating several O&G concessions in Kazakhstan. Investors with higher risk appetite could consider special purpose acquisition companies (SPAC) such as Hibiscus Petroleum (HIBI MK, NR), Sona Petroleum (SONA MK, NR), Cliq Energy (CLIQ MK, NR) and Reach Energy (REB MK, NR).
A flurry of players into the E&P space. E&P asset ownership is the current hot segment in the South-East Asian O&G market right now. The big majors have exited their overseas assets to refocus on existing businesses in their own countries. This has provided significant opportunities to the independent and small E&P companies to acquire these O&G fields. The super oil majors, we gather, are also rationalising capex spending to reserve for projects in the deepwater E&P segment and the evolution of unconventional sources of energy like shale gas.
Malaysia E&P developments. Official statistics from the US Energy Information Administration (EIA) report that Malaysia has 4bn bbls of proven oil reserves. The country also has 2.35trn cu m of proven gas reserves as at early 2014. The industry expects East Malaysia to be a key growth region to sustain O&G reserves. Our key stocks (SapuraKencana, Dialog and Petra Energy) all have E&P assets exposure here. Discoveries and reserve upgrades are coming from: i) deepwater fields, ii) marginal and stranded fields, and iii) EOR.
Malaysia’s deepwater acreage has at least 7bn bbls of oil equivalent (boe) of resources left to be discovered on top of the current proven 3bn boe. Technip’s (TEC FP, NR) decision to establish a plant in Tanjung Langsat, Johor, to produce high-tech flexible pipes and deepwater umbilicals is a sign that the industry is capturing this potential. The latest known deepwater discovery is Royal Dutch Shell (RDSA LN, NR)’s Rosmari-1 at the SK318 field offshore Sarawak.
Petronas sees 106 marginal fields holding 580m bbls of oil in total (14.5% of total country’s proven reserves). About 25-27 of these fields may be developed through RSCs, with six awarded thus far. The national oil company said that USD55-60/bbl was the breakeven cost point to commercialise these fields.
E&P has emerged as the hottest play in South-East Asia now. However, we believe long-term winners in this high-risk business must be able to demonstrate their ability to enhance value accretion from reserve values. We focus on companies with execution capabilities, balance sheet strength and management track record

Oil & Gas Services 1 October 2014
See important disclosures at the end of this report 10
In Sept 2013, Petronas identified 14 oilfields ripe for EOR technology. At least 10 EOR projects are in the pipeline for development over the next 10 years. However, these projects are technically challenging and may require about USD14bn in total to execute. EOR could increase the average oil recovery factor for Malaysian fields by 5% or more from the current 33-37% of oil-initially-in-place.
Malaysian players have involvement in all sorts of E&P contracts. Over the past few years, we have seen Petronas awarding at least five local firms with RSCs, two players were given PSCs by the national company and a third landed an oil field services contract (OSC). In the same period, a local company ventured into an oilfield concession in Kazakhstan and four SPACS have been set up to look into acquiring regional and global oil fields.
Figure 11: Malaysia’s proven oil reserves Figure 12: Malaysia’s proven gas reserves
Source: Energy Commission of Malaysia, BMI Source: Energy Commission of Malaysia, BMI
Figure 13: Malaysia’s proven O&G reserve key data
2010 2011 2012 2013 2014 2015 2016 2017 2018 2019 2020 2021
Proven oil reserves, m bbl 4000.0 4000.0 4000.0 4000.0 4000.0 4057.0 4111.2 4162.8 4209.4 4258.1 4306.5 4354.8
Proven oil reserves, bn bbl 4.0 4.0 4.0 4.0 4.0 4.1 4.1 4.2 4.2 4.3 4.3 4.4
Proven oil reserves, % y-o-y 0.0 0.0 0.0 0.0 0.0 1.4 1.3 1.3 1.1 1.2 1.1 1.1
Reserves to production ratio (RPR), years 16.5 18.1 17.6 18.0 17.8 17.8 17.7 17.7 17.5 17.9 18.1 18.3
Natural gas proven reserves (bn cu m) 2350.3 2350.3 2350.3 2350.3 2350.3 2356.7 2363.3 2370.0 2373.4 2376.9 2380.4 2387.6
Natural gas proven reserves (trn cu m) 2.4 2.4 2.4 2.4 2.4 2.4 2.4 2.4 2.4 2.4 2.4 2.4
Natural gas proven reserves, % y-o-y 0.0 0.0 0.0 0.0 0.0 0.3 0.3 0.3 0.1 0.1 0.1 0.2
Natural gas reserves-to-production ratio, years 38.2 38.1 38.1 37.6 37.0 36.6 36.0 35.4 34.9 34.2 33.6 33.5
Source: EIA, BMI

Oil & Gas Services 1 October 2014
See important disclosures at the end of this report 11
Figure 14: Malaysia’s major discoveries from 2011 to YTD 2014
Name Nature Block Location Type Companies Resource estimate/results Announced Sirih-1 Gas and
condensate SK 320 Sarawak Shallow water Mubadala Petroleum, Carigali, Shell 850m gross gas column Q214
Pagaga-2 Gas SK 320 Sarawak Shallow water Mubadala Petroleum, Carigali, Shell 293m gross gas column Q214 Teja-1 Gas SK 408 Sarawak Shallow water SapuraKencana Energy, Carigali, Shell 219m gross column Q214 Gorek-1 Gas SK 408 Sarawak Shallow water SapuraKencana Energy, Carigali, Shell 235m gross column Q214 Legundi-1 Gas SK 408 Sarawak Shallow water SapuraKencana Energy, Carigali, Shell 139m gross column Q214 Larak-1 Gas SK 408 Sarawak Shallow water SapuraKencana Energy, Carigali, Shell 333m gross column Q214 Rosmari-1 Gas SK 318 Sarawak Deepwater Shell, Petronas 450m gas column Q214 B-14 Gas SK 310 Sarawak Shallow water SapuraKencana Energy, Partners Diamond
Energy Sarawak, Petronas 483m net gas pay; 42-84bn cu m of gas-in-place Q213
Sintok-1 Gas SK 320 Sarawak Shallow water Mubadala Petroleum, Carigali 292m gas column Q114
Pegaga-1 Gas SK 321 Sarawak Shallow water Mubadala Petroleum, Carigali 247m gas column Q313
Adong Kecil 1 Oil and gas SK 333 Sarawak Onshore JX Nippon, Carigali 349m net hydrocarbon column Q113
Kuang North-1 Gas SK 316 Sarawak Shallow water Petronas 636m gas column; 64bn cu m gas-in-place for Kuang North field Q412
Tukau Timur Deep-1
Gas SK 307 Sarawak Deepwater Shell, Petronas 183m net gas pay; 58.8bn cu m gas-in-place for Tukau Timur field Q412
Tembakau-1 Gas PM 307 West Malaysia
Shallow water Lundin, Petronas 60m net gas pay; 16.8bn cu m gas-in-place for field Q412
Kasawari-1 Gas SK 316 Sarawak Shallow water Petronas 1,000m gas column; 84bn cu m of recoverable gas for Kasawari field Q112
NC8SW-1 Oil and gas SK 316 Sarawak Shallow water Petronas 440m gas column; 12.6bn cu m of recoverable gas for NC8SW field Q112
Limbayong-2 Oil and gas Block J Sarawak Deepwater Shell, Petronas, ConocoPhillips 136m oil column Q114
Cendor Oil PM 304 West Malaysia
Shallow water Petrofac, Kuwait Foreign Petroleum Exploration, PetroVietnam, Carigali
200m bbl of recoverable oil Q213
Wakid-1 Oil and gas 2G-2J Sarawak Shallow water Petronas 227m boe of resource-in-place Q411
Bertam Oil PM 307 West Malaysia
Shallow water Lundin 64m bbl of oil Q112
Source: BMI
Figure 15: Blocks offered in the Petronas’ licensing round 2014
Block name Area Acreage (sq km) Type of contract
PM-327 West Malaysia 3,990 R/C PSC
PM-331 West Malaysia 1,290 R/C PSC
PM-337 West Malaysia 2,452 R/C PSC
PM-403 West Malaysia 5,829 R/C PSC
DW-T Sabah 1,537 Deep Water PSC
DW-V Sabah 2,895 Deep Water PSC
SB-306 Sabah 9,058 R/C PSC
DW-2D Sarawak 4,674 Deep Water PSC
SK-317A Sarawak 1,306 R/C PSC
SK-332 Sarawak 6,357 Onshore PSC
SK-335 Sarawak 2,996 Onshore PSC
Source: Deloitte
Oil & Gas Services 1 October 2014
See important disclosures at the end of this report 12
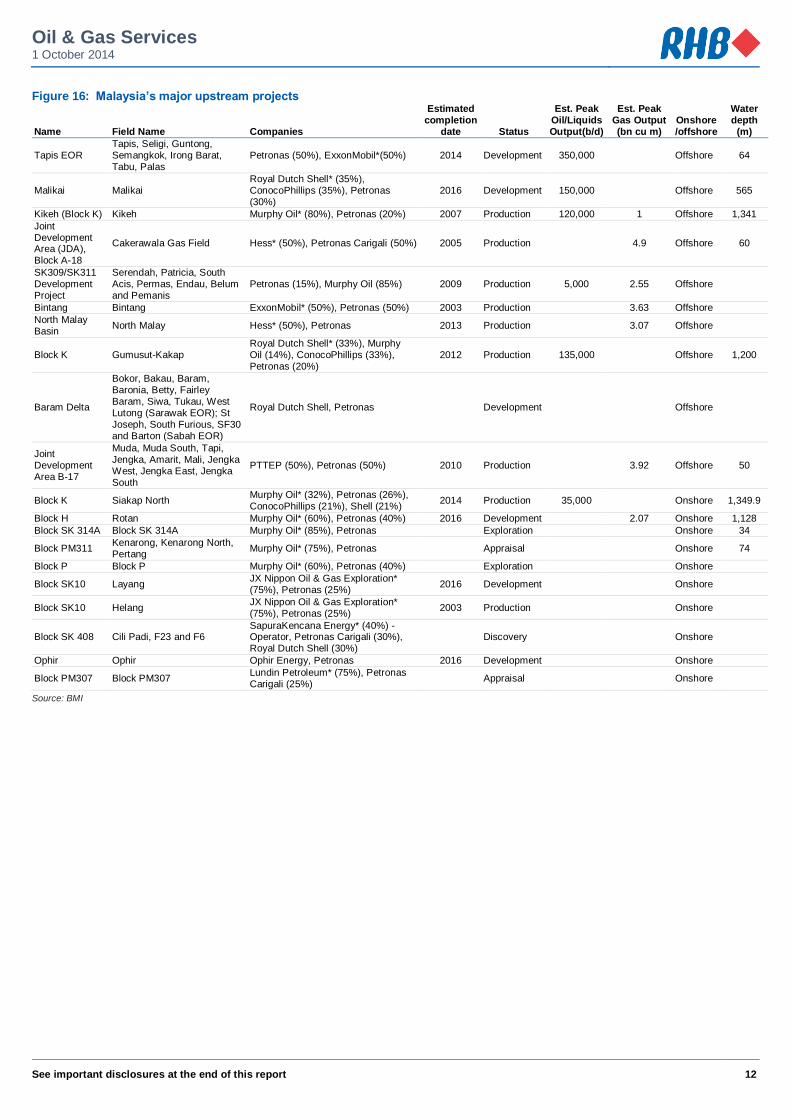
Figure 16: Malaysia’s major upstream projects
Name Field Name Companies
Estimated completion
date Status
Est. Peak Oil/Liquids Output(b/d)
Est. Peak Gas Output (bn cu m)
Onshore/offshore
Water depth
(m)
Tapis EOR Tapis, Seligi, Guntong, Semangkok, Irong Barat, Tabu, Palas
Petronas (50%), ExxonMobil*(50%) 2014 Development 350,000 Offshore 64
Malikai Malikai Royal Dutch Shell* (35%), ConocoPhillips (35%), Petronas (30%)
2016 Development 150,000 Offshore 565
Kikeh (Block K) Kikeh Murphy Oil* (80%), Petronas (20%) 2007 Production 120,000 1 Offshore 1,341
Joint Development Area (JDA), Block A-18
Cakerawala Gas Field Hess* (50%), Petronas Carigali (50%) 2005 Production 4.9 Offshore 60
SK309/SK311 Development Project
Serendah, Patricia, South Acis, Permas, Endau, Belum and Pemanis
Petronas (15%), Murphy Oil (85%) 2009 Production 5,000 2.55 Offshore
Bintang Bintang ExxonMobil* (50%), Petronas (50%) 2003 Production 3.63 Offshore
North Malay Basin
North Malay Hess* (50%), Petronas 2013 Production 3.07 Offshore
Block K Gumusut-Kakap Royal Dutch Shell* (33%), Murphy Oil (14%), ConocoPhillips (33%), Petronas (20%)
2012 Production 135,000 Offshore 1,200
Baram Delta
Bokor, Bakau, Baram, Baronia, Betty, Fairley Baram, Siwa, Tukau, West Lutong (Sarawak EOR); St Joseph, South Furious, SF30 and Barton (Sabah EOR)
Royal Dutch Shell, Petronas
Development Offshore
Joint Development Area B-17
Muda, Muda South, Tapi, Jengka, Amarit, Mali, Jengka West, Jengka East, Jengka South
PTTEP (50%), Petronas (50%) 2010 Production 3.92 Offshore 50
Block K Siakap North Murphy Oil* (32%), Petronas (26%), ConocoPhillips (21%), Shell (21%)
2014 Production 35,000 Onshore 1,349.9
Block H Rotan Murphy Oil* (60%), Petronas (40%) 2016 Development 2.07 Onshore 1,128
Block SK 314A Block SK 314A Murphy Oil* (85%), Petronas Exploration Onshore 34
Block PM311 Kenarong, Kenarong North, Pertang
Murphy Oil* (75%), Petronas Appraisal
Onshore 74
Block P Block P Murphy Oil* (60%), Petronas (40%) Exploration Onshore
Block SK10 Layang JX Nippon Oil & Gas Exploration* (75%), Petronas (25%)
2016 Development
Onshore
Block SK10 Helang JX Nippon Oil & Gas Exploration* (75%), Petronas (25%)
2003 Production
Onshore
Block SK 408 Cili Padi, F23 and F6 SapuraKencana Energy* (40%) - Operator, Petronas Carigali (30%), Royal Dutch Shell (30%)
Discovery
Onshore
Ophir Ophir Ophir Energy, Petronas 2016 Development Onshore
Block PM307 Block PM307 Lundin Petroleum* (75%), Petronas Carigali (25%)
Appraisal
Onshore
Source: BMI

Oil & Gas Services 1 October 2014
See important disclosures at the end of this report 13
FPSO (Downgrade To NEUTRAL) Prospects offset by risk on costs and delays
We are turning NEUTRAL on this subsector (from Overweight). This is despite planned projects for FPSO units pointing towards a continuous demand trend. We weighed in the leading indicators against contract award delays, execution risks and growing supply with new entrants, ie fabricators TH Heavy Engineering (RH MK, NR), and small-time players like M3Nergy. The bifurcation of FPSO expertise implies that the Top 6 global players are capturing larger capex FPSOs (>USD800m), which come with increasing execution risks and cost overruns. Fund-raising for such large projects are likely to be heavy, at 20-30% equity and 70-80% debt, while earnings will only be material upon first oil, ie after a 2-year conversion/construction period. We also see a lack of re-rating catalysts. While floating liquefied natural gas (FLNG) projects are the next frontier of development for floating production system (FPS) players, feasibility will only become apparent in the long run, as construction and technological costs become more scalable.
Given the long construction period and 11-15% project IRR, we advise investors to focus on companies with proven management track record, strong balance sheets, high preference for firm periods v. options, conservative depreciation, and sound funding strategies.
Bumi Armada (BAB MK, BUY, FV: MYR2.24) is our preferred pick for this sub-segment for its long-term value. This is backed by a firm orderbook of MYR25bn. Bumi Armada has the competitive advantage of operating as many as three FPSO jobs at once (with a balance to project risk) due to its in-house engineering and procurement chain, allowing it to position itself as the best beneficiary of contract wins.
We advise a SELL on Yinson (YNS MK, SELL, FV: MYR2.60), as we believe the high premium (two times above the global peers’ average of 10x EV/EBITDA) is unsustainable. We believe the market has fully factored in its potential rise on the O&G value chain to the mega FPSO segment (from its mid-size FPSO niche).
Leading indicators for the FPS market
The leading indicators suggest that there is still continuous FPSO demand. In our view, future FPSO contract awards for the next five years could fall within 13-16 per annum, slightly higher than the historical 13-14 long-term average, given a total of 136 contracts awarded in the past 10 years. Five FPSO projects were awarded in 1H14 vs 12 expected in 2014 and 13 in 2015. At least five of the remaining projects to be awarded through 2014-2015 are Petroleo Brasileiro (Petrobras) (PBR US, NR) projects scheduled for upcoming tenders with a 2018 first oil target.
According to data from the International Maritime Associates (IMA), as at September, 216 FPSOs units were in service (75%), on order (17%) or idle (8%). These FPSOs accounted for 64% of the total existing 329 FPS in the market. 229 floating production unit (FPU) projects are in various stages of planning (FPSOs: 133, or 58%), with about 57% concentrated in key high-growth countries and regions like Africa, Brazil and South-East Asia.
About 30 of the 229 FPU projects (13%) may advance into the engineering, procurement and construction (EPC) stage within the next 18 months, as they have entered the design, pre-qualification or bidding stages. 110 projects (50%) are at development stage, where EPC could fall within the next 18-48 months. The remaining 37% may require 4-10 years before reaching EPC. 58% or 133 of these visible projects are FPSOs, more than the 95 projects booked in 2008 and 58 recorded in 2004.
We downgrade the FPSO subsector to NEUTRAL. We have a BUY on Bumi Armada and SELL on Yinson
Leading indicators indicate strong possibility of continuous FPSO/FSU contract awards, as c.13% of 229 visible planned projects may advance into the EPC stage in the next 18 months. 58%, or 133 of these visible projects, are FPSOs
According to Upstream, 17 FPSOs are needed for deployment in Brazil and Africa from 2015-2020

Oil & Gas Services 1 October 2014
See important disclosures at the end of this report 14
Figure 17: No. of FPUs in service, on order or available Figure 18: Planned projects by type and field locations
FPU Total Active On order Available
O&G production
FPSO 216 161 38 17
Production Barge 10 8 2 0
Production Semi 48 41 2 5
Production Spar 22 20 2 0
Tension Leg Platform 28 24 4 0
Total 324 254 48 22
LNG processing
FLNG 5 0 5 0
FSRU 24 13 11 0
Storage
FSO 102 93 8 1
Type No. Location No.
FPSO 133 Africa 49
Other FPS 29 Brazil 43
FLNG 32 South-East Asia 39
FSRU 20 GOM 24
FSO 15 North EU 23
FPSO
Australia/ New Zealand
16
Mediterranean 10
South West Asia 10
Others 49
Total 229 Total 229
Source: International Maritime Associates, as at 1 Sept 2014 Source: International Maritime Associates as at 1 Sept 2014
Future outlook may lead to more project delays
FPSO contracts are driven by many factors. The pace at which potential projects can be transformed to orders are dependent upon: i) future O&G demand and oil prices, ii) future O&G finds and feasibility of deepwater projects, iii) O&G companies capex budget, iv) constraints in the supply chain, v) relative financial returns and cost escalations, vi) access to financing, and vii) feasibility of larger and complex projects. IMA predicts that around 10% of the visible 133 FPSO projects have other possible production solutions, while 15% may ultimately not proceed to development. Final investment decisions (FID) could also take longer than expected, despite IMA projections that 65% of the projects could reach FID within the next five years.
We highlight that the distortion of the global financial crisis and the oil price shock in 2008-2009 resulted in a lull in contract awards, ie merely five in 2009. Since then, contract awards have picked up to a high of 25 in 2010, as Petrobras ordered hulls for a series of FPSOs. A deterioration of the global O&G outlook could delay project planning stages, which can result in lower average contract awards. We saw this in 2009-2013 where only 66 contracts were awarded (13 per year on average) vs 2003-2008’s 70 (14 per year on average). We expect the same factors could again cause future project planning delays. We gathered that the industry players are conservative and have factored in a growing backlog of contract orders, consistent with our view. For example, SBM Offshore (SBMO NA, NR) expects only eight project awards in 2014 vs the market expectation of 14.
Figure 19: FPU backlog peaks and troughs (LHS) vs Brent crude oil price in USD/bbl (RHS)
31 3035
3134
31 29
22 20
1417 18
24
33 3235 37 39 38 36 37
32 32 31 31
4044 44
5855
6258
53 54
46
35 3330 32
42 42 4447
50
60
6764
69 7065
68 6864
0
20
40
60
80
100
120
140
0
10
20
30
40
50
60
70
80
Sep-96 Oct-97 Dec-98 Dec-992000 Nov-01Aug-02 Oct-03 Nov-04 Nov-05 Nov-06 Nov-07 Dec-08 Nov-09 Nov-10 Nov-11 Nov-12 Nov-13 Sep-14
Source: International Maritime Associates, as at 1 Sept 2014
Given our view that the global O&G industry is in a tightening global capex spending phase, and that large deepwater discoveries could see increased lead time for project sanctioning, we reiterate our NEUTRAL call on the FPSO segment. This is largely premised on contract award delays, project execution risks and increasing supply.

Oil & Gas Services 1 October 2014
See important disclosures at the end of this report 15
Figure 20: Increasing project complexity may lead to delays in project awards
Source: SBM Offshore
Earnings forecast made complicated by accounting changes. FPSO players worldwide are also adapting to new IFRS accounting changes on shipping, which emphasise finance lease applications for FPSO contracts with long contract periods/large capex. Finance leases add further complexity in terms of earnings forecasting, as they accelerate revenue and profit recognition into the construction phase well before the rental is invoiced to the client. As compared to operating leases, which recognise revenue and profits equally on a straight-line basis, finance leases result in minimal earnings recognition during the conversion/construction phase. Although the cash flow statement remains intact, this affected Malaysian market valuations, which are largely P/E-centric.
Cost escalations add to the complication. Costs overruns are normal in the process of FPSO conversions due to the complexity of the project design and timeline. Usually, companies have some form of contingency budget for this. However, stubborn cost escalations and design risks, as well as the execution of large FPSO conversions, equate to cost overruns that could exceed the allowable limits set aside by a company’s contingency budget. Local content requirements and constraints in the supply chain have also complicated the project execution processes. It was for these reasons that IMA reduced its future orders forecast (through 2013-2018) to 67-94 FPSOs from 100-140 previously.
Figure 21: SBM Offshore’s FPSO award expectations Figure 22: FPSO peers comparison (average 10x EV/EBITDA for global peers)
Peers Ticker
Current year P/E
1-year forward P/E
1-year forward EV/EBITDA P/BV Call
Bumi Armada BAB MK 12.4 11.9 12.8 2.0 BUY
Yinson YNS MK 32.0 28.2 18.0 2.8 SELL
SBM Offshore SBMO NA 6.8 7.4 8.9 1.0 NR
Modec 6269 JP 20.1 13.4 11.0 1.4 NR
BW Offshore BWO NO 5.3 8.2 5.0 0.7 NR
Teekay TK US na 44.1 11.8 4.8 NR
Weighted avg 16.1 20.3 10.5 2.2
Weighted avg Ex-Msia 7.8 19.4 9.8 2.2
Source: Company data Source: RHB, Bloomberg

Oil & Gas Services 1 October 2014
See important disclosures at the end of this report 16
Drilling rigs (Downgrade To NEUTRAL) Drilling too deep?
We turn NEUTRAL on the local drilling sub-segment (from Overweight). While the industry remains bullish on the South-East Asia JU market, we believe that Malaysia’s pricey valuations as typified by UMWOG – which trades at 20x/12x FY14F/FY15F EV/EBITDAs respectively – should move towards global players’ standard trading valuations of 6-7x EV/EBITDA. This is because many local rig players are aspiring to become global operators. We also believe consensus has been pricing in blue-sky scenarios and not factoring in operations’ downside risks sufficiently. This is given the fact that such contracts have provisions that could warrant lower charter rates/zero rate/termination in the event of downtime and unscheduled repairs. Cost inflation could also be higher than our forecast of ~5% (mainly on manpower and spares), which is a negative effect. This is because we no longer expect further uptrends in day rates. Risks that could ultimately increase the cost of operations across the industry are: i) further delays in capex spending and uncommitted projects from the oil majors and Petronas, ii) geopolitical risks, iii) higher frequency of industry accidents, and iv) stricter regulations.
Coastal Contracts (COCO MK, FV: MYR5.90). The company transformed itself into a rig play to the high-growth Mexican market. For its JU rig (delivery by 4Q14), it is also considering spot charters in South-East Asia. Another JU rig is slated for delivery by mid-2015. While we are cautiously optimistic on Coastal Contracts’ JU rig business, given its lack of track record as rig operator, the potential addition of the rig’s recurring income stream provides a re-rating catalyst. Maintain BUY.
Perisai. The company’s JU rig is slightly less competitive, in our view. This is because it is being chartered to Petronas for its first long-term contract and has yet to secure a job overseas. A second rig is due to be delivered by June 2015. Perisai’s earnings, however, are not expected to be driven by the JU rig, as it is still plagued by the immobilisation of the Rubicon MOPU and the E3 derrick lay barge. Maintain NEUTRAL.
UMWOG. The company remains a clear beneficiary of the South-East Asia JU rig play. However, its long-term aspiration to become a global rig player beyond 2015 supports our belief that its current 12-20x EV/EBITDA should move towards the global 6-7x range.
The replacement cycle. We see the demand for JU rigs mainly supported by continuous offshore exploration activities and the replacement cycle. We believe a young age fleet directly translates into improving utilisation and day rates, as charterers will continue to prefer efficient, modern rigs over aged assets. The current cycle of rig deliveries are necessary to replace the first JU newbuild cycle, ie JUs before 1990 (309 rigs built). Of the 724 JU rigs globally, 70% are more than 30 years old, with 24% being less than 10 years. We note that JU rigs in South-East Asia are generally younger and more competitive relative to the global fleet. Totalling 66 rigs currently, 65% are less than 10 years old and 27% more than 30 years old. Around 25% of JU rigs in Malaysia are aged more than 30 years, relative to the 27% in South-East Asia and 70% globally. Malaysia also stands out for having competitive JU rigs aged less than 10 years of age at 69% of total JU rigs vs. 65% in South-East Asia and 24% worldwide.
We downgrade the Malaysian rig subsector to NEUTRAL. This is premised on the fact that the premium valuations are not long-term sustainable, given that the key players are exposed to global contracts. This is despite the fact that rig fundamentals appear to remain strong in South-East Asia for the foreseeable term
We have two key stocks with exposure to JU rigs, namely a BUY on Coastal Contracts and NEUTRAL on Perisai. UMWOG is currently Not Rated
Stable day rates, high utilisation and young fleet point to continuous demand for JU rigs in South-East Asia’s shallow-water play

Oil & Gas Services 1 October 2014
See important disclosures at the end of this report 17
Figure 23: Average age of JU rigs in years (including units under construction) as at July
Figure 24: JU rigs, composition of >350ft water depth as at July
0.10.1
1.52.8
4.24.35
8.210.4
12.813.514.1
17.418.5
23.327
0 10 20 30
PerisaiCoastal Contracts
UMWOGSeadrill
PV DrillingAtwoodVantage
TransoceanMaersk
VietSovPetroCOSL
Japan DrillingRowan
Aban of fshoreNobleEnsco
29%
40%
43%
44%
47%
60%
70%
75%
100%
100%
100%
100%
100%
100%
100%
100%
0% 50% 100%
Noble
VietSovPetro
Ensco
COSL
Aban Offshore
Japan Drilling
Rowan
PV Drilling
Maersk
Vantage
Seadrill
Transocean
UMWOG
Perisai
Coastal Contracts
Atwood
Source: Riglogix, IHS Petrodata
Note: Dark blue columns indicate rig players with significant South-East Asia exposure
Source: Riglogix, IHS Petrodata
Note: Dark blue columns indicate rig players with significant South-East Asia exposure
Figure 25: Peer comparison of JU rigs (including units under construction) as at July
Figure 26: Utilisation of JU rigs in South-East Asia
4
15
30
2
3
4
5
5
7
5
16
16
29
34
46
49
0 20 40 60
Coastal Contracts
Perisai
PV Drilling
Vantage
Japan Drilling
VietSovPetro
UMWOG
Atwood
Transocean
Maersk
Aban Offshore
Seadrill
Rowan
COSL
Ensco
Noble
87.5%
0
10
20
30
40
50
60
70
80
30.0%
40.0%
50.0%
60.0%
70.0%
80.0%
90.0%
100.0%
110.0%
Ap
r-9
6
Ma
r-9
7
Fe
b-9
8
Ja
n-9
9
De
c-9
9
No
v-0
0
Oc
t-0
1
Se
p-0
2
Au
g-0
3
Ju
l-0
4
Ju
n-0
5
Ma
y-0
6
Ap
r-0
7
Ma
r-0
8
Fe
b-0
9
Ja
n-1
0
De
c-1
0
No
v-1
1
Oc
t-1
2
Se
p-1
3
Au
g-1
4
Utilization (LHS) Contracted Rigs (RHS)
Total Rigs (RHS)
Source: Riglogix, IHS Petrodata
Note: Dark blue column indicate rig players with significant SE Asia exposure
Dark grey indicate units under construction
Source: Riglogix
Note: Riglogix defines utilisation as contracted rigs over total rigs
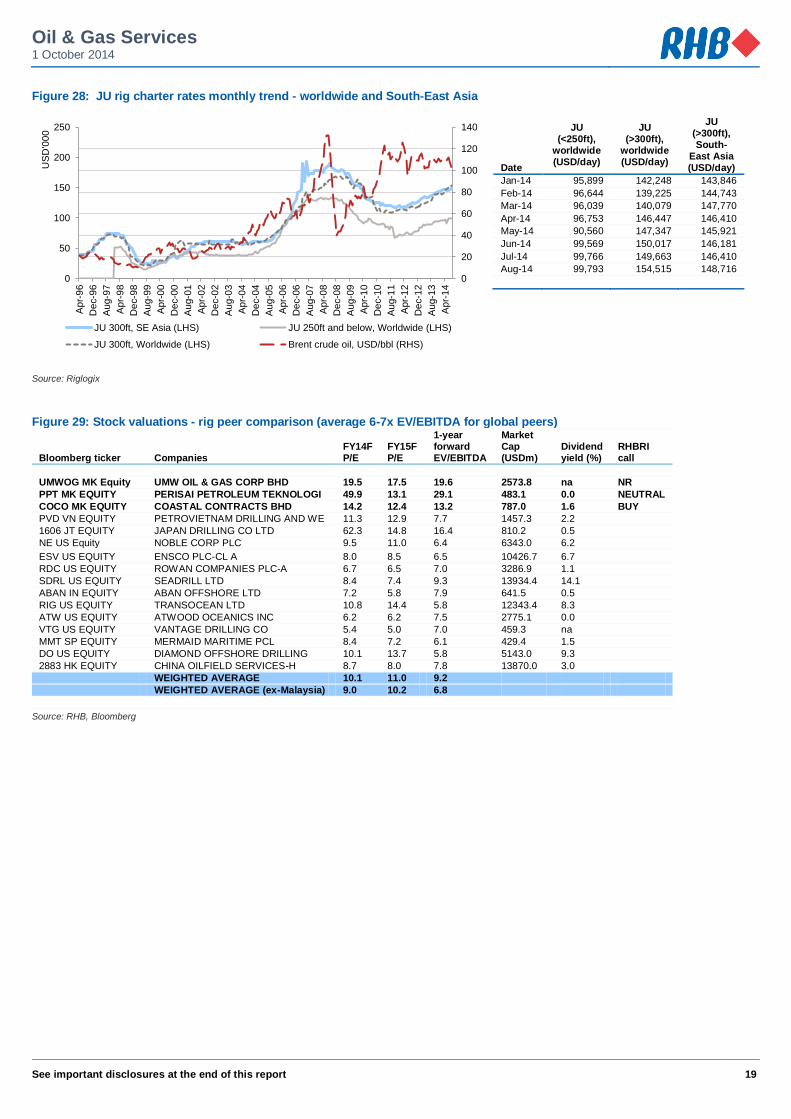
JU rig utilisation high in South-East Asia. Based on Riglogix data, South-East Asia’s JU rig average monthly utilisation rate improved by 690bps to 87.9% in Jan-Aug CY14 (Jan-Aug CY13: 81%). The region’s JU rig utilisation remains the highest globally, followed closely by Mexico at 81% and the Persian Gulf at 80%. We believe the high demand for JU rigs in this region helped increase the average JU rig rate to USD149,000/day vs USD144,000/day in January. By comparison, global monthly utilisation rate charted a 140bps decline to 76.2% (Jan-Aug CY13: 77.6%), with global contracted rigs increasing 3.6% YTD to 403 JU rigs. We view that these factors support the demand for JU rigs as the preferred exploration option for the predominantly shallow-water sector in South-East Asia.
Average monthly utilisation rate of JU rigs in South-East Asia was 87.9% in Jan-Aug CY14 (Jan-Aug CY13: 81.0%)
Global average monthly utilisation of JU rigs was 76.2% (Jan-Aug CY13: 77.6%)
South-East Asia’s JU rig utilisation is superior to that of other high-growth JU rig markets like Mexico and the Middle East

Oil & Gas Services 1 October 2014
See important disclosures at the end of this report 18
Figure 27: South-East Asia, Mexico and the Middle East see better JU rig monthly utilisation rates vs the global rate Global South-East Asia Mexico Middle East, Persian Gulf
Date Contracted rigs
Total rigs Utilisation Contracted rigs
Total rigs
Utilisation Contracted rigs
Total rigs
Utilisation Contracted rigs
Total rigs
Utilisation
Jan-14 403 522 77.2% 65 74 87.8% 43 53 81.1% 100 125 80.0%
Feb-14 399 526 75.9% 58 70 82.9% 46 56 82.1% 100 127 78.7%
Mar-14 410 522 78.5% 64 72 88.9% 48 56 85.7% 103 124 83.1%
Apr-14 408 528 77.3% 63 68 92.6% 47 58 81.0% 101 125 80.8%
May-14 397 531 74.8% 61 69 88.4% 47 58 81.0% 101 128 78.9%
Jun-14 399 534 74.7% 62 71 87.3% 46 58 79.3% 101 129 78.3%
Jul-14 405 534 75.8% 63 72 87.5% 47 58 81.0% 101 127 79.53%
Aug-14 403 536 75.2% 63 72 87.5% 43 57 75.4% 101 128 78.91%
Average 403 529 76.2% 62 71 87.9% 46 57 80.8% 101 127 79.8%
Jan-13 376 492 76.4% 54 70 77.1% 36 43 83.7% 93 116 80.2%
Feb-13 381 495 77.0% 55 71 77.5% 35 43 81.4% 92 118 78.0%
Mar-13 380 494 76.9% 56 70 80.0% 34 43 79.1% 91 118 77.1%
Apr-13 390 499 78.2% 58 73 79.5% 36 44 81.8% 93 119 78.2%
May-13 393 502 78.3% 61 74 82.4% 32 46 69.6% 98 119 82.4%
Jun-13 393 505 77.8% 62 75 82.7% 32 45 71.1% 96 120 80.0%
Jul-14 397 506 78.5% 62 75 82.7% 35 46 76.1% 99 122 81.1%
Aug-14 392 506 77.5% 64 75 85.3% 34 47 72.3% 97 123 78.9%
Average 388 500 77.6% 59 73 81.0% 34 45 76.8% 95 119 79.5%
Source: Riglogix
Note: Riglogix defines utilisation as contracted rigs over total rigs. The data excludes ready-stacked rigs that can be deployed quickly
Uptrend in day rates to halt? Despite the positive demand-supply situation and utilisation, we believe day rates are stabilising at current levels. This is in comparison with the gradual rise in day rates from end-2011 levels among JU rigs for both >300 ft and <250 ft water depths. Day rates for premium JU rigs, ie >300 ft water depth, in South-East Asia have largely been in line or are at slight discount with global day rates. Currently, the region’s day rates are averaging USD149,000 vs USD154,000 globally.
Projects at the exploration phase are most at risk of being shed off or delayed in the event that oil price expectations deteriorate to uneconomical levels. Based on historical data, we note a positive – albeit lagged – correlation of JU rig day rates with the movement of crude oil prices, whereby higher day rates traced after higher oil prices. In 2010-2011, the utilisation of rigs globally fell to a low of 61% following a cut in global E&P spending in 2009. This adversely affected day rates then.
In a recent comment, Seadrill (SDRL NO, NR) executives predicted that JU rig day rates would hover around USD160,000, down from the peak of USD225,000. This suggests that it is a mere rationalisation, as rates are still buoyed by the positive fundamentals of JU rig demand against the sharp fall in ultra-deepwater rigs rates to USD375,000-500,000 (one year ago: USD650,000). However, we believe Seadrill’s cautious outlook and comments on a potential drop in JU day rates should not to be taken lightly, as the company has an industry reputation for being a sector optimist.
Day rates for both competitive and low-end rigs are expected to stabilise at current levels. We see an end to the day rates uptrend that started from end-2011
Oil & Gas Services 1 October 2014
See important disclosures at the end of this report 19
Figure 28: JU rig charter rates monthly trend - worldwide and South-East Asia
0
20
40
60
80
100
120
140
0
50
100
150
200
250
Apr-
96
De
c-9
6
Aug-9
7
Apr-
98
De
c-9
8
Aug-9
9
Apr-
00
De
c-0
0
Aug-0
1
Apr-
02
De
c-0
2
Aug-0
3
Apr-
04
De
c-0
4
Aug-0
5
Apr-
06
De
c-0
6
Aug-0
7
Apr-
08
De
c-0
8
Aug-0
9
Apr-
10
De
c-1
0
Aug-1
1
Apr-
12
De
c-1
2
Aug-1
3
Apr-
14
US
D'0
00
JU 300ft, SE Asia (LHS) JU 250ft and below, Worldwide (LHS)
JU 300ft, Worldwide (LHS) Brent crude oil, USD/bbl (RHS)
Source: Riglogix
Figure 29: Stock valuations - rig peer comparison (average 6-7x EV/EBITDA for global peers)
Bloomberg ticker Companies FY14F P/E
FY15F P/E
1-year forward EV/EBITDA
Market Cap (USDm)
Dividend yield (%)
RHBRI call
UMWOG MK Equity UMW OIL & GAS CORP BHD 19.5 17.5 19.6 2573.8 na NR
PPT MK EQUITY PERISAI PETROLEUM TEKNOLOGI 49.9 13.1 29.1 483.1 0.0 NEUTRAL
COCO MK EQUITY COASTAL CONTRACTS BHD 14.2 12.4 13.2 787.0 1.6 BUY
PVD VN EQUITY PETROVIETNAM DRILLING AND WE 11.3 12.9 7.7 1457.3 2.2
1606 JT EQUITY JAPAN DRILLING CO LTD 62.3 14.8 16.4 810.2 0.5
NE US Equity NOBLE CORP PLC 9.5 11.0 6.4 6343.0 6.2
ESV US EQUITY ENSCO PLC-CL A 8.0 8.5 6.5 10426.7 6.7
RDC US EQUITY ROWAN COMPANIES PLC-A 6.7 6.5 7.0 3286.9 1.1
SDRL US EQUITY SEADRILL LTD 8.4 7.4 9.3 13934.4 14.1
ABAN IN EQUITY ABAN OFFSHORE LTD 7.2 5.8 7.9 641.5 0.5
RIG US EQUITY TRANSOCEAN LTD 10.8 14.4 5.8 12343.4 8.3
ATW US EQUITY ATWOOD OCEANICS INC 6.2 6.2 7.5 2775.1 0.0
VTG US EQUITY VANTAGE DRILLING CO 5.4 5.0 7.0 459.3 na
MMT SP EQUITY MERMAID MARITIME PCL 8.4 7.2 6.1 429.4 1.5
DO US EQUITY DIAMOND OFFSHORE DRILLING 10.1 13.7 5.8 5143.0 9.3
2883 HK EQUITY CHINA OILFIELD SERVICES-H 8.7 8.0 7.8 13870.0 3.0
WEIGHTED AVERAGE 10.1 11.0 9.2
WEIGHTED AVERAGE (ex-Malaysia) 9.0 10.2 6.8
Source: RHB, Bloomberg
Date
JU (<250ft),
worldwide (USD/day)
JU (>300ft),
worldwide (USD/day)
JU (>300ft), South-
East Asia (USD/day)
Jan-14 95,899 142,248 143,846
Feb-14 96,644 139,225 144,743
Mar-14 96,039 140,079 147,770
Apr-14 96,753 146,447 146,410
May-14 90,560 147,347 145,921
Jun-14 99,569 150,017 146,181
Jul-14 99,766 149,663 146,410
Aug-14 99,793 154,515 148,716

Oil & Gas Services 1 October 2014
See important disclosures at the end of this report 20
OSVs And Shipbuilding (Downgrade To NEUTRAL) The myth of charter rates?
We are NEUTRAL on the local OSV subsector. While market prospects remain bullish for future contracts, we believe valuations offer limited upside. In fact, Malaysian market valuations at 13-15x P/E are above regional peers (<10x) despite positive sector fundamentals. We opine this on Malaysian-flagged OSVs having a cabotage advantage in terms of contract tenures and charter rates. Therefore, they gain a captive clientele base from long-term Petronas-related projects. We believe that regional expansion is the way forward and foresee local OSV players being increasingly dependent on overseas OSV contracts, which are mainly spot charters. Based on this case scenario, we believe that local OSV stocks may move towards global valuations, as the players may no longer be reliant on the “local premium” and will increasingly face competition from renowned global OSV brands.
Maintain our view on selectiveness. While the aforementioned fundamentals of the industry remain on a bullish note, we continue to advise investors to exercise selectiveness. We prefer OSV owners and operators with a young fleet, high quality vessel mix and a sound management strategy for fleet rejuvenation.
Age. The average age for a fleet to be deemed young is around five years. A young fleet provides better utilisation and the ability to command favourable daily charter rates (DCRs). They have better specifications to support increasingly sophisticated charterer requirements. OSV players with a young fleet: Perdana Petroleum (PETR MK, BUY, FV: MYR2.20), Alam Maritim (AMRB MK, NEUTRAL, FV MYR1.35), and Jasa Merin SB – a subsidiary of SILK Holdings (SILK MK, NR).
Fleet mix and renewal plans. Fleet renewal plans are a key strategy to determine the OSV operators’ long-term growth. The equation has to make sense between disposing of aged vessels vs the type and capabilities of new vessels that the company intends to buy. While OSVs are not as capex-intensive as rigs and FPSOs, there is an increasing trend for players to purchase deepwater/bigger OSV assets that require higher capex and greater debt/equity funding. Again, we continue to favour players with sound strategies. One such operator is Perdana Petroleum, the first local player to order mega-sized accommodation work barges. The company has a clear strategy to capture more brownfield and deepwater opportunities. Another, Icon Offshore (ICON MK, NR), will soon add as many as seven vessels (a mixture of accommodation work barges and large-tonnage AHTS) to complement its current fleet of vessels of lower specifications.
Long-term charters to protect from DCR downturn. While we concur with industry players that OSV rates are supported by fundamental demand, we are of the view that charter rates are a neutral to downside risk in the longer run. This is because supply is building up in the crowded lower specification vessel space. In this case, we prefer players that have a high proportion of long-term charters. Perdana Petroleum ranks highly with 88% of its 17-vessel fleet on long-term charters while Icon Offshore has more than 90% of its MYR700m orderbook on long-term contracts. Among the worst is Alam Maritim, which has merely 70% of its 42-vessel fleet on long-term charters.
Our Top Pick is Perdana Petroleum. Our valuations are supported by 63% 2-year forward earnings CAGR and Perdana Petroleum’s status as a pure OSV player. The company is set to be a regional brownfield charterer as it aims to secure contracts outside Malaysia, ie in Vietnam, Thailand and Myanmar. We also like its young fleet (average age of 4.5 years), its long-term charters, synergistic partnership with its shareholder and high quality vessel mix.
Top Pick for shipbuilders is Coastal Contracts. We prefer Coastal Contracts, given that shipbuilders are near-term beneficiaries to the global OSV demand. Its customers can order OSVs that can cater for both shallow-water and deepwater jobs worldwide. Other known OSV shipbuilders are Muhibbah, TAS Offshore (TOB MK, BUY, FV: MYR1.60), Nam Cheong (NCL SP, BUY, TP: SGD0.58) and Sealink International (Sealink) (SELI MK, NR).
We exercise selectiveness and favour OSV operators with: i) a sound long-term strategy to rejuvenate their fleet size, ii) high proportion of long-term charters, and iii) a young fleet. These factors will support high utilisation rates

Oil & Gas Services 1 October 2014
See important disclosures at the end of this report 21
Are charter rates coming down? Based on our channel checks, all industry players said that charter rates are still holding steadily across the board. This includes both large- and small-tonnage AHTS units, platform supply vessel (PSV), accommodation work barges (AWB) and fast crew boats. We believe Petronas’ comments on rationalising costs and wanting to see “lower rates” was to potentially prevent speculative building of OSVs and to prevent over-lucrative margins done through third parties. The industry sees OSV demand as still high, mainly driven by more offshore assets to support E&P activities across the value chain. We understand that the industry is highly anticipating more OSV tenders towards end-2014, which may include deepwater jobs. Recent industry consolidation suggests that new entrants are still coming into the market, while some players are solidifying their fleet by enhancing fleet size and specifications. All these signs point towards increasing supply and, hence, justifies our NEUTRAL view on the subsector.
Figure 30: South-East Asia AHTS average term day rates Figure 31: AHTS/rig ratio
Source: RS Platou Source: Pareto Securities
Figure 32: Fleet size comparison as at Dec 2013 Figure 33: Utilisation rates comparison as at Dec 2013
9
15
16
16
19
22
28
31
38
43
61
62
110
1 10 100 1,000
Perisai
CHO
Perdana Petroleum
Gulf Marine
Jasa Merin
Miclyn
Jaya
Icon
Alam Maritim
Ezra
Bumi Armada
Pacif ic Radiance
POSH
90.0%
87.0%
84.4%
84.0%
81.0%
80.0%
80.0%
78.5%
70.0%
0 1 1
Ezra
CHO
Icon
Miclyn
Bumi Armada
Perdana Petroleum
Jaya
Alam Maritim
Jasa Merin
Source: Companies data, Infield report Source: Companies data, Infield report
Figure 34: Stock valuations - OSV comparisons (average 9x P/E and 10x EV/EBITDA for global peers)
Bloomberg ticker Companies FY14F P/E
FY15F P/E
1-year forward EV/EBITDA
Market Cap (USDm)
Dividend yield (%)
RHBRI call
AMRB MK EQUITY ALAM MARITIM RESOURCES 16.7 14.2 10.7 820 na NEUTRAL
BAB MK EQUITY BUMI ARMADA 12.4 11.9 12.8 3440 0.0 BUY
PETR MK EQUITY PERDANA PETROLEUM 15.0 13.1 9.6 428 1.6 BUY
DAYA MK EQUITY DAYA MATERIALS 15.7 8.2 11.1 132 2.2 NEUTRAL
COCO MK EQUITY COASTAL CONTRACTS 14.2 12.4 13.3 820 0.5 BUY
MUHI MK EQUITY MUHIBBAH ENGINEERING (M) 15.2 10.3 7.2 421 6.2 NEUTRAL
POSH SP EQUITY PACC OFFSHORE SERVICES HOLDI 13.9 7.3 14.6 1214.2 6.7
PACRA SP EQUITY PACIFIC RADIANCE LTD 10.1 8.9 11.8 819.4 1.1
EZRA SP EQUITY EZRA HOLDINGS LTD 19.2 10.6 13.9 788.3 14.1
CHO SP EQUITY CH OFFSHORE LTD na na na 267.1 0.5
LEAD IJ EQUITY LOGINDO SAMUDRAMAKMUR TBK PT 11.7 9.3 9.3 263.9 8.3
WINS IJ EQUITY WINTERMAR OFFSHORE MARINE 14.1 12.5 8.5 453.2 0.0
GMS LN EQUITY GULF MARINE SERVICES PLC 10.8 8.2 9.6 896.6 na
MIO AU EQUITY MICLYN EXPRESS OFFSHORE na na na na 1.5
WEIGHTED AVERAGE 14.7 11.3 12.0
WEIGHTED AVERAGE (ex-Malaysia) 12.6 8.5 9.9
Source: RHB estimates, Bloomberg
Industry players expect charter rates to hold steady. More OSV tenders are coming up towards end-2014 to 2015. However, supply is increasing, especially amongst the small-specification segment
Note:
Dark blue- pure play
Light blue-non pure play
Note:
Dark blue-
pure play
Light
blue- non
pure play

Oil & Gas Services 1 October 2014
See important disclosures at the end of this report 22
Services And Fabrication Space (Maintain NEUTRAL) EPC the next stage?
NEUTRAL on this sub-segment. We are NEUTRAL on this sub-segment vis-à-vis a year ago, as we believe the market for the service players has priced in the long-term orderbook coming from the mega umbrella contracts. Most of the key service contractors reported lower margins at the initial phase of such projects. This was due to slower work orders. It also included the depreciation, operating and interest costs that have been booked into their P&Ls for the additional assets and vessels in preparation for such jobs. We expect these jobs to come into full swing by end-2014, which should help normalise profit margins. Nevertheless, any further growth for the service players will mainly have to encompass moving into a different value chain. This could entail uncertainties of further fund-raising and partnership risks. The umbrella contracts awarded out during 2012-2013 were:
MYR10bn worth of Pan Malaysia transportation and installation (T&I) contracts for a period of five years. Package A (MYR1.5bn) was awarded to Barakah Offshore Petroleum (Barakah) (BARAKAH MK, NR), Package B (MYR1.8bn) was awarded to Puncak Niaga (PNH MK, TRADING BUY, FV MYR4.01) via GOM Resources, and Packages C and D (MYR6.7bn) were awarded to SapuraKencana via TL Offshore SB.
MYR10bn worth of Pan Malaysia hook-up and commissioning (HUCC) contracts for five years. MYR4bn awarded to Dayang Enterprise, MYR2bn-2.5bn to Petra Energy and the remainder was in small portions to SapuraKencana, Barakah, Carimin Engineering Services SB and others (in the region of MYR1bn each).
MYR2bn-3bn worth of Pan Malaysia slickline contracts for seven years and three optional years, which was bagged by Deleum (DLUM MK, NR).
MYR2bn-3bn worth of inspection, repair and maintenance contracts, of which MYR1bn was awarded to SapuraKencana and Alam Maritim. These contracts require the expertise of a diving support vessel.
After the mega-size service contracts, what’s next?
We believe the next step for the service players would be to move up the value chain and take on EPCC contracts that would be the next key re-rating catalyst for the services segment. We see MYR2bn-3bn in EPCC contracts on offer in the domestic scene alone. We believe the service players could be teaming up with major top-end contractors like Technip, Ranhill WorleyParsons SB, RNZ Integrated (M) SB and MMC Oil & Gas Engineering SB, given that these larger players have the necessary front-end design and engineering expertise. For example, MMHE recently teamed with Technip for the Malikai tension leg platform construction and fabrication job. Furthermore, we believe that, if the services players are going into EPCC contracts, they could potentially spark a round of fund-raising to increase their technical expertise and increase their fabrication capacities. Having said that, we believe these services will still be largely dependent on local jobs vis-à-vis expanding overseas, as a result of the favourable environment created by Petronas. Unlike the more capital-intensive subsectors highlighted earlier, we do not see pure Malaysian O&G service players’ valuations moving towards global peers’ numbers.
Dayang Enterprise remains our Top Pick for this subsector. This is on its significant market share in the HUCC market in Malaysia, solid track record and close relationship with the oil majors. We are positive on Dayang Enterprise’s recent private placement exercise, as we believe the proceeds will be used to acquire a larger stake in associate Perdana Petroleum and enhance its existing synergies.
Figure 35: List of players involved in TSM Figure 36: List of licensed Petronas fabricators
TSM players Listed? RHB call
Dayang Enterprise Yes BUY, FV MYR4.80
Petra Energy Yes NEUTRAL, FV 3.02
SapuraKencana Petroleum Yes BUY, FV MYR5.33
Carimin Petroleum No na
Coral Alliance SB No na
Tanjung Offshore Yes NR
Uzma Yes NR
Shapadu Energy & Engineering No na
Licensed major fabricators Listed? Yard capacity (tonnes/year)
SapuraKencana Yes 125,000
MMHE Yes 130,000
Muhibbah Engineering Yes 25,000
KKB Engineering Yes 115,000
TH Heavy Yes 10,000
Boustead Heavy Industries Yes 9,000
Brooke Dockyard & Engineering No 8,500
Source: Vital Factor Consulting SB Source: Vital Factor Consulting SB
We are NEUTRAL on this sub-segment. While 2012-2015 will be the period where revenue streams expanded significantly for the incumbents, the need for O&G services players to move up into a different value chain could entail uncertainties of further fund-raising and partnership risks
Oil & Gas Services 1 October 2014
See important disclosures at the end of this report 23
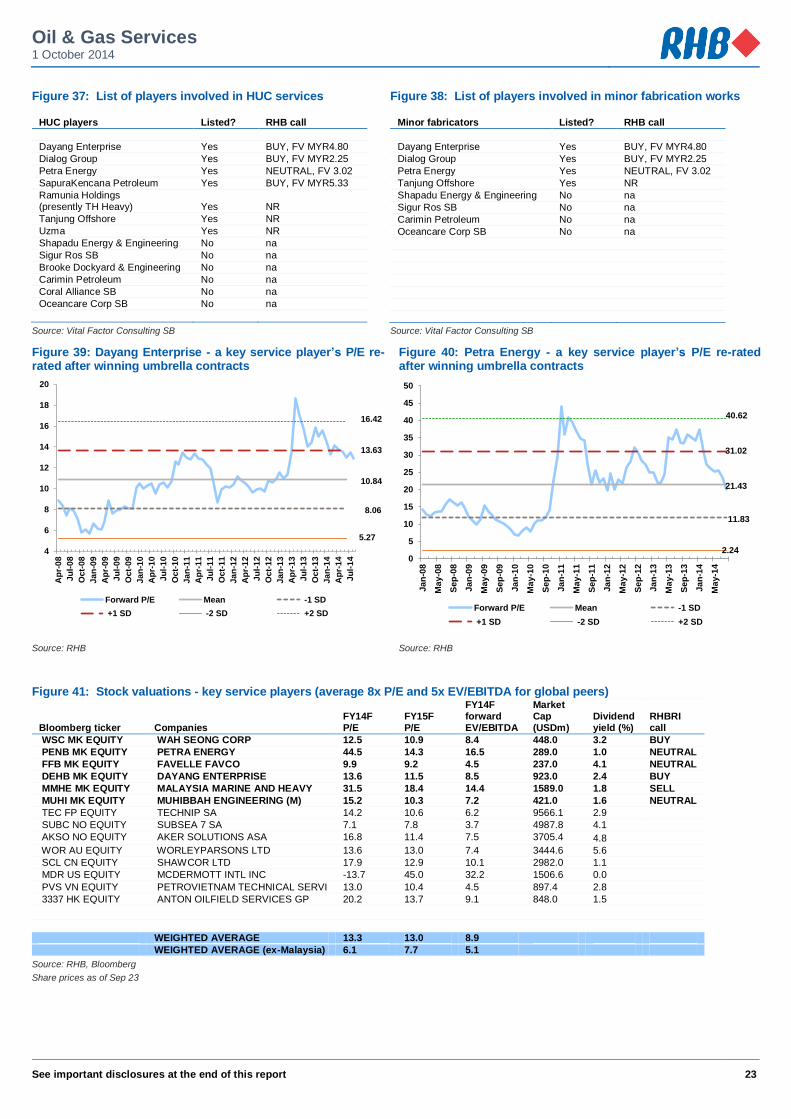
Figure 37: List of players involved in HUC services Figure 38: List of players involved in minor fabrication works
HUC players Listed? RHB call
Dayang Enterprise Yes BUY, FV MYR4.80
Dialog Group Yes BUY, FV MYR2.25
Petra Energy Yes NEUTRAL, FV 3.02
SapuraKencana Petroleum Yes BUY, FV MYR5.33
Ramunia Holdings (presently TH Heavy) Yes NR
Tanjung Offshore Yes NR
Uzma Yes NR
Shapadu Energy & Engineering No na
Sigur Ros SB No na
Brooke Dockyard & Engineering No na
Carimin Petroleum No na
Coral Alliance SB No na
Oceancare Corp SB No na
Minor fabricators Listed? RHB call
Dayang Enterprise Yes BUY, FV MYR4.80
Dialog Group Yes BUY, FV MYR2.25
Petra Energy Yes NEUTRAL, FV 3.02
Tanjung Offshore Yes NR
Shapadu Energy & Engineering No na
Sigur Ros SB No na
Carimin Petroleum No na
Oceancare Corp SB No na
Source: Vital Factor Consulting SB Source: Vital Factor Consulting SB
Figure 39: Dayang Enterprise - a key service player’s P/E re-rated after winning umbrella contracts
Figure 40: Petra Energy - a key service player’s P/E re-rated after winning umbrella contracts
10.84
8.06
13.63
5.27
16.42
4
6
8
10
12
14
16
18
20
Ap
r-0
8
Ju
l-0
8
Oc
t-0
8
Ja
n-0
9
Ap
r-0
9
Ju
l-0
9
Oc
t-0
9
Ja
n-1
0
Ap
r-1
0
Ju
l-1
0
Oc
t-1
0
Ja
n-1
1
Ap
r-1
1
Ju
l-1
1
Oct-
11
Ja
n-1
2
Ap
r-1
2
Ju
l-1
2
Oc
t-1
2
Ja
n-1
3
Ap
r-1
3
Ju
l-1
3
Oc
t-1
3
Ja
n-1
4
Ap
r-1
4
Ju
l-1
4
Forward P/E Mean -1 SD
+1 SD -2 SD +2 SD
21.43
11.83
31.02
2.24
40.62
0
5
10
15
20
25
30
35
40
45
50
Ja
n-0
8
Ma
y-0
8
Se
p-0
8
Ja
n-0
9
Ma
y-0
9
Sep
-09
Ja
n-1
0
Ma
y-1
0
Se
p-1
0
Ja
n-1
1
Ma
y-1
1
Se
p-1
1
Ja
n-1
2
Ma
y-1
2
Se
p-1
2
Ja
n-1
3
Ma
y-1
3
Se
p-1
3
Ja
n-1
4
Ma
y-1
4
Forward P/E Mean -1 SD
+1 SD -2 SD +2 SD
Source: RHB Source: RHB
Figure 41: Stock valuations - key service players (average 8x P/E and 5x EV/EBITDA for global peers)
Bloomberg ticker Companies FY14F P/E
FY15F P/E
FY14F forward EV/EBITDA
Market Cap (USDm)
Dividend yield (%)
RHBRI call
WSC MK EQUITY WAH SEONG CORP 12.5 10.9 8.4 448.0 3.2 BUY
PENB MK EQUITY PETRA ENERGY 44.5 14.3 16.5 289.0 1.0 NEUTRAL
FFB MK EQUITY FAVELLE FAVCO 9.9 9.2 4.5 237.0 4.1 NEUTRAL
DEHB MK EQUITY DAYANG ENTERPRISE 13.6 11.5 8.5 923.0 2.4 BUY
MMHE MK EQUITY MALAYSIA MARINE AND HEAVY 31.5 18.4 14.4 1589.0 1.8 SELL
MUHI MK EQUITY MUHIBBAH ENGINEERING (M) 15.2 10.3 7.2 421.0 1.6 NEUTRAL
TEC FP EQUITY TECHNIP SA 14.2 10.6 6.2 9566.1 2.9
SUBC NO EQUITY SUBSEA 7 SA 7.1 7.8 3.7 4987.8 4.1
AKSO NO EQUITY AKER SOLUTIONS ASA 16.8 11.4 7.5 3705.4 4.8
WOR AU EQUITY WORLEYPARSONS LTD 13.6 13.0 7.4 3444.6 5.6
SCL CN EQUITY SHAWCOR LTD 17.9 12.9 10.1 2982.0 1.1
MDR US EQUITY MCDERMOTT INTL INC -13.7 45.0 32.2 1506.6 0.0
PVS VN EQUITY PETROVIETNAM TECHNICAL SERVI 13.0 10.4 4.5 897.4 2.8
3337 HK EQUITY ANTON OILFIELD SERVICES GP 20.2 13.7 9.1 848.0 1.5
WEIGHTED AVERAGE 13.3 13.0 8.9
WEIGHTED AVERAGE (ex-Malaysia) 6.1 7.7 5.1
Source: RHB, Bloomberg
Share prices as of Sep 23

Oil & Gas Services 1 October 2014
See important disclosures at the end of this report 24
Downstream (Maintain NEUTRAL) Spotlight on RAPID and tank terminals
Oil storage
NEUTRAL on downstream. We still believe that the excitement is less pronounced for downstream players in the near term, as any major re-rating catalysts will only take place 3-5 years on the back of the completion of the RAPID project due in early 2019. We are also long-term NEUTRAL on the storage industry. This is because we remain concerned over the long-term feasibility of the Straits Hub terminal. Current and planned storage capacities in South-East Asia are sufficient to cater for the rise in demand due to the increased capacity from China, India and Middle East. We believe these factors could affect the long-term demand for oil storage by traders and oil companies in terms of storage rates and utilisation.
Storage industry – more developments? A key development for the storage industry could include plans from Platts to streamline its free-on-board (FOB) refined oil products benchmark pricing, to include the regional Straits Hubs terminals (Singapore, Indonesia and Malaysia). Storage costs are approximately SGD5-6/cu m/month in Singapore for term leases compared to Malaysia where it is around SGD3-5/cu m/month. Platts is currently studying several options to address the disparity in pricing. One way would be to combine the current “FOB Singapore” and “FOB Malaysia” pricing to a single “FOB Straits” from 1 July 2015. This could possibly bridge the pricing gap of SGD1-2/cu m/month, which will be positive for Johor’s tank terminals. We view the impact to be NEUTRAL at this juncture, as it is too early to reasonably conclude if this will bring positive upside to storage rates that Dialog is currently charging to its customers.
Dialog. We believe Dialog is the key beneficiary of the growth in storage tanks, as one-third of its revenue will be coming from its Pengerang and Kemaman storage terminals. 4QFY14 saw maiden contributions from Phase 1A of the Pengerang tank terminals (first oil shipment on 12 April). Phase 1B has completed construction and is now being commissioned for start-up while Phase 1C is on schedule for mechanical completion by end-2014. These indicate that the construction schedule progresses as planned. We prefer oil storage players vs petrochemicals given the: i) shorter development period for new storage terminals (1-2 years vs 3-5 years for petrochemical refineries), ii) rising demand for oil storage in South-East Asia, and iii) consolidation of assets between independent operators and national oil companies.
Muhibbah. In the near term, we believe that it stands a good chance of benefiting from the initial phase of RAPID. Note that Muhibbah was awarded the contract for the construction, fabrication and installation of the Lemongrass Project, an aroma chemicals complex by BASF Petronas Chemicals SB in Kuantan, Pahang. We believe Muhibbah will be able to secure a similar contract award for RAPID, considering its good track record with Petronas.
Petronas Dagangan (PETD MK, NR). The company is the key downstream retailer and marketing arm of Petronas. Petronas Dagangan is a major proxy to the consumer sentiment for petroleum product usage in Malaysia with its commanding ~40% combined market share. It has a market leadership position in the commercial segment (68.2%) and liquefied petroleum gas (LPG) (57.2%) while its market share in retail (>30%, close to 1,000 stations) and lubricants (24%) are also commendable. Due to its stable cash flow generation, its valuations are less correlated to the O&G counters, which have cyclical, upstream exposure.
We prefer players with exposure to storage terminals, given the shorter development period and the strong oil storage demand regionally

Oil & Gas Services 1 October 2014
See important disclosures at the end of this report 25
Petrochemicals
Petrochemicals outlook remains mixed. In the near term, ethylene-based product prices might be on an upward trend. This is because major ethylene producers in Taiwan, South Korea and Japan will be undergoing major plant turnarounds. However, prices for methane-based products, ie urea, ammonia and methanol, are expected to soften in the near- to mid-term, given that Chinese urea producers are set to flood the market during the low tax window that lasts until the end of October. However, prices could recover, as the planting season in the northern hemisphere picks up pace in early- to mid-2015. We are currently UNDERWEIGHT on the downstream petrochemicals segment, with a SELL call on Petronas Chemicals (PCHEM MK, FV: MYR6.11) on headwinds going forward. We expect the development of RAPID to be on track, given the recent slew of infrastructure contract awards. Petronas Chemicals is the petrochemical arm of Petronas. It produces a wide range of chemical products under its two main segments, ie olefins and derivatives. These are used to produce ethylene-based products, as well as fertiliser and methanol. These, in turn, are used to manufacture urea, ammonia and methanol-based products.
Figure 42: Refinery capacity additions (2012-2016) Figure 43: Refined product demand increase (2012-2020)
Source: Platts ABLS Conference July 2014, World Oil Outlook, OPEC Source: Platts ABLS Conference July 2014, World Oil Outlook, OPEC
Figure 44: As storage capacity expands at oil storage hubs in Fujairah, Singapore and South Korea, will storage rates decline?
Figure 45: With expectations of declining storage rates, are storage contract periods also declining from the current three years to one year?
Source: Platts ABLS Conference July 2014 Source: Platts ABLS Conference July 2014

26
RHB Guide to Investment Ratings Buy: Share price may exceed 10% over the next 12 months
Trading Buy: Share price may exceed 15% over the next 3 months, however longer-term outlook remains uncertain Neutral: Share price may fall within the range of +/- 10% over the next 12 months Take Profit: Target price has been attained. Look to accumulate at lower levels
Sell: Share price may fall by more than 10% over the next 12 months Not Rated: Stock is not within regular research coverage
Disclosure & Disclaimer
All research is based on material compiled from data considered to be reliable at the time of writing, but RHB does not make any representation or warranty, express or implied, as to its accuracy, completeness or correctness. No part of this report is to be construed as an offer or solicitation of an offer to transact any securities or financial instruments whether referred to herein or otherwise. This report is general in nature and has been prepared for
information purposes only. It is intended for circulation to the clients of RHB and its related companies. Any recommendation contained in this report does not have regard to the specific investment objectives, financial situation and the particular needs of any specific addressee. This report is for the information of addressees only and is not to be taken in substitution for the exercise of judgment by addressees, who should obtain separate legal or
financial advice to independently evaluate the particular investments and strategies. This report may further consist of, whether in whole or in part, summaries, research, compilations, extracts or analysis that has been prepared by RHB’s
strategic, joint venture and/or business partners. No representation or warranty (express or implied) is given as to the accuracy or completeness of such information and accordingly investors should make their own informed decisions before relying on the same.
RHB, its affiliates and related companies, their respective directors, associates, connected parties and/or employees may own or have positions in securities of the company(ies) covered in this research report or any securities related thereto, and may from time to time add to, or dispose off, or may be materially interested in any such securities. Further, RHB, its affiliates and related companies do and seek to do business with the company(ies) covered
in this research report and may from time to time act as market maker or have assumed an underwriting commitment in securities of such company(ies), may sell them or buy them from customers on a principal basis and may also perform or seek to perform significant investment banking, advisory or underwriting services for or relating to such company(ies), as well as solicit such investment, advisory or other services fr om any entity mentioned in this
research report. RHB and its employees and/or agents do not accept any liability, be it directly, indirectly or consequential losses, loss of profits or damages that may arise
from any reliance based on this report or further communication given in relation to this report, including where such losses , loss of profits or damages are alleged to have arisen due to the contents of such report or communication being perceived as defamatory in nature.
The term “RHB” shall denote where applicable, the relevant entity distributing the report in the particular jurisdiction ment ioned specifically herein below and shall refer to RHB Research Institute Sdn Bhd, its holding company, affiliates, subsidiaries and related companies.
All Rights Reserved. This report is for the use of intended recipients only and may not be reproduced, distributed or published for any purpose without prior consent of RHB and RHB accepts no liability whatsoever for the actions of third parties in this respect.
Malaysia This report is published and distributed in Malaysia by RHB Research Institute Sdn Bhd (233327-M), Level 11, Tower One, RHB Centre, Jalan Tun Razak,
50400 Kuala Lumpur, a wholly-owned subsidiary of RHB Investment Bank Berhad (RHBIB), which in turn is a wholly-owned subsidiary of RHB Capital Berhad.
Singapore This report is published and distributed in Singapore by DMG & Partners Research Pte Ltd (Reg. No. 200808705N), a wholly-owned subsidiary of DMG &
Partners Securities Pte Ltd, a joint venture between Deutsche Asia Pacific Holdings Pte Ltd (a subsidiary of Deutsche Bank Group) and OSK Investment Bank Berhad, Malaysia which have since merged into RHB Investment Bank Berhad (the merged entity is referred to as “RHBIB”, which in turn is a wholly-owned subsidiary of RHB Capital Berhad). DMG & Partners Securities Pte Ltd is a Member of the Singapore Exchange Securities Trading Limited. DMG &
Partners Securities Pte Ltd may have received compensation from the company covered in this report for its corporate finance or its dealing activities; this report is therefore classified as a non-independent report.
As of 23 September 2014, DMG & Partners Securities Pte Ltd and its subsidiaries, including DMG & Partners Research Pte Ltd do not have proprietary positions in the securities covered in this report, except for: a) -
As of 23 September 2014, none of the analysts who covered the securities in this report has an interest in such securities, except for: a) -
Special Distribution by RHB
Where the research report is produced by an RHB entity (excluding DMG & Partners Research Pte Ltd) and distributed in Singapore, it is only distributed to "Institutional Investors", "Expert Investors" or "Accredited Investors" as defined in the Securities and Futures Act, CAP. 289 of Singapore. If you are not an "Institutional Investor", "Expert Investor" or "Accredited Investor", this research report is not intended for you and you should disregard this research
report in its entirety. In respect of any matters arising from, or in connection with this research report, you are to contac t our Singapore Office, DMG & Partners Securities Pte Ltd
Hong Kong
This report is published and distributed in Hong Kong by RHB OSK Securities Hong Kong Limited (“RHBSHK”) (formerly known as OSK Securities Hong Kong Limited), a subsidiary of OSK Investment Bank Berhad, Malaysia which have since merged into RHB Investment Bank Berhad (the merged entity is referred to as “RHBIB”), which in turn is a wholly-owned subsidiary of RHB Capital Berhad.

27
RHBSHK, RHBIB and/or other affiliates may beneficially own a total of 1% or more of any class of common equity securities of the subject company. RHBSHK, RHBIB and/or other affiliates may, within the past 12 months, have received compensation and/or within the next 3 months seek to obtain compensation for investment banking services from the subject company.
Risk Disclosure Statements
The prices of securities fluctuate, sometimes dramatically. The price of a security may move up or down, and may become valueless. It is as likely that losses will be incurred rather than profit made as a result of buying and selling securities. Past performance is not a guide to future performance. RHBSHK does not maintain a predetermined schedule for publication of research and will not necessarily update this report
Indonesia
This report is published and distributed in Indonesia by PT RHB OSK Securities Indonesia (formerly known as PT OSK Nusadana Securities Indonesia), a subsidiary of OSK Investment Bank Berhad, Malaysia, which have since merged into RHB Investment Bank Berhad, which in turn is a wholly-owned
subsidiary of RHB Capital Berhad. Thailand
This report is published and distributed in Thailand by RHB OSK Securities (Thailand) PCL (formerly known as OSK Securities (Thailand) PCL), a subsidiary of OSK Investment Bank Berhad, Malaysia, which have since merged into RHB Investment Bank Berhad, which in turn is a wholly-owned
subsidiary of RHB Capital Berhad. Other Jurisdictions
In any other jurisdictions, this report is intended to be distributed to qualified, accredited and professional investors, in compliance with the law and regulations of the jurisdictions.
DMG & Partners Research Guide to Investment Ratings
Buy: Share price may exceed 10% over the next 12 months Trading Buy: Share price may exceed 15% over the next 3 months, however longer-term outlook remains uncertain
Neutral: Share price may fall within the range of +/- 10% over the next 12 months Take Profit: Target price has been attained. Look to accumulate at lower levels Sell: Share price may fall by more than 10% over the next 12 months
Not Rated: Stock is not within regular research coverage DISCLAIMERS
This research is issued by DMG & Partners Research Pte Ltd and it is for general distribution only. It does not have any regard to the specific investment objectives, financial situation and particular needs of any specific recipient of this research report. You should independently evaluate particular
investments and consult an independent financial adviser before making any investments or entering into any transaction in relation to any securities or investment instruments mentioned in this report.
The information contained herein has been obtained from sources we believed to be reliable but we do not make any representat ion or warranty nor accept any responsibility or liability as to its accuracy, completeness or correctness. Opinions and views expressed in this report are subject to change without notice.
This report does not constitute or form part of any offer or solicitation of any offer to buy or sell any securities.
DMG & Partners Research Pte Ltd is a wholly-owned subsidiary of DMG & Partners Securities Pte Ltd, a joint venture between OSK Investment Bank Berhad, Malaysia which have since merged into RHB Investment Bank Berhad (the merged entity is referred to as “RHBIB” which in turn is a wholly-owned subsidiary of RHB Capital Berhad) and Deutsche Asia Pacific Holdings Pte Ltd (a subsidiary of Deutsche Bank Group). DMG & Partners Securities
Pte Ltd is a Member of the Singapore Exchange Securities Trading Limited. DMG & Partners Securities Pte Ltd and their associates, directors, and/or employees may have positions in, and may effect transactions in the s ecurities
covered in the report, and may also perform or seek to perform broking and other corporate finance related services for t he corporations whose securities are covered in the report. This report is therefore classified as a non-independent report.
As of 23 September 2014, DMG & Partners Securities Pte Ltd and its subsidiaries, including DMG & Partners Research Pte Ltd, do not have proprietary positions in the subject companies, except for: a) -
As of 23 September 2014, none of the analysts who covered the stock in this report has an interest in the subject companies covered in this report, except for:
a) - DMG & Partners Research Pte. Ltd. (Reg. No. 200808705N)
Kuala Lumpur Hong Kong Singapore
Malaysia Research Office
RHB Research Institute Sdn Bhd
Level 11, Tower One, RHB Centre Jalan Tun Razak
Kuala Lumpur Malaysia
Tel : +(60) 3 9280 2185 Fax : +(60) 3 9284 8693
RHB OSK Securities Hong Kong Ltd. (formerly known
as OSK Securities
Hong Kong Ltd.) 12
th Floor
World-Wide House 19 Des Voeux Road Central, Hong Kong
Tel : +(852) 2525 1118 Fax : +(852) 2810 0908
DMG & Partners
Securities Pte. Ltd.
10 Collyer Quay #09-08 Ocean Financial Centre
Singapore 049315 Tel : +(65) 6533 1818 Fax : +(65) 6532 6211
Jakarta Shanghai Phnom Penh
PT RHB OSK Securities Indonesia (formerly known as
PT OSK Nusadana Securities Indonesia)
Plaza CIMB Niaga 14th Floor
Jl. Jend. Sudirman Kav.25 Jakarta Selatan 12920, Indonesia
Tel : +(6221) 2598 6888 Fax : +(6221) 2598 6777
RHB OSK (China) Investment Advisory Co. Ltd.
(formerly known as OSK (China) Investment Advisory Co. Ltd.)
Suite 4005, CITIC Square 1168 Nanjing West Road
Shanghai 20041 China
Tel : +(8621) 6288 9611 Fax : +(8621) 6288 9633
RHB OSK Indochina Securities Limited (formerly
known as OSK Indochina Securities Limited) No. 1-3, Street 271
Sangkat Toeuk Thla, Khan Sen Sok Phnom Penh
Cambodia Tel: +(855) 23 969 161 Fax: +(855) 23 969 171
Bangkok
RHB OSK Securities (Thailand) PCL (formerly known
as OSK Securities (Thailand) PCL) 10th Floor, Sathorn Square Office Tower
98, North Sathorn Road, Silom Bangrak, Bangkok 10500
Thailand Tel: +(66) 2 862 9999 Fax : +(66) 2 108 0999