nef measuring well-being handbook final
TRANSCRIPT
8/12/2019 NEF Measuring Well-being Handbook FINAL
http://slidepdf.com/reader/full/nef-measuring-well-being-handbook-final 1/33
Measuring Well-being
A guide for practitioners

8/12/2019 NEF Measuring Well-being Handbook FINAL
http://slidepdf.com/reader/full/nef-measuring-well-being-handbook-final 2/33
Measuring Well-being 2
Contents
About th is handbook ................................................................................ 4
Measuring well-being at BIG – A Case Study ......................................... 5
1. Understanding Well-Being ................................................................... 6
What is ‘well-being’ and what is meant by the ‘potential drivers of well-being’? .................................................................................................... 6
Why is a well-being approach important? ................................................ 8
2. Measuring Well-Being .......................................................................... 9
2.1. The Principles .................................................................................... 9
What are the basic principles of measuring well-being? .......................... 9
What can you do with information on people’s well-being? ..................... 9
2.2. How can you measure well-being? ................................................ 10
Using questionnaires to gather information on well-being ..................... 10
Overview of our three recommended sets of well-being questions ........ 10
The Centre for Well-being at nef ’s recommended well-being measures 11
About the measures .............................................................................. 12
Why we’ve selected these questions .................................................... 12
Additional information ........................................................................... 13
2.3. How can you administer well-being questions? ........................... 14
How to administer well-being questionnaires ........................................ 14
Things to consider when deciding how to administer well-beingquestionnaires ...................................................................................... 15
2.4. Things to consider when designing your well-being questionnaire................................................................................................................. 15
Question order ...................................................................................... 15
Informed consent .................................................................................. 15
Sample (the group of people answering a questionnaire) ..................... 16 Additional information ........................................................................... 16
Anonymity and confidentiality ................................................................ 16
Language issues ................................................................................... 17
Timing of data collection ....................................................................... 17
Who will do the measuring .................................................................... 17
Cost ...................................................................................................... 17
Sensitive topics ..................................................................................... 17
Response bias ...................................................................................... 17 Analysis ................................................................................................ 17
8/12/2019 NEF Measuring Well-being Handbook FINAL
http://slidepdf.com/reader/full/nef-measuring-well-being-handbook-final 3/33

8/12/2019 NEF Measuring Well-being Handbook FINAL
http://slidepdf.com/reader/full/nef-measuring-well-being-handbook-final 4/33
Measuring Well-being 4
About this handbook
This short handbook on measuring well-being is produced by the Centre forWell-being at nef (the new economics foundation) with input from nef consulting. It is designed primarily for voluntary organisations andcommunity groups delivering projects and services, to help them kick-startthe process of measuring well-being outcomes.
By measuring the well-being of the people we aim to support, informationcan be gathered which can be used, for example, to improve the designand delivery of projects and services, to target projects and services at thepeople who are in most need, to tailor provision to suit needs, and tosupport funding applications.
This handbook provides:
Tools for thinking about well-being and its measurement. These willhelp to ensure that when you measure people’s well-being, you do sofrom an informed position. Part I of this handbook is UnderstandingWell-being.
Part II describes our recommended practical tools for measuring well-being: this will help you to get measuring!
An earlier version of this handbook was originally created as part of aproject commissioned by NHS Lambeth and funded through its Well-beingand Happiness Programme, for projects and service providers in theLondon Borough of Lambeth. We have re-written the handbook so that itreflects updates in our thinking about well-being and its measurement, andwe gratefully acknowledge the role that NHS Lambeth played in thecreation of the original version.
nef consulting have added Part III, which provides guidance on analysisand interpretation, building on their experience of working with dozens oforganisations to undertake impact evaluation projects. This document isavailable alongside a range of other resources which can help measuresocial impact through the SROI Centre for Excellence, which can beaccessed at www.nef-consulting.co.uk/sroicfx.
Based on our experience of working with Big Lottery Fund, nef is confidentthat using a standardised approach to measuring well-being is a good useof time for organisations in a range of settings – Big Lottery Fund haveprovided a Case Study on the following page.
8/12/2019 NEF Measuring Well-being Handbook FINAL
http://slidepdf.com/reader/full/nef-measuring-well-being-handbook-final 5/33
Measuring Well-being 5
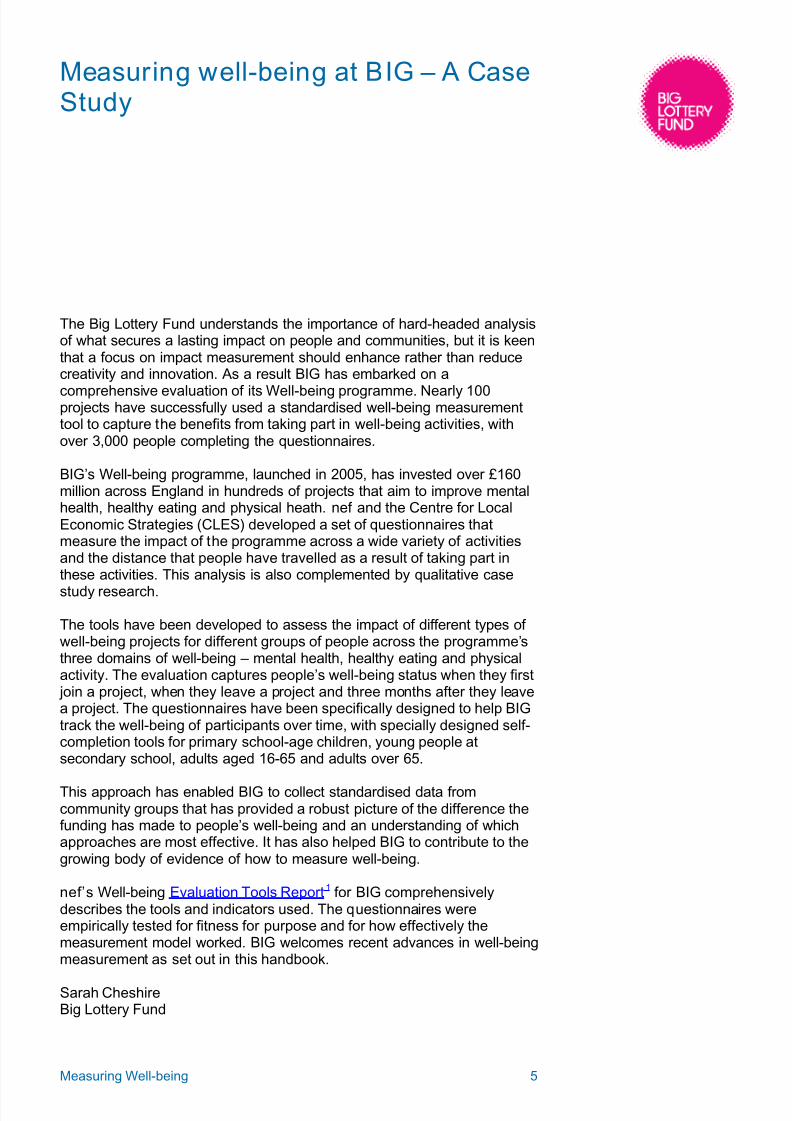
Measuring well-being at BIG – A CaseStudy
The Big Lottery Fund understands the importance of hard-headed analysisof what secures a lasting impact on people and communities, but it is keenthat a focus on impact measurement should enhance rather than reducecreativity and innovation. As a result BIG has embarked on a
comprehensive evaluation of its Well-being programme. Nearly 100projects have successfully used a standardised well-being measurementtool to capture the benefits from taking part in well-being activities, withover 3,000 people completing the questionnaires.
BIG’s Well-being programme, launched in 2005, has invested over £160million across England in hundreds of projects that aim to improve mentalhealth, healthy eating and physical heath. nef and the Centre for LocalEconomic Strategies (CLES) developed a set of questionnaires thatmeasure the impact of the programme across a wide variety of activitiesand the distance that people have travelled as a result of taking part inthese activities. This analysis is also complemented by qualitative case
study research.
The tools have been developed to assess the impact of different types ofwell-being projects for different groups of people across the programme’sthree domains of well-being – mental health, healthy eating and physicalactivity. The evaluation captures people’s well-being status when they first join a project, when they leave a project and three months after they leavea project. The questionnaires have been specifically designed to help BIGtrack the well-being of participants over time, with specially designed self-completion tools for primary school-age children, young people atsecondary school, adults aged 16-65 and adults over 65.
This approach has enabled BIG to collect standardised data fromcommunity groups that has provided a robust picture of the difference thefunding has made to people’s well-being and an understanding of whichapproaches are most effective. It has also helped BIG to contribute to thegrowing body of evidence of how to measure well-being.
nef’s Well-being Evaluation Tools Report1 for BIG comprehensivelydescribes the tools and indicators used. The questionnaires wereempirically tested for fitness for purpose and for how effectively themeasurement model worked. BIG welcomes recent advances in well-beingmeasurement as set out in this handbook.
Sarah CheshireBig Lottery Fund

8/12/2019 NEF Measuring Well-being Handbook FINAL
http://slidepdf.com/reader/full/nef-measuring-well-being-handbook-final 6/33
Measuring Well-being 6
1. Understanding Well-being
By the end of this section you should:
Understand what ‘well-being’ means and understand what is meant bythe ‘potential drivers of well-being’
Be familiar with nef ’s dynamic model of well-being
Understand why a well-being approach is important
What is ‘well-being’ and what is meant by the ‘potential drivers ofwell-being’?
Well-being can be understood as how people feel and how they function ,both on a personal and a social level, and how they evaluate their lives asa whole. To break this down, how people feel refers to emotions such ashappiness or anxiety. How people function refers to things such as theirsense of competence or their sense of being connected to those aroundthem. How people evaluate their life as a whole is captured in theirsatisfaction with their lives, or how they rate their lives in comparison with
the best possible life.
You can think of someone as having high well-being if they function well,have positive feelings day-to-day and overall and think their lives are goingwell; we call this ‘flourishing’. Similarly, you can think of someone as havinglow well-being if they do not function well and have negative feelings day-to-day and overall.
It is worth pointing out that well-being is not exactly the same as happiness.Happiness often refers to how people are feeling moment-to-moment anddoes not always tell us about how they evaluate their lives as a whole (although it can do), or about how they function in the world. Well-being is
a much broader concept than moment-to-moment happiness: it includeshappiness but also other things such as how satisfied people are with theirlives as a whole, and things such as autonomy (having a sense of controlover your life), purpose (having a sense of purpose in life).
Whilst well-being covers more than happy feelings, recent researchsuggests that positive feelings like happiness can actually lead to betterwell-being overall. This is because positive feelings broaden people’spotential responses to challenging situations and build their personalresources and capabilities.2 We should think of feeling happy not only as agoal in itself, but also as a way of increasing people’s potential for doingwell.
For the purpose of clarity, it is useful – and important – to separate thenotion of well-being from the things that help to drive, or influence it. ‘Well-

8/12/2019 NEF Measuring Well-being Handbook FINAL
http://slidepdf.com/reader/full/nef-measuring-well-being-handbook-final 7/33
Measuring Well-being 7
being’ refers to how people are in themselves – their emotions, judgementsand experiences. The ‘potential drivers of well-being’ refers on the onehand to external things such as income, housing, education and socialnetworks, and to certain ‘internal’ things such as health, optimism and self-esteem, all of which influence how people feel and function.3 These ideasare usefully captured in the dynamic model below.
nef’s dynamic model of well-being
In 2008 nef developed a model of well-being and its drivers (as part of theGovernment Office for Science’s Foresight Project on Mental Capital andWell-Being).4 The model describes how an individual’s external conditions(bottom left) – such as their income, employment status and socialnetworks – act together with their personal resources (bottom right) – suchas their health, resilience and optimism – to allow them to function well(middle) in their interactions with the world and therefore experiencepositive emotions (top). When people function well and experience positiveemotions day-to-day and overall, we can think of them as ‘flourishing’.
In the following sections we focus on how to measure the top two boxes –
how people feel, and their judgements about their lives (in the top box) andhow people function (in the central box).
Figure 1: nef’s dynamic model of well-being
‘Flourishing’
Good feelingsday-to-day and overall
e.g. happiness, joy,contentment,satisfaction
Good functioning andsatisfaction of needse.g. to be autonomous,
competent, safe andsecure, connected to
Personalresources
e.g. health, resilience,optimism, self-esteem,
Externalconditions
e.g. material conditions,income (levels and
stability), social context
8/12/2019 NEF Measuring Well-being Handbook FINAL
http://slidepdf.com/reader/full/nef-measuring-well-being-handbook-final 8/33
Measuring Well-being 8
Why is a well-being approach important?
A well-being approach is important because it enables us to do thefollowing:
Move beyond a narrow focus on what can go wrong in people’s lives, tolook also at what makes people’s lives go well.
Move beyond looking only at what people lack or need, and look at thepositive things people bring to situations and communities – theirassets. This in turn can help us think about the ways that people can beempowered to contribute to improvements in their own lives.
Move beyond just focusing on economic circumstances to include theimportant areas of people’s emotional and social needs.
When we understand what makes people’s lives go well, see the positivethings people bring to situations, and understand people’s emotional andsocial needs, projects and services can be better designed to respond tothe many aspects that make up people’s lives.
There is growing interest among political leaders, local statutory agenciesand others in measuring something that really matters – people’s well-being. This is reflected most clearly in the Coalition Government’s 2010commitment to measuring national well-being, which has led to the Officefor National Statistics’ (ONS) Measuring National Well-being programme.
“Well-being can be understood as how peoplefeel and how they function, both on apersonal and a social level, and how theyevaluate their lives as a whole.”

8/12/2019 NEF Measuring Well-being Handbook FINAL
http://slidepdf.com/reader/full/nef-measuring-well-being-handbook-final 9/33
Measuring Well-being 9
2. Measuring Well-Being
2.1. The Principles
By the end of this section you should:
Understand the basic principles of measuring well-being
Understand what you can do with data on well-being
What are the basic princ iples of measuring well-being?
Measuring well-being can be done in a number of ways – there is no ‘onesize fits all’ approach. In general, however, well-being measurement tendsto be based on:
Individuals. Individuals, rather than groups, are the ‘unit ofmeasurement’, even if we are ultimately interested in the well-being of a
particular group of people.Subjective indicators. Subjective, rather than objective, indicatorsprovide the data. ‘Subjective indicators’ refers to questions which askabout feelings, experiences and judgements about life.
What can you do wi th information on people’s well-being?
There are several related things that you can do with information onpeople’s well-being, such as:
Help evaluate the impact of your project or service on people’s lives
Develop a baseline of information against which you can measurechanges over time in people’s feelings and experiences, for exampleover the course of a particular intervention.
Find out which aspects of their lives people feel most dissatisfied with,for example in order to help tailor interventions.
Help raise awareness of the different components of well-being amonga particular population, for example in order to help facilitatecommunity-led action to increase well-being.
8/12/2019 NEF Measuring Well-being Handbook FINAL
http://slidepdf.com/reader/full/nef-measuring-well-being-handbook-final 10/33
Measuring Well-being 10
2.2. How can you measure well-being?
By the end of this section you should:
Understand why questionnaires are a good way of gatheringinformation on well-being
Be familiar with three sets of well-being questions and understand whyit is best to use all three, if possible
Understand why we have selected these questions
If necessary, be able to choose which set is most appropriate for yourpurposes and understand the different benefits of each set
Be familiar with a range of additional questions you may wish to askyour respondents.
Using questionnaires to gather information on well-being
Questionnaires are a good way of gathering information on people’s well-being: they provide information in the form of numbers (“quantitative data”)
and they offer the advantage that they can be repeated at different times toshow trends and patterns in results.
There are other ways of gathering information on well-being. These include:
research interviews
discussion groups and focus groups
community consultation events
research diaries (where people write down their feelings, behavioursand activities over a set timeframe)
Most of these methods provide information in the form of words (“qualitativedata”) and can be used alongside questionnaire data to help explorefindings in more detail. This handbook focuses on measuring well-beingusing questionnaires.
Overview of our three recommended sets of well-being questions
On the following pages you will find three sets of established questions thatwe recommend are used to measure well-being (followed by some short
background information on each); the Short Warwick- Edinburgh MentalWell-being Scale (SWEMWBS), the ONS subjective well-being questions and a question on social trust, which is known to be a key factor for well-being. If possible (i.e. if resources permit), we recommend that you use allthree measures, as this should enable you to do more with your data.
8/12/2019 NEF Measuring Well-being Handbook FINAL
http://slidepdf.com/reader/full/nef-measuring-well-being-handbook-final 11/33
Measuring Well-being 11
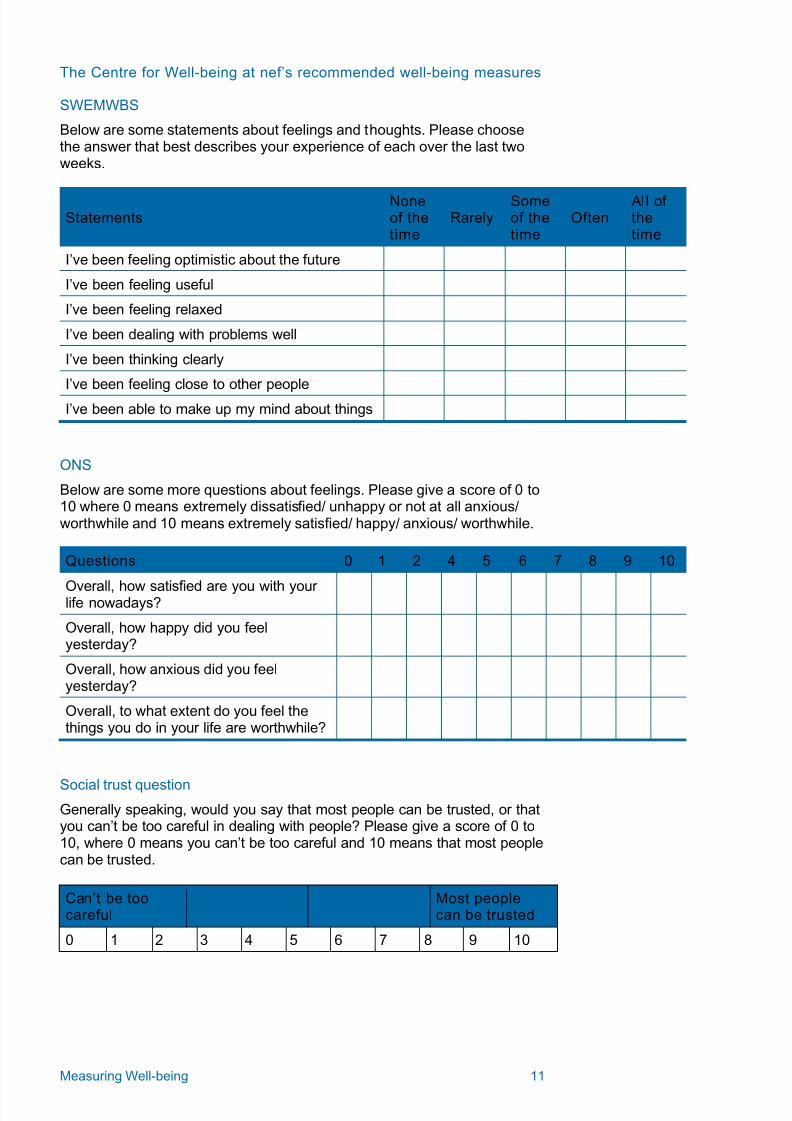
The Centre for Well-being at nef’s recommended well-being measures
SWEMWBS
Below are some statements about feelings and thoughts. Please choosethe answer that best describes your experience of each over the last twoweeks.
Statements Noneof thetime
Rarely Someof thetime
Often All ofthetime
I’ve been feeling optimistic about the future
I’ve been feeling useful
I’ve been feeling relaxed
I’ve been dealing with problems well
I’ve been thinking clearly
I’ve been feeling close to other people
I’ve been able to make up my mind about things
ONS
Below are some more questions about feelings. Please give a score of 0 to10 where 0 means extremely dissatisfied/ unhappy or not at all anxious/worthwhile and 10 means extremely satisfied/ happy/ anxious/ worthwhile.
Questions 0 1 2 4 5 6 7 8 9 10
Overall, how satisfied are you with yourlife nowadays?
Overall, how happy did you feelyesterday?
Overall, how anxious did you feelyesterday?
Overall, to what extent do you feel thethings you do in your life are worthwhile?
Social trust question
Generally speaking, would you say that most people can be trusted, or thatyou can’t be too careful in dealing with people? Please give a score of 0 to10, where 0 means you can’t be too careful and 10 means that most peoplecan be trusted.
Can’t be too careful
Most people can be trusted
0 1 2 3 4 5 6 7 8 9 10
8/12/2019 NEF Measuring Well-being Handbook FINAL
http://slidepdf.com/reader/full/nef-measuring-well-being-handbook-final 12/33
Measuring Well-being 12
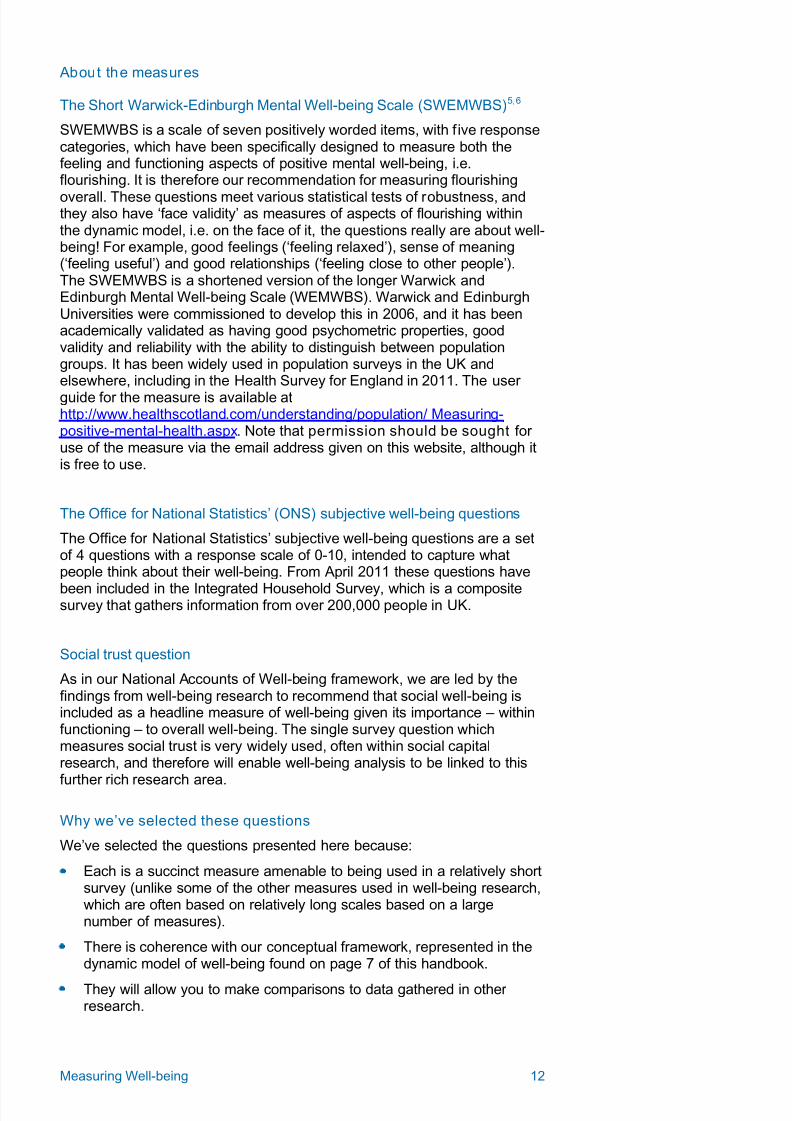
About the measures
The Short Warwick-Edinburgh Mental Well-being Scale (SWEMWBS)5,6
SWEMWBS is a scale of seven positively worded items, with five responsecategories, which have been specifically designed to measure both thefeeling and functioning aspects of positive mental well-being, i.e.flourishing. It is therefore our recommendation for measuring flourishing
overall. These questions meet various statistical tests of robustness, andthey also have ‘face validity’ as measures of aspects of flourishing withinthe dynamic model, i.e. on the face of it, the questions really are about well-being! For example, good feelings (‘feeling relaxed’), sense of meaning(‘feeling useful’) and good relationships (‘feeling close to other people’).The SWEMWBS is a shortened version of the longer Warwick andEdinburgh Mental Well-being Scale (WEMWBS). Warwick and EdinburghUniversities were commissioned to develop this in 2006, and it has beenacademically validated as having good psychometric properties, goodvalidity and reliability with the ability to distinguish between populationgroups. It has been widely used in population surveys in the UK andelsewhere, including in the Health Survey for England in 2011. The user
guide for the measure is available athttp://www.healthscotland.com/understanding/population/ Measuring-positive-mental-health.aspx. Note that permission should be sought foruse of the measure via the email address given on this website, although itis free to use.
The Office for National Statistics’ (ONS) subjective well-being questions
The Office for National Statistics’ subjective well-being questions are a setof 4 questions with a response scale of 0-10, intended to capture whatpeople think about their well-being. From April 2011 these questions have
been included in the Integrated Household Survey, which is a compositesurvey that gathers information from over 200,000 people in UK.
Social trust question
As in our National Accounts of Well-being framework, we are led by thefindings from well-being research to recommend that social well-being isincluded as a headline measure of well-being given its importance – withinfunctioning – to overall well-being. The single survey question whichmeasures social trust is very widely used, often within social capitalresearch, and therefore will enable well-being analysis to be linked to this
further rich research area.
Why we’ve selected these questions
We’ve selected the questions presented here because:
Each is a succinct measure amenable to being used in a relatively shortsurvey (unlike some of the other measures used in well-being research,which are often based on relatively long scales based on a largenumber of measures).
There is coherence with our conceptual framework, represented in thedynamic model of well-being found on page 7 of this handbook.
They will allow you to make comparisons to data gathered in otherresearch.
8/12/2019 NEF Measuring Well-being Handbook FINAL
http://slidepdf.com/reader/full/nef-measuring-well-being-handbook-final 13/33
Measuring Well-being 13
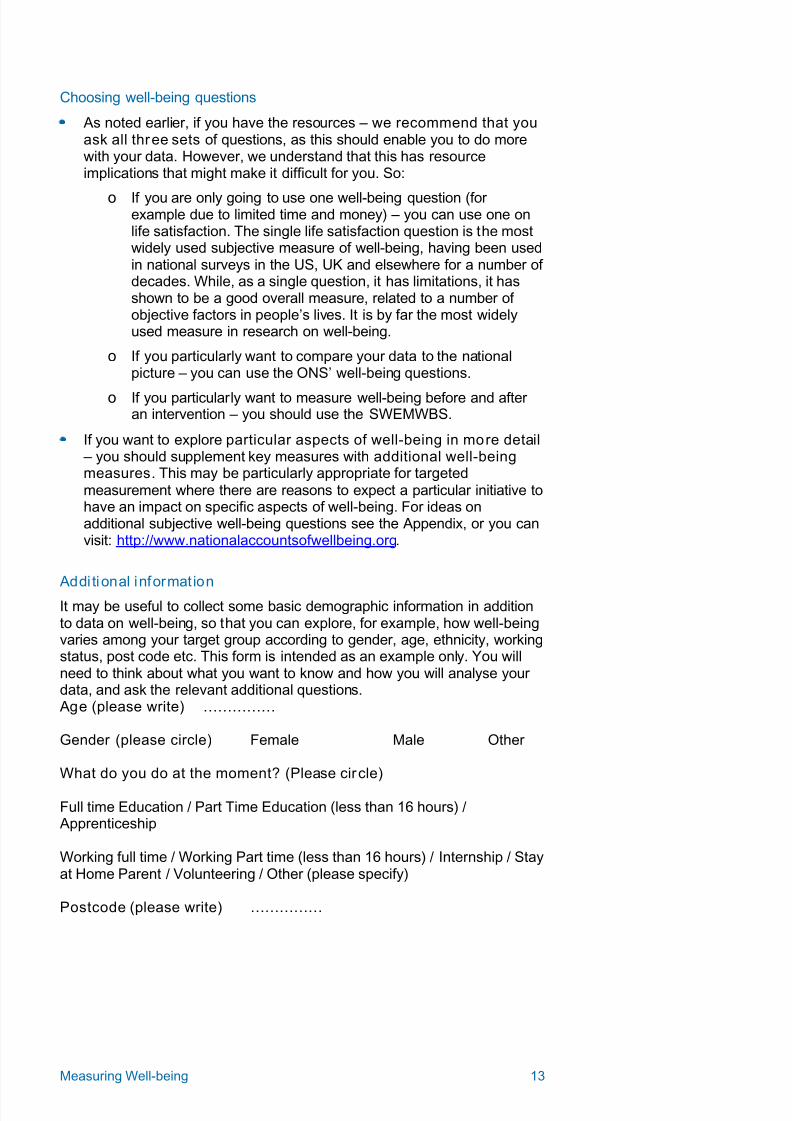
Choosing well-being questions
As noted earlier, if you have the resources – we recommend that youask all three sets of questions, as this should enable you to do morewith your data. However, we understand that this has resourceimplications that might make it difficult for you. So:
o If you are only going to use one well-being question (forexample due to limited time and money) – you can use one onlife satisfaction. The single life satisfaction question is the mostwidely used subjective measure of well-being, having been usedin national surveys in the US, UK and elsewhere for a number ofdecades. While, as a single question, it has limitations, it hasshown to be a good overall measure, related to a number ofobjective factors in people’s lives. It is by far the most widelyused measure in research on well-being.
o If you particularly want to compare your data to the nationalpicture – you can use the ONS’ well-being questions.
o If you particularly want to measure well-being before and afteran intervention – you should use the SWEMWBS.
If you want to explore particular aspects of well-being in more detail – you should supplement key measures with additional well-beingmeasures. This may be particularly appropriate for targetedmeasurement where there are reasons to expect a particular initiative tohave an impact on specific aspects of well-being. For ideas onadditional subjective well-being questions see the Appendix, or you canvisit: http://www.nationalaccountsofwellbeing.org.
Addi tional informationIt may be useful to collect some basic demographic information in additionto data on well-being, so that you can explore, for example, how well-beingvaries among your target group according to gender, age, ethnicity, workingstatus, post code etc. This form is intended as an example only. You willneed to think about what you want to know and how you will analyse yourdata, and ask the relevant additional questions. Age (please write) ……………
Gender (please circle) Female Male Other
What do you do at the moment? (Please circle)
Full time Education / Part Time Education (less than 16 hours) / Apprenticeship
Working full time / Working Part time (less than 16 hours) / Internship / Stayat Home Parent / Volunteering / Other (please specify)
Postcode (please write) ……………

8/12/2019 NEF Measuring Well-being Handbook FINAL
http://slidepdf.com/reader/full/nef-measuring-well-being-handbook-final 14/33
Measuring Well-being 14
Ethnicity (please circle)
A. White• English/Welsh/Scottish/NorthernIrish/British• Irish• Gypsy or Irish Traveller
• Any other White background, write in
B. Mixed / multiple ethnicgroups• White and Black Caribbean• White and Black African• White and Asian
• Any other Mixed / multipleethnic background, write in
C. Asian / Asian Briti sh• Indian• Pakistani• Bangladeshi• Chinese• Any other Asian background, write in
D. Black / African / Caribbean/ Black British• African• Caribbean• Any other Black / African /Caribbean background, write in
E. Other ethnic group• Arab• Any other ethnic group, write in__________
2.3. How can you administer well-being questions?
Administering a questionnaire means implementing it in practice –collecting responses from the people you’re interested in. By the end of thissection you should:
Understand the main ways to administer well-being questionnairesUnderstand some of the things to consider when deciding how toadminister a well-being questionnaire.
How to administer well-being questionnaires
Once you have decided which well-being questions to ask, you will need todecide how to administer your questionnaire. There are different ways ofdoing this:
Self-completion questionnaire
This is where the respondent fills in the questionnaire by themselves.This tends to be by either:
o pen and paper
o email
o on the web
Interview7
This is where an interviewer asks the respondent the questions. This tendsto be either:
in person (face-to-face)by telephone
8/12/2019 NEF Measuring Well-being Handbook FINAL
http://slidepdf.com/reader/full/nef-measuring-well-being-handbook-final 15/33
Measuring Well-being 15
Things to consider when deciding how to administer well-beingquestionnaires
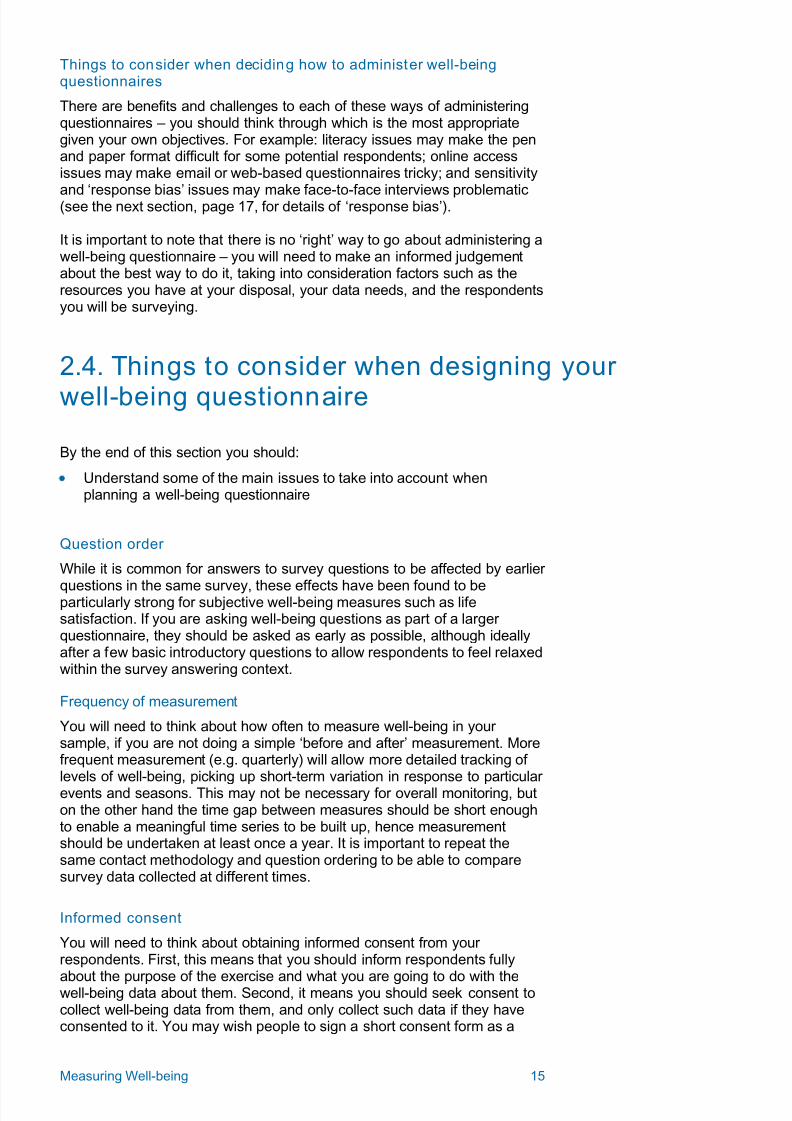
There are benefits and challenges to each of these ways of administeringquestionnaires – you should think through which is the most appropriategiven your own objectives. For example: literacy issues may make the penand paper format difficult for some potential respondents; online accessissues may make email or web-based questionnaires tricky; and sensitivity
and ‘response bias’ issues may make face-to-face interviews problematic(see the next section, page 17, for details of ‘response bias’).
It is important to note that there is no ‘right’ way to go about administering awell-being questionnaire – you will need to make an informed judgementabout the best way to do it, taking into consideration factors such as theresources you have at your disposal, your data needs, and the respondentsyou will be surveying.
2.4. Things to consider when designing your
well-being questionnaire
By the end of this section you should:
Understand some of the main issues to take into account whenplanning a well-being questionnaire
Question order
While it is common for answers to survey questions to be affected by earlier
questions in the same survey, these effects have been found to beparticularly strong for subjective well-being measures such as lifesatisfaction. If you are asking well-being questions as part of a largerquestionnaire, they should be asked as early as possible, although ideallyafter a few basic introductory questions to allow respondents to feel relaxedwithin the survey answering context.
Frequency of measurement
You will need to think about how often to measure well-being in yoursample, if you are not doing a simple ‘before and after’ measurement. Morefrequent measurement (e.g. quarterly) will allow more detailed tracking oflevels of well-being, picking up short-term variation in response to particularevents and seasons. This may not be necessary for overall monitoring, buton the other hand the time gap between measures should be short enoughto enable a meaningful time series to be built up, hence measurementshould be undertaken at least once a year. It is important to repeat thesame contact methodology and question ordering to be able to comparesurvey data collected at different times.
Informed consent
You will need to think about obtaining informed consent from yourrespondents. First, this means that you should inform respondents fully
about the purpose of the exercise and what you are going to do with thewell-being data about them. Second, it means you should seek consent tocollect well-being data from them, and only collect such data if they haveconsented to it. You may wish people to sign a short consent form as a
8/12/2019 NEF Measuring Well-being Handbook FINAL
http://slidepdf.com/reader/full/nef-measuring-well-being-handbook-final 16/33
Measuring Well-being 16
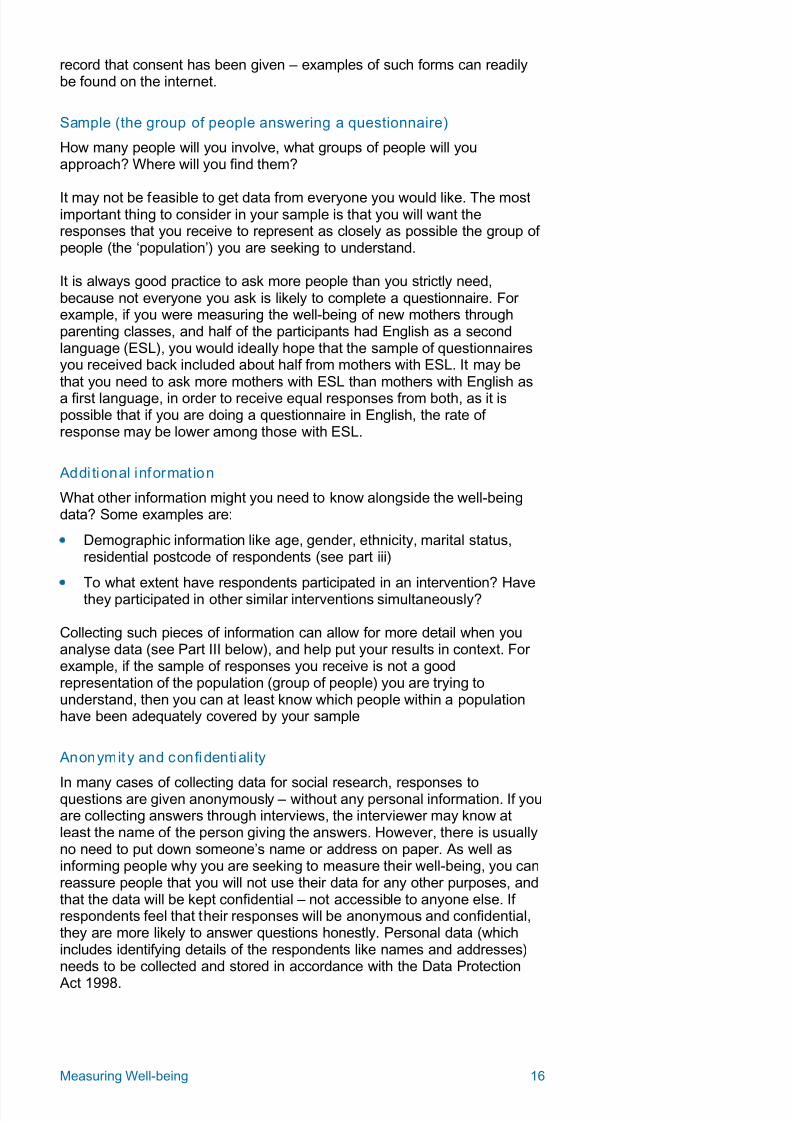
record that consent has been given – examples of such forms can readilybe found on the internet.
Sample (the group of people answering a questionnaire)
How many people will you involve, what groups of people will youapproach? Where will you find them?
It may not be feasible to get data from everyone you would like. The mostimportant thing to consider in your sample is that you will want theresponses that you receive to represent as closely as possible the group ofpeople (the ‘population’) you are seeking to understand.
It is always good practice to ask more people than you strictly need,because not everyone you ask is likely to complete a questionnaire. Forexample, if you were measuring the well-being of new mothers throughparenting classes, and half of the participants had English as a secondlanguage (ESL), you would ideally hope that the sample of questionnairesyou received back included about half from mothers with ESL. It may bethat you need to ask more mothers with ESL than mothers with English asa first language, in order to receive equal responses from both, as it ispossible that if you are doing a questionnaire in English, the rate ofresponse may be lower among those with ESL.
Addi tional information
What other information might you need to know alongside the well-beingdata? Some examples are:
Demographic information like age, gender, ethnicity, marital status,residential postcode of respondents (see part iii)
To what extent have respondents participated in an intervention? Havethey participated in other similar interventions simultaneously?
Collecting such pieces of information can allow for more detail when youanalyse data (see Part III below), and help put your results in context. Forexample, if the sample of responses you receive is not a goodrepresentation of the population (group of people) you are trying tounderstand, then you can at least know which people within a populationhave been adequately covered by your sample
Anonymity and confidentiali ty
In many cases of collecting data for social research, responses toquestions are given anonymously – without any personal information. If youare collecting answers through interviews, the interviewer may know atleast the name of the person giving the answers. However, there is usuallyno need to put down someone’s name or address on paper. As well asinforming people why you are seeking to measure their well-being, you canreassure people that you will not use their data for any other purposes, andthat the data will be kept confidential – not accessible to anyone else. Ifrespondents feel that their responses will be anonymous and confidential,they are more likely to answer questions honestly. Personal data (whichincludes identifying details of the respondents like names and addresses)needs to be collected and stored in accordance with the Data Protection
Act 1998.
8/12/2019 NEF Measuring Well-being Handbook FINAL
http://slidepdf.com/reader/full/nef-measuring-well-being-handbook-final 17/33
Measuring Well-being 17
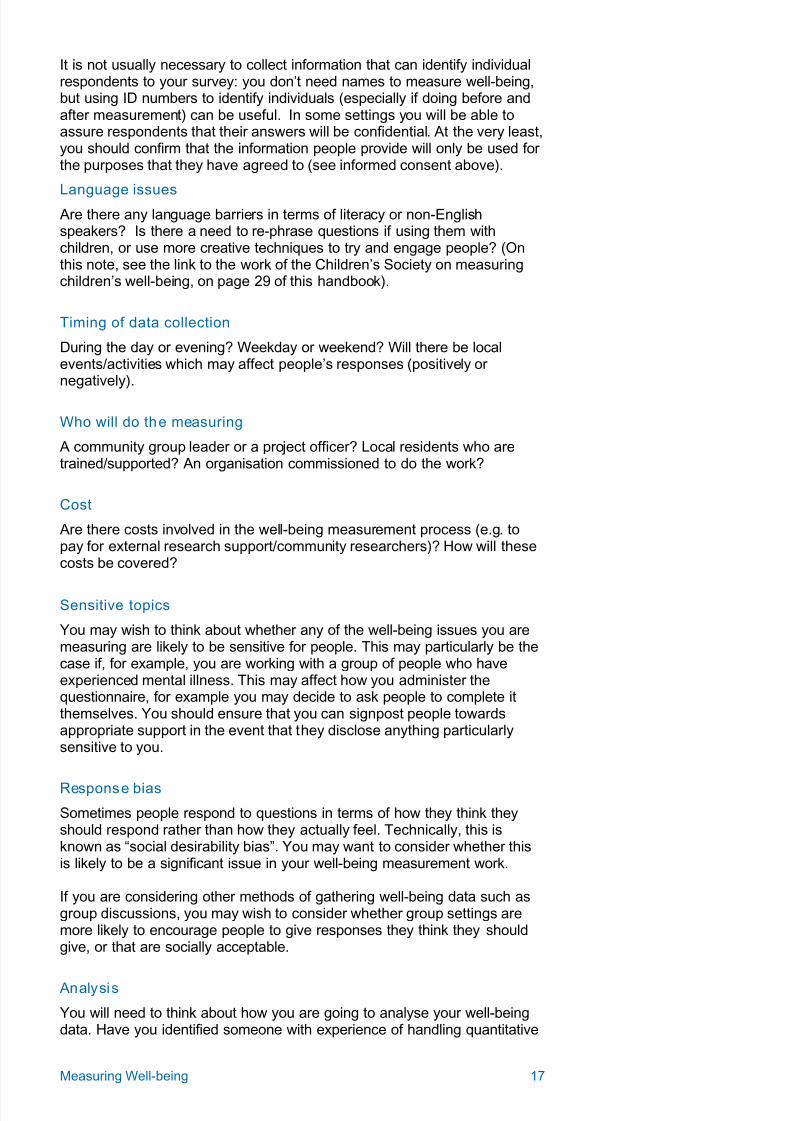
It is not usually necessary to collect information that can identify individualrespondents to your survey: you don’t need names to measure well-being,but using ID numbers to identify individuals (especially if doing before andafter measurement) can be useful. In some settings you will be able toassure respondents that their answers will be confidential. At the very least,you should confirm that the information people provide will only be used forthe purposes that they have agreed to (see informed consent above).
Language issues Are there any language barriers in terms of literacy or non-Englishspeakers? Is there a need to re-phrase questions if using them withchildren, or use more creative techniques to try and engage people? (Onthis note, see the link to the work of the Children’s Society on measuringchildren’s well-being, on page 29 of this handbook).
Timing of data collection
During the day or evening? Weekday or weekend? Will there be localevents/activities which may affect people’s responses (positively ornegatively).
Who will do the measuring
A community group leader or a project officer? Local residents who aretrained/supported? An organisation commissioned to do the work?
Cost
Are there costs involved in the well-being measurement process (e.g. topay for external research support/community researchers)? How will thesecosts be covered?
Sensitive topics
You may wish to think about whether any of the well-being issues you aremeasuring are likely to be sensitive for people. This may particularly be thecase if, for example, you are working with a group of people who haveexperienced mental illness. This may affect how you administer thequestionnaire, for example you may decide to ask people to complete itthemselves. You should ensure that you can signpost people towardsappropriate support in the event that they disclose anything particularlysensitive to you.
Response bias
Sometimes people respond to questions in terms of how they think theyshould respond rather than how they actually feel. Technically, this isknown as “social desirability bias”. You may want to consider whether thisis likely to be a significant issue in your well-being measurement work.
If you are considering other methods of gathering well-being data such asgroup discussions, you may wish to consider whether group settings aremore likely to encourage people to give responses they think they should give, or that are socially acceptable.
Analysis
You will need to think about how you are going to analyse your well-beingdata. Have you identified someone with experience of handling quantitative

8/12/2019 NEF Measuring Well-being Handbook FINAL
http://slidepdf.com/reader/full/nef-measuring-well-being-handbook-final 18/33
Measuring Well-being 18
data? What information do you want to know? Who will do the analysis, anddo they understand statistics? What analysis software is available? In thefollowing section we explore in more detail some of the issues aroundanalysis and interpretation.

8/12/2019 NEF Measuring Well-being Handbook FINAL
http://slidepdf.com/reader/full/nef-measuring-well-being-handbook-final 19/33
8/12/2019 NEF Measuring Well-being Handbook FINAL
http://slidepdf.com/reader/full/nef-measuring-well-being-handbook-final 20/33
Measuring Well-being 20
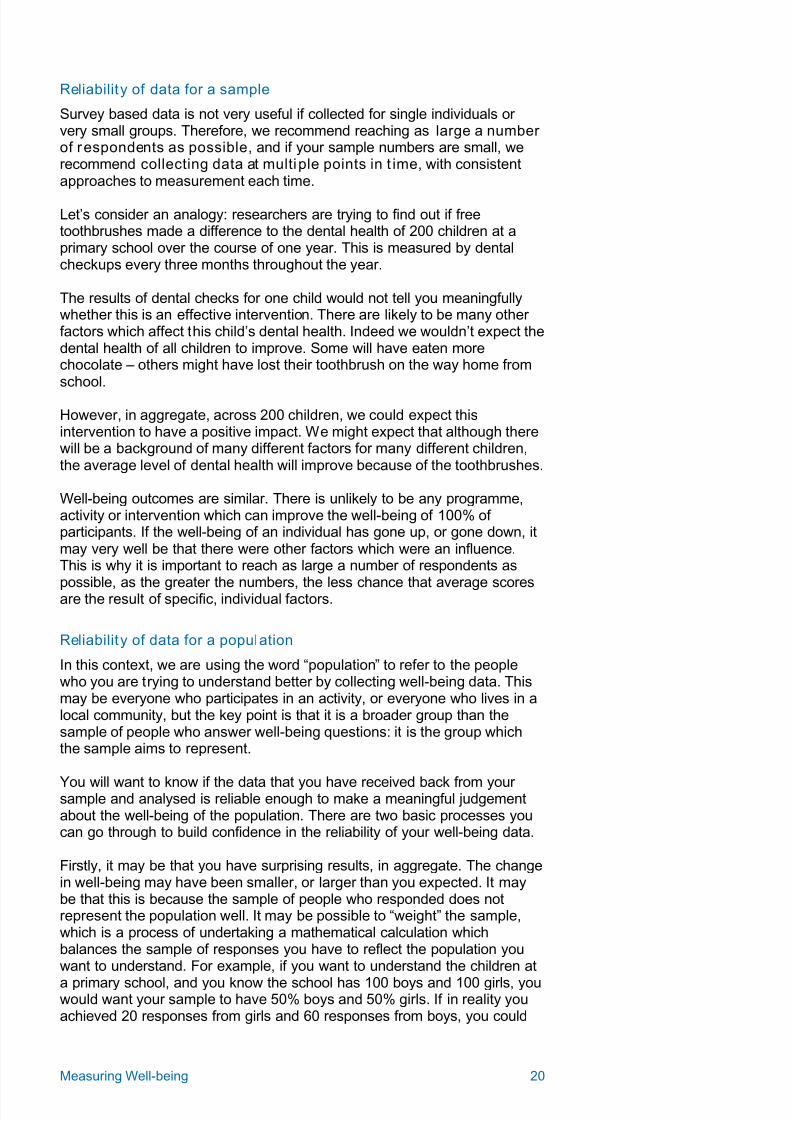
Reliability of data for a sample
Survey based data is not very useful if collected for single individuals orvery small groups. Therefore, we recommend reaching as large a numberof respondents as possible, and if your sample numbers are small, werecommend collecting data at multiple points in t ime, with consistentapproaches to measurement each time.
Let’s consider an analogy: researchers are trying to find out if freetoothbrushes made a difference to the dental health of 200 children at aprimary school over the course of one year. This is measured by dentalcheckups every three months throughout the year.
The results of dental checks for one child would not tell you meaningfullywhether this is an effective intervention. There are likely to be many otherfactors which affect this child’s dental health. Indeed we wouldn’t expect thedental health of all children to improve. Some will have eaten morechocolate – others might have lost their toothbrush on the way home fromschool.
However, in aggregate, across 200 children, we could expect thisintervention to have a positive impact. We might expect that although therewill be a background of many different factors for many different children,the average level of dental health will improve because of the toothbrushes.
Well-being outcomes are similar. There is unlikely to be any programme,activity or intervention which can improve the well-being of 100% ofparticipants. If the well-being of an individual has gone up, or gone down, itmay very well be that there were other factors which were an influence.This is why it is important to reach as large a number of respondents as
possible, as the greater the numbers, the less chance that average scoresare the result of specific, individual factors.
Reliability of data for a population
In this context, we are using the word “population” to refer to the peoplewho you are trying to understand better by collecting well-being data. Thismay be everyone who participates in an activity, or everyone who lives in alocal community, but the key point is that it is a broader group than thesample of people who answer well-being questions: it is the group whichthe sample aims to represent.
You will want to know if the data that you have received back from yoursample and analysed is reliable enough to make a meaningful judgementabout the well-being of the population. There are two basic processes youcan go through to build confidence in the reliability of your well-being data.
Firstly, it may be that you have surprising results, in aggregate. The changein well-being may have been smaller, or larger than you expected. It maybe that this is because the sample of people who responded does notrepresent the population well. It may be possible to “weight” the sample,which is a process of undertaking a mathematical calculation whichbalances the sample of responses you have to reflect the population youwant to understand. For example, if you want to understand the children at
a primary school, and you know the school has 100 boys and 100 girls, youwould want your sample to have 50% boys and 50% girls. If in reality youachieved 20 responses from girls and 60 responses from boys, you could
8/12/2019 NEF Measuring Well-being Handbook FINAL
http://slidepdf.com/reader/full/nef-measuring-well-being-handbook-final 21/33
Measuring Well-being 21
count each of the responses from each of the girls three times (give it aweighting of 3), to make the sample better reflect the gender split amongthe whole school.
Secondly, it may become obvious through your analysis that underneaththe aggregate changes shown through your overall analysis, the well-beingdata actually shows different things for different types of people within thesample. It should be possible for you to see how changes in well-being may
be different for different age ranges or gender groups, for example; that is,to look at the way well-being scores vary between different types of people.This might be one of the most interesting results, although to know this youwill need to have collected demographic information alongside asking well-being questions. Even if you have adjusted your sample to reflect yourpopulation characteristics (weighting, described above), you may find thatwell-being scores are higher for boys than for girls, or higher for olderpeople than for younger people, for example. You can then go on, in yourinterpretation, to explore why this might be the case.
Finally, it is worth remembering that well-being data which aims to capturechanges in well-being levels over time are just one indication of the true,messy reality of change in people’s lives. Don’t worry too much about theexact scores and numbers. What is important to be sure of is that youunderstand the scores in context (are they generally high or low), thedirection of well-being change (getting better or getting worse over time),and the magnitude of change (a big change or a small change over time).
Interpretation
If you are confident that your data is reliable and aware of ways in which itmight not be reliable, interpretation of the data is the next step. Interpretingthe results of your data analysis means developing ideas about what you
think the data mean: what do the results tell us and why this might be thecase?
We’ve come up with a list of three simple questions which can help starta useful conversation about interpretation. It is best if this conversation iswith colleagues and others who work with the people whose well-being youare measuring. People with experience of research in a range of differentfields could also be helpful.
Interpreting your data: what does it mean?
Are the results surpr is ing in any way? Do they show you what youexpected to see?
o If there were surprises, or differences from your expectations,why were you surprised? Why did you expect results to bedifferent?
o If there weren’t surprises, what did you know in advance thatallowed you to be accurate in expecting what the analysis wouldshow?
Can you see patterns with in the overall results?
o Did some questions produce answers which were not in linewith the others? Why?
o Did some types or groups of people answer questions verydifferently than other types or groups? Why?
How did results change over time? Why do you think this is thecase?
o Did they change for some people and not others?
8/12/2019 NEF Measuring Well-being Handbook FINAL
http://slidepdf.com/reader/full/nef-measuring-well-being-handbook-final 22/33
Measuring Well-being 22
o Did the results for certain questions and not others?
Making meaningful comparisons
One useful way to understand more about what your results mean is tocompare the results against regional and national averages. Visithttp://www.nef-consulting.co.uk/services/wellbeingmeasurement to
compare your scores using the comparison spreadsheet which can bedownloaded for free. This will allow you to identify how your scorescompare against:
against the UK national average for SWEMWBS,
o and understand whether your combined scores are among thetop or bottom 20% of scores recorded nationally.
against the regional average, or national average, for the four ONSwell-being questions.
o and understand whether your combined scores are among thetop or bottom 20% of scores as measured through the
Integrated Household Survey.
Taking it further: exploring different aspects of well-being
For many organisations, an interest in well-being measurement maydevelop over time to a focus on certain aspects of well-being that they wantto know about in greater detail. It may be that you want to investigatespecific aspects of well-being, some of which might be particularly relevantto the changes you are seeking to understand.
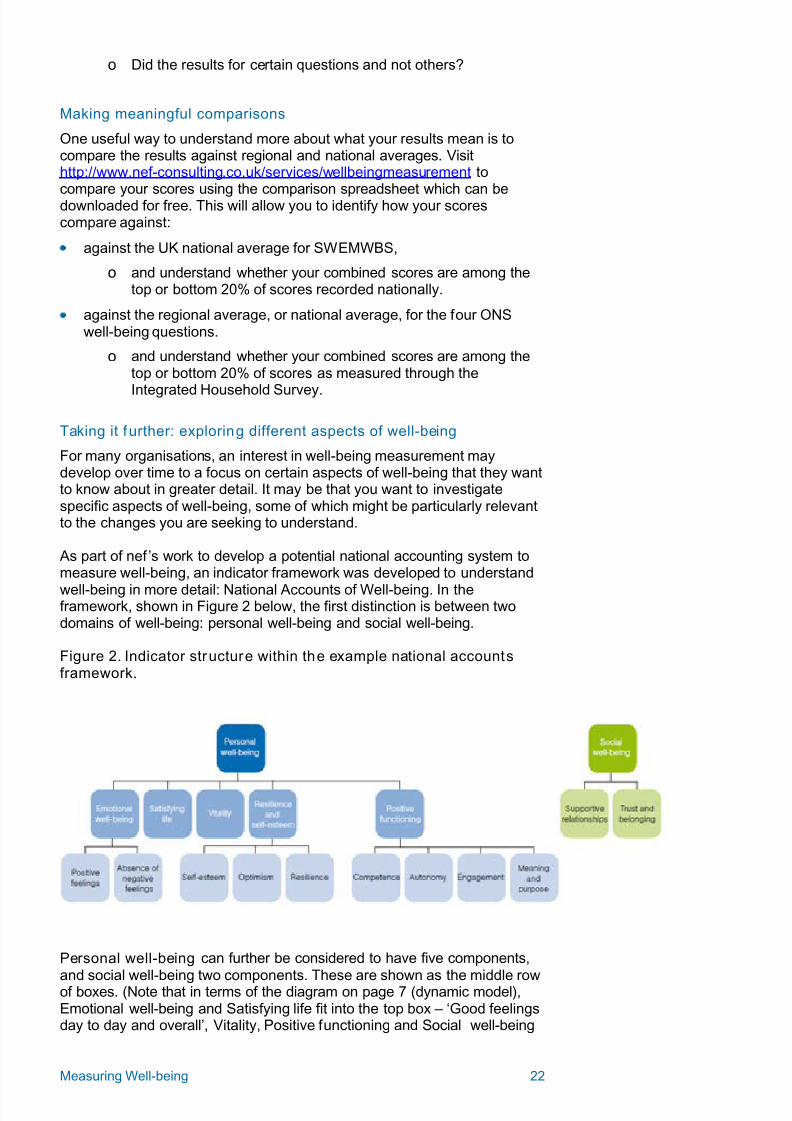
As part of nef ’s work to develop a potential national accounting system tomeasure well-being, an indicator framework was developed to understand
well-being in more detail: National Accounts of Well-being. In theframework, shown in Figure 2 below, the first distinction is between twodomains of well-being: personal well-being and social well-being.
Figure 2. Indicator structure within the example national accountsframework.
Personal well-being can further be considered to have five components,
and social well-being two components. These are shown as the middle rowof boxes. (Note that in terms of the diagram on page 7 (dynamic model),Emotional well-being and Satisfying life fit into the top box – ‘Good feelingsday to day and overall’, Vitality, Positive functioning and Social well-being
8/12/2019 NEF Measuring Well-being Handbook FINAL
http://slidepdf.com/reader/full/nef-measuring-well-being-handbook-final 23/33
Measuring Well-being 23
fit into the middle box – ‘Good functioning and satisfaction of needs’ - andResilience and self-esteem fit into the bottom right box – ‘Personalresources’). Certain components of personal well-being, such as positivefunctioning, can then be understood to be comprised of severalsubcomponents. Subcomponents are shown as the bottom row of Figure 1.Social well-being – supportive relationships and a sense of trust andbelonging – are also important. The appendix to this handbook features afull description of each box in the table. Fifty well-being questions, asked
through the European Social Survey, are combined to produce indicatorson the components and subcomponents of well-being, and they are listedat Appendix 3 of the National Accounts report8.
nef consulting has worked with many organisations who are interested infinding evidence that their programme is achieving specific outcomes, suchas increased self-esteem, which make up part of overall well-being. Wehave used many of the National Accounts questions to help organisationsunderstand how their work affects specific aspects of well-being. Forexamples of this work, take a look at this report9 published with theCommunity Development Foundation and the report10 Building SocialCapital.
There are lots of other ways in which you could understand well-being ashaving different components, and it’s worth remembering that differentaspects of well-being are usually related: people who score highly in onecomponent or subcomponent also tend to score highly across the others.
Conclusion: results that are ‘fit for purpose’
Analysing and interpreting the toothbrush example
In the case of toothbrushes, data analysis could tell us that the interventionwas more effective among girls than boys in improving dental health. If thedifference in dental health results was 1% between boys and girls, this maynot be enough of a difference to draw strong conclusions, and may suggesta need for further investigation. A 10% difference would be a betterindication of a pattern that meant something. A rule of thumb is that abigger sample size means that we can be more confident that thedifference in scores between two groups of respondents is statisticallysignificant.11 If we had only received responses from 3 boys, and 45 girls,the sample size is too small to rely on to understand whether gender was afactor in the effectiveness of the intervention.
Interpreting a 10% differential in dental health between boys and girls, and
assuming each gender had an adequate sample response, we might thentry and identify factors which could help to explain the difference.
Once results are collected, organisations are often keen to understand theirresults in context. Are the results good or bad? What can they be comparedagainst? Evaluating the effectiveness of the dental intervention, we couldseek to compare our results about dental health improvement in a numberof ways. We could investigate dental health indicators for a similarpopulation (e.g. primary school aged children), or look at another evaluationthat had considered a similar or contrasting type of dental healthintervention.
The key question you need to make a judgement on is this: are theanalysed results of well-being measurement ‘fit for purpose’? Are theyuseful enough to use in improving a service, or evidencing impact? Does

8/12/2019 NEF Measuring Well-being Handbook FINAL
http://slidepdf.com/reader/full/nef-measuring-well-being-handbook-final 24/33
Measuring Well-being 24
the direction of change over time (up or down) and the magnitude ofchange (big or small) feel sensible against other information you haveabout what is happening “on the ground”. If the answer to these questionsis yes, then the exercise of collecting well-being data has been worthwhile:the subjects of the intervention are validating the judgements of theorganisers, staff and evaluators.
8/12/2019 NEF Measuring Well-being Handbook FINAL
http://slidepdf.com/reader/full/nef-measuring-well-being-handbook-final 25/33
Measuring Well-being 25
4. Using the results of well-beinganalysis
By the end of this section you should:
Understand some of the things to consider when deciding how to useresults from well-being measurement and analysis
Understand some of the things to consider when deciding how todisseminate results from well-being measurement and analysis
Making use of the findings
Measuring well-being is of little benefit unless you act on the results. If youdo this, measurement can ultimately help to improve people’s lives, forexample by pointing to where projects and services can be made moreeffective in enhancing people’s well-being.
How you use your well-being findings will depend on which aspects of well-being you explored, and on the results obtained. However, it might be
possible to think about using them in order to:
Tailor your intervention. By using well-being data as a springboard forfurther exploration with participants, you may be able to improve yourprogramme or project so as to improve well-being outcomes.
Demonst rate outcomes and impact. By showing that people’s well-being has improved over time, you may be able to better demonstratethe impact of your project/service
Help w ith fundraising. By demonstrating evidence on the needs orissues you are trying to address, you may be able to make a fundingapplication more convincing.
Bring about service change. By informing local agencies about thewell-being issues facing your community or group, you may be able toencourage service providers to think about how their services affectpeople’s well-being, and to think about adjusting them so as tomaximise well-being outcomes.
Disseminating the findings
Related to the above, measuring well-being is of greater benefit if youshare the results. In this way, measurement can help to better inform localresidents, organisations, groups and service providers. It is useful to begin
by considering who you would like to share your well-being findings with.Your list may include:
Local residents

8/12/2019 NEF Measuring Well-being Handbook FINAL
http://slidepdf.com/reader/full/nef-measuring-well-being-handbook-final 26/33
Measuring Well-being 26
Service users/project participants
Community and voluntary groups
Project officers
Local statutory organisations (local council, NHS)
Regional or national organisations
Funding bodies
There are many ways in which you can share and disseminate the results.Select whatever methods are best suited to your needs and resources.
Some ideas you might consider include:
Showing the findings in a newsletter
Distributing a short report to local agencies/project participants/localresidents/local media
Presenting the findings at an event or meeting
Reporting to funders
Using in application to funders
8/12/2019 NEF Measuring Well-being Handbook FINAL
http://slidepdf.com/reader/full/nef-measuring-well-being-handbook-final 27/33
Measuring Well-being 27
5. Checklist
Congratulations! You have nearly reached the end of our handbook formeasuring well-being. By now we hope you are:
Familiar with the concept of well-being, the difference between well-being and its drivers, and nef ’s dynamic model of well-being
Familiar with issues around measuring well-being
Familiar with some useful steps to meaningfully analyse and interpret your results.
Familiar with some of the things to think about when deciding how touse results from well-being measurement

8/12/2019 NEF Measuring Well-being Handbook FINAL
http://slidepdf.com/reader/full/nef-measuring-well-being-handbook-final 28/33
Measuring Well-being 28
6. Find Out More…
This section provides some information on other resources that may be ofuse to you in understanding and measuring well-being.
Well-being Surveys
The North West Mental Well-being Survey 2009http://www.nwph.info/nwpho/Publications/NorthWestMentalWell-being%20SurveySummary.pdf
The ONS Spotlight on Subjective Well-beinghttp://www.statistics.gov.uk/articles/social_trends/spotlight-on-subjective-well-being.pdf
Measuring well-being
nef ’s National Accounts of Well-being – Measuring Well-being http://www.nationalaccountsofwellbeing.org/learn/measuring/
Local Wellbeing: Can we measure it?Steuer, N. and Marks, N. (2008). Local Wellbeing: Can we measure it? London; The Young Foundation.http://www.youngfoundation.org/files/images/YF_wellbeing_measurement_web.pdf
The Young Foundation’s WARM measureBacon, N. and Mguni, N. (2010). Taking the temperature of localcommunities: The Well-being and Resilience Measure – WARM. London:The Young Foundation.http://www.youngfoundation.org/files/images/YF_WARMREPORT_Screen.pdf
The Mental Well-being Impact Assessment toolkitCooke, A., Friedli, L., Coggins, T., Edmonds, N., Michaelson, O’Hara, K.,Snowden, L., Stansfield, J., Steuer, N. and Scott-Samuel, A. (2011). TheMental Well-being Impact Assessment toolkit. London: NMHDU.http://www.apho.org.uk/resource/item.aspx?RID=95836
Increasing well-being
nef 's 5 ways to well-being Aked, J., Marks, N., Cordon, C. and Thompson, S. (2008). Five Ways to
Wellbeing: The evidence. London: nef .http://www.neweconomics.org/sites/neweconomics.org/files/Five_Ways_to_Well-being_Evidence_1.pdf

8/12/2019 NEF Measuring Well-being Handbook FINAL
http://slidepdf.com/reader/full/nef-measuring-well-being-handbook-final 29/33
Measuring Well-being 29
Local and community level well-being
The role of local government in promoting well-being Aked, J., Michaelson, J. and Steuer, N. (2010). The role of localgovernment in promoting well-being. London: Local GovernmentImprovement and Development.http://www.local.gov.uk/c/document_library/get_file?uuid=867e0406-35a5-4e91-910d-6b13305d2319&groupId=10171
Improving community health and well-beingFoot, J. (2010). A Glass Half Full: How an asset approach can improvecommunity health and well-being. London: Local Government Improvementand Development.http://www.idea.gov.uk/idk/aio/18410498
Evaluation
Monitoring and evaluation in the charity sectorCupitt, S & Wllis, J. (2011). Next Steps: Monitoring and evaluation on ashoestring. London: Charities Evaluation Services.
http://www.ces-vol.org.uk/downloads/meonashoestring-795-803.pdf
Measuring health improvementGarrow, V. (2011). Measuring impact in health improvement: An accessibleguide for health practitioners. London: Local Government Improvement andDevelopmenthttp://www.idea.gov.uk/idk/aio/25631442
nef consultingnef consulting is the social enterprise and consultancy arm of nef. It draws on and adapts nef ’s ideas and applies innovative approaches to helpa range of public, private and third sector organisations develop bettermetrics and make better decisions.http://www.nef-consulting.co.uk/services/
Children’s well-being, including measurement
The Children’s Society Good Childhood Indexhttp://www.childrenssociety.org.uk/what-we-do/research/initiatives/well-being/background-programme-0
Well-being at work
nef consultinghttp://www.well-beingatwork.net/
8/12/2019 NEF Measuring Well-being Handbook FINAL
http://slidepdf.com/reader/full/nef-measuring-well-being-handbook-final 30/33
Measuring Well-being 30
Appendix: National Accounts Of Well-Being - Components andSubcomponents
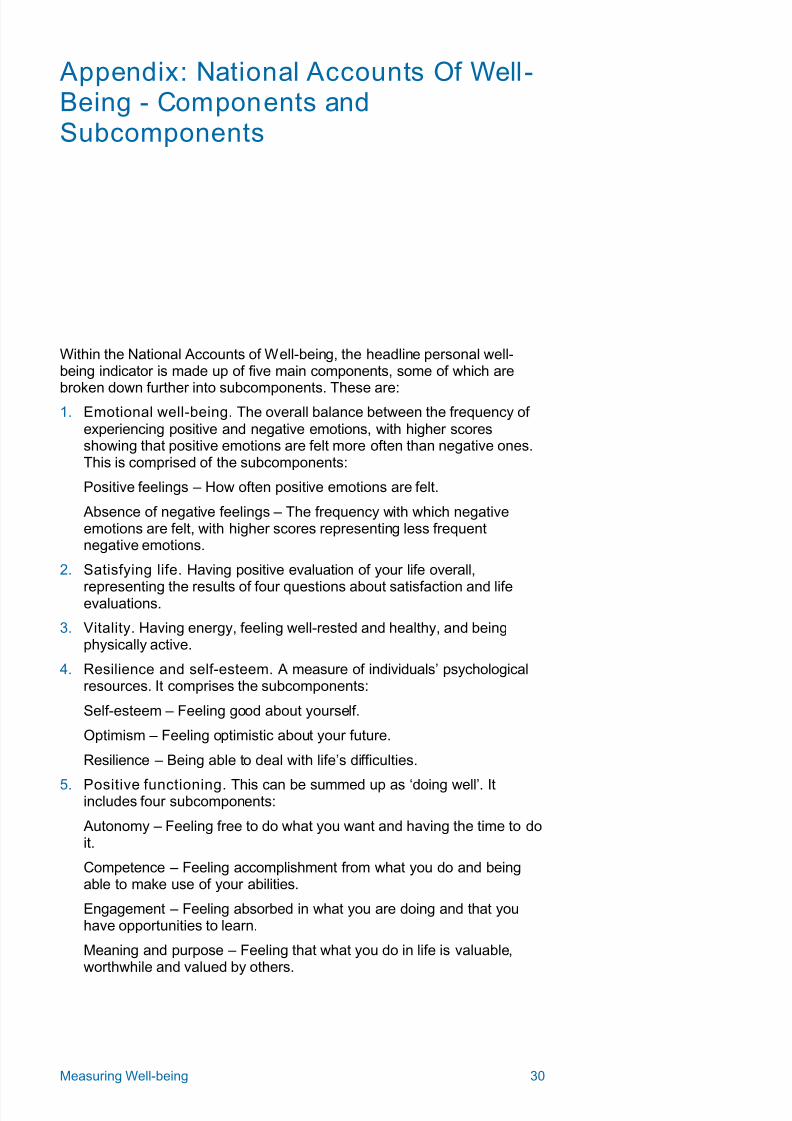
Within the National Accounts of Well-being, the headline personal well-being indicator is made up of five main components, some of which are
broken down further into subcomponents. These are:1. Emotional well-being. The overall balance between the frequency of
experiencing positive and negative emotions, with higher scoresshowing that positive emotions are felt more often than negative ones.This is comprised of the subcomponents:
Positive feelings – How often positive emotions are felt.
Absence of negative feelings – The frequency with which negativeemotions are felt, with higher scores representing less frequentnegative emotions.
2. Satisfying life. Having positive evaluation of your life overall,
representing the results of four questions about satisfaction and lifeevaluations.
3. Vitality. Having energy, feeling well-rested and healthy, and beingphysically active.
4. Resilience and self-esteem. A measure of individuals’ psychologicalresources. It comprises the subcomponents:
Self-esteem – Feeling good about yourself.
Optimism – Feeling optimistic about your future.
Resilience – Being able to deal with life’s difficulties.
5. Positive functioning. This can be summed up as ‘doing well’. Itincludes four subcomponents:
Autonomy – Feeling free to do what you want and having the time to doit.
Competence – Feeling accomplishment from what you do and beingable to make use of your abilities.
Engagement – Feeling absorbed in what you are doing and that youhave opportunities to learn.
Meaning and purpose – Feeling that what you do in life is valuable,worthwhile and valued by others.

8/12/2019 NEF Measuring Well-being Handbook FINAL
http://slidepdf.com/reader/full/nef-measuring-well-being-handbook-final 31/33
Measuring Well-being 31
The headline social well-being indicator of National Accounts of Well-beingis made up of two main components:
1. Supportive relationships. The extent and quality of interactions in closerelationships with family, friends and others who provide support.
2. Trust and belonging. Trusting other people, being treated fairly and
respectfully by them, and feeling a sense of belonging with and supportfrom people where you live.
In addition to these indicators, as an example of a well-being indicatorwithin a specific life domain, a satellite indicator of well-being at work hasalso been created. This measures job satisfaction, satisfaction with work-life balance, the emotional experience of work, and assessment of workconditions.

8/12/2019 NEF Measuring Well-being Handbook FINAL
http://slidepdf.com/reader/full/nef-measuring-well-being-handbook-final 32/33

8/12/2019 NEF Measuring Well-being Handbook FINAL
http://slidepdf.com/reader/full/nef-measuring-well-being-handbook-final 33/33
Written by: Juliet Michaelson, Sorcha Mahony andJonathan Schifferes
Cover image: Indigo Skies Photography via Flickr
new economics foundation
3 Jonathan Street
London SE11 5NH
United Kingdom
Telephone: +44 (0)20 7820 6300
Facsimile: +44 (0)20 7820 6301
E-mail: [email protected]
www.neweconomics.org
Registered charity number 1055254
© July 2012 nef (the new economics foundation)