nephrops - the major british fishery
TRANSCRIPT

Nephrops - The major British fisherySupply, demand and markets
Tania GrossMarket Research ExecutiveSea Fish Industry Authority

Agenda
1 A few key figures
2 A duplicated demand: one product becomes two2.1 Scampi2.2 Langoustines
3 What the industry thinks

1.The Major British Fishery
Landings28,300 t.
Home Market13,500 t.
Export14,800 t.
Imports650t.
France5,500 t.
Spain5,870 t.
Italy2,090 t.
Retail5,200 t.
Foodservice8,300 t.
LANGOUSTINES
SCAMPI

1.The Major British Fishery
Quotas by country, 2002
UK
France
Ireland
Germany
Denmark
HollandPortugal
BelgiumSweden
Spain
31, 300 t.
Source: European Commission

1.The Major British Fishery
010203040506070
£ M
illio
n
Nephro
psHad
dock
CodM
onk
Scallo
psCra
bW
hiting
Mac
kerel
Lobste
rSole
Scotland Rest UK
Landings in the UK, Defra 2000 figures
The highest value species to be landed in Scotland,and in the UK as a whole

1.The Major Scottish Fishery
Landings in Scotland, Defra 2000 figures
0
5
10
15
20
25
Ton
nes
1991
1992
1993
1994
1995
1996
1997
1998
1999
2000
2001
Tails Whole
Landings of tails versus whole in Scotland

Agenda
1 A few key figures
2 A duplicated demand: one product becomes two2.1 Scampi are for the UK!2.2 Langoustines are for exporting!
3 What the industry thinks

2.1 The UK and scampi
• 5th most popular frozen ‘species’ (after cod, prawns, haddock and salmon) with volume 14% higher than last year (retail) and 5th/6th most popular species in foodservice.
• Scampi accounts for 12% of the retail shellfish market (worth £41.4 million) and for 36% of the foodservice shellfish market (£41.2 million).
* Fresh and Frozen
Volume Share
Foodservice61%
Retail39%
0500
100015002000250030003500400045005000
Tonn
es
1992
1993
1994
1995
1996
1997
1998
1999
2000
2001
Retail volume trends

2.1 Purchasing behaviour retailFrozen scampi growing in retail
Frozen Scampi 2000 2001 % Change
Expenditure (£ '000s) 32876 35123 +7%Volume (Tonnes) 3630 4146 +14%
Penetration (% households buying) 15.9 17.5 +10%Frequency (times per year) 2.4 2.6 5%
Trip spend 3.5 3.21 -8%Trip Volume 0.4 0.4 -2%
Price (£s per Kg) 9.06 8.47 -6%
Scampi represents about 5% of all frozen fish
!
Source: TNS Superpanel

2.1 Demographic profile of Scampi
Source: TNS Superpanel
05
10152025303540
% S
hare
1 M
ember
HHs 2
Mem
ber HHs
3 M
ember
HHs 4
Mem
ber HHs
5+ M
ember
HHs
Total frozen fish and shellfish Scampi
Mainly 2-member households and families Number of people in household

2.1 Demographic profile of Scampi
Source: TNS Superpanel
05
101520253035
% sh
are
Hwife
Age
d und
er 27
H
wife A
ged 2
7-34
Hwife
Age
d 35-4
4 H
wife ag
ed 45
-64
Hwife
Age
d 65+
Total frozen fish and shellfish Scampi
Scampi profile younger than that of all frozen fishAge of housewife

2.1 In-home usage of Scampi
Source: TNS Family Food Panel
02468
10121416
% o
f all
scam
pi o
ccas
ions
CHILD 0-
5 CHIL
D 6-10
CHILD 11
-16
MALE 17
-24
MALE 25
-34
MALE 35
-44
MALE 45
-64
MALE 65
+
FEM
ALE 17-24
FEM
ALE 25-34
FEM
ALE 35-44
FEM
ALE 45-64
FEM
ALE 65+
Scampi consumer profile

2.1 In-home usage of Scampi
Source: TNS Family Food Panel
No. of people present
05
1015202530354045
1 2 3 4 5+
%
Who is present?
01020304050607080
ADULTS ONLY BOTH
%
Who is eating?
0
20
40
60
80
100
ADULTS ONLY CHILDREN ONLY BOTH
%

2.1 Cross-over between fresh and frozen
Fresh and Frozen
7%Fresh only
7%
Frozen only86%
The need for a convenient product?
Source: TNS Superpanel
Around 9 in 10 shoppers only bought frozen scampi last year

2.1 In-home usage of Scampi
Source: TNS Family Food Panel
0
1
2
3
4
5
6
7
Summer
/Autu
mn '98
Wint
er/Spri
ng '9
8
Summer
/Autu
mn '99
Wint
er/Spri
ng '9
9
Summer
/Autu
mn '00
Wint
er/Spri
ng '0
0
Summer
/Autu
mn '01
No.
of o
ccas
ions
(mill
ions
)
BAKED FRIED
Changes in cooking methods
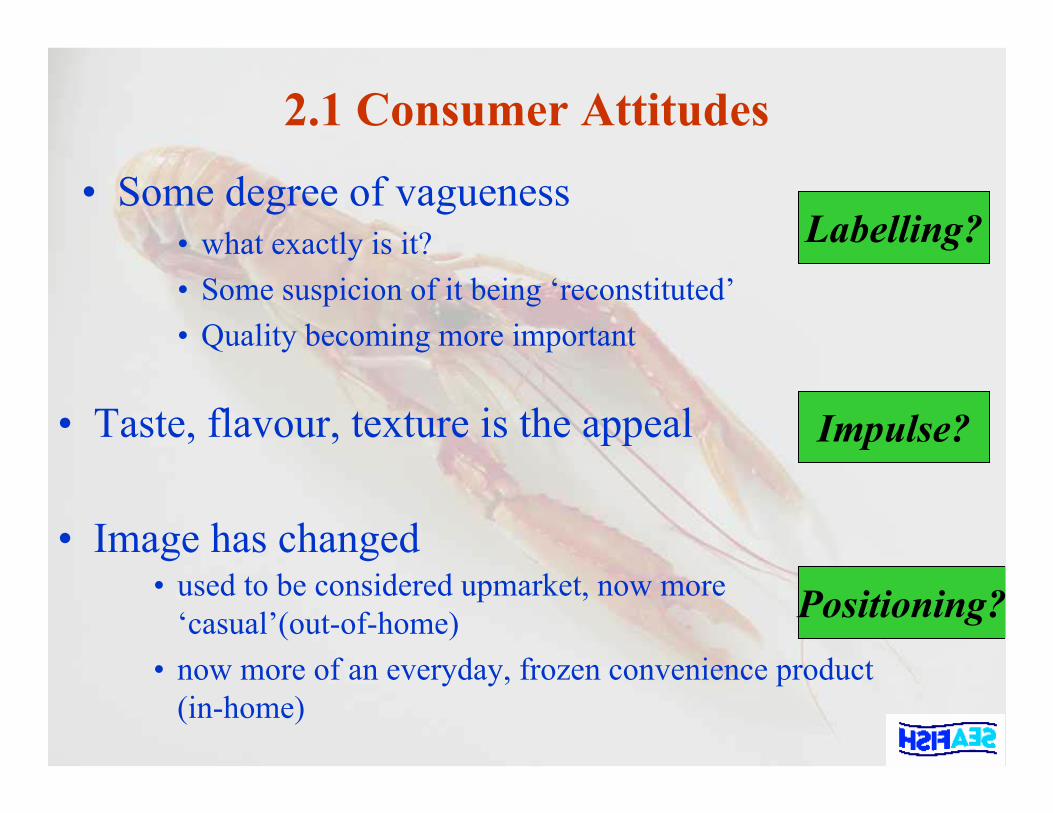
2.1 Consumer Attitudes
• Some degree of vagueness• what exactly is it?• Some suspicion of it being ‘reconstituted’• Quality becoming more important
Labelling?
Positioning?
Impulse?• Taste, flavour, texture is the appeal
• Image has changed• used to be considered upmarket, now more
‘casual’(out-of-home)• now more of an everyday, frozen convenience product
(in-home)

2.1 The UK and scampi - Key points
• Convenience is key• Squeamishness• Familiarity / routine• Busy lifestyles
• But what about aspirations….?– Morrisons and Tesco’s sell whole langoustines!

Agenda
1 A few key figures
2 A duplicated demand: one product becomes two2.1 Scampi are for the UK!2.2 Langoustines are for exporting!
3 What the industry thinks

2.2 The export market for langoustines
Total UK langoustines exports by country, 2001
Ireland4%
Italy14%
Others3%
Spain41%
France38%
Volume Share
Source: UK Customs and Excise

2.2 The export market for langoustines
Volume trends in exports of langoustines
0
2,000
4,000
6,000
8,000
10,000
12,000
14,000
16,000
18,000
1995 1996 1997 1998 1999 2000 2001
Ton
nes
SPAIN
FRANCE
ITALY
OTHERS
Source: UK Customs and Excise

2.2 The export market for langoustines
Top 3 export markets for langoustines, 2001
0
1000
2000
3000
4000
5000
6000
7000
Spain France Italy
Ton
nes
FreshFrozen
Source: UK Customs and Excise

2.2 The French export market for langoustines
How much is consumed?• 9,500 t. imported in 2000 (mostly fresh)• 6,100 t. caught• Little exported, so about 15,000 t. consumed
Where?• Out-of-home 1,400 tonnes (fresh + frozen)• In-home 5,000 tonnes (fresh only)
Source: Ofimer / Secodip

2.2 The French export market for langoustines
0
200
400
600
800
1000
1200
Ton
nes
FreshFrozen
Out-of-home Sector
Whole Tails Cost sector
In home Sector
0
500
1000
1500
2000
2500
3000
3500
4000
4500
5000
1999 2000 2001
Tonn
es a
nd F
F m
illio
ns
72.0
72.5
73.0
73.5
74.0
74.5
75.0
75.5
76.0
76.5
77.0
Pric
e (F
F/kg
)
Volume Value Price
Source: Ofimer / Secodip

2.2 The French export market for langoustines
Who?8% of French households purchase fresh langoustineOn the west coastRetired, well-off core consumer
When?Summer and Christmas
Source: Ofimer / Secodip

2.2 The Italian export market for langoustines
How much is consumed?• 11,000 t. imported in 2000 (mostly frozen)• 2,500 t. caught• Little exported, so about 13,500 t. consumed
Where?• In-home Estimated at 8,000 t. (fresh)• Out-of-home Estimated at 4,500 t.
Source: Europanel

2.2 The Italian export market for langoustines
6500
7000
7500
8000
8500
9000
Tonn
es
1999 2000 2001
In-Home fresh langoustine consumption
Source: Europanel
Regional split of consumptionNorth West
10%
North East4%
Centre14%
South + Islands72%

2.2 The Italian export market for langoustines
Who?15% of Italian households buy fresh langoustinesOn average they buy it about 3.8 times per year
0
10
20
30
40
50
60
70
Tonn
es
Singles 2 member 3-4 member >5 member
In-Home fresh langoustine consumption
0
5
10
15
20
25
30
Tonn
es
<34 '35-44 '45-54 '55-64 >64
In-Home fresh langoustine consumption
Source: Europanel

2.2 The Spanish export market for langoustines
How much is consumed?• 8,500 t. imported in 2000 (mostly frozen)• 1,500 t. caught• Little exported, so about 9,500 t. consumed
Where?• Mercabarna sales higher than Mercamadrid but other
channels of trade are developing
• Study from 2000 suggest opportunities in the retail trade
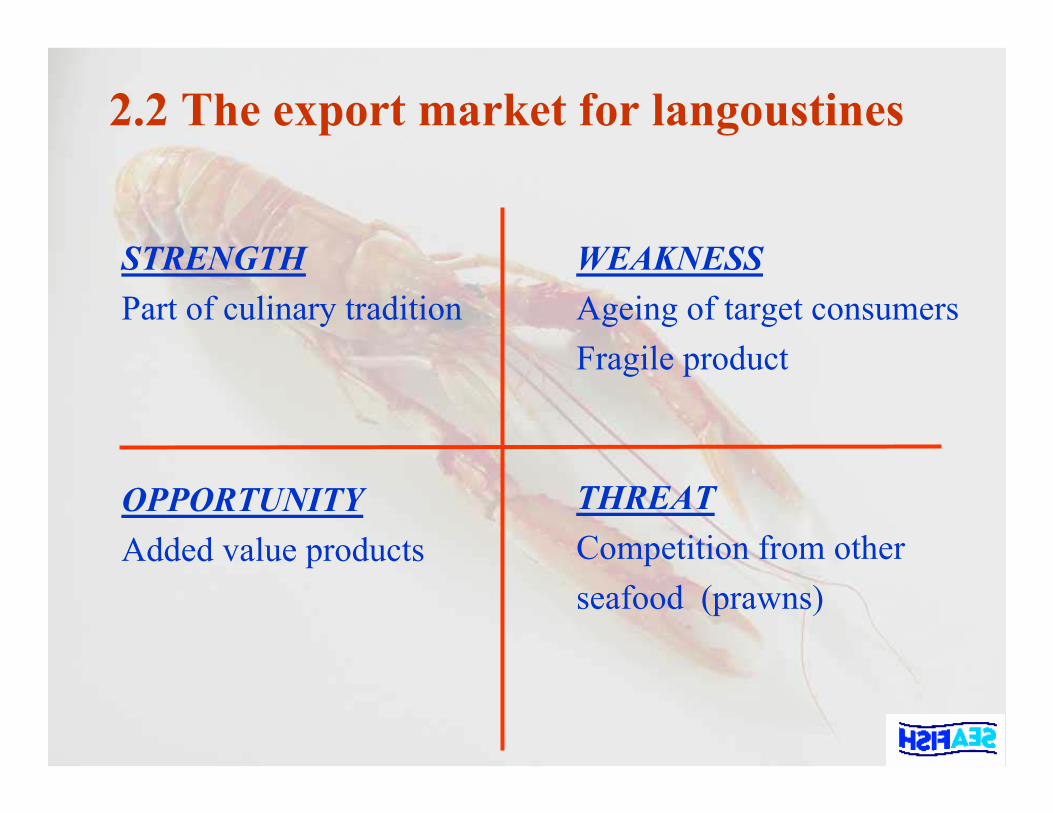
2.2 The export market for langoustines
STRENGTHPart of culinary tradition
THREATCompetition from otherseafood (prawns)
OPPORTUNITYAdded value products
WEAKNESS Ageing of target consumersFragile product

2. Demand side - key points
• Strong dichotomy of the product
• Long term trends – Is the British consumer becoming more
adventurous?– Are foreign markets turning to convenience?
• Let’s ask the industry!

Agenda
1 A few key figures
2 A duplicated demand: one product becomes two2.1 Scampi are for the UK!2.2 Langoustines are for exporting!
3 What the industry thinks

3. What does the industry think?
• Spoke to 7 big processors / catchers and asked them:
– Trends according to them?– Issues?– Opportunities?– Will patterns of consumption change?

3. What are the key trends in this market?
• Clear segmentation of the markets
• Growth in the UK coming from retail
• Quality becoming more important in the marketing of the product. In recent years, clear move from reformed to whole tail.
• Growth through adding value: emphasis on NPD for scampi

3. Issues?
Supply issues:• Quotas - limited natural resource• Necessity to regulate supply • Scottish weather !• Fluctuations in exchange rates
Product issues:• Competition from substitute products• Food scares (but more likely to affect molluscs)• No organic classification

3. Opportunities?Scampi market:• Add value
– Premium – NPD (new flavours, coating, cooking methods)– Chilled offering– Labelling required
• Revise positioning– Boost awareness (low penetration)– ‘Eating-out experience’ at home– Snacky eating?

Langoustine exports:
• Market knowledge
• Building relationships
• Seasonal peaks
3. Opportunities?

3. Will things change?
• There seems to be an interesting trend at present – British consumers getting more adventurous?– Export markets being attracted to convenience?
• Opportunities for langoustines in the UK?
• Opinions are divided in the trade!
Maybe in the longer term...?

Thank you