nestle india - visit note-nov-15-edel - myirisbreport.myiris.com/es1/nesindia_20151123.pdf ·...
TRANSCRIPT
Edelweiss Research is also available on www.edelresearch.com, Bloomberg EDEL <GO>, Thomson First Call, Reuters and Factset. Edelweiss Securities Limited
We recently met Mr. Suresh Narayanan, Chairman and Managing Director (CMD) of Nestlé India (Nestle). We are enthused by the new CMD’s efforts to revive Nestle from the Maggi imbroglio and the strategy to ramp up volume growth which will be achieved through higher innovations/new launches (details inside), proactive pricing and higher consumer engagement. Maggi’s initial comeback is a positive, but in our view regaining market share will be tough and gradual. We remain positive on Nestle from 2-3 years perspective being a strong play on urban revival. But, over medium term the company’s margins and volumes will remain under pressure. Maintain ‘REDUCE’.
Mr Suresh Narayanan a.k.a turnaround MD sets the plan Mr Narayanan (CMD of Indian origin after 17 years) in our view has done a commendable job in managing the Maggi crisis (tests cleared, post relaunch Nestle sold 33mn pack). Under the new leadership, Nestle has spelt out focus areas (details inside), key ones being to resuscitate sales growth and step up innovations. Alluding to Britannia’s and Infosys’s examples which saw significant improvement in business post change in leadership, can Mr Narayanan do the same for Nestle?
Innovations, proactive measures to pick up Management proposes to ramp up new launches and innovations both in existing (especially chocolates & confectionaries, coffee & beverages) and new segments (health food drinks, water, breakfast cereals, adult nutrition and pet food). The company has also become more proactive than before having introduced innovative measures such as flash sales of Maggi on the online platform Snapdeal, sharp price cuts in Nestle’s tetra pack (20%) and Nestle dahi (16.7%). Outlook and valuations: Challenging; maintain ‘REDUCE’ Nestle looks attractive over the long term, but growth and margins will remain under pressure in the medium term. At CMP, the stock is trading at 53.6x CY16E and 37.0x CY17E. We maintain ‘REDUCE/Sector Underperformer’ with a target price of INR6,024.
VISIT NOTE
NESTLE INDIA Turnaround MD impresses, but will he work his magic?
EDELWEISS 4D RATINGS
Absolute Rating REDUCE
Rating Relative to Sector Underperformer Risk Rating Relative to Sector Low Sector Relative to Market Underweight
MARKET DATA (R: NEST.BO, B: NEST IN)
CMP : INR 6,196 Target Price : INR 6,024 52-week range (INR) : 7,505 / 5,499 Share in issue (mn) : 96.4 M cap (INR bn/USD mn) : 597 / 9,020 Avg. Daily Vol.BSE/NSE(‘000) : 2,390.3
SHARE HOLDING PATTERN (%)
Current Q1FY16 Q4FY15
Promoters * 62.8 62.8 62.8
MF's, FI's & BK’s 4.9 4.4 4.5
FII's 12.2 12.7 12.5
Others 20.2 20.2 20.2 * Promoters pledged shares (% of share in issue)
: NIL
PRICE PERFORMANCE (%)
Stock Nifty
EW Consumer goods Index
1 month (5.2) (4.9) (0.5)3 months 0.7 (6.2) (0.2)
12 months 0.6 (6.5) 3.6
Abneesh Roy +91 22 6620 3141 [email protected] Pooja Lath +91 22 6620 3075 [email protected] Tanmay Sharma +91 22 4040 7586 [email protected]
India Equity Research| Consumer Goods
November 23, 2015
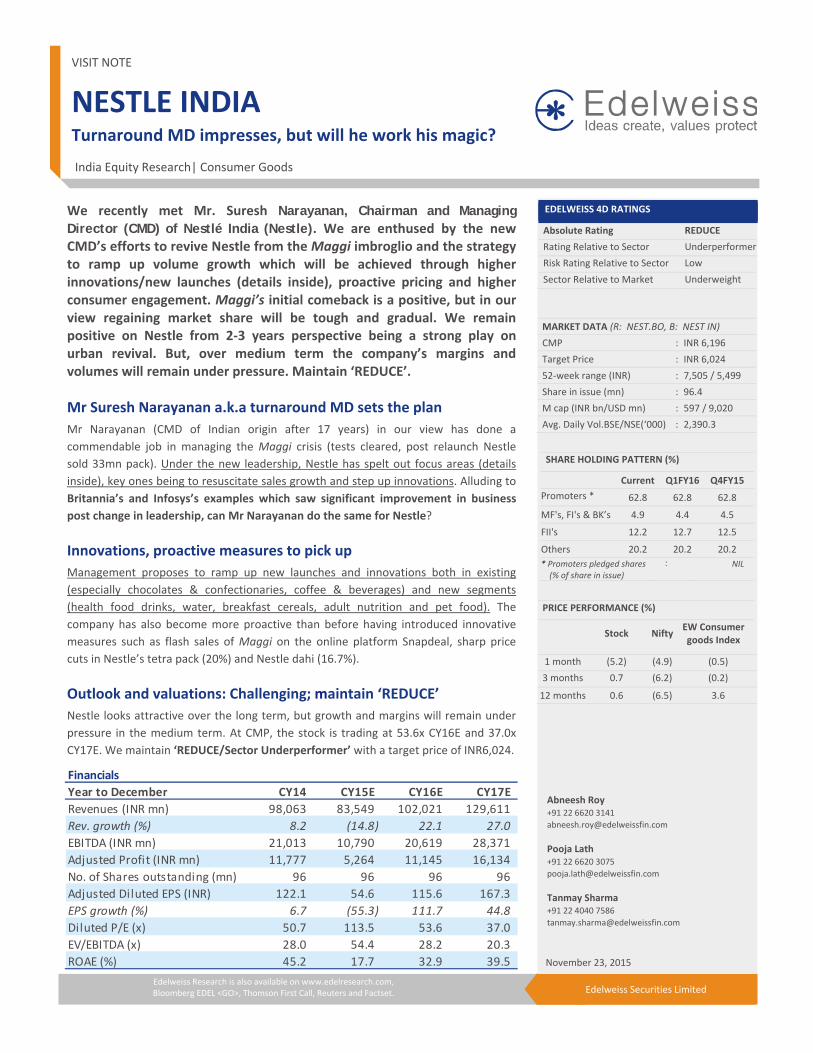
FinancialsYear to December CY14 CY15E CY16E CY17ERevenues (INR mn) 98,063 83,549 102,021 129,611 Rev. growth (%) 8.2 (14.8) 22.1 27.0 EBITDA (INR mn) 21,013 10,790 20,619 28,371 Adjusted Profit (INR mn) 11,777 5,264 11,145 16,134 No. of Shares outstanding (mn) 96 96 96 96 Adjusted Diluted EPS (INR) 122.1 54.6 115.6 167.3 EPS growth (%) 6.7 (55.3) 111.7 44.8 Diluted P/E (x) 50.7 113.5 53.6 37.0 EV/EBITDA (x) 28.0 54.4 28.2 20.3 ROAE (%) 45.2 17.7 32.9 39.5

Consumer Goods
2 Edelweiss Securities Limited
Mr Narayanan - Man in hurry but pragmatic… Mr Narayanan (MD effective from August 1, 2015) replaced Etienne Benet effective August 1, 2015 as CMD of Nestle India. It is after a span of 17 years that the company appointed a CMD of Indian origin, which in our view is a big positive. Known as the turnaround MD for his commendable turnaround performance of Nestle in earlier roles at Singapore and Egypt, all eyes are set on him to bring back growth at Nestle India. During the analyst meet, the CMD said that ‘I am a man in hurry but I am also pragmatic’, which instills confidence that he is all set to deliver and considering his past record coupled with strong show to bring back Maggi to the market further bolsters or confidence further. Impressive experience
Before joining India, Mr. Narayanan was Chairman and CEO (effective April 2015) of Philippines arm. Prior to that, he was Chairman and CEO of Nestlé Egypt and Head of Nestlé’s Business in North East African Region (NEAR), a post he assumed in 2010. He joined the Nestlé Group in 1999 as Executive Vice President for sales in India (home country), where he spearheaded major structural and strategic changes in sales and customer management and set up the chilled dairy business. As part of his international development and to leverage his experience, Mr. Narayanan was assigned to Nestlé Indochina in 2003 as Executive Director for Sales, Marketing and FoodServices, covering Thailand, Cambodia, Myanmar, Laos and Vietnam. Two years later in 2005, he returned to Nestlé India as Executive Vice President and Head of Sales covering India, Sri Lanka, Bangladesh and Nepal. During this time, the business grew rapidly across a range of product categories. In 2008, he was appointed Managing Director of Nestlé Singapore, a position he held up to 2010 during which time overall business in Singapore witnessed sustained growth amidst the economic downturn. For excellence in employee relations during this challenging period, Mr. Narayanan was awarded the Medal of Commendation by the Government of Singapore in 2010. Towards late 2010, he was transferred to Nestlé Egypt as Chairman and CEO and Head of NEAR, where he led successful initiatives that resulted in significant business growth and investments, despite the turbulence and volatility faced by the region at that time. Mr. Narayanan holds a Master’s Degree in Economics from the Delhi School of Economics and a Diploma from the IMD Program for Executive Development, and has participated in Nestlé’s Leadership Program of the London Business School. Restoring double digit growth a priority Overall growth at Nestle India has been tapering off since past few years. Net sales growth which was headed on double digit trajectory slowed down to higher single digits in CY13 and CY14. YTD CY15 has also been a wash out impacted by the Maggi issue with sales declining by 15.3% YoY during 9mCY15.
Mr. Suresh Narayanan, Nestle India, new MD
and Chairman
Nestle
3 Edelweiss Securities Limited
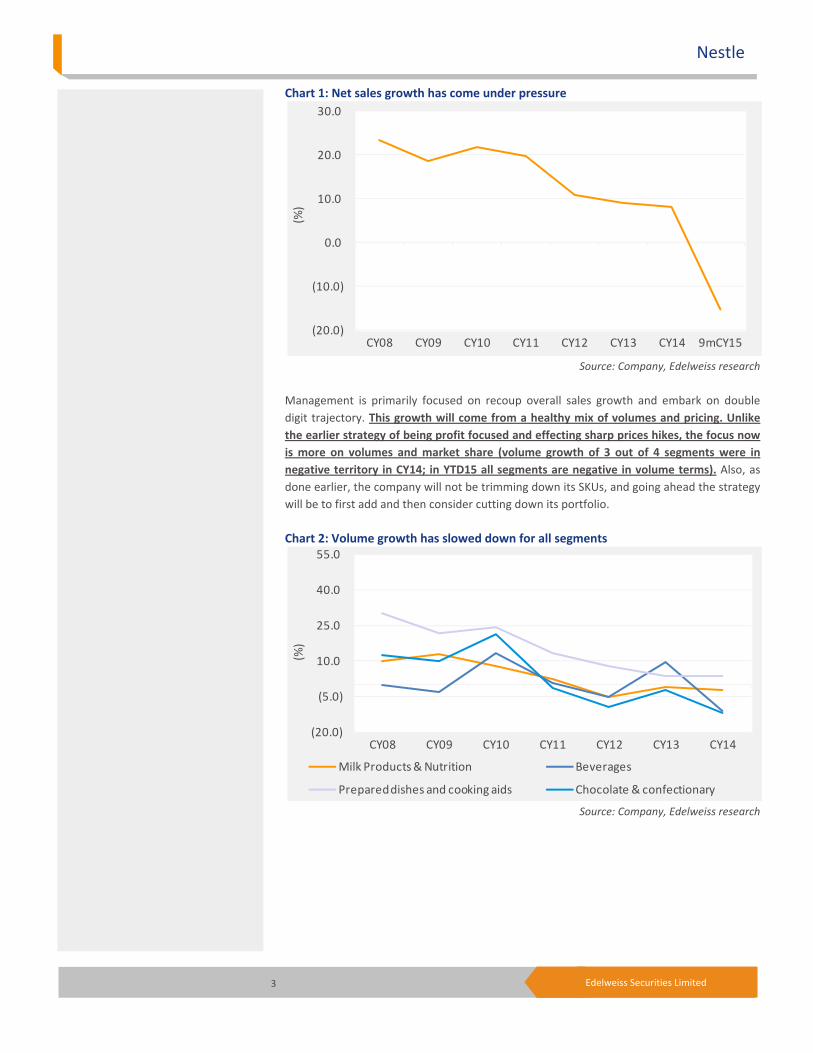
Chart 1: Net sales growth has come under pressure
Source: Company, Edelweiss research
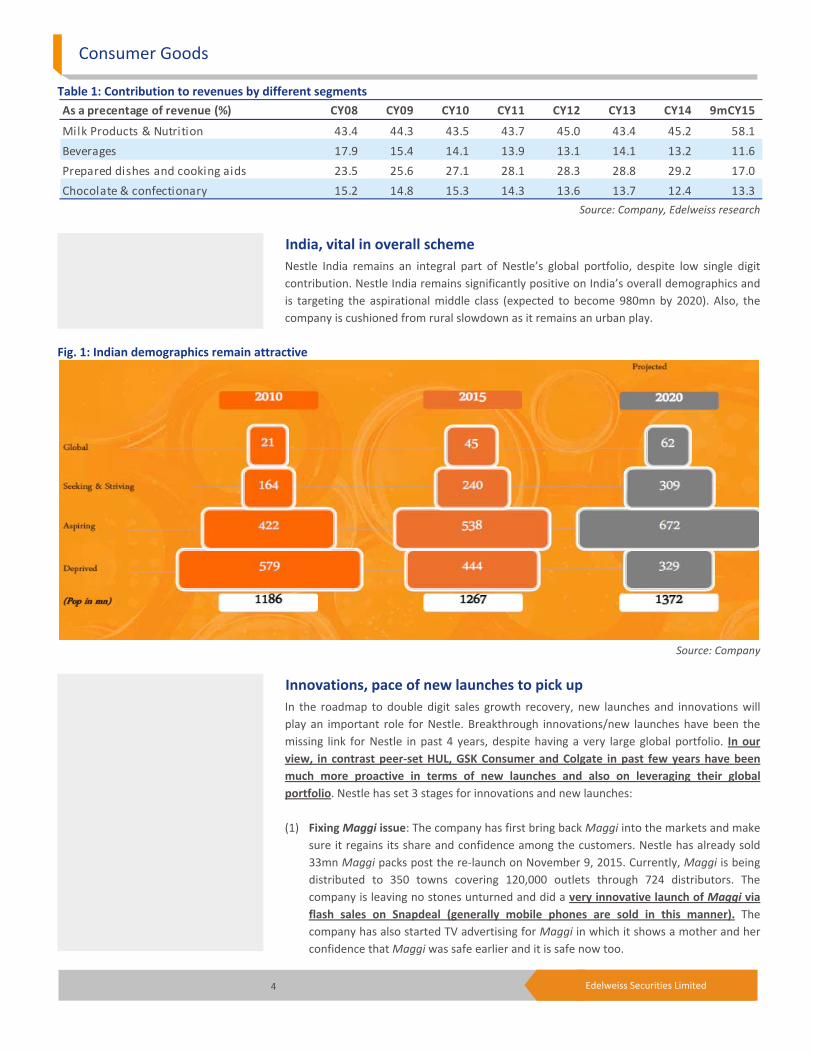
Management is primarily focused on recoup overall sales growth and embark on double digit trajectory. This growth will come from a healthy mix of volumes and pricing. Unlike the earlier strategy of being profit focused and effecting sharp prices hikes, the focus now is more on volumes and market share (volume growth of 3 out of 4 segments were in negative territory in CY14; in YTD15 all segments are negative in volume terms). Also, as done earlier, the company will not be trimming down its SKUs, and going ahead the strategy will be to first add and then consider cutting down its portfolio. Chart 2: Volume growth has slowed down for all segments
Source: Company, Edelweiss research
(20.0)
(10.0)
0.0
10.0
20.0
30.0
CY08 CY09 CY10 CY11 CY12 CY13 CY14 9mCY15
(%)
(20.0)
(5.0)
10.0
25.0
40.0
55.0
CY08 CY09 CY10 CY11 CY12 CY13 CY14
(%)
Milk Products & Nutrition Beverages
Prepared dishes and cooking aids Chocolate & confectionary
Consumer Goods
4 Edelweiss Securities Limited
Table 1: Contribution to revenues by different segments
Source: Company, Edelweiss research
India, vital in overall scheme Nestle India remains an integral part of Nestle’s global portfolio, despite low single digit contribution. Nestle India remains significantly positive on India’s overall demographics and is targeting the aspirational middle class (expected to become 980mn by 2020). Also, the company is cushioned from rural slowdown as it remains an urban play.
Fig. 1: Indian demographics remain attractive
Source: Company
Innovations, pace of new launches to pick up In the roadmap to double digit sales growth recovery, new launches and innovations will play an important role for Nestle. Breakthrough innovations/new launches have been the missing link for Nestle in past 4 years, despite having a very large global portfolio. In our view, in contrast peer-set HUL, GSK Consumer and Colgate in past few years have been much more proactive in terms of new launches and also on leveraging their global portfolio. Nestle has set 3 stages for innovations and new launches: (1) Fixing Maggi issue: The company has first bring back Maggi into the markets and make
sure it regains its share and confidence among the customers. Nestle has already sold 33mn Maggi packs post the re-launch on November 9, 2015. Currently, Maggi is being distributed to 350 towns covering 120,000 outlets through 724 distributors. The company is leaving no stones unturned and did a very innovative launch of Maggi via flash sales on Snapdeal (generally mobile phones are sold in this manner). The company has also started TV advertising for Maggi in which it shows a mother and her confidence that Maggi was safe earlier and it is safe now too.
As a precentage of revenue (%) CY08 CY09 CY10 CY11 CY12 CY13 CY14 9mCY15
Milk Products & Nutrition 43.4 44.3 43.5 43.7 45.0 43.4 45.2 58.1 Beverages 17.9 15.4 14.1 13.9 13.1 14.1 13.2 11.6 Prepared dishes and cooking aids 23.5 25.6 27.1 28.1 28.3 28.8 29.2 17.0 Chocolate & confectionary 15.2 14.8 15.3 14.3 13.6 13.7 12.4 13.3
Nestle
5 Edelweiss Securities Limited
Fig. 2: Flash sale of Maggi on Snapdeal
Source: Company
Fig. 3: Nestle and Maggi despite the fiasco remain one of the most valuable brand in india
Source:Company
(2) Ramping up innovations in existing segments: Nestle will be targeting new innovations
in existing segments, especially in chocolates & confectionaries and coffee & beverages. In chocolates & confectionaries, Cadbury remains the number 1 player, which has

Consumer Goods
6 Edelweiss Securities Limited
increased market share over the years largely on constant innovations and new launches (launched Cadbury Silk, Bounrville, Glow Bubbly, etc) which has been missing on part of Nestle despite having strong brands due to lower investments in the products. Similarly, being profit focussed led to losing market share to HUL in the coffee segment.
(3) Evaluating new categories: Nestle will evaluate new categories on the basis of size, sustainable growth and margins and also has the possibility of differentiation by Nestle. Nestle is globally present in various other categories and Nestle India might evaluate entering categories like Health Food Drinks (Milo), water, breakfast cereals, pet foods, etc.
Nestle: Categories where Nestle is present globally and their brands
Cereals
Chocopic - Whole grain with a chocolaty taste
Cini Minis – Has cool swirls on every piece with a cinnamon; it is made with whole grain, vitamins, iron and calcium.
Cookie Crisp - Chocolate chip cookie breakfast cereal made with whole grain and vitamins, calcium and iron.
Estrelitas - Star-shaped honey-coated breakfast cereal made with whole grain, containing important minerals, calcium and iron.
Fitness - Breakfast cereal made with whole grain and 10 vitamins and minerals, including calcium.
Nesquik Breakfast Cereal - Made of Nesquik (Nestle’s power drink) fortified with whole grain, minerals, iron and calcium.
Chocolates
Various global chocolate offerings missing in India include Aero (bubbly chocolate), Butterfinger (peanut butter chocolate bar), Callier, Crunch (chocolate bar with crisp rice), Orion, Smarties, Toll house (chocolate chip), Wonka (candies).
Nestle
7 Edelweiss Securities Limited
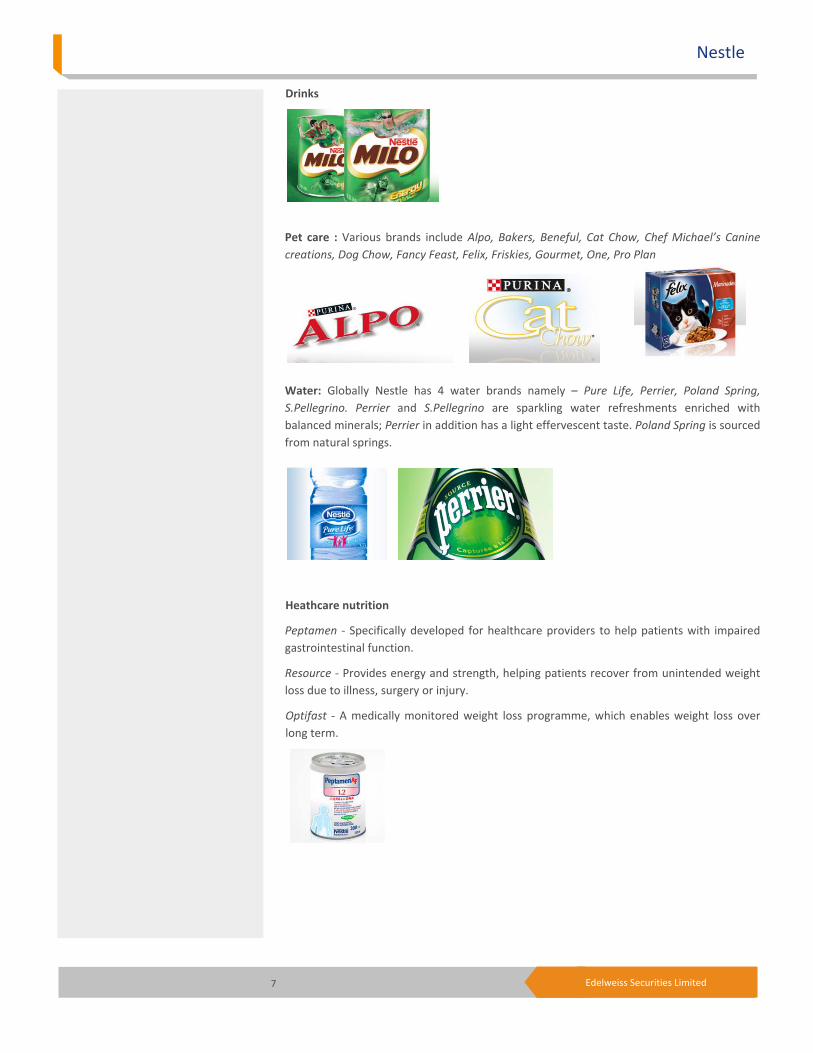
Drinks
Pet care : Various brands include Alpo, Bakers, Beneful, Cat Chow, Chef Michael’s Canine creations, Dog Chow, Fancy Feast, Felix, Friskies, Gourmet, One, Pro Plan
Water: Globally Nestle has 4 water brands namely – Pure Life, Perrier, Poland Spring, S.Pellegrino. Perrier and S.Pellegrino are sparkling water refreshments enriched with balanced minerals; Perrier in addition has a light effervescent taste. Poland Spring is sourced from natural springs.
Heathcare nutrition
Peptamen - Specifically developed for healthcare providers to help patients with impaired gastrointestinal function.
Resource - Provides energy and strength, helping patients recover from unintended weight loss due to illness, surgery or injury.
Optifast - A medically monitored weight loss programme, which enables weight loss over long term.
Consumer Goods
8 Edelweiss Securities Limited
Proactive pricing actions depending on category Nestlé India will now be more proactive as far as product pricing is concerned. However, this will depend on the category of operation. Action on pricing front depends on margins in the category. Margins differ from business to business. Hence, if a category has lower growth then margins are important for the company and it doesn’t make sense to take pricing action. However, if the category has good growth then lower margins are fine and the company can afford to take pricing action as it will be made up by volume growth. For example, the company has cut prices of Nestle A+ milk tetra pack prices by 20% to bring the product prices in parity to other players and also to garner market share. Similarly, prices of Nestle A+ dahi was reduced from INR30 to INR25 (~16.7%). On Ecommerce front too Nestle remains focused and believes it is an important part of its distribution channel. The company has also initiates some promotions in select SKUs of chocolates. Other highlights Improving organisation culture: Nestle will bring in more accountability and responsibility among its employees (the company has 7,200 employees) so that they are more empowered and motivated. Also, team work will be given importance so that each department is charged up and also ensures better functioning across departments. The company will also bring in changes in its sales team. These changes will be gradual, incremental but decisive. Zero tolerance for non compliance: This was always there in the DNA of Nestle, but now the degree of sensitisation has gone up manifolds. All suppliers are audited by Nestle; 300 personnel work in the area of food safety. The company has 11 labs: 9 internal and 2 external. Distribution: Nestle products are available via 3.9mn outlets out of the 8.8mn total outlets in India. Expectations: Greater innovations, higher engagement, more talent and people capabilities and increased consumer service engagement.
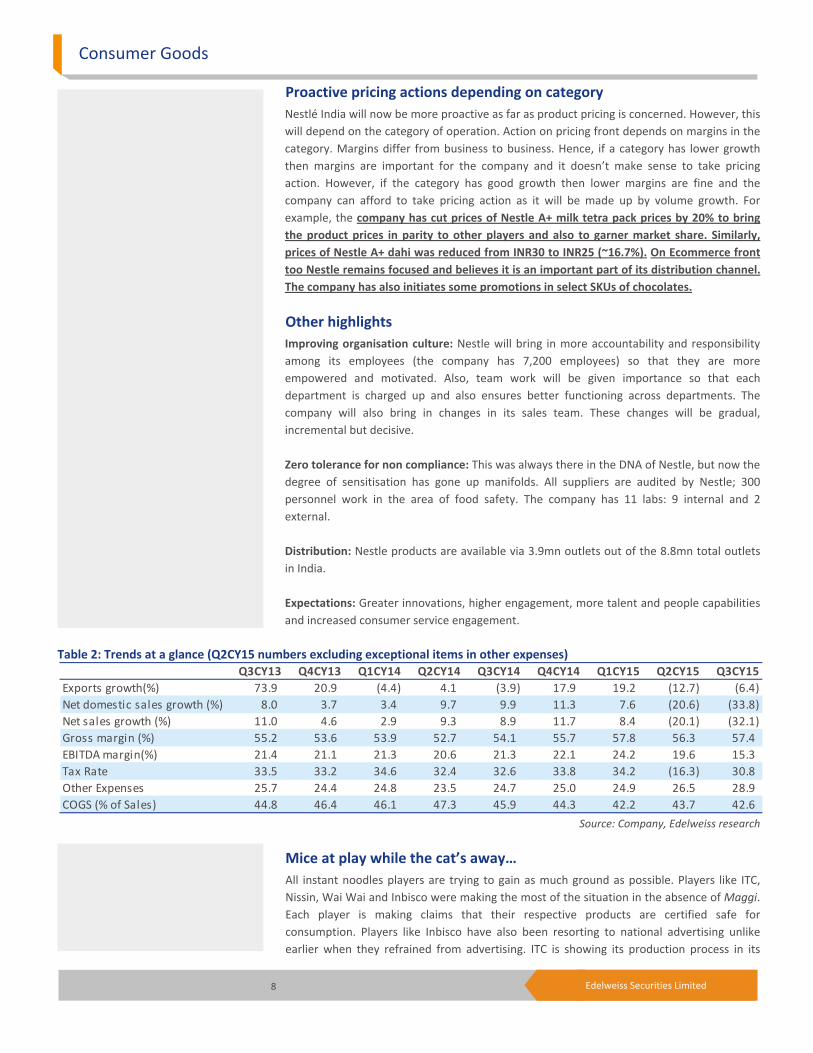
Table 2: Trends at a glance (Q2CY15 numbers excluding exceptional items in other expenses)
Source: Company, Edelweiss research
Mice at play while the cat’s away… All instant noodles players are trying to gain as much ground as possible. Players like ITC, Nissin, Wai Wai and Inbisco were making the most of the situation in the absence of Maggi. Each player is making claims that their respective products are certified safe for consumption. Players like Inbisco have also been resorting to national advertising unlike earlier when they refrained from advertising. ITC is showing its production process in its
Q3CY13 Q4CY13 Q1CY14 Q2CY14 Q3CY14 Q4CY14 Q1CY15 Q2CY15 Q3CY15Exports growth(%) 73.9 20.9 (4.4) 4.1 (3.9) 17.9 19.2 (12.7) (6.4) Net domestic sales growth (%) 8.0 3.7 3.4 9.7 9.9 11.3 7.6 (20.6) (33.8) Net sales growth (%) 11.0 4.6 2.9 9.3 8.9 11.7 8.4 (20.1) (32.1) Gross margin (%) 55.2 53.6 53.9 52.7 54.1 55.7 57.8 56.3 57.4 EBITDA margin(%) 21.4 21.1 21.3 20.6 21.3 22.1 24.2 19.6 15.3 Tax Rate 33.5 33.2 34.6 32.4 32.6 33.8 34.2 (16.3) 30.8 Other Expenses 25.7 24.4 24.8 23.5 24.7 25.0 24.9 26.5 28.9 COGS (% of Sales) 44.8 46.4 46.1 47.3 45.9 44.3 42.2 43.7 42.6
Nestle
9 Edelweiss Securities Limited
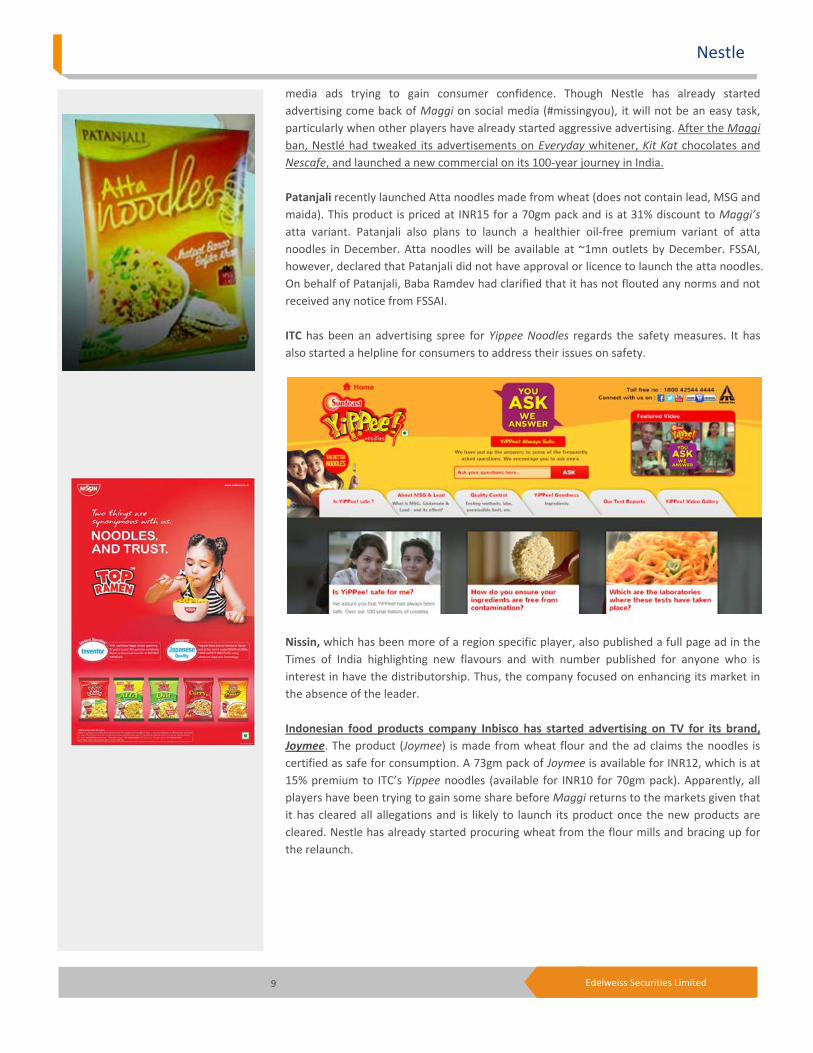
media ads trying to gain consumer confidence. Though Nestle has already started advertising come back of Maggi on social media (#missingyou), it will not be an easy task, particularly when other players have already started aggressive advertising. After the Maggi ban, Nestlé had tweaked its advertisements on Everyday whitener, Kit Kat chocolates and Nescafe, and launched a new commercial on its 100-year journey in India. Patanjali recently launched Atta noodles made from wheat (does not contain lead, MSG and maida). This product is priced at INR15 for a 70gm pack and is at 31% discount to Maggi’s atta variant. Patanjali also plans to launch a healthier oil-free premium variant of atta noodles in December. Atta noodles will be available at ~1mn outlets by December. FSSAI, however, declared that Patanjali did not have approval or licence to launch the atta noodles. On behalf of Patanjali, Baba Ramdev had clarified that it has not flouted any norms and not received any notice from FSSAI. ITC has been an advertising spree for Yippee Noodles regards the safety measures. It has also started a helpline for consumers to address their issues on safety.
Nissin, which has been more of a region specific player, also published a full page ad in the Times of India highlighting new flavours and with number published for anyone who is interest in have the distributorship. Thus, the company focused on enhancing its market in the absence of the leader. Indonesian food products company Inbisco has started advertising on TV for its brand, Joymee. The product (Joymee) is made from wheat flour and the ad claims the noodles is certified as safe for consumption. A 73gm pack of Joymee is available for INR12, which is at 15% premium to ITC’s Yippee noodles (available for INR10 for 70gm pack). Apparently, all players have been trying to gain some share before Maggi returns to the markets given that it has cleared all allegations and is likely to launch its product once the new products are cleared. Nestle has already started procuring wheat from the flour mills and bracing up for the relaunch.
Consumer Goods
10 Edelweiss Securities Limited
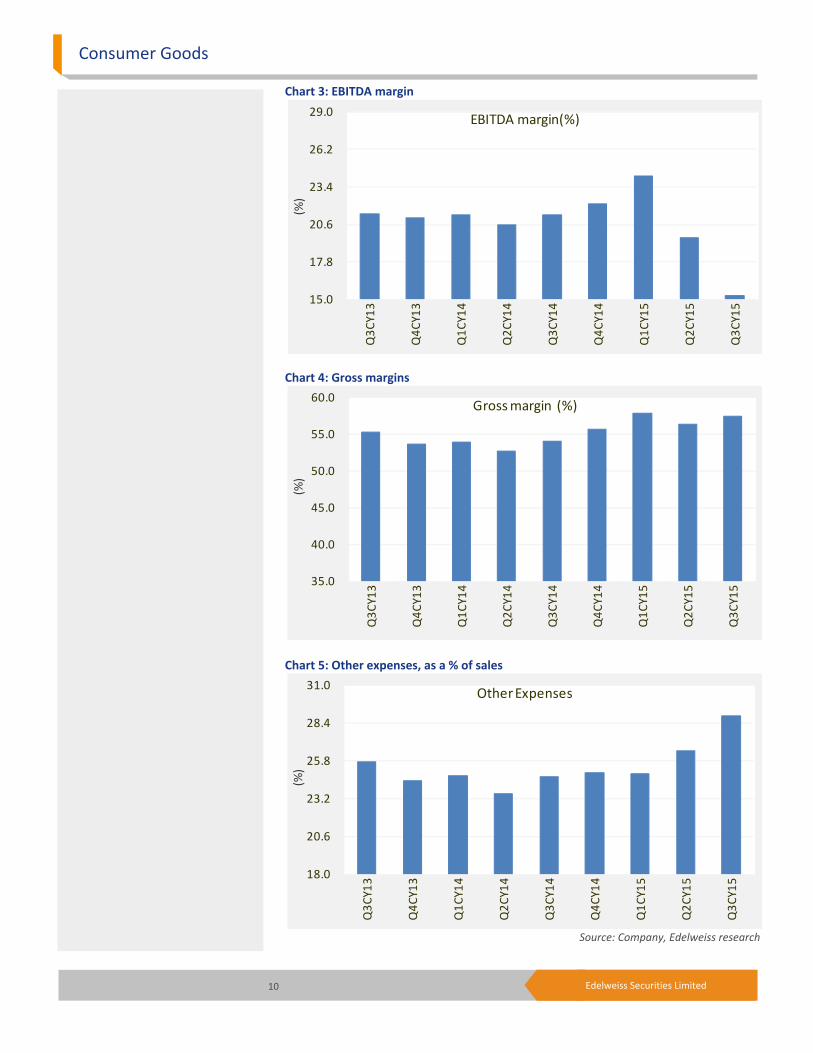
Chart 3: EBITDA margin
Chart 4: Gross margins
Chart 5: Other expenses, as a % of sales
Source: Company, Edelweiss research
15.0
17.8
20.6
23.4
26.2
29.0
Q3C
Y13
Q4C
Y13
Q1C
Y14
Q2C
Y14
Q3C
Y14
Q4C
Y14
Q1C
Y15
Q2C
Y15
Q3C
Y15
(%)
EBITDA margin(%)
35.0
40.0
45.0
50.0
55.0
60.0
Q3C
Y13
Q4C
Y13
Q1C
Y14
Q2C
Y14
Q3C
Y14
Q4C
Y14
Q1C
Y15
Q2C
Y15
Q3C
Y15
(%)
Gross margin (%)
18.0
20.6
23.2
25.8
28.4
31.0
Q3C
Y13
Q4C
Y13
Q1C
Y14
Q2C
Y14
Q3C
Y14
Q4C
Y14
Q1C
Y15
Q2C
Y15
Q3C
Y15
(%)
Other Expenses
Nestle
11 Edelweiss Securities Limited
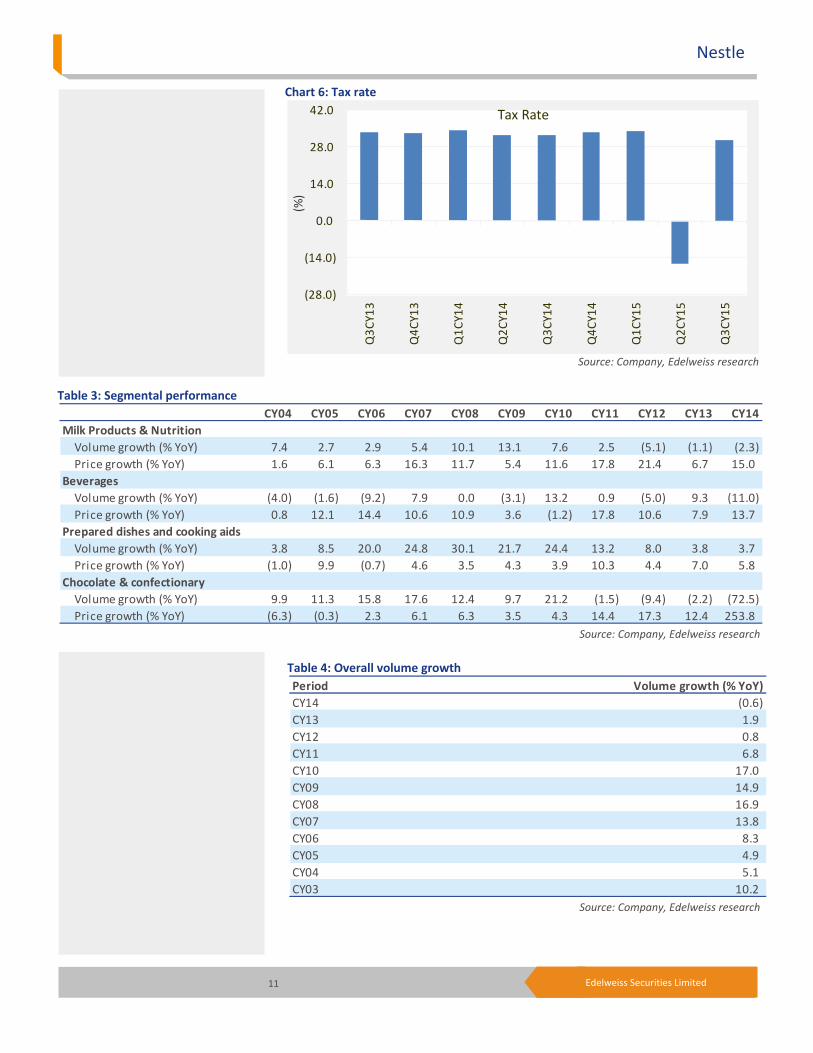
Chart 6: Tax rate
Source: Company, Edelweiss research
Table 3: Segmental performance
Source: Company, Edelweiss research
Table 4: Overall volume growth
Source: Company, Edelweiss research
(28.0)
(14.0)
0.0
14.0
28.0
42.0
Q3C
Y13
Q4C
Y13
Q1C
Y14
Q2C
Y14
Q3C
Y14
Q4C
Y14
Q1C
Y15
Q2C
Y15
Q3C
Y15
(%)
Tax Rate
CY04 CY05 CY06 CY07 CY08 CY09 CY10 CY11 CY12 CY13 CY14Milk Products & Nutrition Volume growth (% YoY) 7.4 2.7 2.9 5.4 10.1 13.1 7.6 2.5 (5.1) (1.1) (2.3) Price growth (% YoY) 1.6 6.1 6.3 16.3 11.7 5.4 11.6 17.8 21.4 6.7 15.0 Beverages Volume growth (% YoY) (4.0) (1.6) (9.2) 7.9 0.0 (3.1) 13.2 0.9 (5.0) 9.3 (11.0) Price growth (% YoY) 0.8 12.1 14.4 10.6 10.9 3.6 (1.2) 17.8 10.6 7.9 13.7 Prepared dishes and cooking aids Volume growth (% YoY) 3.8 8.5 20.0 24.8 30.1 21.7 24.4 13.2 8.0 3.8 3.7 Price growth (% YoY) (1.0) 9.9 (0.7) 4.6 3.5 4.3 3.9 10.3 4.4 7.0 5.8 Chocolate & confectionary Volume growth (% YoY) 9.9 11.3 15.8 17.6 12.4 9.7 21.2 (1.5) (9.4) (2.2) (72.5) Price growth (% YoY) (6.3) (0.3) 2.3 6.1 6.3 3.5 4.3 14.4 17.3 12.4 253.8
Period Volume growth (% YoY)CY14 (0.6) CY13 1.9 CY12 0.8 CY11 6.8 CY10 17.0 CY09 14.9 CY08 16.9 CY07 13.8 CY06 8.3 CY05 4.9 CY04 5.1 CY03 10.2
Consumer Goods
12 Edelweiss Securities Limited
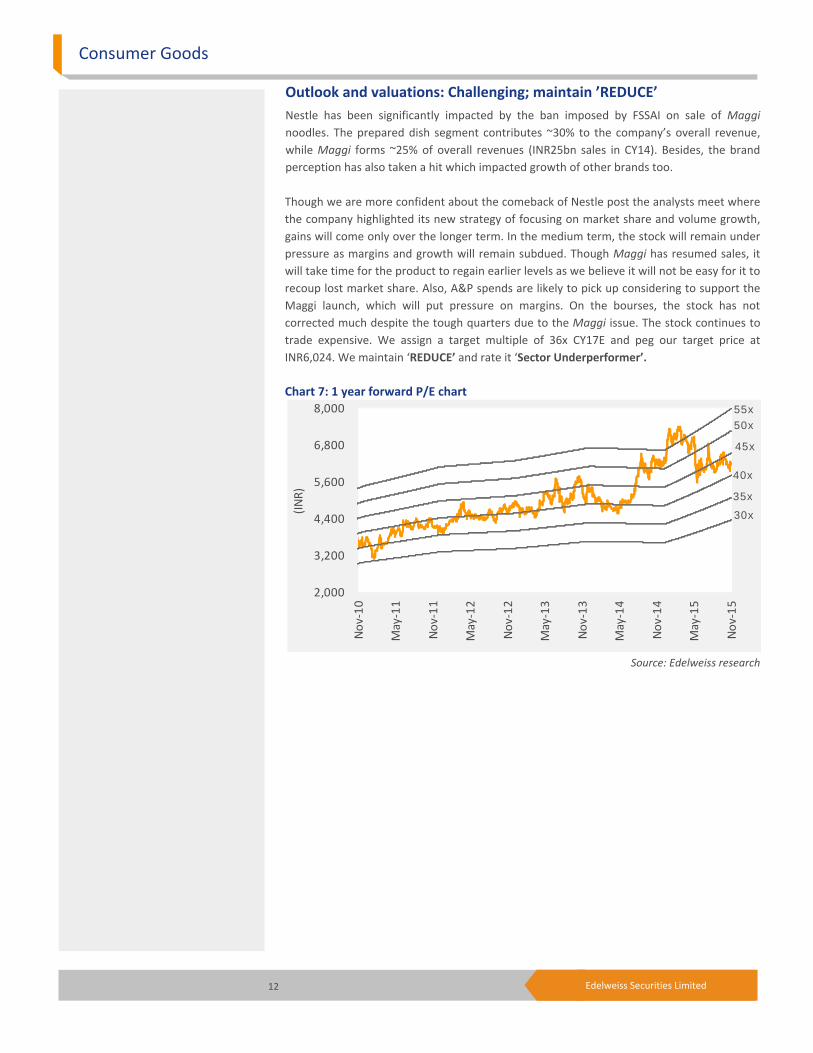
Outlook and valuations: Challenging; maintain ’REDUCE’ Nestle has been significantly impacted by the ban imposed by FSSAI on sale of Maggi noodles. The prepared dish segment contributes ~30% to the company’s overall revenue, while Maggi forms ~25% of overall revenues (INR25bn sales in CY14). Besides, the brand perception has also taken a hit which impacted growth of other brands too. Though we are more confident about the comeback of Nestle post the analysts meet where the company highlighted its new strategy of focusing on market share and volume growth, gains will come only over the longer term. In the medium term, the stock will remain under pressure as margins and growth will remain subdued. Though Maggi has resumed sales, it will take time for the product to regain earlier levels as we believe it will not be easy for it to recoup lost market share. Also, A&P spends are likely to pick up considering to support the Maggi launch, which will put pressure on margins. On the bourses, the stock has not corrected much despite the tough quarters due to the Maggi issue. The stock continues to trade expensive. We assign a target multiple of 36x CY17E and peg our target price at INR6,024. We maintain ‘REDUCE’ and rate it ‘Sector Underperformer’. Chart 7: 1 year forward P/E chart
Source: Edelweiss research
2,000
3,200
4,400
5,600
6,800
8,000
Nov-
10
May
-11
Nov-
11
May
-12
Nov-
12
May
-13
Nov-
13
May
-14
Nov-
14
May
-15
Nov-
15
(INR)
55x
30x
35x
45x
40x
50x
Nestle
13 Edelweiss Securities Limited
Company Description Nestle, a 62.8% subsidiary of its parent Nestlé S.A. of Switzerland, is India’s third largest FMCG company after HUL and ITC. The company set up its first factory at Moga, Punjab, to develop milk production. Over the years, Nestlé has set up seven factories across the country, and is now involved in manufacturing and marketing a range of quality products. It has well-established brands, including Maggi, Nescafe, Lactogen, KitKat, and Milkmaid. Nestlé enjoys leadership position in its core categories like baby foods, instant noodles, and instant coffee. It enjoys a distinct advantage over competitors in the F&B space on account of its strong focus on developing products around the nutrition, health, and wellness platform, and a culture of renovation and innovation in its offerings, backed by strong parent support. Investment Theme Nestle has been significantly impacted by the ban imposed by FSSAI on sale of Maggi noodles. The prepared dish segment contributes ~30% to the company’s overall revenue, while Maggi forms ~25% of overall revenue (INR25bn sales in CY14). Apart from this, the brand perception has also taken a hit which impacted growth of other brands as well. It will be an uphill task for Nestle to re-establish brand equity and win initial market share, especially given the fierce competition by all instant noodle players who are claiming to be certified safe for consumption. In the near term ad and promotion spends will be high putting margins under pressure. We believe Nestle is unlikely to garner its earlier 70% share of the pie. Key Risks Instant success of Maggi post re-launch: Consumers instantly returning back to Maggi leaving all competition at bay. Aggression by the new MD and Chairman leading to high growth across the portfolio.
14 Edelweiss Securities Limited
Consumer Goods
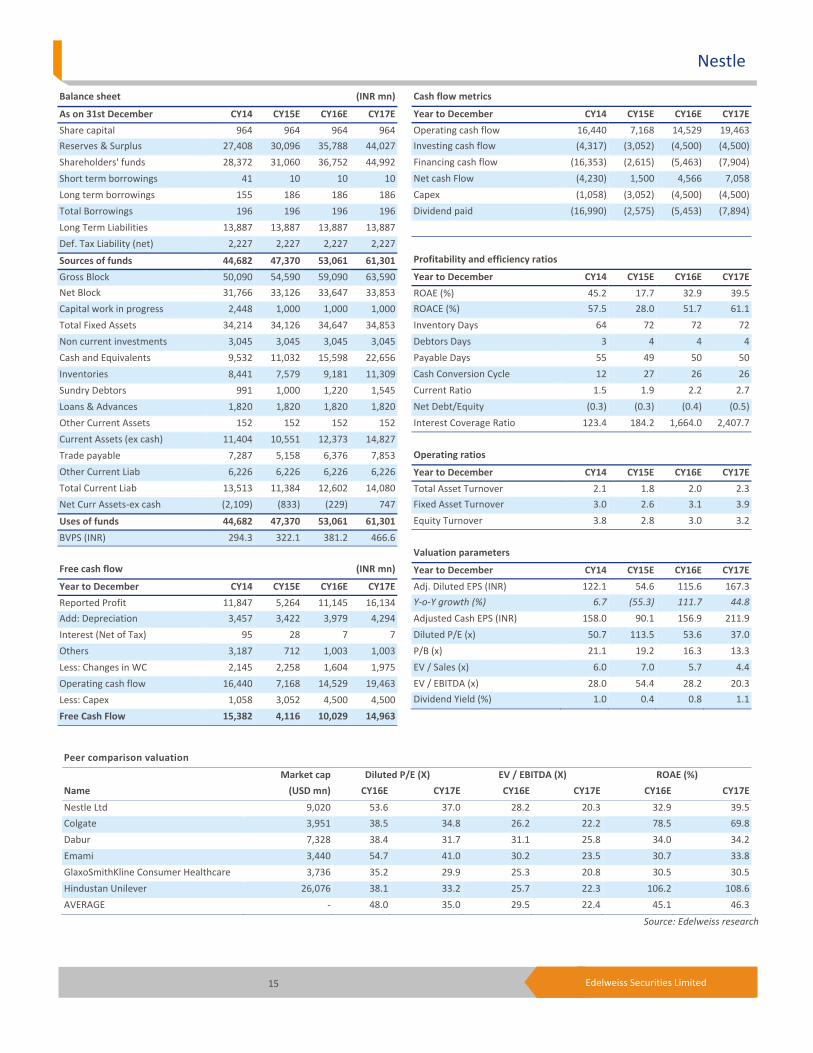
Financial Statements
Income statement (INR mn)
Year to December CY14 CY15E CY16E CY17E
Net revenue 98,063 83,549 102,021 129,611Other Operating Income 486 334 541 546Operating Revenue 98,548 83,882 102,562 130,157Materials costs 45,240 38,420 46,541 57,330Gross profit 53,309 45,462 56,020 72,827Employee costs 8,197 8,606 9,182 11,665Other Expenses 19,644 21,889 20,404 25,663Ad. & sales costs 4,455 4,177 5,815 7,129EBITDA 21,013 10,790 20,619 28,371Depreciation 3,457 3,422 3,979 4,294EBIT 17,556 7,368 16,640 24,077Add: Other income 873 1,001 1,004 1,014Prov. for contingencies 614 700 1,000 1,000Less: Interest Expense 142 40 10 10Profit Before Tax 17,674 7,628 16,634 24,081Less: Provision for Tax 5,897 2,365 5,489 7,947Reported Profit 11,847 5,264 11,145 16,134Exceptional Items 70 - - -Adjusted Profit 11,777 5,264 11,145 16,134Shares o /s (mn) 96 96 96 96Adjusted Basic EPS 122.1 54.6 115.6 167.3Diluted shares o/s (mn) 96 96 96 96Adjusted Diluted EPS 122.1 54.6 115.6 167.3Adjusted Cash EPS 158.0 90.1 156.9 211.9Dividend per share (DPS) 63.0 22.9 48.5 70.3Dividend Payout Ratio(%) 51.3 42.0 42.0 42.0
Common size metrics
Year to December CY14 CY15E CY16E CY17E
Materials costs 45.9 45.8 45.4 44.0Staff costs 8.3 10.3 9.0 9.0Ad. & sales costs 4.5 5.0 5.7 5.5Depreciation 3.5 4.1 3.9 3.3EBITDA margins 21.3 12.9 20.1 21.8Net Profit margins 12.0 6.3 10.9 12.4
Growth ratios (%)
Year to December CY14 CY15E CY16E CY17E
Revenues 8.2 (14.8) 22.1 27.0EBITDA 4.0 (48.7) 91.1 37.6Adjusted Profit 6.7 (55.3) 111.7 44.8EPS 6.7 (55.3) 111.7 44.8
Key Assumptions
Year to December FY14 FY15 FY16E FY17E
Macro
GDP(Y-o-Y %) 6.9 7.4 8.0 8.7 Inflation (Avg) 9.5 5.9 5.0 5.0 Repo rate (exit rate) 8.0 7.5 6.8 6.5 USD/INR (Avg) 60.5 61.1 64.5 65.0Company
Revenue growth (Y-o-Y %)
Volume growth (domestic) (2.9) (6.4) 13.8 20.3 Price change (domestic) 11.6 3.6 9.3 8.8 Milk prod,Nutri vol gr (2.3) 1.0 5.0 7.0 Milk Prod,Nutri price gr 15.0 4.0 10.0 10.0 Beverages vols increase (11.0) 3.0 8.0 10.0 Beverages price increase 13.7 4.0 8.0 8.0 Prepared dishes vol gr 3.7 (65.0) 55.0 65.0 Prepared dishes price gr 5.8 1.0 6.0 6.0 Chocolate vol gr (12.1) 3.0 6.0 6.0 Chocolate price gr 10.8 4.0 12.0 10.0 Excise (% Gross Sales) 3.2 3.2 3.2 3.2 EBITDA margin assumpn COGS as % of sales 45.9 45.8 45.4 44.0 Fresh milk as % of sales 24.8 30.0 28.5 31.2 Milk deriv as % of sales 14.7 17.9 16.8 16.4 Grain flour as % of sale 9.9 4.1 6.7 5.7 Edible oils as % of sale 7.8 7.3 6.6 5.9 Cofe & chic (% of sales) 8.4 10.3 9.4 9.1 Sugar as % of sales 3.9 4.9 4.6 4.3 Pack mat as % of sales 16.8 11.8 13.7 13.9 Financial assumptions Tax rate (%) 33.4 31.0 33.0 33.0 Capex (INR mn) 1,058 3,052 4,500 4,500 Debtor days 3 4 4 4 Inventory days 64 72 72 72 Payable days 55 49 50 50 Cash conversion cycle 12 27 26 26 Int rate on debt (%) 72.7 20.4 5.1 5.1 Dividend payout 51.3 42.0 42.0 42.0 Yield on cash 30.5 14.0 14.0 14.0
15 Edelweiss Securities Limited
Nestle
Peer comparison valuation
Market cap Diluted P/E (X) EV / EBITDA (X) ROAE (%)
Name (USD mn) CY16E CY17E CY16E CY17E CY16E CY17E
Nestle Ltd 9,020 53.6 37.0 28.2 20.3 32.9 39.5Colgate 3,951 38.5 34.8 26.2 22.2 78.5 69.8Dabur 7,328 38.4 31.7 31.1 25.8 34.0 34.2Emami 3,440 54.7 41.0 30.2 23.5 30.7 33.8GlaxoSmithKline Consumer Healthcare 3,736 35.2 29.9 25.3 20.8 30.5 30.5Hindustan Unilever 26,076 38.1 33.2 25.7 22.3 106.2 108.6AVERAGE - 48.0 35.0 29.5 22.4 45.1 46.3
Source: Edelweiss research
Cash flow metrics
Year to December CY14 CY15E CY16E CY17E
Operating cash flow 16,440 7,168 14,529 19,463Investing cash flow (4,317) (3,052) (4,500) (4,500)Financing cash flow (16,353) (2,615) (5,463) (7,904)Net cash Flow (4,230) 1,500 4,566 7,058Capex (1,058) (3,052) (4,500) (4,500)Dividend paid (16,990) (2,575) (5,453) (7,894)
Profitability and efficiency ratios
Year to December CY14 CY15E CY16E CY17E
ROAE (%) 45.2 17.7 32.9 39.5ROACE (%) 57.5 28.0 51.7 61.1Inventory Days 64 72 72 72Debtors Days 3 4 4 4Payable Days 55 49 50 50Cash Conversion Cycle 12 27 26 26Current Ratio 1.5 1.9 2.2 2.7Net Debt/Equity (0.3) (0.3) (0.4) (0.5)Interest Coverage Ratio 123.4 184.2 1,664.0 2,407.7
Operating ratios
Year to December CY14 CY15E CY16E CY17E
Total Asset Turnover 2.1 1.8 2.0 2.3Fixed Asset Turnover 3.0 2.6 3.1 3.9Equity Turnover 3.8 2.8 3.0 3.2
Valuation parameters
Year to December CY14 CY15E CY16E CY17E
Adj. Diluted EPS (INR) 122.1 54.6 115.6 167.3Y-o-Y growth (%) 6.7 (55.3) 111.7 44.8
Adjusted Cash EPS (INR) 158.0 90.1 156.9 211.9Diluted P/E (x) 50.7 113.5 53.6 37.0P/B (x) 21.1 19.2 16.3 13.3EV / Sales (x) 6.0 7.0 5.7 4.4EV / EBITDA (x) 28.0 54.4 28.2 20.3Dividend Yield (%) 1.0 0.4 0.8 1.1
Balance sheet (INR mn)
As on 31st December CY14 CY15E CY16E CY17E
Share capital 964 964 964 964Reserves & Surplus 27,408 30,096 35,788 44,027Shareholders' funds 28,372 31,060 36,752 44,992Short term borrowings 41 10 10 10Long term borrowings 155 186 186 186Total Borrowings 196 196 196 196Long Term Liabilities 13,887 13,887 13,887 13,887Def. Tax Liability (net) 2,227 2,227 2,227 2,227
Sources of funds 44,682 47,370 53,061 61,301
Gross Block 50,090 54,590 59,090 63,590Net Block 31,766 33,126 33,647 33,853Capital work in progress 2,448 1,000 1,000 1,000Total Fixed Assets 34,214 34,126 34,647 34,853Non current investments 3,045 3,045 3,045 3,045Cash and Equivalents 9,532 11,032 15,598 22,656Inventories 8,441 7,579 9,181 11,309Sundry Debtors 991 1,000 1,220 1,545Loans & Advances 1,820 1,820 1,820 1,820Other Current Assets 152 152 152 152Current Assets (ex cash) 11,404 10,551 12,373 14,827Trade payable 7,287 5,158 6,376 7,853Other Current Liab 6,226 6,226 6,226 6,226Total Current Liab 13,513 11,384 12,602 14,080Net Curr Assets-ex cash (2,109) (833) (229) 747
Uses of funds 44,682 47,370 53,061 61,301
BVPS (INR) 294.3 322.1 381.2 466.6
Free cash flow (INR mn)
Year to December CY14 CY15E CY16E CY17E
Reported Profit 11,847 5,264 11,145 16,134Add: Depreciation 3,457 3,422 3,979 4,294Interest (Net of Tax) 95 28 7 7Others 3,187 712 1,003 1,003Less: Changes in WC 2,145 2,258 1,604 1,975Operating cash flow 16,440 7,168 14,529 19,463Less: Capex 1,058 3,052 4,500 4,500Free Cash Flow 15,382 4,116 10,029 14,963
16 Edelweiss Securities Limited
Consumer Goods
Perc. Holding Perc. Holding
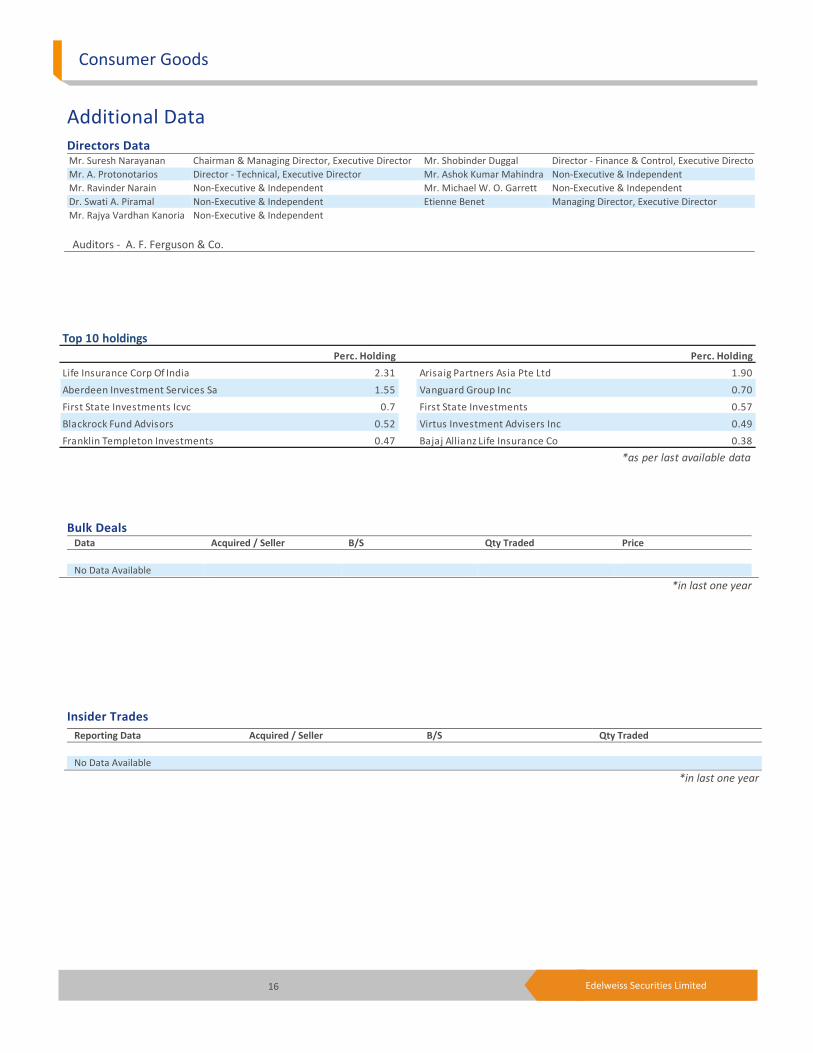
Life Insurance Corp Of India 2.31 Arisaig Partners Asia Pte Ltd 1.90Aberdeen Investment Services Sa 1.55 Vanguard Group Inc 0.70First State Investments Icvc 0.7 First State Investments 0.57Blackrock Fund Advisors 0.52 Virtus Investment Advisers Inc 0.49Franklin Templeton Investments 0.47 Bajaj Allianz Life Insurance Co 0.38
Top 10 holdings
*as per last available data
Insider Trades Reporting Data Acquired / Seller B/S Qty Traded No Data Available
*in last one year
Bulk Deals Data Acquired / Seller B/S Qty Traded Price No Data Available
*in last one year
Additional Data
Directors Data Mr. Suresh Narayanan Chairman & Managing Director, Executive Director Mr. Shobinder Duggal Director - Finance & Control, Executive DirectorMr. A. Protonotarios Director - Technical, Executive Director Mr. Ashok Kumar Mahindra Non-Executive & IndependentMr. Ravinder Narain Non-Executive & Independent Mr. Michael W. O. Garrett Non-Executive & IndependentDr. Swati A. Piramal Non-Executive & Independent Etienne Benet Managing Director, Executive DirectorMr. Rajya Vardhan Kanoria Non-Executive & Independent
Auditors - A. F. Ferguson & Co.
17 Edelweiss Securities Limited
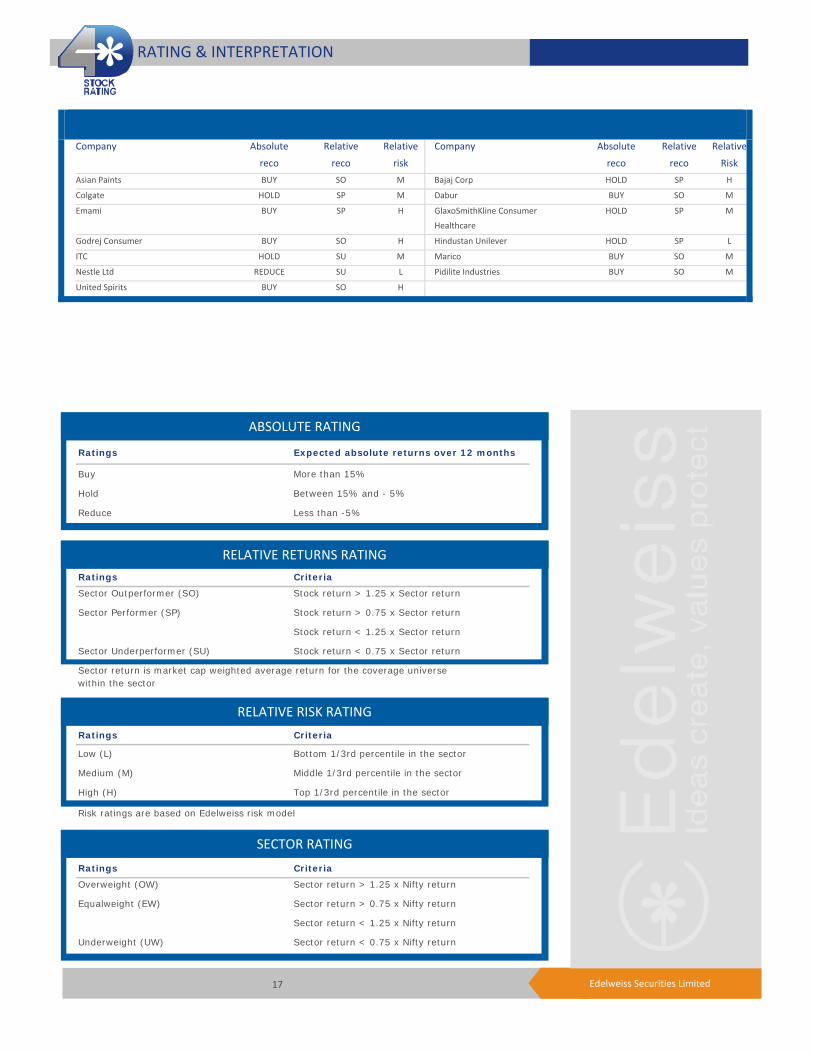
Company Absolute
reco
Relative
reco
Relative
risk
Company Absolute
reco
Relative
reco
Relative
Risk Asian Paints BUY SO M Bajaj Corp HOLD SP H
Colgate HOLD SP M Dabur BUY SO M
Emami BUY SP H GlaxoSmithKline Consumer Healthcare
HOLD SP M
Godrej Consumer BUY SO H Hindustan Unilever HOLD SP L
ITC HOLD SU M Marico BUY SO M
Nestle Ltd REDUCE SU L Pidilite Industries BUY SO M
United Spirits BUY SO H
RATING & INTERPRETATION
ABSOLUTE RATING
Ratings Expected absolute returns over 12 months
Buy More than 15%
Hold Between 15% and - 5%
Reduce Less than -5%
RELATIVE RETURNS RATING Ratings Criteria
Sector Outperformer (SO) Stock return > 1.25 x Sector return
Sector Performer (SP) Stock return > 0.75 x Sector return
Stock return < 1.25 x Sector return
Sector Underperformer (SU) Stock return < 0.75 x Sector return
Sector return is market cap weighted average return for the coverage universe within the sector
RELATIVE RISK RATINGRatings Criteria
Low (L) Bottom 1/3rd percentile in the sector
Medium (M) Middle 1/3rd percentile in the sector
High (H) Top 1/3rd percentile in the sector
Risk ratings are based on Edelweiss risk model
SECTOR RATING Ratings Criteria
Overweight (OW) Sector return > 1.25 x Nifty return
Equalweight (EW) Sector return > 0.75 x Nifty return
Sector return < 1.25 x Nifty return
Underweight (UW) Sector return < 0.75 x Nifty return

18 Edelweiss Securities Limited
Consumer Goods
Edelweiss Securities Limited, Edelweiss House, off C.S.T. Road, Kalina, Mumbai – 400 098. Board: (91-22) 4009 4400, Email: [email protected]
Nirav Sheth
Head Research
Coverage group(s) of stocks by primary analyst(s): Consumer Goods Asian Paints, Bajaj Corp, Colgate, Dabur, Godrej Consumer , Emami, Hindustan Unilever, ITC, Marico, Nestle Ltd, Pidilite Industries, GlaxoSmithKline Consumer Healthcare, United Spirits
Distribution of Ratings / Market Cap
Edelweiss Research Coverage Universe
Rating Distribution* 155 45 8 208* stocks under review
Market Cap (INR) 151 54 3
Date Company Title Price (INR) Recos
Recent Research
19-Nov-15 Consumer Goods
Rural bites, margin excites; Result Review
09-Nov-15 GSK Consumer Healthcare
Benign costs spur margin; rural, exports pummel volume; Result Update
5,854 Hold
05-Nov-15 Consumer Goods
Maggi back in reckoning, but will it regain lost glory?; EdelFlash
> 50bn Between 10bn and 50 bn < 10bn
Buy Hold Reduce Total
Rating Interpretation
Buy appreciate more than 15% over a 12-month period
Hold appreciate up to 15% over a 12-month period
Reduce depreciate more than 5% over a 12-month period
Rating Expected to
One year price chart
4,000
4,800
5,600
6,400
7,200
8,000
Nov-
14
Dec-
14
Jan-
15
Feb-
15
Mar
-15
Apr-
15
May
-15
Jun-
15
Jul-1
5
Aug-
15
Sep-
15
Oct
-15
Nov-
15
(INR)
Nestle
19 Edelweiss Securities Limited
Nestle
DISCLAIMER
Edelweiss Securities Limited (“ESL” or “Research Entity”) is regulated by the Securities and Exchange Board of India (“SEBI”) and is licensed to carry on the business of broking, depository services and related activities. The business of ESL and its Associates (list available on www.edelweissfin.com) are organized around five broad business groups – Credit including Housing and SME Finance, Commodities, Financial Markets, Asset Management and Life Insurance.
This Report has been prepared by Edelweiss Securities Limited in the capacity of a Research Analyst having SEBI Registration No.INH200000121 and distributed as per SEBI (Research Analysts) Regulations 2014. This report does not constitute an offer or solicitation for the purchase or sale of any financial instrument or as an official confirmation of any transaction. Securities as defined in clause (h) of section 2 of the Securities Contracts (Regulation) Act, 1956 includes Financial Instruments and Currency Derivatives. The information contained herein is from publicly available data or other sources believed to be reliable. This report is provided for assistance only and is not intended to be and must not alone be taken as the basis for an investment decision. The user assumes the entire risk of any use made of this information. Each recipient of this report should make such investigation as it deems necessary to arrive at an independent evaluation of an investment in Securities referred to in this document (including the merits and risks involved), and should consult his own advisors to determine the merits and risks of such investment. The investment discussed or views expressed may not be suitable for all investors.
This information is strictly confidential and is being furnished to you solely for your information. This information should not be reproduced or redistributed or passed on directly or indirectly in any form to any other person or published, copied, in whole or in part, for any purpose. This report is not directed or intended for distribution to, or use by, any person or entity who is a citizen or resident of or located in any locality, state, country or other jurisdiction, where such distribution, publication, availability or use would be contrary to law, regulation or which would subject ESL and associates / group companies to any registration or licensing requirements within such jurisdiction. The distribution of this report in certain jurisdictions may be restricted by law, and persons in whose possession this report comes, should observe, any such restrictions. The information given in this report is as of the date of this report and there can be no assurance that future results or events will be consistent with this information. This information is subject to change without any prior notice. ESL reserves the right to make modifications and alterations to this statement as may be required from time to time. ESL or any of its associates / group companies shall not be in any way responsible for any loss or damage that may arise to any person from any inadvertent error in the information contained in this report. ESL is committed to providing independent and transparent recommendation to its clients. Neither ESL nor any of its associates, group companies, directors, employees, agents or representatives shall be liable for any damages whether direct, indirect, special or consequential including loss of revenue or lost profits that may arise from or in connection with the use of the information. Our proprietary trading and investment businesses may make investment decisions that are inconsistent with the recommendations expressed herein. Past performance is not necessarily a guide to future performance .The disclosures of interest statements incorporated in this report are provided solely to enhance the transparency and should not be treated as endorsement of the views expressed in the report. The information provided in these reports remains, unless otherwise stated, the copyright of ESL. All layout, design, original artwork, concepts and other Intellectual Properties, remains the property and copyright of ESL and may not be used in any form or for any purpose whatsoever by any party without the express written permission of the copyright holders.
ESL shall not be liable for any delay or any other interruption which may occur in presenting the data due to any reason including network (Internet) reasons or snags in the system, break down of the system or any other equipment, server breakdown, maintenance shutdown, breakdown of communication services or inability of the ESL to present the data. In no event shall ESL be liable for any damages, including without limitation direct or indirect, special, incidental, or consequential damages, losses or expenses arising in connection with the data presented by the ESL through this report.
We offer our research services to clients as well as our prospects. Though this report is disseminated to all the customers simultaneously, not all customers may receive this report at the same time. We will not treat recipients as customers by virtue of their receiving this report.
ESL and its associates, officer, directors, and employees, research analyst (including relatives) worldwide may: (a) from time to time, have long or short positions in, and buy or sell the Securities, mentioned herein or (b) be engaged in any other transaction involving such Securities and earn brokerage or other compensation or act as a market maker in the financial instruments of the subject company/company(ies) discussed herein or act as advisor or lender/borrower to such company(ies) or have other potential/material conflict of interest with respect to any recommendation and related information and opinions at the time of publication of research report or at the time of public appearance. ESL may have proprietary long/short position in the above mentioned scrip(s) and therefore should be considered as interested. The views provided herein are general in nature and do not consider risk appetite or investment objective of any particular investor; readers are requested to take independent professional advice before investing. This should not be construed as invitation or solicitation to do business with ESL.
20 Edelweiss Securities Limited
Consumer Goods
ESL or its associates may have received compensation from the subject company in the past 12 months. ESL or its associates may have managed or co-managed public offering of securities for the subject company in the past 12 months. ESL or its associates may have received compensation for investment banking or merchant banking or brokerage services from the subject company in the past 12 months. ESL or its associates may have received any compensation for products or services other than investment banking or merchant banking or brokerage services from the subject company in the past 12 months. ESL or its associates have not received any compensation or other benefits from the Subject Company or third party in connection with the research report. Research analyst or his/her relative or ESL’s associates may have financial interest in the subject company. ESL and/or its Group Companies, their Directors, affiliates and/or employees may have interests/ positions, financial or otherwise in the Securities/Currencies and other investment products mentioned in this report. ESL, its associates, research analyst and his/her relative may have other potential/material conflict of interest with respect to any recommendation and related information and opinions at the time of publication of research report or at the time of public appearance.
Participants in foreign exchange transactions may incur risks arising from several factors, including the following: ( i) exchange rates can be volatile and are subject to large fluctuations; ( ii) the value of currencies may be affected by numerous market factors, including world and national economic, political and regulatory events, events in equity and debt markets and changes in interest rates; and (iii) currencies may be subject to devaluation or government imposed exchange controls which could affect the value of the currency. Investors in securities such as ADRs and Currency Derivatives, whose values are affected by the currency of an underlying security, effectively assume currency risk.
Research analyst has served as an officer, director or employee of subject Company: No
ESL has financial interest in the subject companies: No
ESL’s Associates may have actual / beneficial ownership of 1% or more securities of the subject company at the end of the month immediately preceding the date of publication of research report.
Research analyst or his/her relative has actual/beneficial ownership of 1% or more securities of the subject company at the end of the month immediately preceding the date of publication of research report: No
ESL has actual/beneficial ownership of 1% or more securities of the subject company at the end of the month immediately preceding the date of publication of research report: No
Subject company may have been client during twelve months preceding the date of distribution of the research report.
There were no instances of non-compliance by ESL on any matter related to the capital markets, resulting in significant and material disciplinary action during the last three years except that ESL had submitted an offer of settlement with Securities and Exchange commission, USA (SEC) and the same has been accepted by SEC without admitting or denying the findings in relation to their charges of non registration as a broker dealer.
A graph of daily closing prices of the securities is also available at www.nseindia.com
Analyst Certification:
The analyst for this report certifies that all of the views expressed in this report accurately reflect his or her personal views about the subject company or companies and its or their securities, and no part of his or her compensation was, is or will be, directly or indirectly related to specific recommendations or views expressed in this report.
Additional Disclaimers
Disclaimer for U.S. Persons This research report is a product of Edelweiss Securities Limited, which is the employer of the research analyst(s) who has prepared the research report. The research analyst(s) preparing the research report is/are resident outside the United States (U.S.) and are not associated persons of any U.S. regulated broker-dealer and therefore the analyst(s) is/are not subject to supervision by a U.S. broker-dealer, and is/are not required to satisfy the regulatory licensing requirements of FINRA or required to otherwise comply with U.S. rules or regulations regarding, among other things, communications with a subject company, public appearances and trading securities held by a research analyst account.
This report is intended for distribution by Edelweiss Securities Limited only to "Major Institutional Investors" as defined by Rule 15a-6(b)(4) of the U.S. Securities and Exchange Act, 1934 (the Exchange Act) and interpretations thereof by U.S. Securities and Exchange Commission (SEC) in reliance on Rule 15a 6(a)(2). If the recipient of this report is not a Major Institutional Investor as specified above, then it should not act upon this report and return the same to the sender. Further, this report may not be copied, duplicated and/or transmitted onward to any U.S. person, which is not the Major Institutional Investor.
21 Edelweiss Securities Limited
Nestle
Access the entire repository of Edelweiss Research on www.edelresearch.com
In reliance on the exemption from registration provided by Rule 15a-6 of the Exchange Act and interpretations thereof by the SEC in order to conduct certain business with Major Institutional Investors, Edelweiss Securities Limited has entered into an agreement with a U.S. registered broker-dealer, Edelweiss Financial Services Inc. ("EFSI"). Transactions in securities discussed in this research report should be effected through Edelweiss Financial Services Inc. Disclaimer for U.K. Persons
The contents of this research report have not been approved by an authorised person within the meaning of the Financial Services and Markets Act 2000 ("FSMA"). In the United Kingdom, this research report is being distributed only to and is directed only at (a) persons who have professional experience in matters relating to investments falling within Article 19(5) of the FSMA (Financial Promotion) Order 2005 (the “Order”); (b) persons falling within Article 49(2)(a) to (d) of the Order (including high net worth companies and unincorporated associations); and (c) any other persons to whom it may otherwise lawfully be communicated (all such persons together being referred to as “relevant persons”). This research report must not be acted on or relied on by persons who are not relevant persons. Any investment or investment activity to which this research report relates is available only to relevant persons and will be engaged in only with relevant persons. Any person who is not a relevant person should not act or rely on this research report or any of its contents. This research report must not be distributed, published, reproduced or disclosed (in whole or in part) by recipients to any other person. Disclaimer for Canadian Persons
This research report is a product of Edelweiss Securities Limited ("ESL"), which is the employer of the research analysts who have prepared the research report. The research analysts preparing the research report are resident outside the Canada and are not associated persons of any Canadian registered adviser and/or dealer and, therefore, the analysts are not subject to supervision by a Canadian registered adviser and/or dealer, and are not required to satisfy the regulatory licensing requirements of the Ontario Securities Commission, other Canadian provincial securities regulators, the Investment Industry Regulatory Organization of Canada and are not required to otherwise comply with Canadian rules or regulations regarding, among other things, the research analysts' business or relationship with a subject company or trading of securities by a research analyst. This report is intended for distribution by ESL only to "Permitted Clients" (as defined in National Instrument 31-103 ("NI 31-103")) who are resident in the Province of Ontario, Canada (an "Ontario Permitted Client"). If the recipient of this report is not an Ontario Permitted Client, as specified above, then the recipient should not act upon this report and should return the report to the sender. Further, this report may not be copied, duplicated and/or transmitted onward to any Canadian person. ESL is relying on an exemption from the adviser and/or dealer registration requirements under NI 31-103 available to certain international advisers and/or dealers. Please be advised that (i) ESL is not registered in the Province of Ontario to trade in securities nor is it registered in the Province of Ontario to provide advice with respect to securities; (ii) ESL's head office or principal place of business is located in India; (iii) all or substantially all of ESL's assets may be situated outside of Canada; (iv) there may be difficulty enforcing legal rights against ESL because of the above; and (v) the name and address of the ESL's agent for service of process in the Province of Ontario is: Bamac Services Inc., 181 Bay Street, Suite 2100, Toronto, Ontario M5J 2T3 Canada. Disclaimer for Singapore Persons
In Singapore, this report is being distributed by Edelweiss Investment Advisors Private Limited ("EIAPL") (Co. Reg. No. 201016306H) which is a holder of a capital markets services license and an exempt financial adviser in Singapore and (ii) solely to persons who qualify as "institutional investors" or "accredited investors" as defined in section 4A(1) of the Securities and Futures Act, Chapter 289 of Singapore ("the SFA"). Pursuant to regulations 33, 34, 35 and 36 of the Financial Advisers Regulations ("FAR"), sections 25, 27 and 36 of the Financial Advisers Act, Chapter 110 of Singapore shall not apply to EIAPL when providing any financial advisory services to an accredited investor (as defined in regulation 36 of the FAR. Persons in Singapore should contact EIAPL in respect of any matter arising from, or in connection with this publication/communication. This report is not suitable for private investors.
Copyright 2009 Edelweiss Research (Edelweiss Securities Ltd). All rights reserved