nestle india - company update-jun-15-edel - myirisbreport.myiris.com/es1/nesindia_20150602.pdf ·...
TRANSCRIPT
Edelweiss Research is also available on www.edelresearch.com, Bloomberg EDEL <GO>, Thomson First Call, Reuters and Factset. Edelweiss Securities Limited
Nestle India’s (Nestle) flagship brand Maggi has landed in a soup. It has come under the scanner of many state regulators for excessive lead and MSG content. As per our channel checks, post the brouhaha, Maggi sales have nosedived. Further, while Kerala has banned its sale, Delhi is mulling action due to negative test reports (samples contained lead). The prepared dishes segment (of which Maggi Noodles forms bulk) contributes ~30% to Nestle’s revenue. We cut CY15E and CY16E EPS 18.2% and 19.5% YoY, respectively, and expect the stock to de‐rate, further aggravated by an anticipated deficient monsoon. Hence, we downgrade to ‘REDUCE’.
Maggi volumes, margins to tumble on content rumble The prepared dishes segment has been the fastest growing segment for Nestle over
the past few years. We expect Maggi’s volumes to come under pressure in coming
quarters. As per news channels, the Future Group has stopped Maggi sales in its stores.
In a bid to revive the brand, the company will have to invest heavily to communicate
that its products are safe (similar to what Cadbury did in 2003). Legal costs/promotions
will also inch up, which will take a toll on margin.
Damage control drive to divert premiumisation focus Nestle’s effort towards driving premiumisation and improving the overall growth
trajectory may take a hit because of change in focus to damage control and revive the
Maggi brand. Also, during this phase, the brand may lose market share to rivals (ITC’s
Yippee noodles), adding further fuel to fire.
Outlook and valuations: Challenging; downgrade to ‘REDUCE’ Nestle’s volumes will come under pressure due to the negative brand perception on
Maggi. Moreover, apart from the brand, the issue could impact the company’s other
offerings as well. With the stock at 45.8x CY16 P/E, we downgrade
recommendation/rating to ‘REDUCE/SU’ from ‘HOLD/SP’ with a revised target price of
INR5,641.
COMPANY UPDATE
NESTLE INDIA Maggi muddle: Noodles land in content soup
EDELWEISS 4D RATINGS
Absolute Rating REDUCE
Rating Relative to Sector Underperformer
Risk Rating Relative to Sector Low
Sector Relative to Market Underweight
MARKET DATA (R: NEST.BO, B: NEST IN)
CMP : INR 6,803
Target Price : INR 5,641
52‐week range (INR) : 7,505 / 4,755
Share in issue (mn) : 96.4
M cap (INR bn/USD mn) : 656 / 10,271
Avg. Daily Vol.BSE/NSE(‘000) : 29.5 SHARE HOLDING PATTERN (%)
Current Q3FY15 Q2FY15
Promoters *
62.8 62.8 62.8
MF's, FI's & BK’s 4.5 4.7 4.8
FII's 12.5 13.8 14.3
Others 20.2 18.7 18.1
* Promoters pledged shares (% of share in issue)
: NIL
PRICE PERFORMANCE (%)
Stock Nifty
EW Consumer goods Index
1 month 1.5 3.1 4.2
3 months (5.0) (5.3) (2.6)
12 months 34.5 16.6 17.6
Abneesh Roy +91 22 6620 3141
Pooja Lath +91 22 6620 3075
Tanmay Sharma +91 22 4040 7586
India Equity Research| Consumer Goods
June 2, 2015
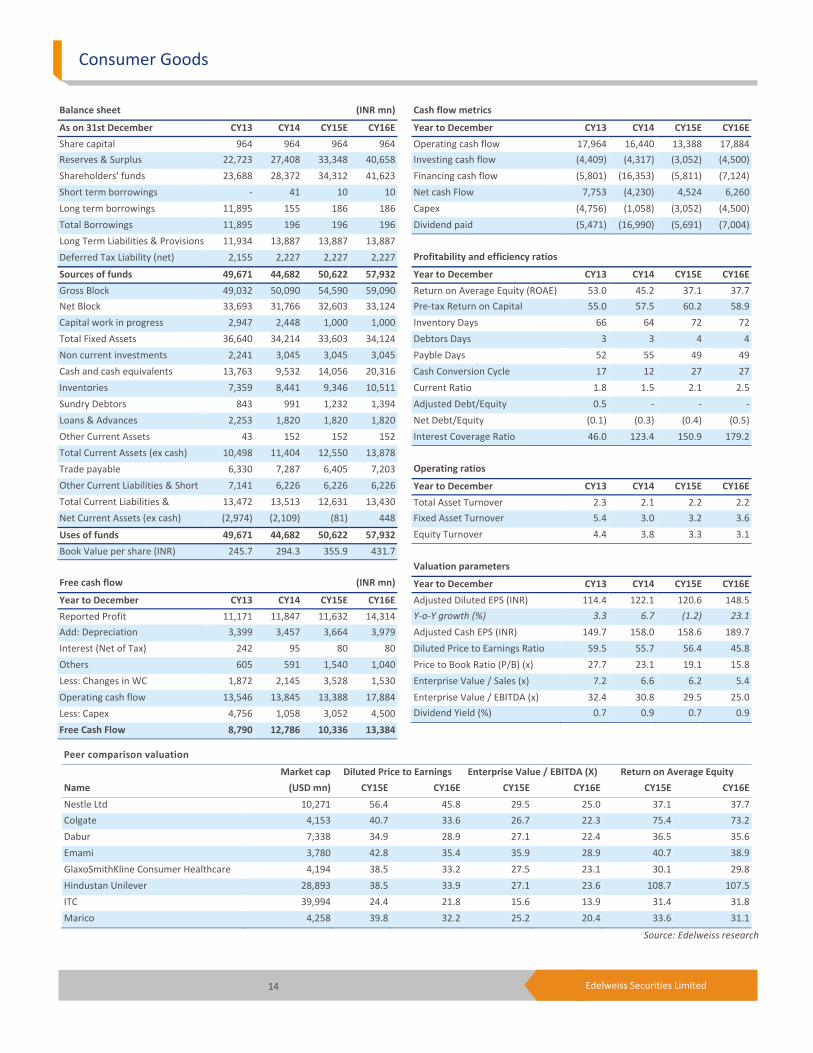
Financials
Year to December CY13 CY14 CY15E CY16E
Revenues (INR mn) 90,619 98,063 103,310 116,962
Rev. growth (%) 9.1 8.2 5.4 13.2
EBITDA (INR mn) 20,196 21,013 21,777 25,479
Adjusted Profit (INR mn) 11,033 11,777 11,632 14,314
No. of Shares outstanding (mn) 96 96 96 96
Adjusted Diluted EPS (INR) 114.4 122.1 120.6 148.5
EPS growth (%) 3.3 6.7 (1.2) 23.1
Diluted P/E (x) 59.5 55.7 56.4 45.8
EV/EBITDA (x) 32.4 30.8 29.5 25.0
ROAE (%) 53.0 45.2 37.1 37.7
Consumer Goods
2 Edelweiss Securities Limited
Uttar Pradesh started the fire
The brouhaha began in Uttar Pradesh when the state’s Food Safety and Drug Administration
(FDA) found higher‐than‐permissible lead and monosodium glutamate (MSG) content in
some packets of Maggi. Following the report, the food regulator asked Nestle to recall
~200000 packets of Maggi, which it believed were not safe for consumption.
Endemic becoming epidemic….
The problem was compounded further as other state government’s too started probing into
the issue and ordered sample testing. Consequently, FSSAI has collected samples from most
states of India which will be tested on all parameters. Moreover, the news has gone viral on
social media and television, denting the brand value to a great extent.
Table 1: Action taken by different state government till now
Source: Edelweiss research
Nestle take
Nestle has released a press statement in which it has denied the news about its product
containing lead or MSG more than the prescribed limit. To validate its statement, the
company has sent its samples for testing to an independent accredited laboratory.
Nestle’s comments on the issue:
“The company does not agree with the order and is filing the requisite representation with
the authorities. People can be confident that Maggi Noodle products are safe to eat.”
“We have in place strict food safety and quality controls at our Maggi factories, including
through quality check at each stage of our raw material sourcing and manufacturing
process.”
“We have submitted samples of Maggi Noodles from almost 600 product batches to an
external laboratory for independent analysis and we tested samples from almost 1000
batches at our accredited laboratory. These samples represent around 125mn packets.”
“All the results of these internal and external tests show that lead levels are well within the
limits specified by food regulations and that Maggi noodles are safe to eat. “
State Action taken
Uttar Pradesh Filed a criminal case against Nestle India after Maggi samples contained excess lead content
Uttarakhand and UP Served notice to Bollywood actors Amitabh Bachchan, Madhuri Dixit and Priety Zinda as they
have featured in Maggi ads
Delhi Possible ban in Delhi as Maggi samples were found to be unsafe for consumption
Kerala Has issued orders to ban sale of Maggi instant noodles in the Kerala state outlets
Bihar Filed FIR against those actors who have promoted Maggi
Karnataka Has sent Maggi samples for testing in an independent lab
Harayana Has sent Maggi samples for testing
Maharashtra Has sent Maggi samples for testing
West Bengal Awaiting results of the samples sent for testing (convened a high‐level meeting)
Goa FDA found no ingredient above the harmful levels
Tamil Nadu Ordered lab test of Maggi
Himachal Pradesh Ordered lab test of Maggi
Andhra Pradesh and Telengana Collected 22 random samples from different batches of Maggi and sent for lab testing
Nestle Ltd
3 Edelweiss Securities Limited
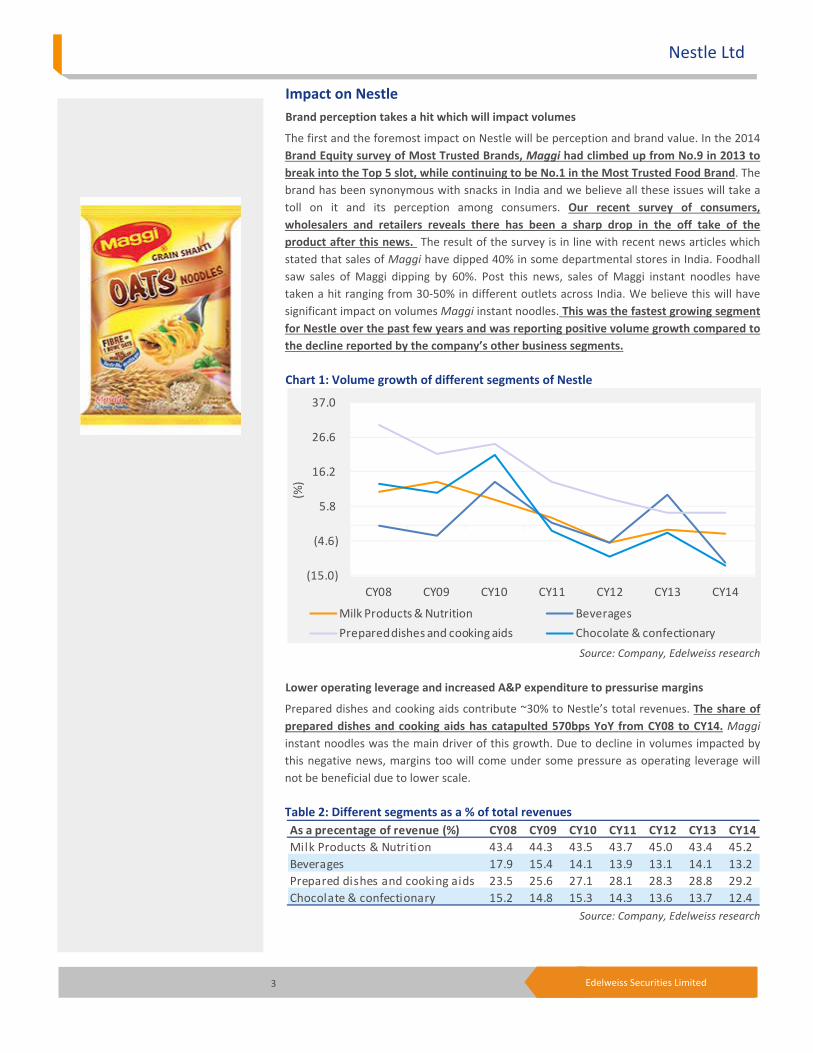
Impact on Nestle
Brand perception takes a hit which will impact volumes
The first and the foremost impact on Nestle will be perception and brand value. In the 2014
Brand Equity survey of Most Trusted Brands, Maggi had climbed up from No.9 in 2013 to
break into the Top 5 slot, while continuing to be No.1 in the Most Trusted Food Brand. The
brand has been synonymous with snacks in India and we believe all these issues will take a
toll on it and its perception among consumers. Our recent survey of consumers,
wholesalers and retailers reveals there has been a sharp drop in the off take of the
product after this news. The result of the survey is in line with recent news articles which
stated that sales of Maggi have dipped 40% in some departmental stores in India. Foodhall
saw sales of Maggi dipping by 60%. Post this news, sales of Maggi instant noodles have
taken a hit ranging from 30‐50% in different outlets across India. We believe this will have
significant impact on volumes Maggi instant noodles. This was the fastest growing segment
for Nestle over the past few years and was reporting positive volume growth compared to
the decline reported by the company’s other business segments.
Chart 1: Volume growth of different segments of Nestle
Source: Company, Edelweiss research
Lower operating leverage and increased A&P expenditure to pressurise margins
Prepared dishes and cooking aids contribute ~30% to Nestle’s total revenues. The share of
prepared dishes and cooking aids has catapulted 570bps YoY from CY08 to CY14. Maggi
instant noodles was the main driver of this growth. Due to decline in volumes impacted by
this negative news, margins too will come under some pressure as operating leverage will
not be beneficial due to lower scale.
Table 2: Different segments as a % of total revenues
Source: Company, Edelweiss research
(15.0)
(4.6)
5.8
16.2
26.6
37.0
CY08 CY09 CY10 CY11 CY12 CY13 CY14
(%)
Milk Products & Nutrition Beverages
Prepared dishes and cooking aids Chocolate & confectionary
As a precentage of revenue (%) CY08 CY09 CY10 CY11 CY12 CY13 CY14
Milk Products & Nutrition 43.4 44.3 43.5 43.7 45.0 43.4 45.2
Beverages 17.9 15.4 14.1 13.9 13.1 14.1 13.2
Prepared dishes and cooking aids 23.5 25.6 27.1 28.1 28.3 28.8 29.2
Chocolate & confectionary 15.2 14.8 15.3 14.3 13.6 13.7 12.4
Consumer Goods
4 Edelweiss Securities Limited
Over the past few years, the company has invested substantially in the brand, not only for
brand building, but also to expand distribution. The company drove penetration of Maggi in
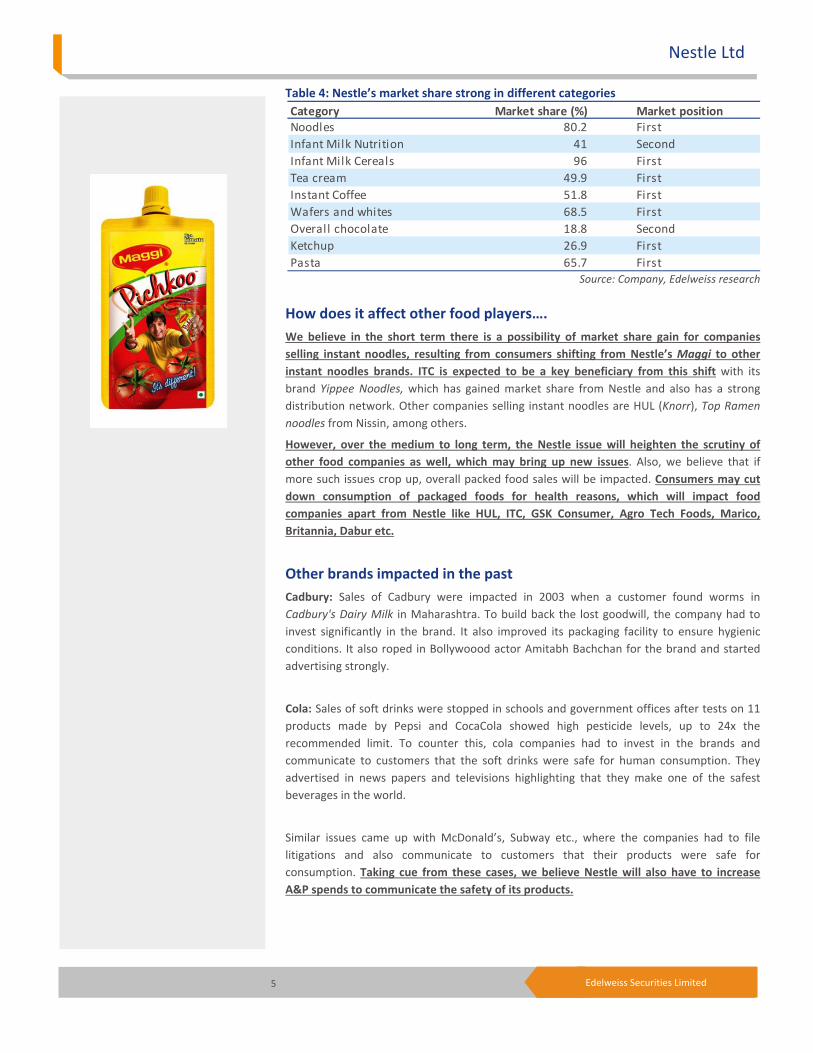
small and semi urban towns with the communication that was relevant for consumers
therein. To win back the lost goodwill (even if the company comes out clean after the
sample testing), Nestle will have to invest behind the brand by way of advertisements and
promotions again to reiterate the fact the Maggi is safe for consumption. Hence, we
believe that A&P will increase as percentage of sales, which will further impact margins.
Apart from this, the company will see an increase in legal and other expenditure as well,
which may arise due to the litigation filed against the company.
Monsoon also not favouring
The Indian Meteorological Department (IMD), in its second stage forecast of South West
monsoon (June to September), has downgraded its April forecast of 93% Long Period
Average (LPA), which is ‘below normal’, to 88%, which is ‘deficient’. Deficient monsoon will
added fuel to fire as it will lead to an increase in the raw material prices like milk, wheat, rice
etc which will further impact the gross margins of the company. Not only Nestle, but other
food companies, HUL, GSK Consumer, ITC etc., will also bear the brunt.
Table 3: 2015 monsoon expected to be similar to 2014 geographically…
Source: IMD, Edelweiss research
Management bandwidth to get diverted to damage control
Nestle had been a laggard in the past years as it shifted focus on increasing profitability,
which was impacting volume growth. Also, the pace of new launches had dried up. But since
the time Mr. Etienne Benet, the new MD, took over, there has been a marked shift in
Nestle’s strategy. The company is focusing on premiumisation, SKU rationalisation and is
focused on driving growth via a leaner and premium product portfolio. New product
launches gathered pace with the likes of Maggi Oats Noodles, 'NAN LO‐LAC' as the first ever
low lactose formula, Nestlé Kit Kat Senses Milk, Nestlé Kit Kat Senses Dark and Nestlé Extra
Smooth etc. Apart from this, management was also investing behind the brand to drive
volumes. But this news will certainly have a temporary impact on the focus on the
management which will now shift to damage control of one of its most important brand.
This may impact new launches and innovation as well as they may be postponed.
Could potentially impact other brands as well
The recent probe may raise concerns on Nestle’s other brands as well. Apart from the issue
of Maggi, another issue has also come up from Tamil Nadu where a consumer found worms
in Nan Pro 3 Milk powder. This can lead to testing of the company’s other brands as well,
which raises the specter of its other products coming under the scanner. Also, sales of other
products that come under the Maggi mother brand like Maggi Tomato Ketchup, Maggi
healthy soups, Maggi masala e magic too may come under pressure. This will lead to some
market share loss to competitors.
Regions2015 Jun‐Sep (IMD forecast)
(% of long period average
2014 Jun‐Sep (Actual),
(% of long period average)
Country as a whole 88 88
Northwest India 85 79
Central India 90 90
South Peninsula 92 93
North East India 90 88
Nestle Ltd
5 Edelweiss Securities Limited
Table 4: Nestle’s market share strong in different categories
Source: Company, Edelweiss research
How does it affect other food players….
We believe in the short term there is a possibility of market share gain for companies
selling instant noodles, resulting from consumers shifting from Nestle’s Maggi to other
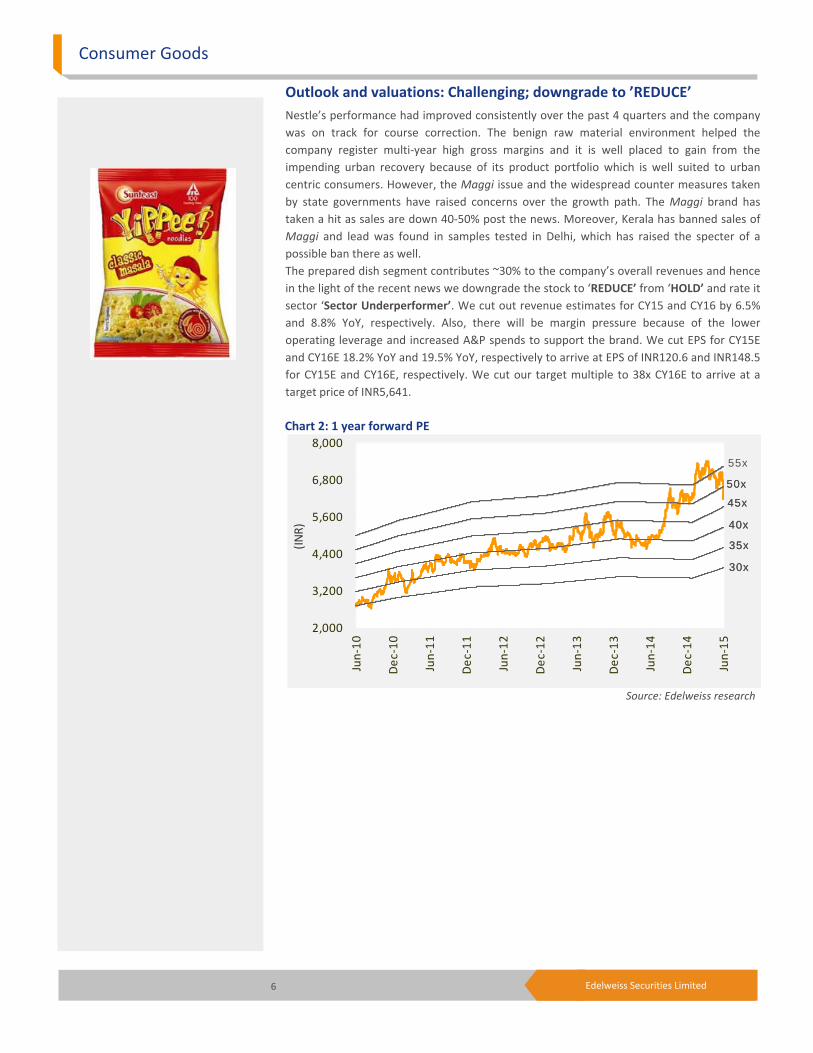
instant noodles brands. ITC is expected to be a key beneficiary from this shift with its
brand Yippee Noodles, which has gained market share from Nestle and also has a strong
distribution network. Other companies selling instant noodles are HUL (Knorr), Top Ramen
noodles from Nissin, among others.
However, over the medium to long term, the Nestle issue will heighten the scrutiny of
other food companies as well, which may bring up new issues. Also, we believe that if
more such issues crop up, overall packed food sales will be impacted. Consumers may cut
down consumption of packaged foods for health reasons, which will impact food
companies apart from Nestle like HUL, ITC, GSK Consumer, Agro Tech Foods, Marico,
Britannia, Dabur etc.
Other brands impacted in the past
Cadbury: Sales of Cadbury were impacted in 2003 when a customer found worms in Cadbury's Dairy Milk in Maharashtra. To build back the lost goodwill, the company had to
invest significantly in the brand. It also improved its packaging facility to ensure hygienic
conditions. It also roped in Bollywoood actor Amitabh Bachchan for the brand and started
advertising strongly.
Cola: Sales of soft drinks were stopped in schools and government offices after tests on 11
products made by Pepsi and CocaCola showed high pesticide levels, up to 24x the
recommended limit. To counter this, cola companies had to invest in the brands and
communicate to customers that the soft drinks were safe for human consumption. They
advertised in news papers and televisions highlighting that they make one of the safest
beverages in the world.
Similar issues came up with McDonald’s, Subway etc., where the companies had to file
litigations and also communicate to customers that their products were safe for
consumption. Taking cue from these cases, we believe Nestle will also have to increase
A&P spends to communicate the safety of its products.
Category Market share (%) Market positionNoodles 80.2 First
Infant Milk Nutrition 41 Second
Infant Milk Cereals 96 First
Tea cream 49.9 First
Instant Coffee 51.8 First
Wafers and whites 68.5 First
Overall chocolate 18.8 Second
Ketchup 26.9 First
Pasta 65.7 First
Consumer Goods
6 Edelweiss Securities Limited
Outlook and valuations: Challenging; downgrade to ’REDUCE’
Nestle’s performance had improved consistently over the past 4 quarters and the company
was on track for course correction. The benign raw material environment helped the
company register multi‐year high gross margins and it is well placed to gain from the
impending urban recovery because of its product portfolio which is well suited to urban
centric consumers. However, the Maggi issue and the widespread counter measures taken
by state governments have raised concerns over the growth path. The Maggi brand has
taken a hit as sales are down 40‐50% post the news. Moreover, Kerala has banned sales of
Maggi and lead was found in samples tested in Delhi, which has raised the specter of a
possible ban there as well.
The prepared dish segment contributes ~30% to the company’s overall revenues and hence
in the light of the recent news we downgrade the stock to ‘REDUCE’ from ‘HOLD’ and rate it
sector ‘Sector Underperformer’. We cut out revenue estimates for CY15 and CY16 by 6.5%
and 8.8% YoY, respectively. Also, there will be margin pressure because of the lower
operating leverage and increased A&P spends to support the brand. We cut EPS for CY15E
and CY16E 18.2% YoY and 19.5% YoY, respectively to arrive at EPS of INR120.6 and INR148.5
for CY15E and CY16E, respectively. We cut our target multiple to 38x CY16E to arrive at a
target price of INR5,641.
Chart 2: 1 year forward PE
Source: Edelweiss research
2,000
3,200
4,400
5,600
6,800
8,000
Jun‐10
Dec‐10
Jun‐11
Dec‐11
Jun‐12
Dec‐12
Jun‐13
Dec‐13
Jun‐14
Dec‐14
Jun‐15
(INR)
55x
30x
35x
45x
40x
50x
30x
35x
45x
40x
50x
Nestle Ltd
7 Edelweiss Securities Limited
Table 5: Segmental performance
Table 6: Segmental performance
Table 7: Overall volume growth
Source: Company, Edelweiss research
Q1CY13 Q2CY13 Q3CY13 Q4CY13 Q1CY14 Q2CY14 Q3CY14 Q4CY14 Q1CY15
Exports growth(%) 50.9 46.9 73.9 20.9 (4.4) 4.1 (3.9) 17.9 19.2
Net domestic sales growth (%) 7.7 9.2 8.0 3.7 3.4 9.7 9.9 11.3 7.6
Net sales growth (%) 9.8 11.4 11.0 4.6 2.9 9.3 8.9 11.7 8.4
Gross margin (%) 55.0 55.0 55.2 53.6 53.9 52.7 54.1 55.7 57.8
EBITDA margin(%) 23.9 22.4 21.4 21.1 21.3 20.6 21.3 22.1 24.2
Tax Rate 35.1 33.0 33.5 33.2 34.6 32.4 32.6 33.8 34.2
Other Expenses 23.5 24.2 25.7 24.4 24.8 23.5 24.7 25.0 24.9
COGS (% of Sales) 45.0 45.0 44.8 46.4 46.1 47.3 45.9 44.3 42.2
CY04 CY05 CY06 CY07 CY08 CY09 CY10 CY11 CY12 CY13 CY14
Milk Products & Nutrition
Volume growth (% YoY) 7.4 2.7 2.9 5.4 10.1 13.1 7.6 2.5 (5.1) (1.1) (2.3)
Price growth (% YoY) 1.6 6.1 6.3 16.3 11.7 5.4 11.6 17.8 21.4 6.7 15.0
Beverages
Volume growth (% YoY) (4.0) (1.6) (9.2) 7.9 0.0 (3.1) 13.2 0.9 (5.0) 9.3 (11.0)
Price growth (% YoY) 0.8 12.1 14.4 10.6 10.9 3.6 (1.2) 17.8 10.6 7.9 13.7
Prepared dishes and cooking aids
Volume growth (% YoY) 3.8 8.5 20.0 24.8 30.1 21.7 24.4 13.2 8.0 3.8 3.7
Price growth (% YoY) (1.0) 9.9 (0.7) 4.6 3.5 4.3 3.9 10.3 4.4 7.0 5.8
Chocolate & confectionary
Volume growth (% YoY) 9.9 11.3 15.8 17.6 12.4 9.7 21.2 (1.5) (9.4) (2.2) (72.5)
Price growth (% YoY) (6.3) (0.3) 2.3 6.1 6.3 3.5 4.3 14.4 17.3 12.4 253.8
Period Volume growth (% YoY)
CY14 (0.6)
CY13 1.9
CY12 0.8
CY11 6.8
CY10 17.0
CY09 14.9
CY08 16.9
CY07 13.8
CY06 8.3
CY05 4.9
CY04 5.1
CY03 10.2
Consumer Goods
8 Edelweiss Securities Limited
Nestle India 2014 Annual report | Key takeaways
Nestle India: Nutrition, Health and Wellness
Financials
Net sales jumped 8.2% YoY to INR98bn.
Overall volumes declined 0.6% YoY in CY14.
Net domestic sales grew 8.6% YoY primarily due to better realisations.
Export sales, at INR6,442mn, rose 2.9% YoY impacted by coffee exports to Russia.
Export of culinary products saw some uptick in major markets and the company
expects this to continue.
Exports of instant tea slowed down, in Europe as well as in the Far East. Instant coffee
exports also dropped due to lower imports by the affiliate in Russia.
Total dividend paid during CY14 was INR63.0 per share compared to INR48.5 per share
in CY13.
Prepared Dishes and Cooking Aids
In 2014 Brand Equity survey of Most Trusted Brands, Maggi climbed up from No.9 in
2013 to break into the Top 5, while continuing to be the No.1 Most Trusted Food Brand.
Nestle maintained its leadership and improved volumes.
During CY14, the company launched Maggi Oats Noodles with the goodness of grains
(Grain Shakti) to enter the breakfast segment with an enjoyable and healthy offering
for the family.
Nestle drove penetration of Maggi in small, semi urban towns with communication
that was relevant for those consumers, while in the sauces category the company
recruited new consumers to drive growth with Maggi Pichkoo.
While volumes jumped 3.7% YoY, sales stood at INR29bn (up 9.7% YoY).
Milk Products and Nutrition
Nestlé works with over 100,000 milk farmers.
The company launched Nestlé Masala Buttermilk which has the goodness of Ayurveda
and the company is working with Nestlé R&D and application groups to develop more
products.
Nestle is putting lot of resources behind the campaign 'Superbaby‐When breastfed it
shows'. It is important to encourage advocacy around the cause and make
breastfeeding a part of community knowledge and practice. Resultantly, Nestle
develops products that provide mothers with balanced nutrition when she is pregnant
or feeding her child.
Nestle launched 'NAN LO‐LAC' as the first ever low lactose formula in India for
nutritional management of diarrhea.
The company also test launched Nestlé Buttermilk and Nestlé Lassi in Delhi to assess
the market in the liquid refreshment section.
Volumes declined 2.29% YoY while sales stood at INR45.7bn (up 12.4% YoY).
Nestle Ltd
9 Edelweiss Securities Limited
Chocolate and Confectionery
Nestle is the leader in the lighter eating segment with wafer‐based products such as
Kitkat and Munch and in whites with Milkybar which has the goodness of milk.
Nestle India has stopped using artificial colours in the chocolate and confectionery
portfolio since 2012.
The growth of the industry decelerated while commodity and packaging prices
increased.
The company with focus on premiumising introduced 'Slow Churned Chocolate' for the
first time in India under Nestlé Kit kat Senses Milk, Nestlé Maggi Dark and Nestlé Extra
Smooth.
Nestlé Polo, the iconic 'Mint with the Hole', was re‐launched with menthol crystals and
attractive new packaging.
Nestlé Milkybar, which continues to be the leader in 'whites', was renovated and
relaunched with an innovative concept of 'play eat & learn' to create more value.
Volumes declined 12% YoY while sales stood at INR12.5mn (down 2.58% YoY).
Coffee and Beverages
Brand Equity's Most Trusted Brands survey for 2014 ranked Nescafe in the top 5 Hot
Beverage brands and the 100 Most Trusted Brands of the country.
The good communication strategy led to volume and value growth and market share
gains in Nescafe.
Performance of Nestea was satisfactory in CY14.
Volumes declined 10.9% YoY while sales stood at INR13.4bn (grew 1.19% YoY).
Nestle Professional
CY14 was a challenging year for this business.
Beverages vending solutions category was adversely impacted by surge in milk prices at
the start of CY14, but focus on cost control and execution of an enhanced strategy
enabled it to end the year stronger.
Nestle remains committed to consolidate and build further on its strengths in the out‐
of‐home industry.
Distribution and supply chain
The focus in CY14 was to improve availability in a sustained manner in secondary and
tertiary towns.
Nestle has invested in improving sales automation systems to enhance productivity of
its sales force.
The company has implemented a system to streamline milk collection to directly pay
farmers who supply milk to the Moga factory.
Chairman’s and MD’s messages: Key highlights
Indian economy faces 2 main concerns—food security and nutrition.
Consumer Goods
10 Edelweiss Securities Limited
Food processing and technology can reduce or completely eliminate the wastage of
agricultural produce in India, which is estimated to be over INR500bn every year.
Nestle's vision is to become a leader of Nutrition, Health and Wellness in India.
To achieve this, the company will need bold changes, swift adaptation and tough
decisions, especially for evolving a product portfolio that is more focused on premium
and value‐up ranges.
Using state‐of‐the‐art facility, the company has reduced water consumption per tonne
of production by 72% in the past 15 years.
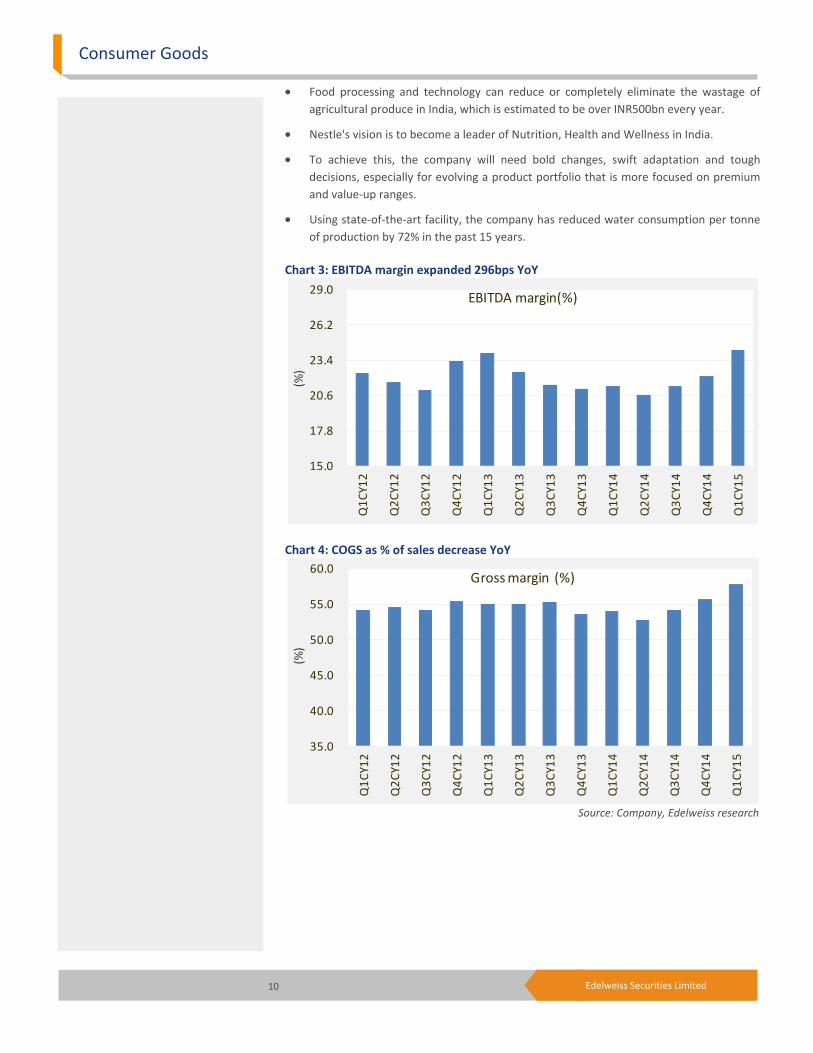
Chart 3: EBITDA margin expanded 296bps YoY
Chart 4: COGS as % of sales decrease YoY
Source: Company, Edelweiss research
15.0
17.8
20.6
23.4
26.2
29.0
Q1CY12
Q2CY12
Q3CY12
Q4CY12
Q1CY13
Q2CY13
Q3CY13
Q4CY13
Q1CY14
Q2CY14
Q3CY14
Q4CY14
Q1CY15
(%)
EBITDA margin(%)
35.0
40.0
45.0
50.0
55.0
60.0
Q1CY12
Q2CY12
Q3CY12
Q4CY12
Q1CY13
Q2CY13
Q3CY13
Q4CY13
Q1CY14
Q2CY14
Q3CY14
Q4CY14
Q1CY15
(%)
Gross margin (%)
Nestle Ltd
11 Edelweiss Securities Limited
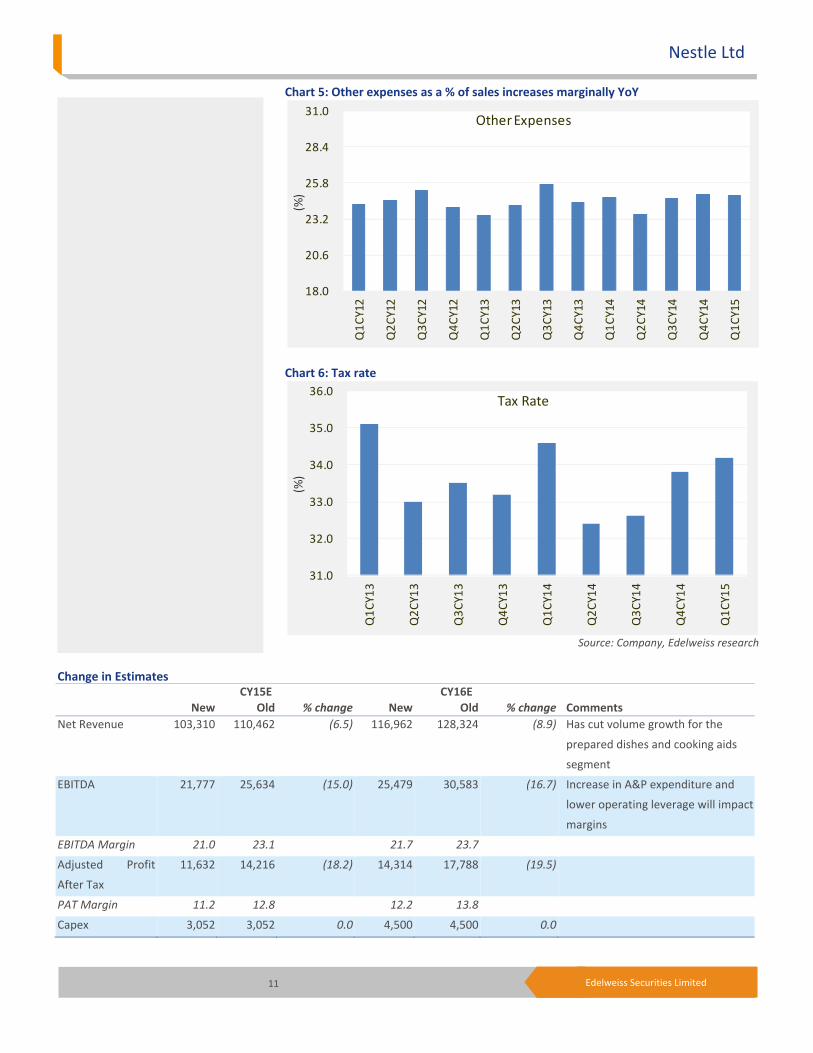
Chart 5: Other expenses as a % of sales increases marginally YoY
Chart 6: Tax rate
Source: Company, Edelweiss research
18.0
20.6
23.2
25.8
28.4
31.0
Q1CY12
Q2CY12
Q3CY12
Q4CY12
Q1CY13
Q2CY13
Q3CY13
Q4CY13
Q1CY14
Q2CY14
Q3CY14
Q4CY14
Q1CY15
(%)
Other Expenses
31.0
32.0
33.0
34.0
35.0
36.0
Q1CY13
Q2CY13
Q3CY13
Q4CY13
Q1CY14
Q2CY14
Q3CY14
Q4CY14
Q1CY15
(%)
Tax Rate
Change in Estimates CY15E CY16E
New Old % change New Old % change Comments
Net Revenue 103,310 110,462 (6.5) 116,962 128,324 (8.9) Has cut volume growth for the
prepared dishes and cooking aids
segment
EBITDA 21,777 25,634 (15.0) 25,479 30,583 (16.7) Increase in A&P expenditure and
lower operating leverage will impact
margins
EBITDA Margin 21.0 23.1 21.7 23.7
Adjusted Profit
After Tax
11,632 14,216 (18.2) 14,314 17,788 (19.5)
PAT Margin 11.2 12.8 12.2 13.8
Capex 3,052 3,052 0.0 4,500 4,500 0.0
Consumer Goods
12 Edelweiss Securities Limited
Company Description
Nestle, a 62.8% subsidiary of its parent Nestlé S.A. of Switzerland, is India’s third largest
FMCG company after HUL and ITC. The company set up its first factory at Moga, Punjab, to
develop milk production. Over the years, Nestlé has set up seven factories across the
country, and is now involved in manufacturing and marketing a range of quality products. It
has well‐established brands, including Maggi, Nescafe, Lactogen, KitKat, and Milkmaid.
Nestlé enjoys leadership position in its core categories like baby foods, instant noodles, and
instant coffee. It enjoys a distinct advantage over competitors in the F&B space on account
of its strong focus on developing products around the nutrition, health, and wellness
platform, and a culture of renovation and innovation in its offerings, backed by strong
parent support.
Investment Theme
Nestle India (Nestle) is the best play on Indian processed food industry, which is on a high
growth trajectory with multiple growth drivers in place, including low penetration levels,
rising income levels, urbanisation, and changing lifestyle. Nestlé with established brands
across food categories is expected to be a major beneficiary of this growth. Nestle is
increasingly focusing to expand into tier II and tier III cities by introducing stock‐keeping
units (SKUs) below INR 10. Also, company has effectively leveraged its recent
innovations/renovation positioned on health and wellness platform to gain incremental
sales. Nestle’s high pricing power on account of strong brand equity shall aid in fighting
margin pressure despite inflationary concern. Low volume growth in the past couple of
quarters is a cause of concern.
Key Risks
Sharp increase in input costs
Sharp rise in the prices of its key inputs such as milk, wheat flour, edible oils, and sugar
could impact margins adversely.
Competition from new entrants
GSK Consumer, ITC and HUL entered the noodles category in select markets and this could
increase the ad spend for Nestlé. Nestlé also faces competition from dairy cooperatives like
Amul and Mother Dairy, which have low focus on maintaining profit margins. Increase in
competition could also limit Nestlé’s ability to pass on input price hikes to consumers.
Failure of new product launches
Nestlé has launched premium variants in various categories such as chocolates, noodles,
ketchup, and dairy products, which could hit margins, in case they do not click in the
market.

13 Edelweiss Securities Limited
Nestle Ltd
Financial Statements
Income statement (INR mn)
Year to December CY13 CY14 CY15E CY16E
Net revenue 90,619 98,063 103,310 116,962
Other Operating Income 392 486 372 422
Operating Revenue 91,011 98,548 103,681 117,384
Materials costs 41,224 45,240 47,709 53,658
Gross profit 49,787 53,309 55,973 63,726
Employee costs 7,415 8,197 8,678 9,708
Other Expenses 18,222 19,644 20,455 23,042
Advertisement & sales costs 3,955 4,455 5,062 5,497
EBITDA 20,196 21,013 21,777 25,479
Depreciation & Amortization 3,399 3,457 3,664 3,979
EBIT 16,797 17,556 18,113 21,501
Add: Other income 831 873 867 984
Provision for contingencies 621 614 1,500 1,000
Less: Interest Expense 365 142 120 120
Profit Before Tax 16,642 17,674 17,361 21,365
Less: Provision for Tax 5,609 5,897 5,729 7,050
Reported Profit 11,171 11,847 11,632 14,314
Less: Exceptional Items (Net of 138 70 ‐ ‐
Adjusted Profit 11,033 11,777 11,632 14,314
Adjusted Basic EPS 114.4 122.1 120.6 148.5
No. of Diluted shares outstanding 96 96 96 96
Adjusted Diluted EPS 114.4 122.1 120.6 148.5
Adjusted Cash EPS 149.7 158.0 158.6 189.7
Dividend per share (DPS) 48.5 63.0 50.7 62.4
Common size metrics
Year to December CY13 CY14 CY15E CY16E
Materials costs 45.3 45.9 46.0 45.7
Staff costs 8.1 8.3 8.4 8.3
Advertising & sales costs 4.3 4.5 4.9 4.7
Depreciation 3.7 3.5 3.5 3.4
EBITDA margins 22.2 21.3 21.0 21.7
Net Profit margins 12.1 12.0 11.2 12.2
Growth ratios (%)
Year to December CY13 CY14 CY15E CY16E
Revenues 9.1 8.2 5.4 13.2
EBITDA 8.7 4.0 3.6 17.0
Adjusted Profit 3.3 6.7 (1.2) 23.1
EPS 3.3 6.7 (1.2) 23.1
Key Assumptions
Year to December FY14 FY15 FY16E FY17E
Macro
GDP(Y‐o‐Y %) 4.8 5.4 6.3 7.5
Inflation (Avg) 6.2 5.5 6.0 6.0
Repo rate (exit rate) 8.0 7.8 7.3 6.5
USD/INR (Avg) 62.0 60.0 58.0 55.0
Company
Revenue growth (Y‐o‐Y %)
Volume growth (domestic) 1.6 (2.9) (0.9) 4.0
Pricing change (domestic) 7.7 11.6 7.2 9.1
Milk Products & Nutrition vols increase (1.1) (2.3) 3.0 5.0
Milk Products & Nutrition price increase 6.7 15.0 8.0 10.0
Beverages vols increase 9.3 (11.0) 6.0 8.0
Beverages price increase 7.9 13.7 6.0 8.0
Prepared dishes and cooking aids vols increase 3.8 3.7 (15.0) (2.0)
Prepared dishes and cooking aids price increase 7.0 5.8 5.0 6.0
Chocolate & confectionary vols increase (2.2) (12.1) 4.0 6.0
Chocolate & confectionary price increase 12.4 10.8 10.0 12.0
Excise as % of Gross Sales 3.4 3.2 3.2 3.2
EBITDA margin assumptions
COGS as % of sales 45.3 45.9 46.0 45.7
Fresh milk as % of sales 20.1 24.8 24.2 24.5
Milk derivatives as % of sales 11.8 14.7 14.7 14.4
Grain flour as % of sales 10.4 9.9 9.6 9.4
Edible oils as % of sales 8.2 7.8 8.1 7.9
Green coffee and chicory as % of sales 9.0 8.4 8.7 8.8
Sugar as % of sales 4.8 3.9 4.2 4.3
Packing materials as % of sales 17.1 16.8 17.0 16.9
Financial assumptions
Tax rate (%) 33.7 33.4 33.0 33.0
Capex (INR mn) 8,790 12,786 10,336 13,384
Debtor days 3 3 4 4
Inventory days 66 64 72 72
Payable days 52 55 49 49
Cash conversion cycle (days) 17 12 27 27
Interest rate on o/standing debt (%) 3.1 72.7 61.3 61.3
Dividend as % of net profit 41.9 51.3 42.0 42.0
Yield on cash 16.3 30.5 13.0 10.0
14 Edelweiss Securities Limited
Consumer Goods
Peer comparison valuation
Market cap Diluted Price to Earnings Enterprise Value / EBITDA (X) Return on Average Equity
Name (USD mn) CY15E CY16E CY15E CY16E CY15E CY16E
Nestle Ltd 10,271 56.4 45.8 29.5 25.0 37.1 37.7
Colgate 4,153 40.7 33.6 26.7 22.3 75.4 73.2
Dabur 7,338 34.9 28.9 27.1 22.4 36.5 35.6
Emami 3,780 42.8 35.4 35.9 28.9 40.7 38.9
GlaxoSmithKline Consumer Healthcare 4,194 38.5 33.2 27.5 23.1 30.1 29.8
Hindustan Unilever 28,893 38.5 33.9 27.1 23.6 108.7 107.5
ITC 39,994 24.4 21.8 15.6 13.9 31.4 31.8
Marico 4,258 39.8 32.2 25.2 20.4 33.6 31.1
Source: Edelweiss research
Cash flow metrics
Year to December CY13 CY14 CY15E CY16E
Operating cash flow 17,964 16,440 13,388 17,884
Investing cash flow (4,409) (4,317) (3,052) (4,500)
Financing cash flow (5,801) (16,353) (5,811) (7,124)
Net cash Flow 7,753 (4,230) 4,524 6,260
Capex (4,756) (1,058) (3,052) (4,500)
Dividend paid (5,471) (16,990) (5,691) (7,004)
Profitability and efficiency ratios
Year to December CY13 CY14 CY15E CY16E
Return on Average Equity (ROAE) 53.0 45.2 37.1 37.7
Pre‐tax Return on Capital 55.0 57.5 60.2 58.9
Inventory Days 66 64 72 72
Debtors Days 3 3 4 4
Payble Days 52 55 49 49
Cash Conversion Cycle 17 12 27 27
Current Ratio 1.8 1.5 2.1 2.5
Adjusted Debt/Equity 0.5 ‐ ‐ ‐
Net Debt/Equity (0.1) (0.3) (0.4) (0.5)
Interest Coverage Ratio 46.0 123.4 150.9 179.2
Operating ratios
Year to December CY13 CY14 CY15E CY16E
Total Asset Turnover 2.3 2.1 2.2 2.2
Fixed Asset Turnover 5.4 3.0 3.2 3.6
Equity Turnover 4.4 3.8 3.3 3.1
Valuation parameters
Year to December CY13 CY14 CY15E CY16E
Adjusted Diluted EPS (INR) 114.4 122.1 120.6 148.5
Y‐o‐Y growth (%) 3.3 6.7 (1.2) 23.1
Adjusted Cash EPS (INR) 149.7 158.0 158.6 189.7
Diluted Price to Earnings Ratio 59.5 55.7 56.4 45.8
Price to Book Ratio (P/B) (x) 27.7 23.1 19.1 15.8
Enterprise Value / Sales (x) 7.2 6.6 6.2 5.4
Enterprise Value / EBITDA (x) 32.4 30.8 29.5 25.0
Dividend Yield (%) 0.7 0.9 0.7 0.9
Balance sheet (INR mn)
As on 31st December CY13 CY14 CY15E CY16E
Share capital 964 964 964 964
Reserves & Surplus 22,723 27,408 33,348 40,658
Shareholders' funds 23,688 28,372 34,312 41,623
Short term borrowings ‐ 41 10 10
Long term borrowings 11,895 155 186 186
Total Borrowings 11,895 196 196 196
Long Term Liabilities & Provisions 11,934 13,887 13,887 13,887
Deferred Tax Liability (net) 2,155 2,227 2,227 2,227
Sources of funds 49,671 44,682 50,622 57,932
Gross Block 49,032 50,090 54,590 59,090
Net Block 33,693 31,766 32,603 33,124
Capital work in progress 2,947 2,448 1,000 1,000
Total Fixed Assets 36,640 34,214 33,603 34,124
Non current investments 2,241 3,045 3,045 3,045
Cash and cash equivalents 13,763 9,532 14,056 20,316
Inventories 7,359 8,441 9,346 10,511
Sundry Debtors 843 991 1,232 1,394
Loans & Advances 2,253 1,820 1,820 1,820
Other Current Assets 43 152 152 152
Total Current Assets (ex cash) 10,498 11,404 12,550 13,878
Trade payable 6,330 7,287 6,405 7,203
Other Current Liabilities & Short 7,141 6,226 6,226 6,226
Total Current Liabilities & 13,472 13,513 12,631 13,430
Net Current Assets (ex cash) (2,974) (2,109) (81) 448
Uses of funds 49,671 44,682 50,622 57,932
Book Value per share (INR) 245.7 294.3 355.9 431.7
Free cash flow (INR mn)
Year to December CY13 CY14 CY15E CY16E
Reported Profit 11,171 11,847 11,632 14,314
Add: Depreciation 3,399 3,457 3,664 3,979
Interest (Net of Tax) 242 95 80 80
Others 605 591 1,540 1,040
Less: Changes in WC 1,872 2,145 3,528 1,530
Operating cash flow 13,546 13,845 13,388 17,884
Less: Capex 4,756 1,058 3,052 4,500
Free Cash Flow 8,790 12,786 10,336 13,384
15 Edelweiss Securities Limited
Nestle Ltd
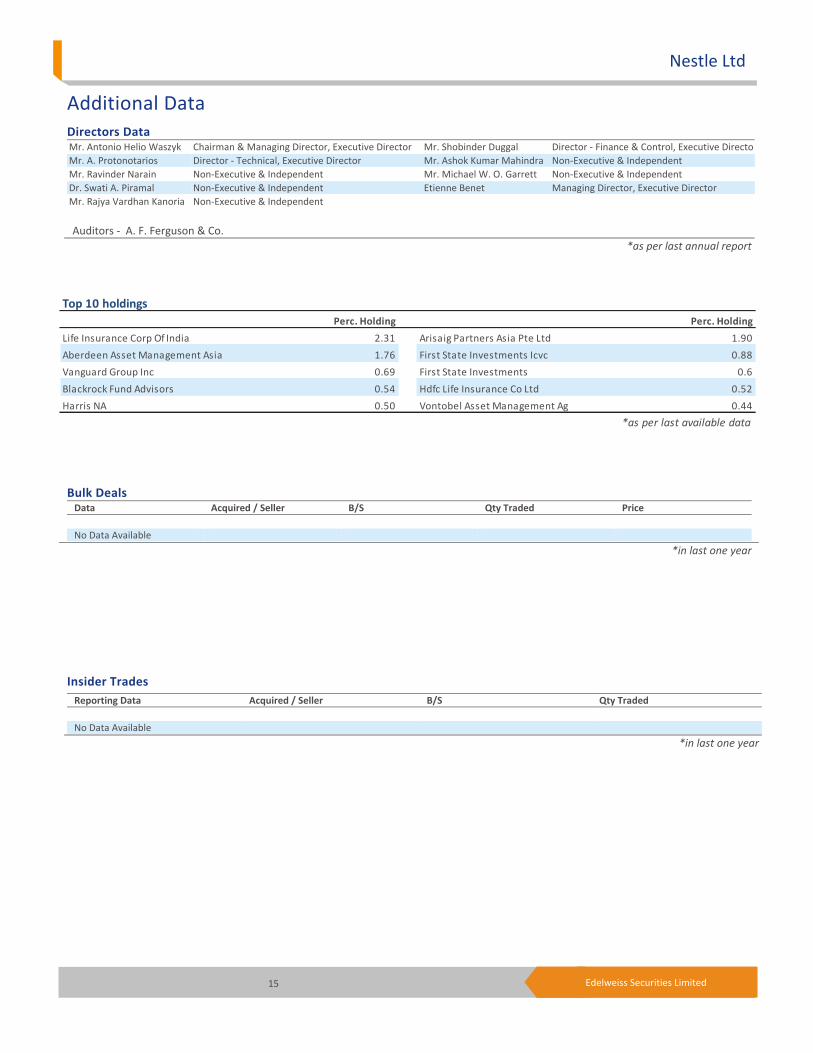
Top 10 holdings
Perc. Holding Perc. Holding
Life Insurance Corp Of India 2.31 Arisaig Partners Asia Pte Ltd 1.90
Aberdeen Asset Management Asia 1.76 First State Investments Icvc 0.88
Vanguard Group Inc 0.69 First State Investments 0.6
Blackrock Fund Advisors 0.54 Hdfc Life Insurance Co Ltd 0.52
Harris NA 0.50 Vontobel Asset Management Ag 0.44
*as per last available data
Insider Trades Reporting Data Acquired / Seller B/S Qty Traded
No Data Available
*in last one year
Bulk Deals Data Acquired / Seller B/S Qty Traded Price
No Data Available
*in last one year
Additional Data
Directors Data Mr. Antonio Helio Waszyk Chairman & Managing Director, Executive Director Mr. Shobinder Duggal Director ‐ Finance & Control, Executive Director
Mr. A. Protonotarios Director ‐ Technical, Executive Director Mr. Ashok Kumar Mahindra Non‐Executive & Independent
Mr. Ravinder Narain Non‐Executive & Independent Mr. Michael W. O. Garrett Non‐Executive & Independent
Dr. Swati A. Piramal Non‐Executive & Independent Etienne Benet Managing Director, Executive Director
Mr. Rajya Vardhan Kanoria Non‐Executive & Independent
Auditors ‐ A. F. Ferguson & Co.
*as per last annual report
16 Edelweiss Securities Limited
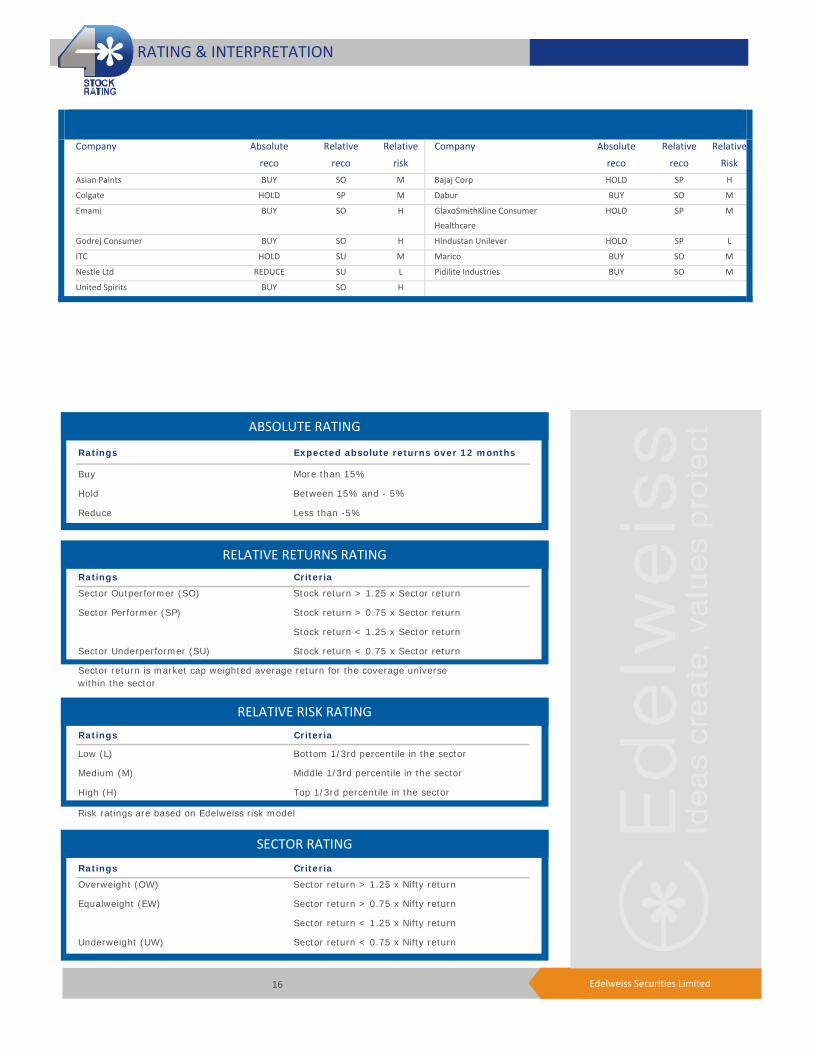
Company Absolute
reco Relative
reco Relative
risk
Company Absolute
reco
Relative
reco
Relative
Risk
Asian Paints BUY SO M Bajaj Corp HOLD SP H
Colgate HOLD SP M Dabur BUY SO M
Emami BUY SO H GlaxoSmithKline Consumer
Healthcare
HOLD SP M
Godrej Consumer BUY SO H Hindustan Unilever HOLD SP L
ITC HOLD SU M Marico BUY SO M
Nestle Ltd REDUCE SU L Pidilite Industries BUY SO M
United Spirits BUY SO H
RATING & INTERPRETATION
ABSOLUTE RATING
Ratings Expected absolute returns over 12 months
Buy More than 15%
Hold Between 15% and - 5%
Reduce Less than -5%
RELATIVE RETURNS RATING
Ratings Criteria
Sector Outperformer (SO) Stock return > 1.25 x Sector return
Sector Performer (SP) Stock return > 0.75 x Sector return
Stock return < 1.25 x Sector return
Sector Underperformer (SU) Stock return < 0.75 x Sector return
Sector return is market cap weighted average return for the coverage universe within the sector
RELATIVE RISK RATING
Ratings Criteria
Low (L) Bottom 1/3rd percentile in the sector
Medium (M) Middle 1/3rd percentile in the sector
High (H) Top 1/3rd percentile in the sector
Risk ratings are based on Edelweiss risk model
SECTOR RATING
Ratings Criteria
Overweight (OW) Sector return > 1.25 x Nifty return
Equalweight (EW) Sector return > 0.75 x Nifty return
Sector return < 1.25 x Nifty return
Underweight (UW) Sector return < 0.75 x Nifty return
17 Edelweiss Securities Limited
Nestle Ltd
Edelweiss Securities Limited, Edelweiss House, off C.S.T. Road, Kalina, Mumbai – 400 098.
Board: (91‐22) 4009 4400, Email: [email protected]
Nirav Sheth
Head Research
Coverage group(s) of stocks by primary analyst(s): Consumer Goods
Asian Paints, Bajaj Corp, Colgate, Dabur, Godrej Consumer , Emami, Hindustan Unilever, ITC, Marico, Nestle Ltd, Pidilite Industries, GlaxoSmithKline Consumer Healthcare, United Spirits
Distribution of Ratings / Market Cap
Edelweiss Research Coverage Universe
Rating Distribution* 155 45 8 208* stocks under review
Market Cap (INR) 151 54 3
Date Company Title Price (INR) Recos
Recent Research
28‐May‐15 Consumer Goods
Staples growth likely bottomed out; Result Review
27‐May‐15 United Spirits
Gross margins cheer, but write offs spoil the party; Result Update
3,501 Buy
22‐May‐15 ITC Volumes skid again; Result Update
329 Hold
> 50bn Between 10bn and 50 bn < 10bn
Buy Hold Reduce Total
Rating Interpretation
Buy appreciate more than 15% over a 12‐month period
Hold appreciate up to 15% over a 12‐month period
Reduce depreciate more than 5% over a 12‐month period
Rating Expected to
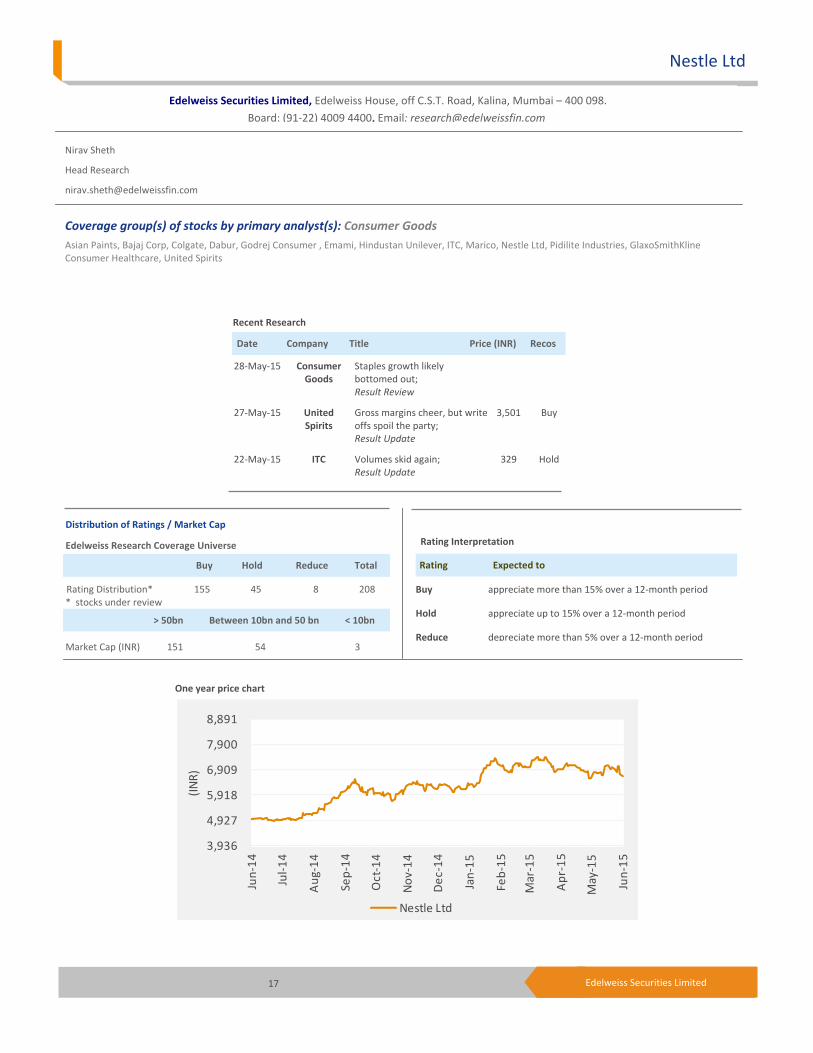
One year price chart
3,936
4,927
5,918
6,909
7,900
8,891
Jun‐14
Jul‐14
Aug‐14
Sep‐14
Oct‐14
Nov‐14
Dec‐14
Jan‐15
Feb‐15
Mar‐15
Apr‐15
May‐15
Jun‐15
(INR)
Nestle Ltd
18 Edelweiss Securities Limited
Consumer Goods
DISCLAIMER
This report has been prepared by Edelweiss Securities Limited (“Edelweiss”) and distributed as per Regulation 22(1) of SEBI (Research Analysts) Regulations 2014 having SEBI Registration No.INH200000121 in the capacity of a Research Analyst. This report does not constitute an offer or solicitation for the purchase or sale of any financial instrument or as an official confirmation of any transaction. The information contained herein is from publicly available data or other sources believed to be reliable. This report is provided for assistance only and is not intended to be and must not alone be taken as the basis for an investment decision. The user assumes the entire risk of any use made of this information. Each recipient of this report should make such investigation as it deems necessary to arrive at an independent evaluation of an investment in the securities of companies referred to in this document (including the merits and risks involved), and should consult his own advisors to determine the merits and risks of such investment. The investment discussed or views expressed may not be suitable for all investors. This information is strictly confidential and is being furnished to you solely for your information. This information should not be reproduced or redistributed or passed on directly or indirectly in any form to any other person or published, copied, in whole or in part, for any purpose. This report is not directed or intended for distribution to, or use by, any person or entity who is a citizen or resident of or located in any locality, state, country or other jurisdiction, where such distribution, publication, availability or use would be contrary to law, regulation or which would subject Edelweiss and affiliates/ group companies to any registration or licensing requirements within such jurisdiction. The distribution of this report in certain jurisdictions may be restricted by law, and persons in whose possession this report comes, should observe, any such restrictions. The information given in this report is as of the date of this report and there can be no assurance that future results or events will be consistent with this information. This information is subject to change without any prior notice. Edelweiss reserves the right to make modifications and alterations to this statement as may be required from time to time. Edelweiss or any of its affiliates/ group companies shall not be in any way responsible for any loss or damage that may arise to any person from any inadvertent error in the information contained in this report. Edelweiss is committed to providing independent and transparent recommendation to its clients. Neither Edelweiss nor any of its affiliates, group companies, directors, employees, agents or representatives shall be liable for any damages whether direct, indirect, special or consequential including loss of revenue or lost profits that may arise from or in connection with the use of the information. Past performance is not necessarily a guide to future performance. The disclosures of interest statements incorporated in this report are provided solely to enhance the transparency and should not be treated as endorsement of the views expressed in the report. The information provided in these reports remains, unless otherwise stated, the copyright of Edelweiss. All layout, design, original artwork, concepts and other Intellectual Properties, remains the property and copyright of Edelweiss and may not be used in any form or for any purpose whatsoever by any party without the express written permission of the copyright holders.
Edelweiss shall not be liable for any delay or any other interruption which may occur in presenting the data due to any reason including network (Internet) reasons or snags in the system, break down of the system or any other equipment, server breakdown, maintenance shutdown, breakdown of communication services or inability of the Edelweiss to present the data. In no event shall the Edelweiss be liable for any damages, including without limitation direct or indirect, special, incidental, or consequential damages, losses or expenses arising in connection with the data presented by the Edelweiss through this report.
Analyst Certification:
The analyst for this report certifies that all of the views expressed in this report accurately reflect his or her personal views about the subject company or companies and its or their securities, and no part of his or her compensation was, is or will be, directly or indirectly related to specific recommendations or views expressed in this report.
Additional Disclaimers
Disclaimer for U.S. Persons
This research report is a product of Edelweiss Securities Limited, which is the employer of the research analyst(s) who has prepared the research report. The research analyst(s) preparing the research report is/are resident outside the United States (U.S.) and are not associated persons of any U.S. regulated broker‐dealer and therefore the analyst(s) is/are not subject to supervision by a U.S. broker‐dealer, and is/are not required to satisfy the regulatory licensing requirements of FINRA or required to otherwise comply with U.S. rules or regulations regarding, among other things, communications with a subject company, public appearances and trading securities held by a research analyst account.
This report is intended for distribution by Edelweiss Securities Limited only to "Major Institutional Investors" as defined by Rule 15a‐6(b)(4) of the U.S. Securities and Exchange Act, 1934 (the Exchange Act) and interpretations thereof by U.S. Securities and Exchange Commission (SEC) in reliance on Rule 15a 6(a)(2). If the recipient of this report is not a Major Institutional Investor as specified above, then it should not act upon this report and return the same to the sender. Further, this report may not be copied, duplicated and/or transmitted onward to any U.S. person, which is not the Major Institutional Investor.
19 Edelweiss Securities Limited
Nestle Ltd
Access the entire repository of Edelweiss Research on www.edelresearch.com
In reliance on the exemption from registration provided by Rule 15a‐6 of the Exchange Act and interpretations thereof by the SEC in order to conduct certain business with Major Institutional Investors, Edelweiss Securities Limited has entered into an agreement with a U.S. registered broker‐dealer, Edelweiss Financial Services Inc. ("EFSI"). Transactions in securities discussed in this research report should be effected through Edelweiss Financial Services Inc. Disclaimer for U.K. Persons
The contents of this research report have not been approved by an authorised person within the meaning of the Financial Services and Markets Act 2000 ("FSMA"). In the United Kingdom, this research report is being distributed only to and is directed only at (a) persons who have professional experience in matters relating to investments falling within Article 19(5) of the FSMA (Financial Promotion) Order 2005 (the “Order”); (b) persons falling within Article 49(2)(a) to (d) of the Order (including high net worth companies and unincorporated associations); and (c) any other persons to whom it may otherwise lawfully be communicated (all such persons together being referred to as “relevant persons”). This research report must not be acted on or relied on by persons who are not relevant persons. Any investment or investment activity to which this research report relates is available only to relevant persons and will be engaged in only with relevant persons. Any person who is not a relevant person should not act or rely on this research report or any of its contents. This research report must not be distributed, published, reproduced or disclosed (in whole or in part) by recipients to any other person. Disclaimer for Canadian Persons
This research report is a product of Edelweiss Securities Limited ("ESL"), which is the employer of the research analysts who have prepared the research report. The research analysts preparing the research report are resident outside the Canada and are not associated persons of any Canadian registered adviser and/or dealer and, therefore, the analysts are not subject to supervision by a Canadian registered adviser and/or dealer, and are not required to satisfy the regulatory licensing requirements of the Ontario Securities Commission, other Canadian provincial securities regulators, the Investment Industry Regulatory Organization of Canada and are not required to otherwise comply with Canadian rules or regulations regarding, among other things, the research analysts' business or relationship with a subject company or trading of securities by a research analyst. This report is intended for distribution by ESL only to "Permitted Clients" (as defined in National Instrument 31‐103 ("NI 31‐103")) who are resident in the Province of Ontario, Canada (an "Ontario Permitted Client"). If the recipient of this report is not an Ontario Permitted Client, as specified above, then the recipient should not act upon this report and should return the report to the sender. Further, this report may not be copied, duplicated and/or transmitted onward to any Canadian person. ESL is relying on an exemption from the adviser and/or dealer registration requirements under NI 31‐103 available to certain international advisers and/or dealers. Please be advised that (i) ESL is not registered in the Province of Ontario to trade in securities nor is it registered in the Province of Ontario to provide advice with respect to securities; (ii) ESL's head office or principal place of business is located in India; (iii) all or substantially all of ESL's assets may be situated outside of Canada; (iv) there may be difficulty enforcing legal rights against ESL because of the above; and (v) the name and address of the ESL's agent for service of process in the Province of Ontario is: Bamac Services Inc., 181 Bay Street, Suite 2100, Toronto, Ontario M5J 2T3 Canada.
Disclosures under the provisions of SEBI (Research Analysts) Regulations 2014 (Regulations)
Edelweiss Securities Limited (“ESL” or “Research Entity”) is regulated by the Securities and Exchange Board of India (“SEBI”) and is licensed to carry on the business of broking, depository services and related activities. The business of ESL and its associates are organized around five broad business groups – Credit including Housing and SME Finance, Commodities, Financial Markets, Asset Management and Life Insurance. There were no instances of non‐compliance by ESL on any matter related to the capital markets, resulting in significant and material disciplinary action during the last three years except that ESL had submitted an offer of settlement with Securities and Exchange commission, USA (SEC) and the same has been accepted by SEC without admitting or denying the findings in relation to their charges of non registration as a broker dealer.
Copyright 2009 Edelweiss Research (Edelweiss Securities Ltd). All rights reserved